INAF-Osservatorio astrofisico di Torino Technical Report nr. 167
|
|
|
- Penelope Cross
- 6 years ago
- Views:
Transcription
1 INAF-Osservatorio astrofisico di Torino Technical Report nr. 167 Simulation of Visible Light and UV images for the METIS coronagraph Alessandro Bemporad Pino Torinese, 9 ottobre 2014
2 Simulation of Visible Light and UV images for the METIS coronagraph A. Bemporad INAF-Osservatorio Astronomico di Torino, via Osservatorio 20, Pino Torinese (TO), Italy; ABSTRACT This report describes step by step how the simulated images of METIS instrument expected on the CCD detector have been constructed. In summary, the images are built for both channels (UV and VL) starting from images of white light corona acquired during total solar eclipses and rescaling those images with HI Lyman- intensities measured by SOHO/UVCS instrument at different heliocentric distances and latitudes and similar measurements provided in the literature for VL intensities. A routine has been written (in IDL language) able to provide UV and VL images for any heliocentric distance of the Solar Orbiter spacecraft and for both the minimum and maximum phases of the solar cycle. Simulated images have then been used to estimate the expected counts number and the exposure times required to have a provided signal to noise ratio on both the UV and VL channels. This report is a revision and extension of work already described in a previous Technical Report (OATo Tech.Rep. 132, ), dealing only with the UV channel. 1
3 Summary 1. SUMMARY OF INPUT INSTRUMENTAL PARAMETERS INPUT IMAGES, INTENSITIES AND SPECTRA BUILDING THE CORONAGRAPHIC IMAGES ESTIMATE OF REQUIRED EXPOSURE TIMES Appendix Index of Figures Figure 1: Estimated effective areas of the VL and UV imaging paths as a function of angular FoV. 3 Figure 2: input total solar eclipse images for the solar minimum (left) and solar maximum (right) conditions Figure 3: example of input Lyman- intensity profiles measured by UVCS (see text) Figure 4: VL intensity profiles for the K-corona at solar maximum (solid black line), K-corona at solar minimum at the equator and at the pole (black dashed lines) and F- corona at the equator and at the pole (red dotted lines) Figure 5: effective area images for the VL (top) and UV (bottom) METIS channels Figure 6: example of successive steps followed to build a VL intensity image; this example refers in particular to a spacecraft heliocentric distance of 0.28 AU Figure 7, top: comparison between intensity values along an equatorial row and a polar column of the 2D simulated images (solid line) and the theoretical curves (dotted lines) for the UV (left) and VL (right) METIS channels at 0.28 AU for solar minimum. Bottom: resulting expected counts along an equatorial row and a polar column of the 2D METIS simulated images for the UV (left) and VL (right) METIS channels Figure 8, top: comparison between intensity values along an equatorial row and a polar column of the 2D simulated images (solid line) and the theoretical curves (dotted lines) for the UV (left) and VL (right) METIS channels at 0.50 AU for solar minimum. Bottom: resulting expected counts along an equatorial row and a polar column of the 2D METIS simulated images for the UV (left) and VL (right) METIS channels Index of Tables Table 1: Effective areas of the VL and UV imaging paths as a function of angular FoV
4 1. SUMMARY OF INPUT INSTRUMENTAL PARAMETERS The METIS simulated images described here have been obtained by assuming directly the instrument effective areas (cm 2 ) provided in a previous document (OATo Tech.Rep. 132, ). These effective areas are provided again below (Figure 1 and Table 1) for the reader convenience: description of reference METIS instrumental parameters are provided in that document and previous documentation. Field of view Vignetting Geometrical Effective areas [cm 2 ] [ ] Fraction Area [cm 2 ] VL UV e e e e e e e e e e e e-01 Table 1: Effective areas of the VL and UV imaging paths as a function of angular FoV Figure 1: Estimated effective areas of the VL and UV imaging paths as a function of angular FoV 3

 acquired in visible light by Dr. M.")
5 2. INPUT IMAGES, INTENSITIES AND SPECTRA The input white light coronagraphic images used in the previous report were composite MarkIV + LASCO C2 + LASCO C3 images. Nevertheless, these composite images have clear discontinuities at the edges of the field of view of each instrument. For this reason, images described here have been obtained starting from eclipse observations of the solar corona: these images have the advantage to have a very broad field of view observed with a single instrument. In particular, input images are total solar eclipse observations (wide field of view) acquired in visible light by Dr. M. Druckmuller in (Figure 2, left) and (Figure 2, right), in order to have an image representative of coronal conditions during the minimum and maximum phases of solar activity, respectively. Figure 2: input total solar eclipse images for the solar minimum (left) and solar maximum (right) conditions. These images have been filtered by the author to enhance the contrast and visibility of faint coronal structures, hence the visibility of such structures in real METIS images will be different. In any case this is not a problem because the aim of METIS simulated images is simply to mimic the general appearance of solar corona and in particular the distribution of large scale structures like coronal streamers. In any case these images have an approximate spatial resolution of about 10.9 /pixel, hence very close to the METIS spatial resolution by 10 /pixel (in the VL channel). As already done in the previous analysis, input UV HI Lyman- intensities (phot cm -2 s -1 sr -1 ) have been assumed from UVCS data observations. In particular, I assumed the integrated line intensity profiles vs. altitude provided in the Counts rate Estimates METIS Instrument Performance document (issue 2, rev.2, 11/12/2007). A power law fitting to the profiles provided in this document (shown in Figure 3) yields the following analytic expressions for the H Lyman- line intensity (phot cm -2 s -1 sr -1 ) as a function of the heliocentric distance h (measured in units of R sun, see Fig. 2) at the equatorial (I eq ) and polar (I po ) regions for the minimum and maximum phases of solar activity cycle:
6 I I eq,min eq,max ( Ly ) ; h h h ( Ly ) ; h h I I po,min po,max ( Ly ) ( Ly ) h h h h Figure 3: example of input Lyman- intensity profiles measured by UVCS (see text). The interplanetary HI Lyman- intensity has been also taken into account and a constant value by I inter = phot cm -2 s -1 sr -1 (Kohl et al. 1997) has been added to all pixels to the above intensities as a simple background. The input VL intensities (phot cm -2 s -1 sr -1 ) have been assumed from Allen (2000), whose intensities provided for the K- and F-corona for maximum and minimum phase of the solar cycle have been fitted with power laws. Resulting curves (shown in Figure 4) are given below in log scale of the intensity: Log( I Log( I Log( I K,max K, eq,min K, po,min ) ; h h ) h h ) h h ; ; Log( I Log( I F, eq F, po ) h h ) h h The above curves have been computed starting form a total visible light brightness of the Sun disk integrated between nm (using values given by Allen 2000, "Astrophysical quantities", p. 354), which is a good approximation for the METIS band-pass interval ( nm). The resulting value for total solar disk brightness used in this work is B sun = phot cm -2 s -1 sr -1. All the above intensities shown in Figure 3 and Figure 4 are also in agreement with those reported in the previous Coronal Radiances and Modelling report (METIS-OACT-TNO-004, issue 2, rev. 0, ). 5
7 Effective area images of the METIS instrument have been built starting from values provided in Table 1 and Figure 1 and by simply assuming symmetry about the optical axis: resulting images for VL (top) and UV (bottom) channels are shown in Figure 5 (units of cm 2 ). Figure 4: VL intensity profiles for the K-corona at solar maximum (solid black line), K-corona at solar minimum at the equator and at the pole (black dashed lines) and F- corona at the equator and at the pole (red dotted lines). 6
 and UV (bottom) METIS channels.")
8 Figure 5: effective area images for the VL (top) and UV (bottom) METIS channels. 7

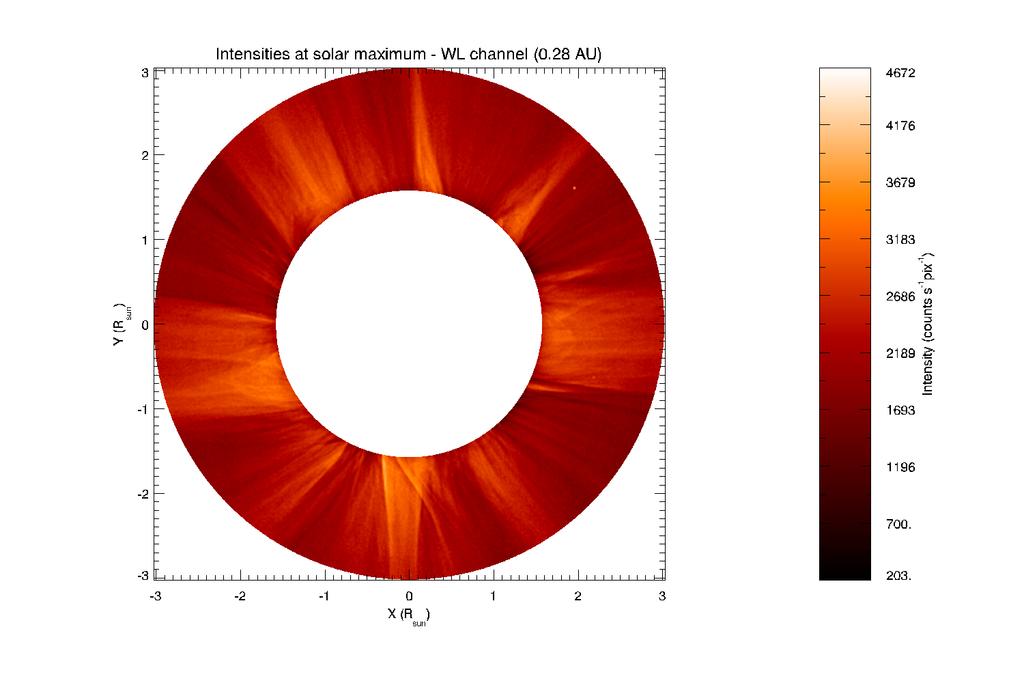
9 Figure 6: example of successive steps followed to build a VL intensity image; this example refers in particular to a spacecraft heliocentric distance of 0.28 AU. 8
10 3. BUILDING THE CORONAGRAPHIC IMAGES The successive steps followed to build UV (HI Lyman- ) and VL ( nm) coronagraphic images are: 1. Convert the white light eclipse image (Figure 2 and Figure 6, top left) to a pix 2 image with the correct METIS spatial resolution (km/pixel) and field of view for the actual heliocentric distance of the Solar Obiter spacecraft; 2. Normalize the white light image to the average radial intensity profile (obtained averaging over 90 radial profiles extracted from the input image, one profile each 4 ); 3. Remove any signal outside the outer and inner edges of the METIS coronagraph field of view (Figure 6, top right); 4. Apply a trigonometric multiplying function f( ) (where is the solar latitude), with 0 f 1, to scale the 2-D normalized image to the UV and VL polar and equatorial intensities (Figure 6, bottom left). 5. Multiply the resulting UV and VL radiance images (phot cm -2 sr -1 s -1 ) by the corresponding effective area image (cm 2 ) and the instrumental spatial scale Ω (sr pix -1 ), to derive the counts image (Figure 6, bottom right), where the instrument spatial scale Ω is given by (10 arcsec) 2 /pixel = (sr/pixel), for the VL imaging path, and (20 arcsec) 2 /pixel = (sr/pixel), for the UV imaging path in analogue mode. An example of VL image (units of counts s -1 pixel -1 ) resulting from the above procedure is shown in Figure 6 (bottom right). A similar image has been obtained with the same procedure described above for the UV channel (see Figures in the Appendix). In particular, in the radiance images the radial intensity profiles extracted above the pole or at the equator coincides with the UVCS intensity profiles at that latitudes for UV with the interplanetary contribution, and with the VL intensity profiles given by Allen (2000) with F-corona contribution, as it is shown in the top plots of Figure 7 and Figure 8 for a spacecraft distance of 0.28 AU and 0.50 AU, respectively. At mid latitudes the intensities are intermediate between polar and equatorial intensities. The resulting 2D image also mimic the presence of coronal structures, even if (as mentioned above) input total solar eclipse images are filtered in order to enhance the visibility of faint coronal structures. Notice that the polar coronal hole intensity in the UV channel observed at 0.50 AU is not in agreement with the theoretical UVCS profile because of the interplanetary contribution (Figure 8, top left panel). Notice also that, because at large heliocentric distances the VL channel is dominated by the F-corona contribution and because its radial profile is much flatter than the K-corona profile, once the radiances are multiplied by the effective areas the resulting curve for the number of counts will have a minimum closer to the lower edge of the image and a maximum close to the outer edge (Figure 8, bottom right panel). 9
11 Figure 7, top: comparison between intensity values along an equatorial row and a polar column of the 2D simulated images (solid line) and the theoretical curves (dotted lines) for the UV (left) and VL (right) METIS channels at 0.28 AU for solar minimum. Bottom: resulting expected counts along an equatorial row and a polar column of the 2D METIS simulated images for the UV (left) and VL (right) METIS channels. Figure 8, top: comparison between intensity values along an equatorial row and a polar column of the 2D simulated images (solid line) and the theoretical curves (dotted lines) for the UV (left) and VL (right) METIS channels at 0.50 AU for solar minimum. Bottom: resulting expected counts along an equatorial row and a polar column of the 2D METIS simulated images for the UV (left) and VL (right) METIS channels. 10
12 4. ESTIMATE OF REQUIRED EXPOSURE TIMES The resulting images are in units of counts s -1 pix -1 ; these images can then be used to estimate the exposure times t exp required to have a fixed S/N (signal-to-noise) ratio it is possible to derive at each altitude. Required exposure times have been computed by assuming that the noise N is due only to the Poissonian statistic, i.e. N = S 1/2 ; hence S/N = 10 implies S = 100 counts. Given a fixed S/N ratio and a number of expected counts C line (counts/s), the exposure time t exp (s) required to have this S/N ratio for a single pixel is simply t exp = (S/N) 2 / C line. Resulting exposure times computed for S/N = 10 when the spacecraft will be at a distance of 0.28 AU and 0.50 AU are provided in the Appendix for both channels at minimum and maximum of the solar activity cycle. In particular, images in the Appendix are provided with the following order 1. Intensity (counts) images at 0.28 AU: a. VL channel, solar minimum; b. UV channel, solar minimum; c. VL channel, solar maximum; d. UV channel, solar maximum; 2. Intensity (counts) images at 0.50 AU: a. VL channel, solar minimum; b. UV channel, solar minimum; c. VL channel, solar maximum; d. UV channel, solar maximum; 3. Exposure times (seconds) images at 0.28 AU: a. VL channel, solar minimum; b. UV channel, solar minimum; c. VL channel, solar maximum; d. UV channel, solar maximum; 4. Exposure times (seconds) images at 0.50 AU: a. VL channel, solar minimum; b. UV channel, solar minimum; c. VL channel, solar maximum; d. UV channel, solar maximum; These images show mainly what follows: 1. At 0.28 AU exposure times longer than ~0.2 s and ~ 300 s will be required for solar minimum in order to have a good S/N ratio in polar coronal holes in the VL and UV channels, respectively; during solar maximum these times will relax down to ~0.1 s and ~5 s; 2. At 0.50 AU exposure times longer than ~3 s and ~3000 s will be required for solar minimum in order to have a good S/N ratio in polar coronal holes in the VL and UV channels, respectively; during solar maximum these times will relax down to ~1.5 s and ~80 s; 3. Closer to the Sun the most critical part for S/N ratio of the UV and VL images corresponds to the outer coronal region in the instrument field of view; on the contrary, farther form the Sun the coronal intensity profiles become flatter and the situation reverses, with the most critical part located in the inner section of the image. Please notice that the above exposure times have been computed by neglecting any other possible source of noise (like read-out noise, dark current) or image contamination (stray light), and only Poissonian noise has been considered. For this reason, the above exposure times have to be considered as lower limits to the real required exposure times. Color scales in the intensity images have been adjusted to the maximum value of the whole array, while color scales in the exposure time images are kept constant in order to facilitate the comparison between different phases of solar cycle and different spacecraft distances. 11
13 Appendix 12
14 13
15 14
16 15
17 16
18 17
19 18
20 19
METIS- ESA Solar Orbiter Mission: internal straylight analysis
 METIS- ESA Solar Orbiter Mission: internal straylight analysis E. Verroi, V. Da Deppo, G. Naletto, S. Fineschi, E. Antonucci University of Padova (Italy) CNR-Institute for Photonics and Nanotechnologies
COST Short Term Scientific Missions Report 24 November 2014
 COST Short Term Scientific Missions Report 24 November 2014 STSM Guest: Gerardo Capobianco (capobianco@oato.inaf.it), Alessandro Bemporad (bemporad@oato.inaf.it) Home Institution: INAF Osservatorio Astrofisico
Post CME events: cool jets and current sheet evolution
 Proceedings Coronal and Stellar Mass Ejections Proceedings IAU Symposium No. 226, 2004 A.C. Editor, B.D. Editor & C.E. Editor, eds. c 2004 International Astronomical Union DOI: 00.0000/X000000000000000X
ASPIICS: a Giant Solar Coronagraph onboard the PROBA-3 Mission
 SOLI INVICTO ASPIICS: a Giant Solar Coronagraph onboard the PROBA-3 Mission Andrei Zhukov Principal Investigator of PROBA-3/ASPIICS Solar-Terrestrial Centre of Excellence SIDC, Royal Observatory of Belgium
arxiv: v1 [astro-ph.sr] 21 Aug 2015
![arxiv: v1 [astro-ph.sr] 21 Aug 2015](/thumbs/87/97102184.jpg "arxiv: v1 [astro-ph.sr] 21 Aug 2015") Astronomy & Astrophysics manuscript no. aa25462 c ESO 2018 September 12, 2018 Future capabilities of CME polarimetric 3D reconstructions with the METIS instrument: A numerical test. P. Pagano 1, A. Bemporad
Astronomy & Astrophysics manuscript no. aa25462 c ESO 2018 September 12, 2018 Future capabilities of CME polarimetric 3D reconstructions with the METIS instrument: A numerical test. P. Pagano 1, A. Bemporad
Instrumentation, Observations and Data Analysis
 Chapter 3 Instrumentation, Observations and Data Analysis 3.1 Introduction The UVCS instrument was introduced briefly in chapter 1. Section 3.2 of this chapter describes the UVCS instrument in more detail.
IMAGING THE EUV CORONA EXTREME ULTRAVIOLET IMAGER WITH THE PRECURSOR OBSERVATIONS FROM THE HECOR SOUNDING ROCKET EXPERIMENT
 IMAGING THE EUV CORONA WITH THE EXTREME ULTRAVIOLET IMAGER PRECURSOR OBSERVATIONS FROM THE HECOR SOUNDING ROCKET EXPERIMENT Frédéric Auchère, for the EUI consortium 2 nd METIS science & technical meeting
Federico Landini. INAF Osservatorio Astrofisico di Arcetri
 Federico Landini INAF Osservatorio Astrofisico di Arcetri Outline METIS and its occulting system Theoretical estimate of the diffraction pattern on the primary mirror plane Occulter optimization concept
An erupting filament and associated CME observed by Hinode, STEREO, and SOHO
 An erupting filament and associated CME observed by Hinode, STEREO, and SOHO A. Bemporad 1, G. DelZanna 2, V. Andretta 3, M. Magri 3, G. Poletto 4, Y.-K. Ko 5 1 INAF-Osservatorio Astronomico di Torino
POLITECNICO DI TORINO Repository ISTITUZIONALE
 POLITECNICO DI TORINO Repository ISTITUZIONALE METIS: the visible and UV coronagraph for Solar Orbiter Original METIS: the visible and UV coronagraph for Solar Orbiter / M. Romoli; F. Landini; E. Antonucci;
MESSI, the METIS instrument Software Simulator
 MESSI, the METIS instrument Software Simulator G. Nicolini a and V. Andretta b, L. Abbo a, E. Antonucci a, A. Bemporad a, G. Capobianco a, G. Crescenzio a, S. Fineschi a, M. Focardi c, E. Magli d, G. Naletto
arxiv: v1 [astro-ph.sr] 6 Jul 2012
![arxiv: v1 [astro-ph.sr] 6 Jul 2012](/thumbs/95/123055077.jpg "arxiv: v1 [astro-ph.sr] 6 Jul 2012") A Decade of Coronagraphic and Spectroscopic Studies of CME-Driven Shocks Angelos Vourlidas and Alessandro Bemporad arxiv:1207.1603v1 [astro-ph.sr] 6 Jul 2012 Space Sciences Division, Naval Research Laboratory,
A Decade of Coronagraphic and Spectroscopic Studies of CME-Driven Shocks Angelos Vourlidas and Alessandro Bemporad arxiv:1207.1603v1 [astro-ph.sr] 6 Jul 2012 Space Sciences Division, Naval Research Laboratory,
ZOOMING IN ON THE CORONAL POLES WITH SOLAR ORBITER
 ZOOMING IN ON THE CORONAL POLES WITH SOLAR ORBITER DAVID BERGHMANS 1, DAN SEATON 2,3, MATTHEW WEST 1 ON BEHALF OF THE EUI TEAM POLAR PERSPECTIVES MEETING, HAO, BOULDER, COLORADO SEPTEMBER 2018 1ROYAL OBSERVATORY
COST Short Term Scientific Missions Report 15 December 2013
 STSM Guest: Gererdo Capobianco COST Short Term Scientific Missions Report 15 December 2013 Home Institution: INAF Osservatorio Astrofisico di Torino (OATo), Italy Host Institution: Astronomical Institute
1 A= one Angstrom = 1 10 cm
 Our Star : The Sun )Chapter 10) The sun is hot fireball of gas. We observe its outer surface called the photosphere: We determine the temperature of the photosphere by measuring its spectrum: The peak
1. INTRODUCTION 2. THE DATA
 THE ASTROPHYSICAL JOURNAL, 513:961È968, 1999 March 10 ( 1999. The American Astronomical Society. All rights reserved. Printed in U.S.A. EXTENSION OF THE POLAR CORONAL HOLE BOUNDARY INTO INTERPLANETARY
Outline. Theoretical estimate of the diffraction pattern on the primary mirror plane
 a b d e c Outline Solar Orbiter and METIS - METIS optical design - METIS Inverted Occulter Theoretical estimate of the diffraction pattern on the primary mirror plane Occulter optimization concept The
Goddard Space Flight Center
 1 Solar Coronagraphs Observe off-disk coronal emissions from Sun. Dominant noise source: Diffraction of on-disk light around the occulter Vignetting on externally occulted coronagraphs Noise inversely
Diffraction model for the external occulter of the solar coronagraph ASPIICS
 Diffraction model for the external occulter of the solar coronagraph ASPIICS Raphaël Rougeot OCA, Nice 14/05/2018 14/05/2018 R.Rougeot 1 Outline 1) Proba-3 mission and ASPIICS 2) Diffraction from external
Observations of the White Light Corona from Solar Orbiter and Solar Probe Plus
 Observations of the White Light Corona from Solar Orbiter and Solar Probe Plus RA Howard 1, AF Thernisien 2, A Vourlidas 1, SP Plunkett 1, CM Korendyke 1, NR Sheeley 1, JS Morrill 1, DG Socker 1, MG Linton
Gravitation astrometric tests in the Solar System with JWST
 Gravitation astrometric tests in the Solar System with JWST M. Gai (1), A. Fienga (2), A. Vecchiato (1) (1) Ist. Naz. di Astrofisica Oss. Astr. di Torino V. Osservatorio, 20 - I-10025 Pino Torinese (TO)
Diffraction modelling for solar coronagraphy
 Diffraction modelling for solar coronagraphy Application to ASPIICS Raphaël Rougeot Laboratoire Lagrange, Nice 12/02/2018 12/02/2018 R.Rougeot 1 Outline 1) Proba-3 mission and ASPIICS 2) Diffraction from
Gordon Petrie NSO, Boulder, Colorado, USA
 On the enhanced coronal mass ejection detection rate since the solar cycle 3 polar field reversal ApJ 81, 74 Gordon Petrie NSO, Boulder, Colorado, USA .5 >..5 I- I I I I I I i 4 6 8 I 1 14 16 AVERAGE MONTHLY
Lecture 5 The Formation and Evolution of CIRS
 Lecture 5 The Formation and Evolution of CIRS Fast and Slow Solar Wind Fast solar wind (>600 km/s) is known to come from large coronal holes which have open magnetic field structure. The origin of slow
METIS, THE MULTI ELEMENT TELESCOPE FOR IMAGING AND SPECTROSCOPY FOR THE SOLAR ORBITER MISSION
 METIS, THE MULTI ELEMENT TELESCOPE FOR IMAGING AND SPECTROSCOPY FOR THE SOLAR ORBITER MISSION G. Naletto*,1,2, E. Antonucci 3, V. Andretta 4, E. Battistelli 5, S. Cesare 6, V. Da Deppo 2, F. d Angelo 6,
Science with EPICS, the E-ELT planet finder
 The Astrophysics of Planetary Systems: Formation, Structure, and Dynamical Evolution Proceedings IAU Symposium No. 276, 2010 c International Astronomical Union 2011 A. Sozzetti, M. G. Lattanzi & A. P.
Pointing and Orbit Data for the SEP Instruments on the STEREO Spacecraft 2013/06/06 Andrew Davis
 Pointing and Orbit Data for the SEP Instruments on the STEREO Spacecraft 213/6/6 Andrew Davis This document provides information about orientation of the LET instrument on the STEREO Ahead and Behind spacecraft,
Next Generation UV Coronagraph Instrumentation for Solar Cycle-24
 J. Astrophys. Astr. (2008) 29, 321 327 Next Generation UV Coronagraph Instrumentation for Solar Cycle-24 John L. Kohl 1,, Rajmal Jain 2, Steven R. Cranmer 1, Larry D. Gardner 1, Anil K. Pradhan 3, John
Comets observed with XMM-Newton
 A major step in cometary X-ray research Konrad Dennerl Max-Planck-Institut für extraterrestrische Physik Comets the most surprising X-ray objects in space 1996: Comet Hyakutake (C/1996 B2) EPIC Consortium
Why Go To Space? Leon Golub, SAO BACC, 27 March 2006
 Why Go To Space? Leon Golub, SAO BACC, 27 March 2006 Solar Observation Observation of the Sun has a long and distinguished history Especially important as calendar where e.g. seasonal monsoons produced
MHD simulation of solar wind using solar photospheric magnetic field data
 6-16P, LWS workshop 2004 March, Boulder MHD simulation of solar wind using solar photospheric magnetic field data Keiji Hayashi (Stanford University) keiji@quake.stanford.edu Introduction Time-dependent
Remember: how to measure the solar wind. Two types of solar wind: evidence from Helios. Two different types of solar wind!
 Remember: how to measure the solar wind The principle of electrostatic analyzers Spherical deflection plates with an applied voltage let charged particles pass if their energy/charge fits. E/q = m/2 *
Classification of Coronal Mass Ejections and Image Processing Techniques
 Classification of Coronal Mass Ejections and Image Processing Techniques Chris Lowder Institute for Astronomy, University of Hawai i at Manoa Advisor : Dr. Shadia Habbal Department of Physics, Georgia
ILWS Italian SpaceAgency (ASI) Contribution
 Contribution") ILWS Italian SpaceAgency (ASI) Contribution Ester Antonucci Nice April 14-15 2003 ILWS Italian SpaceAgency (ASI) Contribution LWS NASA ESA SPECTRE SolarDynamicsObservatory HERSCHEL Solar Orbiter Bepi Colombo
ILWS Italian SpaceAgency (ASI) Contribution Ester Antonucci Nice April 14-15 2003 ILWS Italian SpaceAgency (ASI) Contribution LWS NASA ESA SPECTRE SolarDynamicsObservatory HERSCHEL Solar Orbiter Bepi Colombo
pre Proposal in response to the 2010 call for a medium-size mission opportunity in ESA s science programme for a launch in 2022.
 Solar magnetism explorer (SolmeX) Exploring the magnetic field in the upper atmosphere of our closest star preprint at arxiv 1108.5304 (Exp.Astron.) or search for solmex in ADS Hardi Peter & SolmeX team
ASTRONOMY AND ASTROPHYSICS. Characteristics of solar coronal streamers
 Astron. Astrophys. 363, 800 814 (2000) Characteristics of solar coronal streamers Element abundance, temperature and density from coordinated CDS and UVCS SOHO observations ASTRONOMY AND ASTROPHYSICS S.
Low-latitude solar wind during the Fall 1998 SOHO-Ulysses quadrature
 JOURNAL OF GEOPHYSICAL RESEARCH, VOL. 107, NO. A10, 1300, doi:10.1029/2001ja000275, 2002 Low-latitude solar wind during the Fall 1998 SOHO-Ulysses quadrature G. Poletto, 1 S. T. Suess, 2 D. A. Biesecker,
Abstract HISAKI (SPRINT A) satellite is an earth orbiting EUV spectroscopic mission and launched on 14 Sep Extreme ultraviolet spectroscope (EX
 satellite is an earth orbiting EUV spectroscopic mission and launched on 14 Sep Extreme ultraviolet spectroscope (EX") Pointing control of extreme ultraviolet spectroscope onboard the SPRINT A satellite F. Tsuchiya(1*), A. Yamazaki(2), G. Murakami(2), K. Yoshioka(2), T. Kimura(2), S. Sakai(2), K. Uemizu(3), T. Sakanoi(1),
Pointing control of extreme ultraviolet spectroscope onboard the SPRINT A satellite F. Tsuchiya(1*), A. Yamazaki(2), G. Murakami(2), K. Yoshioka(2), T. Kimura(2), S. Sakai(2), K. Uemizu(3), T. Sakanoi(1),
Explain how Earth's movement and the moon's orbit cause the phases of the moon. Explain the difference between a solar eclipse and a lunar eclipse.
 Explain how Earth's movement and the moon's orbit cause the phases of the moon. Explain the difference between a solar eclipse and a lunar eclipse. The Earth- Moon System Have you ever wondered why the
INAF-Osservatorio astronomico di Torino Technical Report nr.156
 INAF-Osservatorio astronomico di Torino Technical Report nr.156 ISAS Optical Design Report Alberto Riva; Mario Gai; Alberto Vecchiato Pino Torinese, 26 marzo 2012 ISAS Optical Design Report Alberto Riva
Empirical Testing of Solar Coronal and Solar Wind Models
 Empirical Testing of Solar Coronal and Solar Wind Models Lauren Woolsey University of Maryland - College Park (2011) Mentor: Dr. Leonard Strachan Introduction What is the Solar Wind? * Outflow of particles
Calibration Goals and Plans
 CHAPTER 13 Calibration Goals and Plans In This Chapter... Expected Calibration Accuracies / 195 Calibration Plans / 197 This chapter describes the expected accuracies which should be reached in the calibration
Low latitude solar wind during the Fall 1998 SOHO Ulysses quadrature
 1 Low latitude solar wind during the Fall 1998 SOHO Ulysses quadrature G. Poletto, 1 S. T. Suess, 2 D. A. Biesecker, 3 R. Esser, 4 G. Gloeckler, 5 Y.-K. Ko, 4 and T. H. Zurbuchen 6 Short title: 2 Abstract.
SERENA Meeting. Visby Interplanetary Space Physics Institute (IFSI) Roma, Italy
 Roma, Italy") SERENA Meeting Visby 2010 Na EXOSPHERE GROUND--BASED GROUND OBSERVATIONS: past and future Valeria Mangano Interplanetary Space Physics Institute (IFSI) Roma, Italy Outline Italian campaign at TNG in 2002-2009
SERENA Meeting Visby 2010 Na EXOSPHERE GROUND--BASED GROUND OBSERVATIONS: past and future Valeria Mangano Interplanetary Space Physics Institute (IFSI) Roma, Italy Outline Italian campaign at TNG in 2002-2009
providing 100-m per pixel resolution in nine ~1.0 µm wide infrared bands centered from
 Supporting Text The THEMS instrument consists of separate infrared and visible imagers providing 100-m per pixel resolution in nine ~1.0 µm wide infrared bands centered from 6.78 to 14.88 µm, and 18-m
Using This Flip Chart
 Using This Flip Chart Sunspots are the first indicators that a storm from the Sun is a possibility. However, not all sunspots cause problems for Earth. By following the steps in this flip chart you will
Scattered Light from the Earth Limb Measured with the STIS CCD
 Instrument Science Report STIS 98 21 Scattered Light from the Earth Limb Measured with the STIS CCD Dick Shaw, Merle Reinhart, and Jennifer Wilson 17 June 1998 ABSTRACT We describe a recent program to
The Sun s Dynamic Atmosphere
 Lecture 16 The Sun s Dynamic Atmosphere Jiong Qiu, MSU Physics Department Guiding Questions 1. What is the temperature and density structure of the Sun s atmosphere? Does the atmosphere cool off farther
Extended X- ray emission from PSR B /LS 2883 and other gamma- ray binaries
 Extended X- ray emission from PSR B1259-63/LS 2883 and other gamma- ray binaries George Pavlov (Pennsylvania State University) Oleg Kargaltsev (George Washington University) Martin Durant (University of
HELCATS: HELIOSPHERIC CATALOGUING, ANALYSIS AND TECHNIQUE SERVICE. Work Package 2
 HELCATS: HELIOSPHERIC CATALOGUING, ANALYSIS AND TECHNIQUE SERVICE Work Package 2 Work Package 2 Producing a definitive catalogue of CMEs imaged by STEREO/HI WP2: This WP provides the foundation for this
The Depiction of Coronal Structure in White Light Images
 The Depiction of Coronal Structure in White Light Images Huw Morgan, Shadia Rifai Habbal Institute for Astronomy, University of Hawaii, 2680 Woodlawn Drive, Honolulu, HI 96822, USA and Richard Woo Jet
SBC FLATS: PRISM P-FLATS and IMAGING L-FLATS
 Instrument Science Report ACS 2006-08 SBC FLATS: PRISM P-FLATS and IMAGING L-FLATS R. C. Bohlin & J. Mack December 2006 ABSTRACT The internal deuterium lamp was used to illuminate the SBC detector through
Lab #2: Activity 5 Exploring the Structure of the Solar Magnetic Field Using the MAS Model
 Lab #2: Activity 5 Exploring the Structure of the Solar Magnetic Field Using the MAS Model In this lab activity we will use results from the MAS (Magnetohydrodynamics Around a Sphere) model of the solar
White Light Inter-calibrations of UVCS, LASCO-C2 and Spartan 201/WLC
 16 White Light Inter-calibrations of UVCS, LASCO-C2 and Spartan 201/WLC RICHARD A. FRAZIN Harvard-Smithsonian Center for Astrophysics, Cambridge, MA, USA MARCO ROMOLI Dip. di Astronomia e Scienza dello
SPITZER SPACE TELESCOPE
 SPITZER SPACE TELESCOPE The Rationale for Infrared Astronomy reveal cool states of matter explore the hidden Universe provide access to many spectral features probe the early life of the cosmos WANT TO
Photometric Studies of GEO Debris
 Photometric Studies of GEO Debris Patrick Seitzer Department of Astronomy, University of Michigan 500 Church St. 818 Dennison Bldg, Ann Arbor, MI 48109 pseitzer@umich.edu Heather M. Cowardin ESCG/Jacobs
O 5+ at a heliocentric distance of about 2.5 R.
 EFFECT OF THE LINE-OF-SIGHT INTEGRATION ON THE PROFILES OF CORONAL LINES N.-E. Raouafi and S. K. Solanki Max-Planck-Institut für Aeronomie, 37191 Katlenburg-Lindau, Germany E-mail: Raouafi@linmpi.mpg.de;
Introduction to SDSS -instruments, survey strategy, etc
 Introduction to SDSS -instruments, survey strategy, etc (materials from http://www.sdss.org/) Shan Huang 17 February 2010 Survey type Status Imaging and Spectroscopy Basic Facts SDSS-II completed, SDSS-III
Proba-3 mission and the ASPIICS coronagraph
 Proba-3 mission and the ASPIICS coronagraph Marek Stęślicki 1 and the Proba-3 SWT 1 Space Research Centre Polish Academy of Sciences General objectives The Proba-3 project aims: To develop and demonstrate
HERSCHEL/UVCI ALIGNMENT PLAN
 DIPARTIMENTO DI ASTRONOMIA E SCIENZA DELLO SPAZIO HERSCHEL/UVCI ALIGNMENT PLAN M. Romoli (a), G. Corti (a), F. Landini (a) (a) Dipartimento di Astronomia e Scienza dello Spazio, Università di Firenze (Italy)
The importance of ground-based observations of the solar corona
 The importance of ground-based observations of the solar corona J. Burkepile 1, S. Tomczyk 1, P. Nelson 1, A.G. dewijn 1, S. Sewell 1, D. Elmore 2, L. Sutherland 1, R. Summers 1, D. Kolinski 1, L. Sitongia
Solar Energetic Particles measured by AMS-02
 Solar Energetic Particles measured by AMS-02 Physics and Astronomy Department, University of Hawaii at Manoa, 96822, HI, US E-mail: bindi@hawaii.edu AMS-02 collaboration The Alpha Magnetic Spectrometer
Acceleration of the Solar Wind
 From Sun to Mud: Solar and Space Physics for the UG Classroom Acceleration of the Andrew Jordan All images from SOHO spacecraft This presentation helps introductory physics students apply their skills
4U E. Bozzo. M. Falanga, A. Papitto, L. Stella, R. Perna, D. Lazzati G. Israel, S. Campana, V. Mangano, T. Di Salvo, L.
 X-Ray Eclipse Time Delays in 4U2129+47 E. Bozzo M. Falanga, A. Papitto, L. Stella, R. Perna, D. Lazzati G. Israel, S. Campana, V. Mangano, T. Di Salvo, L. Burderi Università di Roma Tor Vergata, Italy
Lecture 29. Our Galaxy: "Milky Way"
 Lecture 29 The Milky Way Galaxy Disk, Bulge, Halo Rotation Curve Galactic Center Apr 3, 2006 Astro 100 Lecture 29 1 Our Galaxy: "Milky Way" Milky, diffuse band of light around sky known to ancients. Galileo
Earth Flats. 1. Introduction. Instrument Science Report ACS R. C. Bohlin, J. Mack, G. Hartig, & M. Sirianni October 25, 2005
 Instrument Science Report ACS 2005-12 Earth Flats R. C. Bohlin, J. Mack, G. Hartig, & M. Sirianni October 25, 2005 ABSTRACT Since the last ISR 2003-02 on the use of Earth observations for a source of flat
USAAAO Round 2 Qualification Exam 2016
 USAAAO Round 2 Qualification Exam 2016 Instructions (Read completely before you begin) This is the second round qualification test for the USAAAO team. The test is short answer, consisting of 12 short
Summer School Lab Activities
 Summer School Lab Activities Lab #5: Predicting and Modeling the Arrival of the May 12 th 1997 CME In this lab we will use remote observations of the May 12, 1997 solar flare and halo CME made at and near
The Excitation Mechanism of [Fe XIV] 5303 Å Line in the Inner Regions of Solar Corona
![The Excitation Mechanism of [Fe XIV] 5303 Å Line in the Inner Regions of Solar Corona](/thumbs/79/78921857.jpg "The Excitation Mechanism of [Fe XIV] 5303 Å Line in the Inner Regions of Solar Corona") J. Astrophys. Astr. (1991) 12, 311 317 The Excitation Mechanism of [Fe XIV] 5303 Å Line in the Inner Regions of Solar Corona Κ. P.Raju, J. Ν. Desai, Τ. Chandrasekhar & Ν. Μ. Ashok Physical Research Laboratory,
J. Astrophys. Astr. (1991) 12, 311 317 The Excitation Mechanism of [Fe XIV] 5303 Å Line in the Inner Regions of Solar Corona Κ. P.Raju, J. Ν. Desai, Τ. Chandrasekhar & Ν. Μ. Ashok Physical Research Laboratory,
Figure Grayscale images of IC 418. The gray levels have been selected in each image to show the nebular structure, saturating the central star.
 313 Figure 2.21. Grayscale images of IC 418. The gray levels have been selected in each image to show the nebular structure, saturating the central star. 2.21a. IC 418 J grayscale image. The main lobe
1. INTRODUCTION. Received 2002 January 4; accepted 2002 April Osservatorio Astronomico di Palermo G. S.
 The Astrophysical Journal, 575:1116 1130, 2002 August 20 # 2002. The American Astronomical Society. All rights reserved. Printed in U.S.A. ELEMENTAL ABUNDANCES AND POST CORONAL MASS EJECTION CURRENT SHEET
Mid-Infrared Astronomy with IRAIT at Dome C: performances and simulations
 Mem. S.A.It. Suppl. Vol. 2, 125 c SAIt 2003 Memorie della Supplementi Mid-Infrared Astronomy with IRAIT at Dome C: performances and simulations M. Fiorucci 1,3, P. Persi 2, M. Busso 1, S. Ciprini 1,3,
THE MOON. G. Iafrate (a), M. Ramella (a) e V. Bologna (b) (a) INAF - Osservatorio Astronomico di Trieste (b)
, M. Ramella (a) e V. Bologna (b) (a) INAF - Osservatorio Astronomico di Trieste (b)") THE MOON G. Iafrate (a), M. Ramella (a) e V. Bologna (b) (a) INAF - Osservatorio Astronomico di Trieste (b) Istituto Comprensivo S. Giovanni Sc. Sec. di primo grado M. Codermatz" - Trieste Information
THE MOON G. Iafrate (a), M. Ramella (a) e V. Bologna (b) (a) INAF - Osservatorio Astronomico di Trieste (b) Istituto Comprensivo S. Giovanni Sc. Sec. di primo grado M. Codermatz" - Trieste Information
OPTICAL PHOTOMETRY. Observational Astronomy (2011) 1
 1") OPTICAL PHOTOMETRY Observational Astronomy (2011) 1 The optical photons coming from an astronomical object (star, galaxy, quasar, etc) can be registered in the pixels of a frame (or image). Using a ground-based
OPTICAL PHOTOMETRY Observational Astronomy (2011) 1 The optical photons coming from an astronomical object (star, galaxy, quasar, etc) can be registered in the pixels of a frame (or image). Using a ground-based
An Erupting Filament and Associated CME Observed by Hinode, STEREO and SOHO
 **FULL TITLE** ASP Conference Series, Vol. **VOLUME**, **YEAR OF PUBLICATION** **NAMES OF EDITORS** An Erupting Filament and Associated CME Observed by Hinode, STEREO and SOHO A. Bemporad INAF-Torino Astronomical
The Magnetic Field at the Inner Boundary of the Heliosphere Around Solar Minimum
 The Magnetic Field at the Inner Boundary of the Heliosphere Around Solar Minimum X. P. Zhao and J. T. Hoeksema W. W. Hansen Experimental Physics Laboratory, Stanford University, Stanford, CA 94305-4085
Lecture #15: Plan. Telescopes (cont d) Effects of Earth s Atmosphere Extrasolar planets = Exoplanets
 Effects of Earth s Atmosphere Extrasolar planets = Exoplanets") Lecture #15: Plan Telescopes (cont d) Effects of Earth s Atmosphere Extrasolar planets = Exoplanets Resolving Power (review) The bigger the size of the telescope, the better it is at discerning fine details
Lecture #15: Plan Telescopes (cont d) Effects of Earth s Atmosphere Extrasolar planets = Exoplanets Resolving Power (review) The bigger the size of the telescope, the better it is at discerning fine details
Astronomy 122 Outline
 Astronomy 122 Outline This Class (Lecture 12): Stars Next Class: The Nature of Stars Homework #5 is posted. Nightlabs have started! Stellar properties Parallax (distance) Colors Spectral Classes Music:
The Sun. Never look directly at the Sun, especially NOT through an unfiltered telescope!!
 The Sun Introduction We will meet in class for a brief discussion and review of background material. We will then go outside for approximately 1 hour of telescope observing. The telescopes will already
TWO APPLICATIONS OF IMPROVEMENTS FOR AMVS OF NSMC/CMA
 TWO APPLICATIONS OF IMPROVEMENTS FOR AMVS OF NSMC/CMA RE-NAVIGATION BASED ON FULL EARTH DISC IMAGE & CALCULATION OF RADIATION TRANSFER USING NWP DATA Zhang Xiaohu, Xu Jianmin National Satellite Meteorological
1. INTRODUCTION. Received 2002 January 31; accepted 2002 July 1
 The Astrophysical Journal, 578:979 995, 2002 October 20 # 2002. The American Astronomical Society. All rights reserved. Printed in U.S.A. SOLAR AND HELIOSPHERIC OBSERVATORY ULTRAVIOLET CORONAGRAPH SPECTROMETER
Lecture 12: Distances to stars. Astronomy 111
 Lecture 12: Distances to stars Astronomy 111 Why are distances important? Distances are necessary for estimating: Total energy released by an object (Luminosity) Masses of objects from orbital motions
AST 2010: Descriptive Astronomy EXAM 2 March 3, 2014
 AST 2010: Descriptive Astronomy EXAM 2 March 3, 2014 DO NOT open the exam until instructed to. Please read through the instructions below and fill out your details on the Scantron form. Instructions 1.
In this Letter, we develop a self-consistent picture of the time-averaged structure and composition of polar coronal holes L127 1.
 The Astrophysical Journal, 51:L127 L131, 1998 July 1 1998. The American Astronomical Society. All rights reserved. Printed in U.S.A. UVCS/SOHO EMPIRICAL DETERMINATIONS OF ANISOTROPIC VELOCITY DISTRIBUTIONS
Space Surveillance using Star Trackers. Part I: Simulations
 AAS 06-231 Space Surveillance using Star Trackers. Part I: Simulations Iohan Ettouati, Daniele Mortari, and Thomas Pollock Texas A&M University, College Station, Texas 77843-3141 Abstract This paper presents
Infrared Earth Horizon Sensors for CubeSat Attitude Determination
 Infrared Earth Horizon Sensors for CubeSat Attitude Determination Tam Nguyen Department of Aeronautics and Astronautics Massachusetts Institute of Technology Outline Background and objectives Nadir vector
Chapter 4 Nadir looking UV measurement. Part-I: Theory and algorithm
 Chapter 4 Nadir looking UV measurement. Part-I: Theory and algorithm -Aerosol and tropospheric ozone retrieval method using continuous UV spectra- Atmospheric composition measurements from satellites are
Phys 100 Astronomy (Dr. Ilias Fernini) Review Questions for Chapter 8
 Review Questions for Chapter 8") Phys 100 Astronomy (Dr. Ilias Fernini) Review Questions for Chapter 8 MULTIPLE CHOICE 1. Granulation is caused by a. sunspots. * b. rising gas below the photosphere. c. shock waves in the corona. d. the
Phys 100 Astronomy (Dr. Ilias Fernini) Review Questions for Chapter 8 MULTIPLE CHOICE 1. Granulation is caused by a. sunspots. * b. rising gas below the photosphere. c. shock waves in the corona. d. the
The optimization of the inverted occulter of the Solar Orbiter/METIS coronagraph/spectrometer
 The optimization of the inverted occulter of the Solar Orbiter/METIS coronagraph/spectrometer F. Landini 1, S. Vives 2, M. Romoli 1, C. Guillon 2, M. Pancrazzi 1,2, C. Escolle 2, M. Focardi 1, S. Fineschi
EXPOSURE TIME ESTIMATION
 ASTR 511/O Connell Lec 12 1 EXPOSURE TIME ESTIMATION An essential part of planning any observation is to estimate the total exposure time needed to satisfy your scientific goal. General considerations
Infrared Earth Horizon Sensors for CubeSat Attitude Determination
 Infrared Earth Horizon Sensors for CubeSat Attitude Determination Tam Nguyen Department of Aeronautics and Astronautics Massachusetts Institute of Technology Outline Background and objectives Nadir vector
STAGNATED OUTFLOW OF O +5 IONS IN THE SOURCE REGION OF THE SLOW SOLAR WIND AT SOLAR MINIMUM
 The Astrophysical Journal, 602:415 421, 2004 February 10 # 2004. The American Astronomical Society. All rights reserved. Printed in U.S.A. STAGNATED OUTFLOW OF O +5 IONS IN THE SOURCE REGION OF THE SLOW
Sky Background Calculations for the Optical Monitor (Version 6)
") Sky Background Calculations for the Optical Monitor (Version 6) T. S. Poole August 3, 2005 Abstract Instructions on how to calculate the sky background flux for the Optical Monitor on XMM-Newton, by considering
Sky Background Calculations for the Optical Monitor (Version 6) T. S. Poole August 3, 2005 Abstract Instructions on how to calculate the sky background flux for the Optical Monitor on XMM-Newton, by considering
The Sun. Chapter 12. Properties of the Sun. Properties of the Sun. The Structure of the Sun. Properties of the Sun.
 Chapter 12 The Sun, Our Star 1 With a radius 100 and a mass of 300,000 that of Earth, the Sun must expend a large amount of energy to withstand its own gravitational desire to collapse To understand this
The in-orbit wavelength calibration of the WFC G800L grism
 The in-orbit wavelength calibration of the WFC G800L grism A. Pasquali, N. Pirzkal, J.R. Walsh March 5, 2003 ABSTRACT We present the G800L grism spectra of the Wolf-Rayet stars WR45 and WR96 acquired with
Stray light analysis of an on-axis three-reflection space optical system
 June 10, 2010 / Vol. 8, No. 6 / CHINESE OPTICS LETTERS 569 Stray light analysis of an on-axis three-reflection space optical system Baolin Du ( ), Lin Li ( ), and Yifan Huang ( ) School of Optoelectronics,
Jim Hagerman 4/12/99
 This is an electro-optical analysis of the UCMS (underwater camera mapping system) designed for TerraSystems. Jim Hagerman 4/1/99 For simplicity the SNR of only one 5nm wide channel near 5nm is determined.
Search for photospheric footpoints of quiet Sun transition region loops
 Search for photospheric footpoints of quiet Sun transition region loops L. Teriaca Max Planck Institut für Sonnensystemforschung Submitted to A&A as Sánchez Almeida, Teriaca, Sütterlin, Spadaro, Schühle,
MERIS US Workshop. Instrument Characterization Overview. Steven Delwart
 MERIS US Workshop Instrument Characterization Overview Steven Delwart Presentation Overview On-Ground Characterisation 1. Diffuser characterisation 2. Polarization sensitivity 3. Optical Transmission 4.
Stellar Astronomy Sample Questions for Exam 3
 Stellar Astronomy Sample Questions for Exam 3 Chapter 7 1. A protostar is formed by a) the rapid expansion of gas from an exploding star. b) the gravitational collapse of a rotating interstellar cloud.