Lectures on Stellar Populations
|
|
|
- Shannon Beasley
- 6 years ago
- Views:
Transcription
1 Ciclo di Lezioni focalizzato sul problema della ricostruzione della Storia di Formazione Stellare dall analisi dellla distribuzione delle stelle sul diagramma Colore-Magnitudine


2 Carina: Dwarf Spheroidal Monelli et al. 2004
 Enhancement at 3.5 Gyr ago Old SF (from 10-3.")
3 Large Magellanic Cloud DISK FIELD BAR FIELD Recent enhancement (from 0.1 Gyr ago) Enhancement at 3.5 Gyr ago Old SF (from Gyr ago) Smecker-Hane et al. 2002


4 NGC 1705 A Dwarf Blue Galaxy observations interpretation Annibali et al. 2003
: <10Myr 10 60 60 1000 >")

5 Simulations: Color Coding Reflects AGE(Myr): <10Myr > 1000 SFR constant from 10 Myr to 2 Gyr ago SFR constant from now to 1 Gyr ago
6 Outline of the Course: Summary of Stellar Evolution Review of general properties of stellar tracks, which determine the appearance of the HRD and its systematics. Bolometric Corrections and Colors How we transform from the theoretical (Log L, Log Teff) plane to the observational (Mag,Color) Basic Relations between Stellar Counts in Selected Regions of the CMD and the SF History Illustrate potentials and limitations of the synthetic CMD method The Simulator and Some Examples Various technicalities, including the treatment of photometric errors
7 Evolutionary Tracks Padova 94 set 100 M O Z=Z o Y=0.28 ZAMS PAGB 0.6 M O MM O O PN 5 M O To WD M O O ZAHB RGB 1 M O 1M O

8 Back to HRD RGB evolution 100Ro 2 Mo 0.8 Mo RGB Bump 10 Ro


9 Back to HRD RGB : bump and LF 1.2 Mo 1 Mo


10 Back to HRD Flash and After RGB tip RGB tip 1 Ro 10 Ro 100 Ro P-EAGB RGB base M tr


11 Back to HRD Clump and Loops 15 TRGB 9 Mo Distance ind Age indicator Lmax,He Lmin,He Mo ZAHB 10 Ro


12 AGB Bump 5 Mo BUMP 4 Mo RGB 3 Mo 2.2 Mo 1.5 Mo with cost=-0.5 BUMP 1 Mo with cost=-1 RGB

13 PMS LF Bump Clump Clump RGB Bump Bump HB AGB


14 First Pulse and TAGB TAGB Ist Pulse TRGB


15 Massive Stars Evolution affected by MASS LOSS OVERSHOOTING Chiosi and Maeder 1986

16 Back to HRD Where the Stars are Dots are equally spaced in BSG WR RSG There are 1000 dots along each track Ceph C stars Miras Clump WD HB RRLyr


17 Dependence on Metallicity 30 Mo 15 Mo 5 Mo 3 Mo Clumps AGB Manque Post E-AGB Clumps 0.9 Mo 0.5 Mo 0.55 Mo 0.6 Mo
18 Evolutionary Lifetimes RGB phase transition overshooting tot He burning MS rgb

19 RGB Luminosities TIP Base

20 Helium Burning and beyond Ist Pulse He burn L-band RGB trans

21 Isochrones Girardi et al As Z increases: isochrones get fainter and redder loops get shorter WR stars are more easily produced
22 Uncertainties and wish list Core Convection: affects star s luminosity H and He lifetimes shape of tracks around M hook first H shell burning and runway for intermediate mass stars MS width location of RGB bump values of M tr and M up ratios N(HB)/N(AGB) loops extension Mass Loss: on the RGB affects Temperature extension of HB on the AGB affects value of M up and TAGB for massive stars affects surface abundances, upper limit of Red SGs, productions of WR.. Opacity: affects MS width occurrence and extension of loops Blue to Red ratio Mixing Length, rotation, diffusion, meridional circulation, nuclear reactions Separate dependence on Y and Z is important
23 What have we learnt To place on the HRD whatever mass at whatever age we want to pay attention to: M tr M up M hook : lifetimes and tracks discontinuities Place correctly RGB Tip (as distance indicator) Describe accurately the evolution in core He burning close to RGB transition (Lum extension during evolution) Allow spread of envelope masses for HB stars Describe extension of the loops, location of BSG, Back-to-the-Blue evolution of high mass stars. AND if we include a metallicity spread Correctly describe all these systematics as a function of Metallicity
24 Bolometric Corrections and Colors system throughput depends on Teff, gravity and Z

25 Average of Observed Stellar Spectra: Dwarfs SpT T(K) F c.g.s. O e+14 A e+11 G e+10 M e+09
26 Dwarfs SED & Filters BC strongly depends on SpT Cool stars detected in Red Hot stars detected in Blue B V I U COLORS: are Temperature Indicators Cool stars are Red Hot stars are Blue

27 Effect of gravity B5 B0 M5 Gravity effects are very Important for very hot And very cool stars M2 A0 K5

28 COLORS: Empirical Johnson 1966 ARAA B-V colors are good Teff indicators for late A, F, G and early K stars For Hot stars SpT is preferred

29 Bolometric Corrections: Empirical Hottest and Coolest stars are 3-4 mags fainter in V than in Bolometric Gravity dependence can amount to 0.5mags

30 Models Model Atmospheres: Kurucz Grid revised by Castelli Empirical

31 Model Atmospheres: dependence on gravity Models Empirical

32 Model Atmospheres: dependence on Metallicity Molecules Blanketing
33 Model Atmospheres: Calibration The Models do a good job for the SED of Dwarfs, especially for intermediate Spectral Types Not too bad for Giants and Supergiants also Major problems are met al low Temperatures (Opacity, Molecules) Anyway, the use of Model Atmospheres becomes a MUST because: they allow us to compute Colors and BCs for various Metallicities AND for whatever filters combinations To do that we: Take a grid of Models Perform calibration Produce Tables of BC, Col function of (Teff,Log g, [M/H])

34 Balmer Jump Go Back

35 Colors from Model Atmospheres Origlia and Leitherer 1998: Bessel, Castelli and Pletz models through Ground Based Filters

36 Bolometric Correction from Model Atmospheres Nice and smooth BUT Probably off for Late K and M stars Have you noticed that lines of different colors Span different Temperature Range? THIS IS NOT A SUPERMONGO FALIURE:

37 Tracks on the Log Teff Log g Plane WE LACK LOW GRAVITY MODELS FOR MASSIVE STARS WE LACK LOW TEMPERATURE AND LOW GRAVITY MODELS FOR LOW MASS STARS (AT HIGH METALLICITIES)
38 Go back M&M: attach empirical calibrations Montegriffo et al. (1998) traslated
39 Bessel, Castelli & Pletz (1998, A&A 333, 231) Compare Kurucz s revised models (ATLAS9)+ Gustafsson et al revised (NMARCS) models for red dwarfs and giants to empirical colors and BCs for stars in the Solar Neighbourhood (i.e. about solar metallicity). They show color-temperature, color-color, and BC-color relations. Conclude that : 1. There is a general good agreement for most of the parameter space 2. B-V predicted too blue for late type stars, likely due to missing atomic and molecular opacity 3. NMARCS to be preferred to ATLAS9 below 4000 K


40 The models are shown as curves The data are shown as points The ptype encodes the literature source Hot Dwarfs A-K Dwarfs GKM Giants

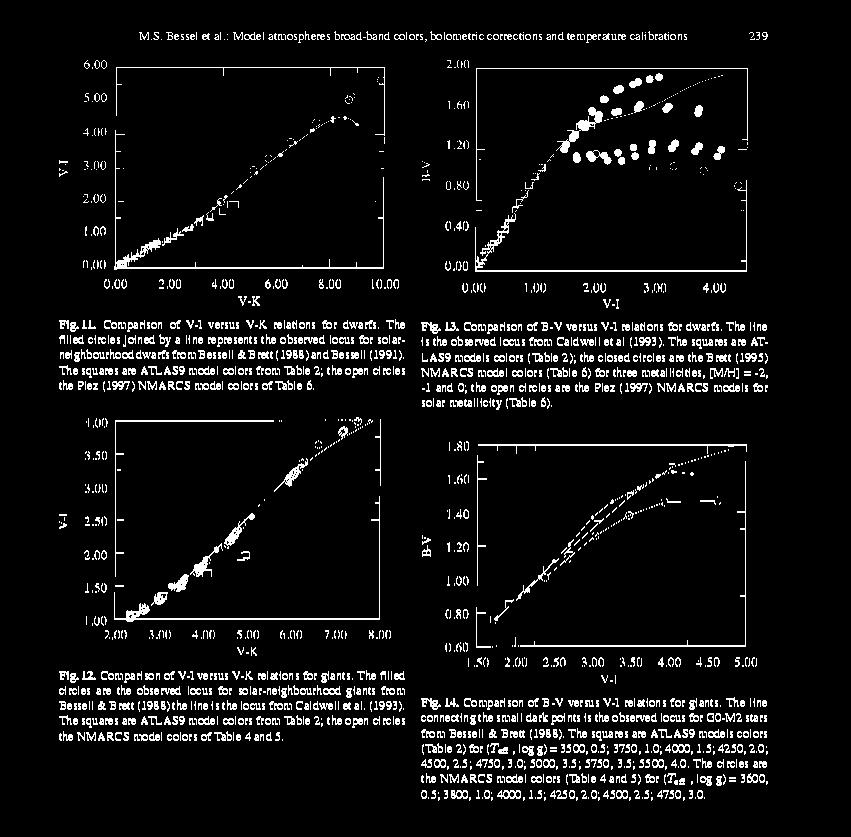
41 Dwarfs NM K Giants

42 Dwarfs Giants Dwarfs
 +")

43 BaSeL Grid (Lejeune, Cuisinier and Buser ) Collect Model Atmospheres from Kurucz +Bessel + Fluks (for RGs) + Allard (for M dwarfs) Correct the model spectra so as to match empirical calibration Put the corrected models on the net


44 BaSeL 2.2 : Corrected Models at solar Z & Z theoretical dependence BaSeL 3.1: Corrected models at various Z based on GCs Ridge Lines 5 GGs with [Fe/H]=-2.2 to -0.7 in UBVRIJHKL For each get Te from V-K (using BaSel 2.2) BCs vs (Te,g) BaSeL 3.1 Padova 2000: Correction at various Z made to match GCs Ridge Lines with Padova 2000 isochrones Lejeune Models: Z dependence Check with Globulars Ridge Lines It is virtually impossible to establish a unique calibration In terms of Z which is consistent with both color temperature Relations AND GCs ridge lines (with existing isochrones) Westera et al. 2002
45 Libraries with high Spectral resolution Recently developed for Population Synthesis Studies, Stellar spectroscopy, Automatic Classification of Stellar and Galaxy Spectra not so important for Broad Band Colors Observational Libraries take a sample of well observed stars with known parameters Log Te, Log g, [Fe/H] and derive their spectra STELIB Le Borgne et al spectra between 3200 and 9500 A, sp.res. ~ 3 A INDO-US Valdes et al spectra between 3460 and 9464 A with smaller wavelength range sp. res. ~ 1 A
 + Code for synthetic spectrum which solves monochromatic radiative transport with a large list of")

46 Libraries with high Spectral resolution THEORETICAL MODELS Usually constructed on top of a model atmosphere (Kurucz) + Code for synthetic spectrum which solves monochromatic radiative transport with a large list of lines not very important for broad band colors, but could suggest diagnostic tools Martins et al. 2005: 1654 spectra between 3000 and 7000 A with sp. res. ~0.3 A Special care to describe non-lte and sphericity effects


47 Martins et al Check versus STELIB stars Check versus INDO-US stars
48 Other Models: Munari et al. : spectra between 2500 and A with res of ~1 A cover Te from 3500 to K, Log g from 0 to 5 [M/H] from -2.5 to +0.5 and [A/Fe]=0,+0.4 Bertone et al. : 2500 spectra with resolution of ~ 0.3 A UV grid Optical grid between 850 and 4750 A 3500 and 7000 A Te from 3000 to K 4000 to K Log g from 1 to 5 0 to 5 [M/H] from -2.5 to to +0.3 Coelho et al. : spectra between 3000 and 1800 A with res of ~0.02 A cover Te from 3500 to 7000 K, Log g from 0 to 5 [M/H] from -2.5 to +0.5 and [A/Fe]=0,+0.4

49 Converted Tracks: B and V

50 Converted Tracks: V and I
51 What have we learnt When passing from the theoretical HRD to the theoretical CMD we should remember that: At Zo the model atmospheres are adequate for most TSp There are substantial problems for cool stars, especially at low gravities The theoretical trend with Z is not well tested The tracks on the CMD reflect these uncertainties The transformed tracks make it difficult to sample well the upper MS (large BC); the intermediate MS merges with the blue part of the loops; the colors (and the luminosities) of the Red giants and Supergiants are particularly uncertain.
 to gauge the theoretical uncertainty when computing simulations with one")
52 Uncertainty of Stellar Models Gallart, Zoccali and Aparicio 2005 compare various sets of models (isochrones) to gauge the theoretical uncertainty when computing simulations with one set.
53 Age-dating from Turn-off Magnitude In general the turn-off magnitude at given age agrees Teramo models fit the turn off Magnitude with older ages (at intermediate ages) Notice some difference in isochrone shapes, and SGB for old isochrones
54 Deriving metallicity from RGB The RGBs can be very different especially at high Z The difference is already substantial at M I =1.5 where the BCs can still be trusted (Te ~ 4500) The comparison to Saviane s lines Seem to favour Teramo at high Z, but the models do not bend enough at the bright end.
55 Deriving distance from RGB Tip The RGB Tip is an effective distance indicator in the I band and at low Zs The theoretical location depends on the bolometric magnitude and on The BC in the I band. There is a trend of Padova models to yield relatively faint TRGB at all metallicities. Observations are not decisive, But undersampling at TRGB should lead to systematically faint observed TRGB.
56 Magnitude location of the HB The HB luminosity can be used as distance indicator as well as to derive Ages of GCs, from the difference between the HB and the TO luminosity (dependence on Z is crucial for this). The models show substantial discrepancies, again with Padova models fainter than Teramo. Observations are very discrepant as well; major difficulties stem from the correction for luminosity evolution on the Horizontal Branch; the necessity to trace the ZAHB to the same Teff point in both observations and models.
57 Summary The TO magnitude at given age of the stellar population seems independent of the set of tracks, except for obvious systematics with input physics (but Teramo models need further investigation) this feature can be safely used for age-dating; The TO temperatures, and in general the shape of the isochrones, seems more uncertain, as they differ in different sets; The colors of RGB stars and their dependence on metallicity are very uncertain; the derivation of Z and Z distribution from RGB stars needs a careful evaluation on systematic error; The magnitude level of the ZAHB and its trend with Z show a substantial discrepancy in the various sets of models AND in the various observational data sets. This is a major caveat for the distance and age determinations based on the level of HB stars. A theoretical error of about 0.2 is also to be associated to the distance determination from the TRGB.
58 Basic Relations between Stellar Counts on the CMD and SFH On the potentials and limitations of the Synthetic CMDs method We will go through: SSPs :isochrones, MS and PMS phases, FCT,Number-Mass connection CSPs: SSPs with an age distribution, to elucidate relations between ΔN and M(CSP) Ultimately:

59 Isochrones on the HRD 4 Myr Theoretical Isochrones With ages from 4 Myr to 15 Gyr 40 Myr 0.2 Gyr 1 Gyr 15 Gyr
.")
60 Mass-Luminosity relation along isochrones In the j-th luminosity bin each i-th isochrone contributes: 10 Myr Lower and upper integration limits depend on the isochrone, i.e. on age (and Z). 100 Myr 500 Myr A i describes the size of the Stellar Population on the isochrone (SSP) RGB mass loss
61 LF on the MS Consider a continuous Star Formation Rate ψ(t): the contribution to Δn j from the ages between τ and τ+dτ is proportional to ψ(τ)dτ, and Summing up all the relevant contributions we get: maximum age contributing to j-th bin The mass and mass range contributing to the counts in the j-th bin depend on the age. If we neglect this dependence (on the MS we may): IMF M-L The LF on the MS is proportional to the IMF through the M-L relation AND to the SFR over the relevant age range.

62 Gallart, Zoccali and Aparicio 2005 Color Function on the MS The CF on the MS is a better tracer of the SFH Young populations have more blue stars Typical color on the MS depends on age

63 Post MS phases Consider an SSP: approximations: valid for PMS phases m 2 m 1 m TO is the Stellar Evolutionary Flux: # of leaving the MS per unit time is the considered PMS evolutionary phase

64 Fuel Consumption Theorem (Tinsley 1976; Renzini 1981) if F,L in solar units and b in #/yr Is the fuel burnt in the j-th PMS phase The Specific Evolutionary Flux depends weakly on the age of the SSP and on the IMF This can be used for: Planning observations Evaluate crowding effects Tests of Evolution theory


65 Test of FCT on M3 (Renzini and Fusi Pecci, 1988, ARAA 26, 199)
66 Application to the SFH problem Start from: Characterize SSP by its Mass in m>0.6: Get: Where: is the Specific Evolutionary Flux # of stars leaving the MS per unit time,per unit MASS of the SSP function of IMF, Age, Metallicity is the Specific Production of j type Stars # of j stars from SSP with unitary Mass function of IMF, Age, Metallicity

67 Synthetic Tracks interpolated within Padova 94-Z=0.004 generated a fine grid of synthetic tracks with masses of specific in order to finely investigate on the behaviour of at fixed Z=0.004


68 The Specific Production of Post-MS Stars of SSPs Number of Stars produced by a 1000 Mo SSP of age
69 TauMag of SSPs Magnitude Location of Red stars in different phases as the SSP ages : Core Helium Burners First RG ascent Second RG ascent (up to Ist pulse) RGB phase transition
70 Composite Stellar Populations: YOUNG In general for a CSP, the number of stars in the j-th magnitude bin is: where the integration spans the ages contributing to the j-th bin If the bin intercepts stars from a small age range: where This is the case for Young CSPs ( 100 Myrs) for which: The number of stars in the j-th mag bin speaks for the power of the SF episode at a specific age The LF reflects the SFR as a function of age

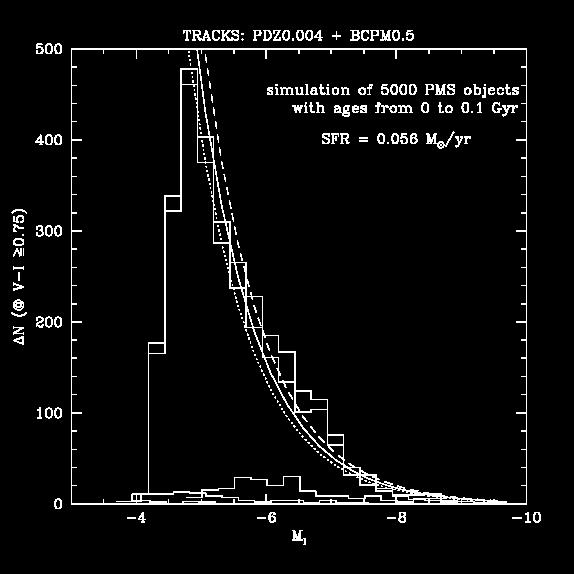
71 Young CSP: an example

72 Blue Helium Burners SFH at Young ages is best Sampled by the Blue Helium Burners. Get detailed SFH up to 0.3 Gyr ago
73 Composite Stellar Populations : OLD A given Mag bin now spans a wide age range: We get integrated information Consider: what we count The Specific Production of j-type stars from the CSP what we get tool Look at the Specific Production of CSPs under different SFH In specific magnitude bins


74 Specific Production of CSP: bright AGB stars number of bright AGB stars from a 1000 Mo CSP


75 Specific Production of CSP: Carbon stars Marigo, Girardi, Chiosi MASS data of LMC C stars Marigo and Girardi 2001: Opacity independent of C abundance in the envelope Marigo 2002: Opacity increases with increasing C abundance in the envelope


76 Specific Production of CSP: AGB stars Simulation: foreground contamination before Ist pulse and massive He burners TPAGB: Oxygen rich Carbon rich selected from 2MASS data of LMC Marigo, Girardi, Chiosi 2003

77 Mixture of Pulsators: fundamental & first over-tone

78 Specific Production of CSP on bright RGB number of stars in the 2 upper I-mags of the RGB from a 1000 Mo CSP

79 Specific Production of CSP of He burning Stars at Clump Mags number of Stars at Clump Magnitudes from a 1000 Mo CSP
80 What have we learnt When running the simulations we should remember the following rules and check if the output numbers verify the fundamental relations between stellar counts and extracted Total Mass of the CSP The MS LF is sensitive to both the SFR and IMF For the PMS phases there exists a simple and direct relation between the stellar counts in specific regions of the CMD and the Mass of the Stellar Population that produced them The bright portion of the LF of PMS stars allows to recover the SFH with a fair degree of detail, up to 300 Myr (both blue and red) For older ages, it is possible to derive with some confidence the total mass of the underlying CSP On the average there is about 1 bright E-AGB star every Mo of CSP 1 upper RGB star every 2000 Mo of CSP 1 He burning star every 200 Mo of CSP The determination of the SFR is prone to the non-easy gauge of the age range of the counted stars
81 The Simulator (AT FIXED METALLICITY) Random Extraction of Mass-Age pair Place Synthetic Star on HRD r random in 0 1 Convert (L,Teff) into (Mag,Col) Apply Photometric Error NO Test to STOP YES Notify: Astrated Mass, # of WDs,BHs,TPAGB.. EXIT
82 Interpolation between tracks: lifetimes

83 Interpolation between Tracks: L and Teff of low mass stars

84 Interpolation between Tracks: L and Teff of intermediate mass stars
 Completeness levels: 0.95 % thick 0.75 % thin 0.")
85 Photometric Error: Completeness NGC 1705 (Tosi et al. 2001) Completeness levels: 0.95 % thick 0.75 % thin 0.50 % thick 0.25% thin
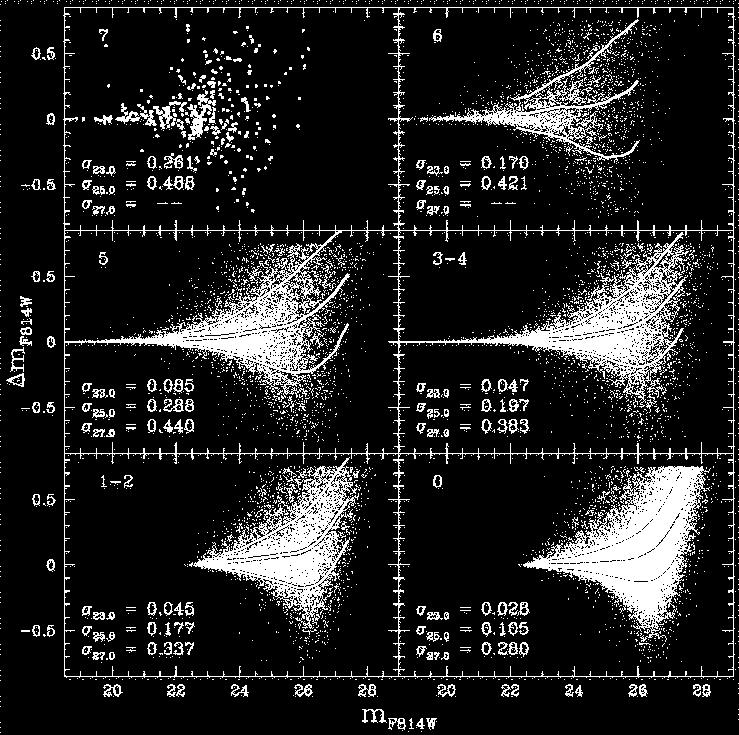
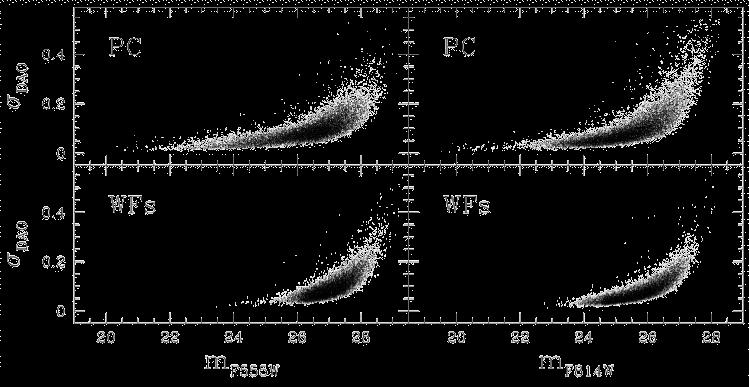
86 Photometric errors: σ DAO and Δm
87 Crowding # of stars j in one resolution element (r.e.) where S j is the srf density of j stars and σ r.e. is the area intercepted Probability of j+j blend is Degree of Crowding in the frame With N r.e resolution elements is depends on SFH: In VII Zw 403 (BCD) we detect with HST 55 RSG, 140 bright AGB and 530 RGT(1) stars/kpc 2 Observed with OmegaCAM we get crow=0.1 at 17,10 and 5.6 Mpc for the 3 kinds resp. In Phoenix (DSp) we detect >4200 RC stars/kpc 2 : with OmegaCAM crow is 0.1 already at 2 Mpc
88 Another way to put it: (Renzini 1998) # of blends in my frame is # of j stars in my frame (if SSP) is where L is the lum sampled by the r.e. # of blends in my frame becomes # of blends increases with the square of the Luminosity and decreases with the number of resolution elements
 1e+05 (3) 2e-05.. (4) GB : σ(r.e.) 0.3 sq.arcsec.n RGTxn RGT 0.044 N(r.e.) 1.3e+04")
89 Pixels and Frames: Example (1) (2) (3) (4) (1) A.O.: σ(r.e.) 0.14x n RGT 8 in one r.e. (2) HST: σ(r.e.) 0.06x0.06..n RGT xn RGT 2e-04 N(r.e.) 1e+05 (3) 2e-05.. (4) GB : σ(r.e.) 0.3 sq.arcsec.n RGTxn RGT N(r.e.) 1.3e+04


90 How Robust is the Result? The statistical estimator does not account for systematic errors Theoretical Transformed Errors Applied EACH STEP BRINGS ALONG ITS OWN UNCERTAINTIES THE SYSTEMATIC ERROR IS DIFFUCULT TO GAUGE

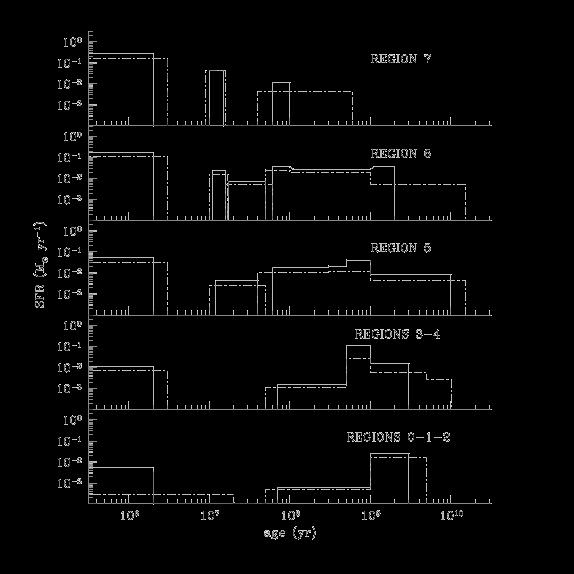
91 Why and How Well does the Method Work? Think of the composite CMD as a superposition of SSPs, each described by an isochrone The number of stars in is proportional to the Mass that went into stars at τ 0.1 Gy This is valid for all the PMS boxes, with different proportionality factors Perform the exercise for all isochrones
 Cole; Holtzman; Dolphin Dolphin 2002, MNRAS")

 and Z(t) DATA PURE MODEL PARTIAL CMD Ages: 11-12 Gyr")
92 Methods for Solution: Blind Fit used by Hernandez, Gilmore and Valls Gabaud Harris and Zaritsky (STARFISH) Cole; Holtzman; Dolphin Dolphin 2002, MNRAS 332,91: Review of methods and description of Blind fit Generate a grid of partial model CMD with stars in small ranges of ages and metallicities Construct Hess diagram for each partial model CMD Generate a grid of models by combining partial CMDs according to SFR(t) and Z(t) DATA PURE MODEL PARTIAL CMD Ages: Gyr [M/H]:


93 Use a statistical estimator to judge the fit: m i is the number of synthetic objects in bin i n i is the number of data points in bin i Minimize fit -- get best fit + a quantitative measure of the quality of the fit
 Dolphin: The solution with RGB+HB was extremely successful, measuring the SFH with nearly the same accuracy as the fit to the")
94 My prejudice: The model CMDs may NOT contain the solution The method requires a lot of computing: Does this really improve the solution? (apart from giving a quantitative estimate of the quality of the fit) Dolphin: The solution with RGB+HB was extremely successful, measuring the SFH with nearly the same accuracy as the fit to the entire CMD. If wrong Z is used, the blind method will give a solution, but not THE SOLUTION
")

95 Count the stars in the diagnostic boxes: Their number scales with the mass in Stars in the corresponding age range Methods for Solution: Tailored Fit (see Bertelli et al 1992, ApJ, ***,***) Between 10 and 50 Myr Construct partial CMD constrained to reproduce the star s counts within the boxes. The partial CMDs are coherently populated also with stars outside the boxes Younger than 10 Myr Between 50 Myr and 1 Gyr
96 Compare the total simulation to the data Use your knowledge of Stellar evolution to improve the fit AND decide where you cannot improve, and where you need a perfect match The two methods should be viewed as complementary
97 Simulation
98 What have we learnt When computing the simulations we should pay attention to The description of the details in the shape of the tracks, and the evolutionary lifetimes (use normalized independent variable) The description of photometric errors, blending and completeness (evaluate crowding conditions: if there is more than 1 star per resolution element the photometry is bad; crowding condition depends on sampled luminosity, size of the resolution element and star s magnitude) Different methods exist to solve for the SFH: the BLIND FIT is statistically good, but does not account for systematic errors; it seems too complicated on one hand, could miss the real target of measuring the mass in stars on the other; the TAILORED FIT goes straight to the point of measuring the mass in stars of the various components of the stellar population; it s unfit for automatic use; the solution reflects the prejudice of the modeler; the quality of the fit is judged only in a rough way.
Population synthesis models
 Population synthesis models From stellar evolution models to synthetic populations in the Milky Way Léo Girardi OAPadova INAF Italy LIneA Rio de Janeiro Brazil GAIA/ITN School, Tenerife, Sep 2013 Léo Girardi
Chapter 8: Simple Stellar Populations
 Chapter 8: Simple Stellar Populations Simple Stellar Population consists of stars born at the same time and having the same initial element composition. Stars of different masses follow different evolutionary
Review of stellar evolution and color-magnitude diagrams
 Review of stellar evolution and color-magnitude diagrams The evolution of stars can be used to study the properties of galaxies Very characteristic features pinpoint at the age (chemistry) of the stars
Simple Stellar Populations
 Stellar Objects: Simple Stellar Populations 1 Simple Stellar Populations 1 Theoretical isochrones Update date: December 14, 2010 Simple Stellar Population consists of stars born at the same time and having
Chapter 10: Unresolved Stellar Populations
 Chapter 10: Unresolved Stellar Populations We now consider the case when individual stars are not resolved. So we need to use photometric and spectroscopic observations of integrated magnitudes, colors
The Giant Branches. Stellar evolution of RGB and AGB stars. Importance, features, uncertainties
 The Giant Branches Stellar evolution of RGB and AGB stars Importance, features, uncertainties Achim Weiss (Max-Planck-Institut für Astrophysik, Garching) M5 (Rosenberg et al. 2000) Giant Branches MACHO
Stellar Evolution & issues related to the post Turn-Off evolution
 Stellar Evolution & issues related to the post Turn-Off evolution Santi Cassisi INAF - Astronomical Observatory of Teramo, Italy The point of view of Population Synthesis users What do they want? Magnitudes
Review of stellar evolution and color-magnitude diagrams
 Review of stellar evolution and color-magnitude diagrams The evolution of stars can be used to study the properties of galaxies Very characteristic features pinpoint at the age (chemistry) of the stars
Chapter 7: From theory to observations
 Chapter 7: From theory to observations Given the stellar mass and chemical composition of a ZAMS, the stellar modeling can, in principle, predict the evolution of the stellar bolometric luminosity, effective
Stellar Population Synthesis: The Role of Adaptive Optics
 Stellar Population Synthesis: The Role of Adaptive Optics Jason Melbourne (Caltech) Nearby (2.5 Mpc) Dwarf Irregular Galaxy KKH 98 HST F475W (Blue), HST F814W (Green), Keck AO K-band (red) Melbourne et
From theory to observations
 Stellar Objects: From theory to observations 1 From theory to observations Update date: December 13, 2010 Given the stellar mass and chemical composition of a ZAMS, the stellar modeling can, in principle,
Age Dating A SSP. Quick quiz: please write down a 3 sentence explanation of why these plots look like they do.
 Color is only a weak function of age after ~3Gyrs (for a given metallicity) (See MBW pg 473) But there is a strong change in M/L V and weak change in M/L K Age Dating A SSP Quick quiz: please write down
Stellar Populations in the Local Group
 Stellar Populations in the Local Group Recall what we ve learned from the Milky Way: Age and metallicity tend to be correlated: older -> lower heavy element content younger -> greater heavy element content
The SFH of the LMC: The CMD approach vs. integrated colors and spectra
 Resolved Stellar Populations ASP Conference Series, Vol. TBA, 25 D. Valls Gabaud & M. Chavez (eds) The SFH of the LMC: The CMD approach vs. integrated colors and spectra Thomas Lilly and Uta Fritze-v.
The Stellar Populations of Galaxies H. W. Rix IMPRS Galaxies Course March 11, 2011
 The Stellar Populations of Galaxies H. W. Rix IMPRS Galaxies Course March 11, 2011 Goal: Determine n * (M *,t age,[fe/h],r) for a population of galaxies How many stars of what mass and metallicity formed
Lecture Three: Stellar Populations. Stellar Properties: Stellar Populations = Stars in Galaxies. What defines luminous properties of galaxies
 Lecture Three: ~2% of galaxy mass in stellar light Stellar Populations What defines luminous properties of galaxies face-on edge-on https://www.astro.rug.nl/~etolstoy/pog16/ 18 th April 2016 Sparke & Gallagher,
Star clusters laboratories of stellar structure theory. Achim Weiss Max-Planck-Institute for Astrophysics (Garching, Germany)
") Star clusters laboratories of stellar structure theory Achim Weiss Max-Planck-Institute for Astrophysics (Garching, Germany) Motivation Stars are complex objects Stellar evolution theory tries to treat
Star clusters laboratories of stellar structure theory Achim Weiss Max-Planck-Institute for Astrophysics (Garching, Germany) Motivation Stars are complex objects Stellar evolution theory tries to treat
University of Naples Federico II, Academic Year Istituzioni di Astrofisica, read by prof. Massimo Capaccioli. Lecture 16
 University of Naples Federico II, Academic Year 2011-2012 Istituzioni di Astrofisica, read by prof. Massimo Capaccioli Lecture 16 Stellar populations Walter Baade (1893-1960) Learning outcomes The student
The Star Clusters of the Magellanic Clouds
 The Dance of Stars MODEST-14 The Star Clusters of the Magellanic Clouds Eva K. Grebel Astronomisches Rechen-Institut Zentrum für Astronomie der Universität Heidelberg Star Clusters in the Magellanic Clouds!
RGBs in composite stellar popula2ons
 RGBs in composite stellar popula2ons C. Gallart (IAC) with special thanks to A. Aparicio, S. Cassisi, S. Hidalgo & M. Monelli Main uses in stellar populations studies: Measure metallicity Total SFR. SFR(t)??
Deriving stellar masses from SDSS
 Deriving stellar masses from SDSS Reference: Bruzual and Charlot 2003MNRAS.344.1000B Kauffmann et al. 2003MNRAS.341.33 Salim et al. 2007ApJS..173..267S Bell et al. 2003ApJS..149..289B Outline! Basic idea!
Extracting the Star Formation History of Composite Stellar Populations
 Extracting the Star Formation History of Composite Stellar Populations Jenny Richardson 29/03/07 1 What is a Composite Stellar Population? A simple stellar population (SSP) consists of stars with uniform
From theory to observations
 Stellar Objects: From theory to observations 1 From theory to observations Given the stellar mass and chemical composition of a ZAMS, the stellar modeling can, in principle, give the prediction of the
The Color-Magnitude Diagram for local stars from Hipparcos. Red Giant Branch (RGB) Red clump. Absolute Magnitude Main Sequence. White dwarfs.
 Red clump. Absolute Magnitude Main Sequence. White dwarfs.") The Color-Magnitude Diagram for local stars from Hipparcos Absolute Magnitude Main Sequence Red clump Red Giant Branch (RGB) White dwarfs Kovalevsky 1998 Color Lebreton 2001 The Hipparcos H-R Diagram of
The Color-Magnitude Diagram for local stars from Hipparcos Absolute Magnitude Main Sequence Red clump Red Giant Branch (RGB) White dwarfs Kovalevsky 1998 Color Lebreton 2001 The Hipparcos H-R Diagram of
The Giant Branches of Open and Globular Clusters in the Infrared as Metallicity Indicators: A Comparison with Theory
 Accepted for publicaton in The Astronomical Journal The Giant Branches of Open and Globular Clusters in the Infrared as Metallicity Indicators: A Comparison with Theory GlennP.Tiede,PaulMartini,&JayA.Frogel
Predicted HST FOC and broad band colours for young and intermediate simple stellar populations
 ASTRONOMY & ASTROPHYSICS SUPPLEMENT SERIES Astron. Astrophys. Suppl. Ser. 136, 65 80 (1999) APRIL I 1999, PAGE65 Predicted HST FOC and broad band colours for young and intermediate simple stellar populations
Hertzprung-Russel and colormagnitude. ASTR320 Wednesday January 31, 2018
 Hertzprung-Russel and colormagnitude diagrams ASTR320 Wednesday January 31, 2018 H-R diagram vs. Color- Magnitude Diagram (CMD) H-R diagram: Plot of Luminosity vs. Temperature CMD: Plot of magnitude vs.
Lab Exercises for Low Mass Stars
 School of Physics and Astronomy February 2016 Lab Exercises for Low Mass Stars 1. Isochrones for the globular cluster M4 One common use of stellar models is to determine ages for stellar populations. This
 MAURIZIO SALARIS AGB STARS STRUCTURE 2 nd dredge up only for masses above ~4 M Early AGB Thermal pulses M=2.0M Z=0.02 Weiss & Ferguson (2009) HOT BOTTOM BURNING The minimum mass for HBB decreases with
The Milky Way Formation Timescale
 Mem. S.A.It. Vol. 75, 13 c SAIt 2004 Memorie della The Milky Way Formation Timescale A. Aparicio 1,2, A. Rosenberg 2, G. Piotto 3, I. Saviane 4 and A. Recio-Blanco 3 1 Departamento de Astrofisica, Universidad
Evolutionary models and age determinations Alessandro Bressan International School for Advanced Studies (SISSA) Trieste
 Trieste") Evolutionary models and age determinations Alessandro Bressan International School for Advanced Studies (SISSA) Trieste Also L. Girardi (OAPD) P. Marigo (UNIPD) A. Nanni (SISSA) New release of stellar
Evolutionary models and age determinations Alessandro Bressan International School for Advanced Studies (SISSA) Trieste Also L. Girardi (OAPD) P. Marigo (UNIPD) A. Nanni (SISSA) New release of stellar
of more complex systems like galaxies. A simple stellar population is dened as an assembly
 Chapter 4 SIMPLE STELLAR POPULATIONS 4.1 Introduction Simple stellar populations (SSP) are the basic tool to understand the spectro-photometric properties of more complex systems like galaxies. A simple
Lab Exercises for Low Mass Stars
 School of Physics and Astronomy February 2016 Lab Exercises for Low Mass Stars 1. Isochrones for the globular cluster M4 One common use of stellar models is to determine ages for stellar populations. This
Components of Galaxies Stars What Properties of Stars are Important for Understanding Galaxies?
 Components of Galaxies Stars What Properties of Stars are Important for Understanding Galaxies? Temperature Determines the λ range over which the radiation is emitted Chemical Composition metallicities
CHAPTER 11 LATE EVOLUTION OF M< 8 MSUN
 CHAPTER 11 LATE EVOLUTION OF M< 8 MSUN SUMMARY M> 2 SOL AR MASSES H-rich He-rich SUMMARY M> 2 SOL AR MASSES 1) evolution on thermal timescale from ~C to E: very fast : ~105-6 yr ``Hertzspung gap in H-R
Stellar Structure and Evolution
 Stellar Structure and Evolution Achim Weiss Max-Planck-Institut für Astrophysik 01/2014 Stellar Structure p.1 Stellar evolution overview 01/2014 Stellar Structure p.2 Mass ranges Evolution of stars with
Fundamental stellar parameters
 Fundamental stellar parameters flux received at Earth f º = direct determination of Teff R = radius of the spherical star, D = distance to the star. Luminosity : L = 4π R 2 F º dº T eff 4 = 4π R 2 F =
Pulsation of AGB stars in the Small Magellanic Cloud cluster NGC 419
 Mem. S.A.It. Vol. 81, 1078 c SAIt 2010 Memorie della Pulsation of AGB stars in the Small Magellanic Cloud cluster NGC 419 D. Kamath 1, P. R. Wood 1, I. Soszyński 2, and T. Lebzelter 3 1 Research School
Review from last class:
 Review from last class: Properties of photons Flux and luminosity, apparent magnitude and absolute magnitude, colors Spectroscopic observations. Doppler s effect and applications Distance measurements
arxiv:astro-ph/ v1 26 Jan 2007
 Evolutionary synthesis models for spirals and irregular galaxies arxiv:astro-ph/0701756v1 26 Jan 2007 Mercedes Mollá CIEMAT, Avda. Complutense 22, 28040, Madrid mercedes.molla@ciemat.es Summary. We show
et al. 1996; Hansen 2005; Kalirai et al ML is a free parameter with a huge astrophysical impact
 Rood 1973; Fusi Pecci & Renzini 1975,1976; Renzini 1977; Castellani & Tornambe 1981; Peterson 1982; Castellani & Castellani 1993; Fusi Pecci et al. 1993; D Cruz et al. 1996; Hansen 2005; Kalirai et al.
HR Diagram, Star Clusters, and Stellar Evolution
 Ay 1 Lecture 9 M7 ESO HR Diagram, Star Clusters, and Stellar Evolution 9.1 The HR Diagram Stellar Spectral Types Temperature L T Y The Hertzsprung-Russel (HR) Diagram It is a plot of stellar luminosity
Spectral Energy Distribution of galaxies
 Spectral Energy Distribution of galaxies Paola Santini PhD in Astronomy, Astrophysics and Space Science A.A. 2013 2014 Key points lecture 1 Multiwavalength astronomy: 1. Gives a complete view of the galaxy
Mapping the oxygen abundance in an elliptical galaxy (NGC 5128)
") Mapping the oxygen abundance in an elliptical galaxy (NGC 5128) Jeremy R. Walsh, ESO Collaborators: George H. Jacoby, GMT Observatory, Carnegie; Reynier Peletier, Kapteyn Lab., Groningen; Nicholas A. Walton,
Mapping the oxygen abundance in an elliptical galaxy (NGC 5128) Jeremy R. Walsh, ESO Collaborators: George H. Jacoby, GMT Observatory, Carnegie; Reynier Peletier, Kapteyn Lab., Groningen; Nicholas A. Walton,
THE GALACTIC BULGE AND ITS GLOBULAR CLUSTERS: MOS. B. Barbuy
 THE GALACTIC BULGE AND ITS GLOBULAR CLUSTERS: MOS B. Barbuy IAG - Universidade de São Paulo Outline: Interest of studies on Galactic bulge and globulars Data available on metallicity,, kinematics in field
dsph in Local Group July 2014 Vienna
 John Menzies SAAO dsph in Local Group Local Group associated with Galaxy, M31, within ~1 Mpc of centre of mass Galaxy has 25 companion dsph M31 has ~ 26 ~ 3 dsph not associated with either, near boundary
Star Formation Indicators
 Star Formation Indicators Calzetti 2007 astro-ph/0707.0467 Brinchmann et al. 2004 MNRAS 351, 1151 SFR indicators in general! SFR indicators are defined from the X ray to the radio! All probe the MASSIVE
SUPPLEMENTARY INFORMATION
 1. Identification of classical Cepheids: We identified three classical Cepheids amongst the 45 short-period variables discovered. Our sample includes classical Cepheids, type II Cepheids, eclipsing binaries
Galaxies 626. Lecture 9 Metals (2) and the history of star formation from optical/uv observations
 and the history of star formation from optical/uv observations") Galaxies 626 Lecture 9 Metals (2) and the history of star formation from optical/uv observations Measuring metals at high redshift Metals at 6 How can we measure the ultra high z star formation? One robust
Galaxies 626 Lecture 9 Metals (2) and the history of star formation from optical/uv observations Measuring metals at high redshift Metals at 6 How can we measure the ultra high z star formation? One robust
Structure and Evolution of Stars Lecture 19: White Dwarfs
 Structure and Evolution of Stars Lecture 19: White Dwarfs Physical Properties of White Dwarfs - density-mass relationship - mass-radius relationship - Chandrasekhar limiting mass - Cooling of White Dwarfs
The structure and evolution of stars
 The structure and evolution of stars Lecture 9: Computation of stellar evolutionary models 1 Learning Outcomes The student will learn How to interpret the models of modern calculations - (in this case
arxiv: v1 [astro-ph.co] 31 Mar 2011
![arxiv: v1 [astro-ph.co] 31 Mar 2011](/thumbs/93/111932489.jpg "arxiv: v1 [astro-ph.co] 31 Mar 2011") **Volume Title** ASP Conference Series, Vol. **Volume Number** **Author** c **Copyright Year** Astronomical Society of the Pacific Why Galaxies Care about AGB Stars. Modelling Galaxies. arxiv:1104.0022v1
**Volume Title** ASP Conference Series, Vol. **Volume Number** **Author** c **Copyright Year** Astronomical Society of the Pacific Why Galaxies Care about AGB Stars. Modelling Galaxies. arxiv:1104.0022v1
The Hertzsprung-Russell Diagram
 The Hertzsprung-Russell Diagram VIREO Virtual Educational Observatory Aims To use the observational + analysis tools of modern astronomy To use the setup that professional astronomers use at large telescopes
CALIBRATING STELLAR POPULATION MODELS WITH MAGELLANIC CLOUD STAR CLUSTERS
 Draft version June 18, 2015 Preprint typeset using L A TEX style emulateapj v. 5/2/11 CALIBRATING STELLAR POPULATION MODELS WITH MAGELLANIC CLOUD STAR CLUSTERS N. E. D. Noël 1,2, L. Greggio 3, A. Renzini
Lifespan on the main sequence. Lecture 9: Post-main sequence evolution of stars. Evolution on the main sequence. Evolution after the main sequence
 Lecture 9: Post-main sequence evolution of stars Lifetime on the main sequence Shell burning and the red giant phase Helium burning - the horizontal branch and the asymptotic giant branch The death of
arxiv:astro-ph/ v1 20 Apr 2004
 Mon. Not. R. Astron. Soc. 000, 1 7 (2004) Printed 13 November 2017 (MN LATEX style file v2.2) The Red Giant Branch in Near-Infrared Colour-Magnitude Diagrams. II: The luminosity of the Bump and the Tip
ASTRONOMY AND ASTROPHYSICS. Synthetic photometry from ATLAS9 models in the UBV Johnson system. Fiorella Castelli
 Astron. Astrophys. 346, 564 585 (1999) ASTRONOMY AND ASTROPHYSICS Synthetic photometry from ATLAS9 models in the UBV Johnson system Fiorella Castelli CNR-Gruppo Nazionale Astronomia and Osservatorio Astronomico,
dell Osservatorio 3, I Padova, Italy I Padova, Italy 98195, USA Wien, Austria 1. Introduction
 **Volume Title** ASP Conference Series, Vol. **Volume Number** **Author** c **Copyright Year** Astronomical Society of the Pacific Constraining Mass-Loss & Lifetimes of Low Mass, Low Metallicity AGB Stars
THE 2MASS COLOR-MAGNITUDE DIAGRAM OF THE GLOBULAR CLUSTER LYNG8Å7 1
 The Astronomical Journal, 1281228 1232, 2004 September # 2004. The American Astronomical Society. All rights reserved. Printed in U.S.A. THE 2MASS COLOR-MAGNITUDE DIAGRAM OF THE GLOBULAR CLUSTER LYNG8Å7
Index. blue stragglers 16, 64, 86, 128, 148 blue supergiant (BSG) 26, 102 bolometric correction 10, 25, 62, 105, 215 BzK criterion 157, 158
 26, 102 bolometric correction 10, 25, 62, 105, 215 BzK criterion 157, 158") 261 Index symbols 4000 Å break 118, 124 η Carinae 27 a A496 238 accretion 82, 129, 133, 138, 184 191, 223 accretion efficiency 196 accretion induced collapse (AIC) 184, 187 adiabatic gradient 5, 18 AGB
261 Index symbols 4000 Å break 118, 124 η Carinae 27 a A496 238 accretion 82, 129, 133, 138, 184 191, 223 accretion efficiency 196 accretion induced collapse (AIC) 184, 187 adiabatic gradient 5, 18 AGB
GLOBULAR CLUSTERS IN THE HIGH ANGULAR RESOLUTION ERA SOME RESULTS AND SOME IDEAS FOR MAD-MAX
 GLOBULAR CLUSTERS IN THE HIGH ANGULAR RESOLUTION ERA SOME RESULTS AND SOME IDEAS FOR MAD-MAX Giampaolo Piotto Dipartimento di Astronomia Universita di Padova Simple Stellar Populations A Simple Stellar
Globular cluster ages
 Proc. Natl. Acad. Sci. USA Vol. 95, pp. 13 17, January 1998 Colloquium Paper This paper was presented at a colloquium entitled The Age of the Universe, Dark Matter, and Structure Formation, organized by
M31 Color Mag Diagram Brown et al 592:L17-L20!
 The physical origin of the form of the IMF is not well understood Use the stellar mass-luminosity relation and present day stellar luminosity function together with a model of how the star formation rate
Lecture 1: Introduction. Literature: Onno Pols chapter 1, Prialnik chapter 1
 Lecture 1: Introduction Literature: Onno Pols chapter 1, Prialnik chapter 1!" Goals of the Course! Understand the global characteristics of stars! Relate relevant microphysics to the global stellar characteristics!
Imaging with Micado at the E-ELT. WORKSHOP: Imaging at the E-ELT
 Imaging with Micado at the E-ELT Renato Falomo INAF Observatory of Padova, Italy WORKSHOP: Imaging at the E-ELT 29 May 2009, Garching Resolved stellar population in Virgo (high SB) Detailed View of high
arxiv: v2 [astro-ph.ga] 30 Oct 2012
![arxiv: v2 [astro-ph.ga] 30 Oct 2012](/thumbs/91/105035520.jpg "arxiv: v2 [astro-ph.ga] 30 Oct 2012") Mon. Not. R. Astron. Soc. 000, 000 000 (0000) Printed 9 November 2018 (MN LATEX style file v2.2) Star formation histories of resolved galaxies. I. The method Emma E. Small 1, David Bersier 1 and Maurizio
Mon. Not. R. Astron. Soc. 000, 000 000 (0000) Printed 9 November 2018 (MN LATEX style file v2.2) Star formation histories of resolved galaxies. I. The method Emma E. Small 1, David Bersier 1 and Maurizio
Studying stars in M31 GCs using NIRI and GNIRS
 Studying stars in M31 GCs using NIRI and GNIRS Ricardo Schiavon Gemini Observatory GSM 2012 San Francisco July 19, 2012 Collaborators Andy Stephens (Gemini) Nelson Caldwell (SAO) Matthew Shetrone (HET)
Evolution Beyond the Red Giants
 Evolution Beyond the Red Giants Interior Changes Sub-giant star 1 Post-Helium Burning What happens when there is a new core of non-burning C and O? 1. The core must contract, which increases the pressure
Before proceeding to Chapter 20 More on Cluster H-R diagrams: The key to the chronology of our Galaxy Below are two important HR diagrams:
 Before proceeding to Chapter 20 More on Cluster H-R diagrams: The key to the chronology of our Galaxy Below are two important HR diagrams: 1. The evolution of a number of stars all formed at the same time
Are Low Surface Brightness Discs Young?
 Are Low Surface Brightness Discs Young? Paolo Padoan Theoretical Astrophysics Center, Juliane Maries Vej 30, DK-2100 Copenhagen, DK Raul Jimenez arxiv:astro-ph/9609091v1 12 Sep 1996 Royal Observatory,
Revision of Galaxy SEDs with New Stellar Models
 Revision of Galaxy SEDs with New Stellar Models Claus Leitherer (STScI) 11/18/08 Claus Leitherer: Revision of Galaxy SEDs 1 Use galaxy SED for the determination of stellar content, i.e., SFR(t) or M Analysis
arxiv: v1 [astro-ph.ga] 6 Apr 2010
![arxiv: v1 [astro-ph.ga] 6 Apr 2010](/thumbs/92/109546215.jpg "arxiv: v1 [astro-ph.ga] 6 Apr 2010") Mem. S.A.It. Vol. 1, 1 c SAIt 2008 Memorie della Some caveats about the evolution of the N/O abundance and the star formation history. arxiv:1004.0754v1 [astro-ph.ga] 6 Apr 2010 M. Mollá 1 and M. Gavilán
Mem. S.A.It. Vol. 1, 1 c SAIt 2008 Memorie della Some caveats about the evolution of the N/O abundance and the star formation history. arxiv:1004.0754v1 [astro-ph.ga] 6 Apr 2010 M. Mollá 1 and M. Gavilán
Measurement of the stellar irradiance
 Measurement of the stellar irradiance Definitions Specific Intensity : (monochromatic) per unit area normal to the direction of radiation per unit solid angle per unit wavelength unit (or frequency) per
arxiv:astro-ph/ v1 15 Jan 2007
 **FULL TITLE** ASP Conference Series, Vol. **VOLUME**, **YEAR OF PUBLICATION** **NAMES OF EDITORS** Reconstructing Star Formation Histories of Galaxies Uta Fritze 1 & Thomas Lilly 2 1 University of Hertfordshire,
ASTRONOMY AND ASTROPHYSICS. Colour transformations for isochrones in the VI-plane. A. Weiss 1 and M. Salaris 2
 Astron. Astrophys. 346, 897 905 (1999) Colour transformations for isochrones in the VI-plane A. Weiss 1 and M. Salaris 2 ASTRONOMY AND ASTROPHYSICS 1 Max-Planck-Institut für Astrophysik, Karl-Schwarzschild-Strasse
Exploring the formation histories of galaxies globular clusters and beyond
 Exploring the formation histories of galaxies globular clusters and beyond Dissertation zur Erlangung des Doktorgrades der Mathematisch-Naturwissenschaftlichen Fakultäten der Georg-August-Universität zu
Stellar Populations: Resolved vs. unresolved
 Outline Stellar Populations: Resolved vs. unresolved Individual stars can be analyzed Applicable for Milky Way star clusters and the most nearby galaxies Integrated spectroscopy / photometry only The most
Using the HR Diagram to Measure the Star Formation Histories of Galaxies. Tammy Smecker-Hane University of California, Irvine
 Using the HR Diagram to Measure the Star Formation Histories of Galaxies Tammy Smecker-Hane University of California, Irvine tsmecker@uci.edu Irvine, California 1 Outline 1. Stellar Evolution Hertzsprung-Russell
The magnitude system. ASTR320 Wednesday January 30, 2019
 The magnitude system ASTR320 Wednesday January 30, 2019 What we measure: apparent brightness How bright a star appears to be in the sky depends on: How bright it actually is Luminosity and its distance
arxiv:astro-ph/ v2 26 Mar 2002
 The Relation between Near-Infrared Luminosity of RGB Bumps and Metallicity of Galactic Globular Clusters Dong-Hwan Cho and Sang-Gak Lee arxiv:astro-ph/0111204v2 26 Mar 2002 Astronomy Program, School of
Dust [12.1] Star clusters. Absorb and scatter light Effect strongest in blue, less in red, zero in radio.
![Dust [12.1] Star clusters. Absorb and scatter light Effect strongest in blue, less in red, zero in radio.](/thumbs/94/121056697.jpg "Dust [12.1] Star clusters. Absorb and scatter light Effect strongest in blue, less in red, zero in radio.") More abs. Dust [1.1] kev V Wavelength Optical Infra-red More abs. Wilms et al. 000, ApJ, 54, 914 No grains Grains from http://www.astro.princeton.edu/~draine/dust/dustmix.html See DraineH 003a, column
More abs. Dust [1.1] kev V Wavelength Optical Infra-red More abs. Wilms et al. 000, ApJ, 54, 914 No grains Grains from http://www.astro.princeton.edu/~draine/dust/dustmix.html See DraineH 003a, column
Data analysis: CMD and SED
 Chapter 5 Data analysis: CMD and SED 5.1 Astrometric reduction Astrometry should be carried out to the objects first to derive celestial coordinates for each star. This is necessary to cross-identify between
Lecture 7: Stellar evolution I: Low-mass stars
 Lecture 7: Stellar evolution I: Low-mass stars Senior Astrophysics 2018-03-21 Senior Astrophysics Lecture 7: Stellar evolution I: Low-mass stars 2018-03-21 1 / 37 Outline 1 Scaling relations 2 Stellar
Population synthesis models
 .. Population synthesis models From stellar evolution models to synthetic populations in the Milky Way Léo Girardi OAPadova INAF Italy LIneA Rio de Janeiro Brazil GAIA/ITN School, Tenerife, Sep. 2013 Léo
Color-Magnitude Diagram Lab Manual
 Color-Magnitude Diagram Lab Manual Due Oct. 21, 2011 1 Pre-Lab 1.1 Photometry and the Magnitude Scale The brightness of stars is represented by its value on the magnitude scale. The ancient Greek astronomer
The stellar populations of the Fornax dwarf spheroidal galaxy
 Astron. Astrophys. 355, 56 68 (2000) ASTRONOMY AND ASTROPHYSICS The stellar populations of the Fornax dwarf spheroidal galaxy I. Saviane 1, E.V. Held 2, and G. Bertelli 3,1 1 Università di Padova, Dipartimento
Where are We Going! How to Calculate Your Own Star!
 Where are We Going! How to build up the galaxies we observe from what we know about stars!! Next presentation: read 2003MNRAS. 341...33 Kauffmann, G et al (1287 citations) and take a look at Tinsley,B.
The needs and desires of stellar population models. Scott Trager
 The needs and desires of stellar population models Scott Trager The needs and desires of stellar population model users Scott Trager Desires/motivation We want to know the star formation histories of galaxies
Announcement: Quiz Friday, Oct 31
 Announcement: Quiz Friday, Oct 31 What is the difference between the giant, horizontal, and asymptotic-giant branches? What is the Helium flash? Why can t high-mass stars support themselves in hydrostatic
Stars, Galaxies & the Universe Announcements. Stars, Galaxies & the Universe Lecture Outline. HW#7 due Friday by 5 pm! (available Tuesday)
") Stars, Galaxies & the Universe Announcements HW#7 due Friday by 5 pm! (available Tuesday) Midterm Grades (points) posted today in ICON Exam #2 next week (Wednesday) Review sheet and study guide posted
Stars, Galaxies & the Universe Announcements HW#7 due Friday by 5 pm! (available Tuesday) Midterm Grades (points) posted today in ICON Exam #2 next week (Wednesday) Review sheet and study guide posted
Stellar Systems with HST
 Stellar Systems with HST (With European Impact) Topics: Surprizing Globular Clusters in the Milky Way The MW Bulge and its Globulars The Bulge, Halo, Stream and Disk of Andromeda Bulges at high redshifts
Techniques for measuring astronomical distances generally come in two variates, absolute and relative.
 Chapter 6 Distances 6.1 Preliminaries Techniques for measuring astronomical distances generally come in two variates, absolute and relative. Absolute distance measurements involve objects possibly unique
Stellar structure and evolution
 Stellar structure and evolution Ulrike Heiter Uppsala University July 2012, Nordic-Baltic Summer School Outline 1. The lives of stars Overview of stellar evolution 2. Physics of stellar evolution Stellar
Devika kamath Institute of Astronomy, KU. Leuven, Belgium
 A NEWLY DISCOVERED STELLAR TYPE: DUSTY POST-RED GIANT BRANCH (POST-RGB) STARS IN THE MAGELLANIC CLOUDS Devika kamath Institute of Astronomy, KU. Leuven, Belgium Collaborators Peter Wood (1), Hans Van Winckel
arxiv: v1 [astro-ph.ga] 23 Jun 2015
![arxiv: v1 [astro-ph.ga] 23 Jun 2015](/thumbs/82/84951145.jpg "arxiv: v1 [astro-ph.ga] 23 Jun 2015") Astronomy& Astrophysics manuscript no. meneses-goytia_et_al_2014b c ESO 2015 June 25, 2015 Single stellar populations in the near-infrared. Synthesis models S. Meneses-Goytia 1, R. F. Peletier 1, S. C.
Astronomy& Astrophysics manuscript no. meneses-goytia_et_al_2014b c ESO 2015 June 25, 2015 Single stellar populations in the near-infrared. Synthesis models S. Meneses-Goytia 1, R. F. Peletier 1, S. C.
Characterisation of the open cluster M67
 Characterisation of the open cluster M67 Author: Facultat de Física, Universitat de Barcelona, Diagonal 645, 828 Barcelona, Spain. Advisor: Carme Jordi Nebot, Eduard Masana Fresno, Lola Balaguer Núñez
arxiv:astro-ph/ v1 24 Aug 1998
 The Age Dependent Luminosities of the Red Giant Branch Bump, Asymptotic Giant Branch Bump, and Horizontal Branch Red Clump arxiv:astro-ph/9808253v1 24 Aug 1998 David R. Alves 1 Lawrence Livermore National
CHEMICAL ABUNDANCE ANALYSIS OF RC CANDIDATE STAR HD (46 LMi) : PRELIMINARY RESULTS
 : PRELIMINARY RESULTS") Dig Sites of Stellar Archeology: Giant Stars in the Milky Way Ege Uni. J. of Faculty of Sci., Special Issue, 2014, 145-150 CHEMICAL ABUNDANCE ANALYSIS OF RC CANDIDATE STAR HD 94264 (46 LMi) : PRELIMINARY
Dig Sites of Stellar Archeology: Giant Stars in the Milky Way Ege Uni. J. of Faculty of Sci., Special Issue, 2014, 145-150 CHEMICAL ABUNDANCE ANALYSIS OF RC CANDIDATE STAR HD 94264 (46 LMi) : PRELIMINARY
Intro to SQL. Two components. Data Definition Language (DDL): create table, etc. Data Manipulation Language (DML):
: create table, etc. Data Manipulation Language (DML):") Intro to SQL Two components Data Definition Language (DDL): create table, etc. Data Manipulation Language (DML): select, insert, delete, update, etc. The basic SELECT statement: Select From Where A1, A2,...AN
Intro to SQL Two components Data Definition Language (DDL): create table, etc. Data Manipulation Language (DML): select, insert, delete, update, etc. The basic SELECT statement: Select From Where A1, A2,...AN
Astronomy 201: Cosmology, Fall Professor Edward Olszewski and Charles Kilpatrick
 Astronomy 201: Cosmology, Fall 2013 Professor Edward Olszewski and Charles Kilpatrick Lab 3, Cluster Hertzsprung-Russell Diagrams and the Age of Stars Due October 22, Worth 32 points You may work in groups