Spectral Energy Distribution of galaxies
|
|
|
- John Harmon
- 6 years ago
- Views:
Transcription
1 Spectral Energy Distribution of galaxies Paola Santini PhD in Astronomy, Astrophysics and Space Science A.A
2 Key points lecture 1 Multiwavalength astronomy: 1. Gives a complete view of the galaxy as a whole 2. Allows to study galaxy evolution with redshift 3. Allows to estimate redshift and physical parameters Bimodality in galaxy properties (holds on average!): o red colours high luminosity large stellar mass typically low SF activity dense environments elliptical/s0 morphology supported by random motions o blue colours low luminosity low stellar mass on going star formation low density environments spiral/irregular morphology supported by rotation Galaxies follow empirical scaling relations connecting the luminosity to the stellar motions (both related to the depth of the DM potential well): o spirals follow the TF o ellipticals follow the FJ, and more in general the FP LF and MF are useful tools to study galaxy populations in a statistical sense 1<z<3 : peak of star formation activity of the Universe

3 Lecture 2 Range: ~ 300 >22000 Å Source of emission/absorption: stars Stellar spectra Initial Mass Function Star Formation History Models of stellar population synthesis Spectral evolution and main spectral features Colours of stellar populations Physical parameters estimation from the spectral continuum
4 Galaxy integrated spectra Integrated spectra: the entire galaxy is observed simultaneously, integrated emission of the spectra of billions of stars (+ gas and dust) Elliptical Spiral
5 Galaxy integrated spectra Integrated spectra: the entire galaxy is observed simultaneously, integrated emission of the spectra of billions of stars (+ gas and dust) Galaxy emission is complex, but we can reconstruct it from stellar emission, which is rather well known. We just need to sum up all the different stellar populations born at different epochs stellar population synthesis Ingredients to build a galaxy spectrum: 1. Stars 2. Initial Mass Function 3. Star Formation History


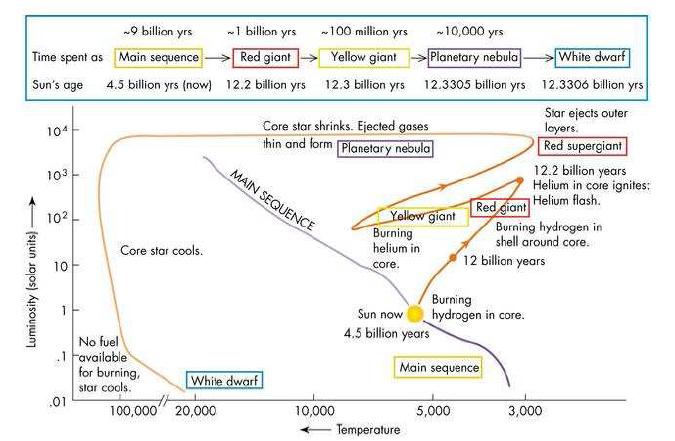
6 Stars HR diagram: every star occupies a position determined by its mass, and moves along this diagram depending on its age Colour! Absolute magnitude!
7 Evolutionary track Stars
8 Stars λ peak (Å) Stellar mass distribution is important!!
![Stars Temperature (which depends on the mass) is important for 2 reasons: 1. it shifts the peak of black body emission Black body emission: radiation emitted by a body in thermal equilibrium (i.e. at constant temperature) B(ν,T) = 2hν 3 1 c 2 hν e B(λ,T) = 2hc 2 1 λ 5 hc e kt 1 ktλ 1 [ Wm 2 sr 1 Hz 1 ] [ Wm 2 sr 1 cm 1 ] Wien s law λ max T = 0.](/docs-images/73/68977034/images/9-2.jpg "29cmK 2. it determines the atom ionization level at surface Photons with energy > E ion are absorbed by neutral atoms and ionize them. Hydrogen: E ion =13.")
 Helium: E ion =54.")
9 Stars Temperature (which depends on the mass) is important for 2 reasons: 1. it shifts the peak of black body emission Black body emission: radiation emitted by a body in thermal equilibrium (i.e. at constant temperature) B(ν,T) = 2hν 3 1 c 2 hν e B(λ,T) = 2hc 2 1 λ 5 hc e kt 1 ktλ 1 [ Wm 2 sr 1 Hz 1 ] [ Wm 2 sr 1 cm 1 ] Wien s law λ max T = 0.29cmK 2. it determines the atom ionization level at surface Photons with energy > E ion are absorbed by neutral atoms and ionize them. Hydrogen: E ion =13.6eV (λ~912å, T eff ~ K): if T eff >~ K: all H is ionized (no absorption); if T eff <~ K: H is neutral, so all photons at energy > E ion are absorbed and no light is emitted at λ<912å (H is very abundant, large cross section) Helium: E ion =54.4eV (λ~228å, T eff ~10 5 K): stars are not hot enough to completely ionize He He absorption at λ<~228å heavier elements: partially ionized absorption lines
: change in energy level (ΔE=hν) of the electron (e.g. Hα 3 2 : the electron falls from n=3 to n=2 in the atom).")
 it can ionize the atom (Lyman limit: 912Å; Balmer limit: 3646Å).")
10 Atomic transitions and series limit Hydrogen energy levels Transition (absorption or emission): change in energy level (ΔE=hν) of the electron (e.g. Hα 3 2 : the electron falls from n=3 to n=2 in the atom). Limit: limit to reach the continuum; if a photon has more energy than this threshold (shorter wavelength) it can ionize the atom (Lyman limit: 912Å; Balmer limit: 3646Å).
11 Stars λ peak (Å) Stellar mass distribution is important!!
12 Stars Luminosity! Temperature! Duration of MS phase! Mass!
 low M! low T! long age!")
13 Stars high M! high T! short age! Lyman break Balmer break Note the displacement of the BB peak. No emission at λ<228å (neutral He absorption) low M! low T! long age! No emission at λ<912å for stars with T<T ionh due to absorption from neutral H)


14 Stars low M! low T! long age! Low T allows the formation of molecules many metals absorption lines. Solar like star. The BB spectrum can be recognized. Several metals absorption lines. 4000Å break : caused by the absorption of Ca, Mg, etc. Note the displacement of the BB peak. No or few metal lines. Balmer absorption lines due to Hydrogen excitation. Balmer limit or Balmer break. high M! high T! short age! T>T ionh : very little H absorption. Absorption lines due to HeI and HeII excitation Stellar spectra also depend on metal abundance
15 Galaxy integrated spectra Integrated spectra: the entire galaxy is observed simultaneously, integrated emission of the spectra of billions of stars (+ gas and dust) Galaxy emission is complex, but we can reconstruct it from stellar emission, which is known rather well. We just need to sum up all the different stellar populations born at different epochs stellar population synthesis Ingredients to build a galaxy spectrum: 1. Stars Stellar mass is important!! (it determines L and T) 2. Initial Mass Function 3. Star Formation History Weigth function for stellar spectra
16 Stellar Initial Mass Function (IMF) Mass distribution of stars at birth φ(m) = d(n /V ) dm = dn dm When building a galaxy spectrum, the IMF represents a weight function for the components of different stellar mass of a stellar population (i.e. a group of stars born at the same time) Salpeter (1955) φ(m) m α α = 2.35 The total mass is dominated by low M stars Assumption: the IMF is universal (the same at all epochs and in all environments). Possible dependence of the IMF on time and/or metallicity and/or environment is an open problems of modern astrophysics.
17 Stellar Initial Mass Function (IMF) Though in principle it s just a matter of counting stars, it is not easily measured: need to observe young environments, otherwise giant stars will be dead need to observe a single population: SF regions (young) are dusty, observations are complex and only feasible for the largest stars globular clusters (most of the stars at the same stage of stellar evolution) are old and lack massive stars
18 Galaxy integrated spectra Integrated spectra: the entire galaxy is observed simultaneously, integrated emission of the spectra of billions of stars (+ gas and dust) Galaxy emission is complex, but we can reconstruct it from stellar emission, which is known rather well. We just need to sum up all the different stellar populations born at different epochs stellar population synthesis Ingredients to build a galaxy spectrum: 1. Stars Stellar mass is important!! (it determines L and T) 2. Initial Mass Function Weight function 3. Star Formation History
. At the same time, new stellar populations are created in subsequent star formation events.")
19 Star Formation History (SFH) Average mass of stars created per unit time as a function of time A gas cloud fragments and forms a first population of stars, whose mass is distributed according to the IMF. As time goes by, the initial stellar mix changes (more massive stars die within few Myr). At the same time, new stellar populations are created in subsequent star formation events. The evolution of the star formation rate (stellar mass/unit time) with time is described by the SFH. Therefore, the SFH regulates the stellar mix with time. The SFH is arbitrary, and to some extent random. We can only attempt simple parameterizations. Three simple cases: Instantaneous burst Constant star formation rate Exponential law SFH(t) = δ(t t 0 ) SFH(t) = const SFH(t) = τ 1 t /τ e (arbitrary normalization) (exponentially declining SFH are a good approximation)
20 Star Formation History (SFH) Real SFH may be much more complicated SFH according to hydrodynamical simulations SFH(t) = δ(t t 0 ) SFH(t) = const SFH(t) = τ 1 t /τ e Simha et al., 2014
21 Galaxy integrated spectra Integrated spectra: the entire galaxy is observed simultaneously, integrated emission of the spectra of billions of stars (+ gas and dust) Galaxy emission is complex, but we can reconstruct it from stellar emission, which is known rather well. We just need to sum up all the different stellar populations born at different epochs stellar population synthesis Ingredients to build a galaxy spectrum: 1. Stars Stellar mass is important!! (it determines L and T) 2. Initial Mass Function Weight function 3. Star Formation History Regulates the evolution of the stellar mix with time Let s put things together!
22 Stellar population synthesis Summing up the spectra of co eval stellar populations with different age Spectrum of a simple/ single stellar population (SSP) f λ SSP (t,z) = IMF (weight) (assumed universal) M max M min φ(m) f λ (m,t,z)dm Stellar spectrum (M, t and Z are fundamental parameters) Spectrum depends on metallicity: the surface temperature depends on the abundance of metals Integrated spectrum of the galaxy (composite stellar population) f λ gal (t,z) = t 0 f λ SSP (t t',z)sfh(t')dt' Rate at which new stellar populations are formed
23 Spectral evolution: instantaneous burst SFH(t) = δ(t t 0 ) 504Å (24.6eV): HeI ionization 228Å (54.4eV): HeII ionization 912Å (13.6eV): Lyman limit neutral H absorption 3646Å (3.4eV): Balmer limit maximum at age Gyr Red giants Immediately after burst Spectrum is dominated by high M stars (despite their low number) very bright and hot (short λ) emission at λ<912å (H is completely ionized and does not absorb photons) After a few Myr UV decreases: most massive stars disappear rapidly 912 Å cut: neutral H absorption (H not fully ionized because of lower T) near IR increases: red giants emission Increasing age UV decreases rapidly (more rapid evolution of high M stars) opt/near IR decreases slowly (low M stars die at a slower rate) As a consequence, spectra get redder with age White dwarfs Bruzual & Charlot 1993
24 Spectral evolution: constant SFH SFH(t) = const UV: after some time it does not change anymore: massive stars die but they are continuously replaced by new ones. If SF is prolonged in time UV emission (Attention! We are not considering dust yet) Therefore, if the galaxy emits in the UV, it means that it is forming stars since at least several Myr. UV emission is a tracer of SFR Opt/near IR: increases because evolved stars accumulate (the lifetime of low M ones is larger that the age of the Universe). Slow increase because they are not very luminous. near IR emission is a measure of the total stellar mass (dominated by low M stars remember the IMF) Bruzual & Charlot 1993
25 Spectral evolution: exponential SFH SFH(t) = τ 1 t /τ e SFH decreases, but does not stop (~ intermediate case). UV: increases for some time (massive stars are accumulated), then decreases (massive stars disappear faster than are created), but slower than the burst case Opt/near IR: increases slowly, then decreases (but, as always, slower than the UV and slower than the burst case) Bruzual & Charlot 1993
26 Lyman break (spectral discontinuity) Spectral features It is the end of the Lyman series: 912Å ionization energy. Can be observed in presence of neutral Hydrogen (T eff <~ K). Bruzual & Charlot 1993 Rapid increase at ~10Myr: most massive stars evolve off the MS and ionizing photons are no more produced. Decrease at ~1Gyr: low mass galaxies evolve off the MS and UV photons are generated again by white dwarfs. This rapid evolution is washed out by the dispersion of stellar ages when the SF is prolonged in time. Thus, a large amplitude of the Lyman break indicates that SF occurred recently, and on a short time scale. However, the interpretation of the break is complicated by the sharp absorption possibly produced by B ν (912 A ) = F ν (λ)dλ F ν (λ)dλ Instantaneous burst Constant SFH neutral H in the ISM or IGM. Bruzual & Charlot 1993 τ
27 4000Å break (spectral discontinuity) Spectral features It is caused by several features of absorption of metals (Ca, Mg, etc.) in the stellar atmospheres. It increases with age and metallicity (age indicator, but trends with metallicity). Gorgas et al D 4000 = F ν (λ)dλ F ν (λ)dλ Poggianti & Barbaro 1997 Bruzual & Charlot 1993
28 Balmer break Spectral features It is the end of the Balmer series: 3646Å energy needed for an electron to escape from level 2. It is maximum at age 0.3 1Gyr (spectral type A).. Several spectral indices have been defined to measure the Balmer break. These are sensitive to the abundance of certain elements and to the age of the stellar population. Some indices are measured in terms of an equivalent width (see next lecture) EW = Bruzual & Charlot 1993 Poggianti & Barbaro 1997 line F cont F ν (λ) dλ F cont
 of the nearby continuum flux that contains the same power as the line. Large EW pronounced line compared to the continuum.")
29 Equivalent Width Measure of the intensity of the line, independently on its profile, compared to the continuum. EW: width (in λ or ν) of the nearby continuum flux that contains the same power as the line. Large EW pronounced line compared to the continuum. For emission, the EW can be very large if continuum is small. EW = λ 2 λ 1 F c F λ F c dλ EW = λ 2 λ 1 F λ F c F c dλ F c F λ
30 Balmer break Spectral features It is the end of the Balmer series: 3646Å energy needed for an electron to escape from level 2. It is maximum at age 0.3 1Gyr (spectral type A).. Several spectral indices have been defined to measure the Balmer break. These are sensitive to the abundance of certain elements and to the age of the stellar population. Some indices are measured in terms of an equivalent width (see next lecture) EW = Bruzual & Charlot 1993 Poggianti & Barbaro 1997 line F cont F ν (λ) dλ F cont
31 Age metallicity degeneracy Age: spectra become redder as the galaxy ages, since more massive stars evolve off the MS. Metallicity: spectra become redder as the metal content increases, due to a combination of line blanketing effects (spectral light decrease due to unresolved absorption lines) and higher opacities in the stellar atmospheres, which cause the effective temperature to decrease (metals block the escape of photons and surface temperature is lower). The spectra of metal rich galaxies are redder Same age metal poor The spectra of old galaxies are redder Same metallicity young metal rich old
32 Age metallicity degeneracy young & metal rich old & metal poor Chavez & Bertone 2011


, not by stars")
33 Galaxy spectra morphological type Ellipticals: redder objects, reproduced by synthetic spectra with long age and short τ: no on going SF, old stellar populations Spirals: bluer objects, reproduced by synthetic spectra with shorter age and longer τ: SF prolonged in time, young + old stellar populations Elliptical Spirals Emission lines produced by gas in the ISM (see next lecture), not by stars Bruzual & Charlot 1993
34 Galaxy spectra morphological type Ellipticals: redder objects, reproduced by synthetic spectra with long age and short τ: no on going SF, old stellar populations Spirals: bluer objects, reproduced by synthetic spectra with shorter age and longer τ: SF prolonged in time, young + old stellar populations Bruzual & Charlot 1993 Spectral Energy Distribution (SED) fitting can give strong indications on the SFH

35 Ellipticals: redder objects, reproduced by synthetic spectra with long age and short τ: no on going SF, old stellar populations Galaxy SFH Spirals: bluer objects, reproduced by synthetic spectra with shorter age and longer τ: SF prolonged in time, young + old stellar populations

 It is often useful to consider two bands sampling a spectral")
 Spirals: B V 1 (bulge B V>1) (")
36 Galaxy stellar populations - colours Colours are easier to measure than spectra and give an indication of the stellar populations. Elliptical The optical colour is often quantified as B V (B: ~4400Å, V:~5500Å) It is often useful to consider two bands sampling a spectral feature at a given redshift. Spiral Ellipticals: B V > 1 ( 22<MV< 18) Spirals: B V 1 (bulge B V>1) ( 21<MV< 17) Irregulars: B V < 0.8 ( 18<MV< 10) (Attention! We are not considering dust yet)
37 Galaxy stellar populations - colours Colours are easier to measure than spectra and give an indication of the stellar populations. As stellar populations age, the luminosity decreases because of the disappearance of bright main sequence stars and supergiants, and the decrease is more rapid for bluer bands (more massive and hotter stars evolve faster). As a consequence, galaxies become redder with time. Sharp colour increase during the first ~1 2 Gyr massive stars evolve off the main sequence very rapidly. Slow colour increase with time after ~1 2 Gyr old stellar populations are dominated by low mass galaxies, which evolve slowly.


 Bright")
38 elliptical Bimodal colour distribution irregular Baldry et al (ApJ) Bright spiral Faint u - r! u - r!
 is complicating things Absolute mag ~ stellar mass! Faint, blue galaxies.")
39 Galaxy stellar populations - colours Colour is a measure of the age of stellar population Colour ~ age! Baldry et al (ApJ) Red sequence Bright, red, old galaxies. Small dispersion: stars have ~ the same age Blue cloud Remember!! Dust reddening (see lecture 5) is complicating things Absolute mag ~ stellar mass! Faint, blue galaxies. Large dispersion: wide distribution of stellar ages

40 Red sequence in clusters Coma cluster Clusters are dominated by elliptical galaxies Renzini et al Elliptical galaxies follow a tight colour magnitude relation red sequence Thickness of the red sequence is due to the different metallicities Used to search for clusters
41 Galaxy integrated spectra Integrated spectra: the entire galaxy is observed simultaneously, integrated emission of the spectra of billions of stars (+ gas and dust) Elliptical Spiral
 G band: collection of spectral absorption features, predominantly due to iron, produces a depression around")
42 Galaxy integrated spectra Integrated spectra: the entire galaxy is observed simultaneously, integrated emission of the spectra of billions of stars (+ gas and dust) Elliptical Note: this spectrum is slightly shifted in λ (z>0) G band: collection of spectral absorption features, predominantly due to iron, produces a depression around 4100Å
43 Galaxy integrated spectra Integrated spectra: the entire galaxy is observed simultaneously, integrated emission of the spectra of billions of stars (+ gas and dust) Spiral Emission lines due to gas in the ISM heated by OB type stars (see lecture 4) Note: this spectrum is slightly shifted in λ (z>0)
44 Physical parameter estimation from stellar continuum Stellar mass Measured from the overall normalization of the red spectrum (total mass is dominated by low M, low T, long lived stars which emit at near IR λ; need to take into account red giants due to SF) Age Measured from the amplitude of the break (Balmer break and 4000Å break depends on the age) Attention: age metallicity degeneracy! Bruzual & Charlot 1993 SFR (averaged over yr) UV emission indicates on going SF since several Myr


45 Physical parameter estimation from stellar continuum U 360nm B 420nm V 520nm R 650nm I 800nm J 1250nm K 2200nm Multicolour surveys allow us to estimate photometric redshifts and physical parameters by fitting synthetic spectra (SSP + assumed IMF and SFH) Limited by model degeneracy z=1 mag! 3x10 10 <M = 6 x < 9x10 10
46 There s more than stars Galaxies are not made only of stars. They also contain (lots of) gas and dust, and are surrounded by the Intergalactic Medium (IGM) Gas: nebular emission lines HI absorption λ < 912Å Dust: reddens the optical spectrum re emits in the thermal IR IGM: at high z, absorbs part of radiation at λ < 1216Å

47 Key points Galaxy spectra result from the integrated emission of all its components. In this lecture we have considered the contribution of stars: continuum + absorption lines Range: ~ 300 >22000 Å Source of emission/absorption: stars Galaxy stellar spectra depend on the IMF and the SFH Important features: o o o o o o o Lyman break: neutral Hydrogen absorption Balmer break: Balmer limit 4000Å break: caused by metal absorption UV emission indicative of on going SFR Opt/near IR emission indicative of the stellar mass Spectra become redder with age (and with metal abundance) Age/metallicity degeneracy Ellipticals: old stellar populations, red colours; spirals: young + old stellar populations, SF prolonged in time, blue colours
48 Useful bibliography Mo, van den Bosch and White, Galaxy Formation and Evolution, pp Bruzual & Charlot, Spectral evolution of stellar populations using isochrone synthesis, 1993, Astrophysical Journal, vol. 405 Walcher, Groves, Budavari, Dale, Fitting the integrated Spectral Energy Distribution of Galaxies, 2011, Astrophysics and Space Science, vol. 331 (sections 1, 2.1) Madau & Dickinson, Cosmic Star Formation History, 2014, Annual Review of Astronomy and Astrophysics, vol 52 (section 3)
Age Dating A SSP. Quick quiz: please write down a 3 sentence explanation of why these plots look like they do.
 Color is only a weak function of age after ~3Gyrs (for a given metallicity) (See MBW pg 473) But there is a strong change in M/L V and weak change in M/L K Age Dating A SSP Quick quiz: please write down
The Stellar Populations of Galaxies H. W. Rix IMPRS Galaxies Course March 11, 2011
 The Stellar Populations of Galaxies H. W. Rix IMPRS Galaxies Course March 11, 2011 Goal: Determine n * (M *,t age,[fe/h],r) for a population of galaxies How many stars of what mass and metallicity formed
Review from last class:
 Review from last class: Properties of photons Flux and luminosity, apparent magnitude and absolute magnitude, colors Spectroscopic observations. Doppler s effect and applications Distance measurements
Stellar Populations: Resolved vs. unresolved
 Outline Stellar Populations: Resolved vs. unresolved Individual stars can be analyzed Applicable for Milky Way star clusters and the most nearby galaxies Integrated spectroscopy / photometry only The most
Galaxies 626. Lecture 9 Metals (2) and the history of star formation from optical/uv observations
 and the history of star formation from optical/uv observations") Galaxies 626 Lecture 9 Metals (2) and the history of star formation from optical/uv observations Measuring metals at high redshift Metals at 6 How can we measure the ultra high z star formation? One robust
Galaxies 626 Lecture 9 Metals (2) and the history of star formation from optical/uv observations Measuring metals at high redshift Metals at 6 How can we measure the ultra high z star formation? One robust
Review of stellar evolution and color-magnitude diagrams
 Review of stellar evolution and color-magnitude diagrams The evolution of stars can be used to study the properties of galaxies Very characteristic features pinpoint at the age (chemistry) of the stars
Dust [12.1] Star clusters. Absorb and scatter light Effect strongest in blue, less in red, zero in radio.
![Dust [12.1] Star clusters. Absorb and scatter light Effect strongest in blue, less in red, zero in radio.](/thumbs/94/121056697.jpg "Dust [12.1] Star clusters. Absorb and scatter light Effect strongest in blue, less in red, zero in radio.") More abs. Dust [1.1] kev V Wavelength Optical Infra-red More abs. Wilms et al. 000, ApJ, 54, 914 No grains Grains from http://www.astro.princeton.edu/~draine/dust/dustmix.html See DraineH 003a, column
More abs. Dust [1.1] kev V Wavelength Optical Infra-red More abs. Wilms et al. 000, ApJ, 54, 914 No grains Grains from http://www.astro.princeton.edu/~draine/dust/dustmix.html See DraineH 003a, column
Components of Galaxies Stars What Properties of Stars are Important for Understanding Galaxies?
 Components of Galaxies Stars What Properties of Stars are Important for Understanding Galaxies? Temperature Determines the λ range over which the radiation is emitted Chemical Composition metallicities
Chapter 10: Unresolved Stellar Populations
 Chapter 10: Unresolved Stellar Populations We now consider the case when individual stars are not resolved. So we need to use photometric and spectroscopic observations of integrated magnitudes, colors
STAR FORMATION RATES observational overview. Ulrike Kuchner
 STAR FORMATION RATES observational overview Ulrike Kuchner Remember, remember.. Outline! measurements of SFRs: - techniques to see what the SF rate is - importance of massive stars and HII regions - the
Dark Matter. ASTR 333/433 Spring Today Stars & Gas. essentials about stuff we can see. First Homework on-line Due Feb. 4
 Dark Matter ASTR 333/433 Spring 2016 Today Stars & Gas essentials about stuff we can see First Homework on-line Due Feb. 4 Galaxies are made of stars - D. Silva (1990) private communication Stars Majority
Review of stellar evolution and color-magnitude diagrams
 Review of stellar evolution and color-magnitude diagrams The evolution of stars can be used to study the properties of galaxies Very characteristic features pinpoint at the age (chemistry) of the stars
Some HI is in reasonably well defined clouds. Motions inside the cloud, and motion of the cloud will broaden and shift the observed lines!
 Some HI is in reasonably well defined clouds. Motions inside the cloud, and motion of the cloud will broaden and shift the observed lines Idealized 21cm spectra Example observed 21cm spectra HI densities
M31 Color Mag Diagram Brown et al 592:L17-L20!
 The physical origin of the form of the IMF is not well understood Use the stellar mass-luminosity relation and present day stellar luminosity function together with a model of how the star formation rate
The First Galaxies. Erik Zackrisson. Department of Astronomy Stockholm University
 The First Galaxies Erik Zackrisson Department of Astronomy Stockholm University Outline The first galaxies what, when, why? What s so special about them? Why are they important for cosmology? How can we
Lecture Three: Stellar Populations. Stellar Properties: Stellar Populations = Stars in Galaxies. What defines luminous properties of galaxies
 Lecture Three: ~2% of galaxy mass in stellar light Stellar Populations What defines luminous properties of galaxies face-on edge-on https://www.astro.rug.nl/~etolstoy/pog16/ 18 th April 2016 Sparke & Gallagher,
High-redshift galaxies
 High-redshift galaxies Houjun Mo May 4, 2004 Galaxies can now be observed to z 6 Normal galaxies with 0.2 < z < 1 The Lyman-break population at z 3 The sub-mm sources at z 3 Between 1 2, spectroscopy desert,
The Life Histories of Stars I. Birth and Violent Lives
 The Life Histories of Stars I Birth and Violent Lives Stellar evolution--first problem for new discipline of astrophysics What is a star? What is it made of? How does it produce and release energy? How
Where are We Going! How to Calculate Your Own Star!
 Where are We Going! How to build up the galaxies we observe from what we know about stars!! Next presentation: read 2003MNRAS. 341...33 Kauffmann, G et al (1287 citations) and take a look at Tinsley,B.
The Interstellar Medium
 http://www.strw.leidenuniv.nl/~pvdwerf/teaching/ The Interstellar Medium Lecturer: Dr. Paul van der Werf Fall 2014 Oortgebouw 565, ext 5883 pvdwerf@strw.leidenuniv.nl Assistant: Kirstin Doney Huygenslaboratorium
Star Formation Indicators
 Star Formation Indicators Calzetti 2007 astro-ph/0707.0467 Brinchmann et al. 2004 MNRAS 351, 1151 SFR indicators in general! SFR indicators are defined from the X ray to the radio! All probe the MASSIVE
Deriving stellar masses from SDSS
 Deriving stellar masses from SDSS Reference: Bruzual and Charlot 2003MNRAS.344.1000B Kauffmann et al. 2003MNRAS.341.33 Salim et al. 2007ApJS..173..267S Bell et al. 2003ApJS..149..289B Outline! Basic idea!
Lecture 2: Galaxy types, spectra
 Lecture 2: Galaxy types, spectra Galaxies AS 3011 1 Hubble tuning fork this is really just descriptive, but Hubble suggested galaxies evolve from left to right in this picture not unreasonable, perhaps
Lecture 2: Galaxy types, spectra. Galaxies AS
 Lecture 2: Galaxy types, spectra Galaxies AS 3011 1 Hubble tuning fork this is really just descriptive, but Hubble suggested galaxies evolve from left to right in this picture not unreasonable, perhaps
Clicker Question: Clicker Question: What is the expected lifetime for a G2 star (one just like our Sun)?
?") How Long do Stars Live (as Main Sequence Stars)? A star on Main Sequence has fusion of H to He in its core. How fast depends on mass of H available and rate of fusion. Mass of H in core depends on mass
How Long do Stars Live (as Main Sequence Stars)? A star on Main Sequence has fusion of H to He in its core. How fast depends on mass of H available and rate of fusion. Mass of H in core depends on mass
! p. 1. Observations. 1.1 Parameters
 1 Observations 11 Parameters - Distance d : measured by triangulation (parallax method), or the amount that the star has dimmed (if it s the same type of star as the Sun ) - Brightness or flux f : energy
University of Naples Federico II, Academic Year Istituzioni di Astrofisica, read by prof. Massimo Capaccioli. Lecture 16
 University of Naples Federico II, Academic Year 2011-2012 Istituzioni di Astrofisica, read by prof. Massimo Capaccioli Lecture 16 Stellar populations Walter Baade (1893-1960) Learning outcomes The student
Chapter 8: Simple Stellar Populations
 Chapter 8: Simple Stellar Populations Simple Stellar Population consists of stars born at the same time and having the same initial element composition. Stars of different masses follow different evolutionary
Astro-2: History of the Universe
 Astro-2: History of the Universe Lecture 13; May 30 2013 Previously on astro-2 Energy and mass are equivalent through Einstein s equation and can be converted into each other (pair production and annihilations)
Stellar Population Synthesis: The Role of Adaptive Optics
 Stellar Population Synthesis: The Role of Adaptive Optics Jason Melbourne (Caltech) Nearby (2.5 Mpc) Dwarf Irregular Galaxy KKH 98 HST F475W (Blue), HST F814W (Green), Keck AO K-band (red) Melbourne et
High Redshift Universe
 High Redshift Universe Finding high z galaxies Lyman break galaxies (LBGs) Photometric redshifts Deep fields Starburst galaxies Extremely red objects (EROs) Sub-mm galaxies Lyman α systems Finding high
What tool do astronomers use to understand the evolution of stars?
 What tool do astronomers use to understand the evolution of stars? Groups indicate types of stars or stages in their evolution. What is plotted? How does an individual star move around the diagram? What
Gas 1: Molecular clouds
 Gas 1: Molecular clouds > 4000 known with masses ~ 10 3 to 10 5 M T ~ 10 to 25 K (cold!); number density n > 10 9 gas particles m 3 Emission bands in IR, mm, radio regions from molecules comprising H,
Astronomy II (ASTR-1020) Homework 2
 Homework 2") Astronomy II (ASTR-1020) Homework 2 Due: 10 February 2009 The answers of this multiple choice homework are to be indicated on a Scantron sheet (either Form # 822 N-E or Ref # ABF-882) which you are to
Astronomy II (ASTR-1020) Homework 2 Due: 10 February 2009 The answers of this multiple choice homework are to be indicated on a Scantron sheet (either Form # 822 N-E or Ref # ABF-882) which you are to
Stellar populations model predictions in the UV spectral range
 INSTITUTO DE ASTROFÍSICA DE CANARIAS Alexandre Vazdekis M. Koleva, E. Ricciardelli, Falcón-Barroso Stellar populations model predictions in the UV spectral range The UV spectral range The youngest stellar
EVOLUTION OF STARS HERTZSPRUNG-RUSSELL DIAGRAM
 VISUAL PHYSICS ONLINE EVOLUTION OF STARS HERTZSPRUNG-RUSSELL DIAGRAM The total power radiated by a star is called its intrinsic luminosity L (luminosity). The apparent brightness (apparent luminosity)
Lecture 6: Continuum Opacity and Stellar Atmospheres
 Lecture 6: Continuum Opacity and Stellar Atmospheres To make progress in modeling and understanding stellar atmospheres beyond the gray atmosphere, it is necessary to consider the real interactions between
The Birth Of Stars. How do stars form from the interstellar medium Where does star formation take place How do we induce star formation
 Goals: The Birth Of Stars How do stars form from the interstellar medium Where does star formation take place How do we induce star formation Interstellar Medium Gas and dust between stars is the interstellar
Revision of Galaxy SEDs with New Stellar Models
 Revision of Galaxy SEDs with New Stellar Models Claus Leitherer (STScI) 11/18/08 Claus Leitherer: Revision of Galaxy SEDs 1 Use galaxy SED for the determination of stellar content, i.e., SFR(t) or M Analysis
Evolution of Galaxies: IMF SFR - SFH
 Evolution of Galaxies: IMF SFR - SFH J.Köppen joachim.koppen@astro.unistra.fr http://astro.u-strasbg.fr/~koppen/jkhome.html Galactic (Chemical) Evolution is driven by stars which burn hydrogen on the Main
Energy. mosquito lands on your arm = 1 erg. Firecracker = 5 x 10 9 ergs. 1 stick of dynamite = 2 x ergs. 1 ton of TNT = 4 x ergs
 Energy mosquito lands on your arm = 1 erg Firecracker = 5 x 10 9 ergs 1 stick of dynamite = 2 x 10 13 ergs 1 ton of TNT = 4 x 10 16 ergs 1 atomic bomb = 1 x 10 21 ergs Magnitude 8 earthquake = 1 x 10 26
Chapter 16 Lecture. The Cosmic Perspective Seventh Edition. Star Birth Pearson Education, Inc.
 Chapter 16 Lecture The Cosmic Perspective Seventh Edition Star Birth 2014 Pearson Education, Inc. Star Birth The dust and gas between the star in our galaxy is referred to as the Interstellar medium (ISM).
Chapter 11 Review. 1) Light from distant stars that must pass through dust arrives bluer than when it left its star. 1)
 Light from distant stars that must pass through dust arrives bluer than when it left its star. 1)") Chapter 11 Review TRUE/FALSE. Write 'T' if the statement is true and 'F' if the statement is false. 1) Light from distant stars that must pass through dust arrives bluer than when it left its star. 1)
Chapter 11 Review TRUE/FALSE. Write 'T' if the statement is true and 'F' if the statement is false. 1) Light from distant stars that must pass through dust arrives bluer than when it left its star. 1)
Physics Homework Set 2 Sp 2015
 1) A large gas cloud in the interstellar medium that contains several type O and B stars would appear to us as 1) A) a reflection nebula. B) a dark patch against a bright background. C) a dark nebula.
Chapter 16 Lecture. The Cosmic Perspective Seventh Edition. Star Birth Pearson Education, Inc.
 Chapter 16 Lecture The Cosmic Perspective Seventh Edition Star Birth Star Birth 16.1 Stellar Nurseries Our goals for learning: Where do stars form? Why do stars form? Where do stars form? Star-Forming
Effects of Massive Stars
 Effects of Massive Stars Classical HII Regions Ultracompact HII Regions Stahler Palla: Sections 15.1, 15. HII Regions The salient characteristic of any massive star is its extreme energy output, much of
Number of Stars: 100 billion (10 11 ) Mass : 5 x Solar masses. Size of Disk: 100,000 Light Years (30 kpc)
 Mass : 5 x Solar masses. Size of Disk: 100,000 Light Years (30 kpc)") THE MILKY WAY GALAXY Type: Spiral galaxy composed of a highly flattened disk and a central elliptical bulge. The disk is about 100,000 light years (30kpc) in diameter. The term spiral arises from the external
THE MILKY WAY GALAXY Type: Spiral galaxy composed of a highly flattened disk and a central elliptical bulge. The disk is about 100,000 light years (30kpc) in diameter. The term spiral arises from the external
Star-Forming Clouds. Stars form in dark clouds of dusty gas in interstellar space. The gas between the stars is called the interstellar medium.
 Star Birth Chapter 16 Lecture 16.1 Stellar Nurseries The Cosmic Perspective Our goals for learning: Where do stars form? Why do stars form? Seventh Edition Star Birth Where do stars form? Star-Forming
The physics of stars. A star begins simply as a roughly spherical ball of (mostly) hydrogen gas, responding only to gravity and it s own pressure.
 hydrogen gas, responding only to gravity and it s own pressure.") Lecture 4 Stars The physics of stars A star begins simply as a roughly spherical ball of (mostly) hydrogen gas, responding only to gravity and it s own pressure. X-ray ultraviolet infrared radio To understand
Lecture 4 Stars The physics of stars A star begins simply as a roughly spherical ball of (mostly) hydrogen gas, responding only to gravity and it s own pressure. X-ray ultraviolet infrared radio To understand
NSCI 314 LIFE IN THE COSMOS
 NSCI 314 LIFE IN THE COSMOS 2 BASIC ASTRONOMY, AND STARS AND THEIR EVOLUTION Dr. Karen Kolehmainen Department of Physics CSUSB COURSE WEBPAGE: http://physics.csusb.edu/~karen MOTIONS IN THE SOLAR SYSTEM
M.Phys., M.Math.Phys., M.Sc. MTP Radiative Processes in Astrophysics and High-Energy Astrophysics
 M.Phys., M.Math.Phys., M.Sc. MTP Radiative Processes in Astrophysics and High-Energy Astrophysics Professor Garret Cotter garret.cotter@physics.ox.ac.uk Office 756 in the DWB & Exeter College Radiative
Chapter 16: Star Birth
 Chapter 16 Lecture Chapter 16: Star Birth Star Birth 16.1 Stellar Nurseries Our goals for learning: Where do stars form? Why do stars form? Where do stars form? Star-Forming Clouds Stars form in dark clouds
Reminders! Observing Projects: Both due Monday. They will NOT be accepted late!!!
 Reminders! Website: http://starsarestellar.blogspot.com/ Lectures 1-15 are available for download as study aids. Reading: You should have Chapters 1-14 read. Read Chapters 15-17 by the end of the week.
Outline. Walls, Filaments, Voids. Cosmic epochs. Jeans length I. Jeans length II. Cosmology AS7009, 2008 Lecture 10. λ =
 Cosmology AS7009, 2008 Lecture 10 Outline Structure formation Jeans length, Jeans mass Structure formation with and without dark matter Cold versus hot dark matter Dissipation The matter power spectrum
Stars + Galaxies: Back of the Envelope Properties. David Spergel
 Stars + Galaxies: Back of the Envelope Properties David Spergel Free-fall time (1) r = GM r 2 (2) r t = GM 2 r 2 (3) t free fall r3 GM 1 Gρ Free-fall time for neutron star is milliseconds (characteristic
Stars: some basic characteristics
 Stars: some basic characteristics Stars! How bright are they? How massive are they? What are the different types? How long do they live? How hot are they? Stellar brightness and luminosity The apparent
Lecture 11: Ages and Metalicities from Observations. A Quick Review. Multiple Ages of stars in Omega Cen. Star Formation History.
 Ages from main-sequence turn-off stars Lecture 11: Main sequence lifetime: Ages and Metalicities from Observations R diagram lifetime = fuel / burning rate MV *1 M ' L ' MS = 7 10 9 ) ) M. ( L. ( A Quick
Remember from Stefan-Boltzmann that 4 2 4
 Lecture 17 Review Most stars lie on the Main sequence of an H&R diagram including the Sun, Sirius, Procyon, Spica, and Proxima Centauri. This figure is a plot of logl versus logt. The main sequence is
Astronomy 1 Fall 2016
 Astronomy 1 Fall 2016 Lecture11; November 1, 2016 Previously on Astro-1 Introduction to stars Measuring distances Inverse square law: luminosity vs brightness Colors and spectral types, the H-R diagram
Astr 323: Extragalactic Astronomy and Cosmology. Spring Quarter 2014, University of Washington, Željko Ivezić. Lecture 1:
 Astr 323: Extragalactic Astronomy and Cosmology Spring Quarter 2014, University of Washington, Željko Ivezić Lecture 1: Review of Stellar Astrophysics 1 Understanding Galaxy Properties and Cosmology The
Atoms and Spectroscopy
 Atoms and Spectroscopy Lecture 3 1 ONE SMALL STEP FOR MAN ONE GIANT LEAP FOR MANKIND 2 FROM ATOMS TO STARS AND GALAXIES HOW DO WE KNOW? Observations The Scientific Method Hypothesis Verifications LAW 3
LECTURE 1: Introduction to Galaxies. The Milky Way on a clear night
 LECTURE 1: Introduction to Galaxies The Milky Way on a clear night VISIBLE COMPONENTS OF THE MILKY WAY Our Sun is located 28,000 light years (8.58 kiloparsecs from the center of our Galaxy) in the Orion
Lecture 27 The Intergalactic Medium
 Lecture 27 The Intergalactic Medium 1. Cosmological Scenario 2. The Ly Forest 3. Ionization of the Forest 4. The Gunn-Peterson Effect 5. Comment on HeII Reionization References J Miralda-Escude, Science
9. Evolution with redshift - z > 1.5. Selection in the rest-frame UV
 11-5-10see http://www.strw.leidenuniv.nl/ franx/college/galaxies10 10-c09-1 11-5-10see http://www.strw.leidenuniv.nl/ franx/college/galaxies10 10-c09-2 9. Evolution with redshift - z > 1.5 Selection in
OPEN CLUSTER PRELAB The first place to look for answers is in the lab script!
 NAME: 1. Define using complete sentences: Globular Cluster: OPEN CLUSTER PRELAB The first place to look for answers is in the lab script! Open Cluster: Main Sequence: Turnoff point: Answer the following
Guiding Questions. Stellar Evolution. Stars Evolve. Interstellar Medium and Nebulae
 Guiding Questions Stellar Evolution 1. Why do astronomers think that stars evolve? 2. What kind of matter exists in the spaces between the stars? 3. What steps are involved in forming a star like the Sun?
Vivienne Wild. Timing the starburst AGN connection
 Vivienne Wild Timing the starburst AGN connection There are many theories successful in explaining the observed correlations between black holes and their host galaxies. In turn, these theories play a
Galaxy formation and evolution. Astro 850
 Galaxy formation and evolution Astro 850 Introduction What are galaxies? Systems containing many galaxies, e.g. 10 11 stars in the Milky Way. But galaxies have different properties. Properties of individual
ASTR2050 Spring Please turn in your homework now! In this class we will discuss the Interstellar Medium:
 ASTR2050 Spring 2005 Lecture 10am 29 March 2005 Please turn in your homework now! In this class we will discuss the Interstellar Medium: Introduction: Dust and Gas Extinction and Reddening Physics of Dust
TA feedback forms are online!
 1 Announcements TA feedback forms are online! find the link at the class website. Please take 5 minutes to tell your TAs your opinion. In case you did not notice, the Final is set for 03/21 from 12:00-3:00
1. Basic Properties of Stars
 1. Basic Properties of Stars This is the Sun during a total eclipse. The Sun, our closest star, is very much representative of the objects that we will study during this module, namely stars. Much of the
Lecture 11: Ages and Metalicities from Observations A Quick Review
 Lecture 11: Ages and Metalicities from Observations A Quick Review Ages from main-sequence turn-off stars Main sequence lifetime: lifetime = fuel / burning rate $ M " MS = 7 #10 9 % & M $ L " MS = 7 #10
AST Cosmology and extragalactic astronomy. Lecture 19. Let there be light! Stars...
 AST4320 - Cosmology and extragalactic astronomy Lecture 19 Let there be light! Stars... 1 GMCs are `supersonically turbulent. Turbulence: Starformation Inside GMCs. GMCs are `supersonically turbulent.
Dust. The four letter word in astrophysics. Interstellar Emission
 Dust The four letter word in astrophysics Interstellar Emission Why Dust Dust attenuates and scatters UV/optical/NIR Amount of attenuation and spectral shape depends on dust properties (grain size/type)
Stellar evolution Part I of III Star formation
 Stellar evolution Part I of III Star formation The interstellar medium (ISM) The space between the stars is not completely empty, but filled with very dilute gas and dust, producing some of the most beautiful
arxiv:astro-ph/ v1 26 Jan 2007
 Evolutionary synthesis models for spirals and irregular galaxies arxiv:astro-ph/0701756v1 26 Jan 2007 Mercedes Mollá CIEMAT, Avda. Complutense 22, 28040, Madrid mercedes.molla@ciemat.es Summary. We show
The Formation of Galaxies: connecting theory to data
 Venice, October 2003 The Formation of Galaxies: connecting theory to data Simon D.M. White Max Planck Institute for Astrophysics The Emergence of the Cosmic Initial Conditions > 105 independent ~ 5 measurements
Astr 323: Extragalactic Astronomy and Cosmology. Spring Quarter 2012, University of Washington, Željko Ivezić. Lecture 1:
 Astr 323: Extragalactic Astronomy and Cosmology Spring Quarter 2012, University of Washington, Željko Ivezić Lecture 1: Review of Stellar Astrophysics 1 Understanding Galaxy Properties and Cosmology The
Components of Galaxies Gas The Importance of Gas
 Components of Galaxies Gas The Importance of Gas Fuel for star formation (H 2 ) Tracer of galaxy kinematics/mass (HI) Tracer of dynamical history of interaction between galaxies (HI) The Two-Level Atom
Announcement: Quiz Friday, Oct 31
 Announcement: Quiz Friday, Oct 31 What is the difference between the giant, horizontal, and asymptotic-giant branches? What is the Helium flash? Why can t high-mass stars support themselves in hydrostatic
The Milky Way. Overview: Number of Stars Mass Shape Size Age Sun s location. First ideas about MW structure. Wide-angle photo of the Milky Way
 Figure 70.01 The Milky Way Wide-angle photo of the Milky Way Overview: Number of Stars Mass Shape Size Age Sun s location First ideas about MW structure Figure 70.03 Shapely (~1900): The system of globular
Galaxies 626. Lecture 10 The history of star formation from far infrared and radio observations
 Galaxies 626 Lecture 10 The history of star formation from far infrared and radio observations Cosmic Star Formation History Various probes of the global SF rate: ρ* (z) M yr 1 comoving Mpc 3 UV continuum
Population synthesis models
 Population synthesis models From stellar evolution models to synthetic populations in the Milky Way Léo Girardi OAPadova INAF Italy LIneA Rio de Janeiro Brazil GAIA/ITN School, Tenerife, Sep 2013 Léo Girardi
Interstellar Astrophysics Summary notes: Part 2
 Interstellar Astrophysics Summary notes: Part 2 Dr. Paul M. Woods The main reference source for this section of the course is Chapter 5 in the Dyson and Williams (The Physics of the Interstellar Medium)
Astronomy 1504 Section 002 Astronomy 1514 Section 10 Midterm 2, Version 1 October 19, 2012
 Astronomy 1504 Section 002 Astronomy 1514 Section 10 Midterm 2, Version 1 October 19, 2012 Choose the answer that best completes the question. Read each problem carefully and read through all the answers.
Astronomy 10 Test #2 Practice Version
 Given (a.k.a. `First ) Name(s): Family (a.k.a. `Last ) name: ON YOUR PARSCORE: `Bubble your name, your student I.D. number, and your multiple-choice answers. I will keep the Parscore forms. ON THIS TEST
How to measure star formation rates in galaxies?
 How to measure star formation rates in galaxies? Véronique Buat 1 1. Aix-Marseille Université, CNRS, LAM (Laboratoire d Astrophysique de Marseille) UMR7326, 13388, Marseille, France Our knowledge of cosmic
6. Interstellar Medium. Emission nebulae are diffuse patches of emission surrounding hot O and
 6-1 6. Interstellar Medium 6.1 Nebulae Emission nebulae are diffuse patches of emission surrounding hot O and early B-type stars. Gas is ionized and heated by radiation from the parent stars. In size,
Electromagnetic Spectra. AST443, Lecture 13 Stanimir Metchev
 Electromagnetic Spectra AST443, Lecture 13 Stanimir Metchev Administrative Homework 2: problem 5.4 extension: until Mon, Nov 2 Reading: Bradt, chapter 11 Howell, chapter 6 Tenagra data: see bottom of Assignments
Birth & Death of Stars
 Birth & Death of Stars Objectives How are stars formed How do they die How do we measure this The Interstellar Medium (ISM) Vast clouds of gas & dust lie between stars Diffuse hydrogen clouds: dozens of
BUILDING GALAXIES. Question 1: When and where did the stars form?
 BUILDING GALAXIES The unprecedented accuracy of recent observations of the power spectrum of the cosmic microwave background leaves little doubt that the universe formed in a hot big bang, later cooling
Prof. Jeff Kenney Class 4 May 31, 2018
 Prof. Jeff Kenney Class 4 May 31, 2018 Which stellar property can you estimate simply by looking at a star on a clear night? A. distance B. diameter C. luminosity D. surface temperature E. mass you can
The needs and desires of stellar population models. Scott Trager
 The needs and desires of stellar population models Scott Trager The needs and desires of stellar population model users Scott Trager Desires/motivation We want to know the star formation histories of galaxies
HR Diagram, Star Clusters, and Stellar Evolution
 Ay 1 Lecture 9 M7 ESO HR Diagram, Star Clusters, and Stellar Evolution 9.1 The HR Diagram Stellar Spectral Types Temperature L T Y The Hertzsprung-Russel (HR) Diagram It is a plot of stellar luminosity
Today in Astronomy 142
 Normal stars: the main sequence Relationships among luminosity, mass and effective temperature Stellar evolution Changes on the main sequence Shell hydrogen fusion and subgiants Today in Astronomy 142
An analogy. "Galaxies" can be compared to "cities" What would you like to know about cities? What would you need to be able to answer these questions?
 An analogy "Galaxies" can be compared to "cities" What would you like to know about cities? how does your own city look like? how big is it? what is its population? history? how did it develop? how does
The Milky Way Galaxy. Some thoughts. How big is it? What does it look like? How did it end up this way? What is it made up of?
 Some thoughts The Milky Way Galaxy How big is it? What does it look like? How did it end up this way? What is it made up of? Does it change 2 3 4 5 This is not a constant zoom The Milky Way Almost everything
HII regions. Massive (hot) stars produce large numbers of ionizing photons (energy above 13.6 ev) which ionize hydrogen in the vicinity.
 stars produce large numbers of ionizing photons (energy above 13.6 ev) which ionize hydrogen in the vicinity.") HII regions Massive (hot) stars produce large numbers of ionizing photons (energy above 13.6 ev) which ionize hydrogen in the vicinity. Detailed nebular structure depends on density distribution of surrounding
HII regions Massive (hot) stars produce large numbers of ionizing photons (energy above 13.6 ev) which ionize hydrogen in the vicinity. Detailed nebular structure depends on density distribution of surrounding
Characterising the last 8 Gyr. The present-day Universe
 Characterising the last 8 Gyr The present-day Universe 1 Luminosity and mass functions Redshift survey Apparent magnitude limited e.g., SDSS 14.5
Galaxies 626. Lecture 5
 Galaxies 626 Lecture 5 Galaxies 626 The epoch of reionization After Reionization After reionization, star formation was never the same: the first massive stars produce dust, which catalyzes H2 formation