THRUST CHAMBER DYNAMICS AND PROPULSIVE PERFORMANCE OF AIRBREATHING PULSE DETONATION ENGINES
|
|
|
- Florence Theodora Chandler
- 5 years ago
- Views:
Transcription
1 The Pennsylvania State University The Graduate School Department of Mechanical and Nuclear Engineering THRUST CHAMBER DYNAMICS AND PROPULSIVE PERFORMANCE OF AIRBREATHING PULSE DETONATION ENGINES A Thesis in Mechanical Engineering by Fuhua Ma 003 Fuhua Ma Submitted in Partial Fulfillment of the Requirements for the Degree of Doctor of Philosophy December 003
2 The thesis of Fuhua Ma was received and approved* by the following: Vigor Yang Distinguished Professor of Mechanical Engineering Thesis Advisor Chair of Committee Robert J. Santoro Guillet Professor of Mechanical Engineering John Mahaffy Associate Professor of Mechanical Engineering Robert F. Kunz Associate Professor of Aerospace Engineering Richard C. Benson Professor of Mechanical Engineering Head of Department of Mechanical Engineering *Signatures are on file in the Graduate School.
3 iii Abstract Pulse detonation engines (PDEs) have recently been recognized as a promising propulsion technology that offers potential advantages in thermodynamic cycle efficiency, hardware simplicity, and operation scalability. The present work studies the flow dynamics and system performance of airbreathing PDEs with a stoichiometric hydrogen/air mixture. The system includes a supersonic inlet, an air manifold, a rotary valve, a single-tube or multitube combustor, and a convergent-divergent nozzle. The flight condition involves an altitude of 9.3 km and a flight Mach number of.1. The supersonic inlet dynamics is analyzed through axisymmetric two-dimensional simulations based on the Harten-Yee upwind total-variation-diminishing scheme. Turbulence closure is achieved by a two-equation model. In addition to the steady-state inlet flow dynamics, the response of the inlet shock system to downstream disturbances is studied by imposing periodic pressure oscillations at the exit plane. A wide range of fluctuation frequency and amplitude are investigated. In general, the acoustic response of the inlet flow increases with increasing amplitude of the imposed oscillation, but decreases with the frequency. Both one- and two-dimensional simulations based on the recently developed Space-Time conservation element/solution element method are carried out for single-tube PDEs. The two-dimensional code is further parallelized using the message-passinginterface library and a domain decomposition technique for unstructured grid. The flow dynamics, the effects of the operation timing and nozzle configuration on the propulsive performance, and the various loss mechanisms are examined. Results show that an
4 iv optimum cycle frequency exists for a given configuration. For a given frequency and purge time, a longer refilling period increases the specific thrust of PDEs considered. The nozzle studies indicate that the convergent-divergent nozzle significantly increases the propulsive performance. Moreover, the throat area of the convergent-divergent nozzle plays a more important role than the length. Effort is also expended to study the flow dynamics and propulsive performance of multitube PDEs. Comparison with the single-tube results demonstrates that the multitube design improves the engine performance in terms of specific impulse, operation steadiness, and timing range. The effect of the system geometry is partially assessed by considering a free volume between the detonation tubes and the common nozzle. Results indicate that the free volume helps to reduce the imperfect nozzle expansion loss and improve the engine steadiness. However, it also induces more complicated shock waves and increases the internal flow loss. The overall effect is a decrease in the propulsive performance.
5 v Table of Contents List of Figures...viii List of Tables...xiv Nomenclature...xv Acknowledgements...xviii Chapter 1 Introduction Background and Motivation Detonation Physics CJ Theory ZND Detonation Wave Structure ZND Detonation Wave Propagation in a Tube Pulse Detonation Engine Concept Cycle Operation of PDE Potential Advantages of PDE Typical Structure of PDE Literature Survey on PDE Studies Experimental Studies on PDEs Impulse Measurements Detonation Initiation Numerical Studies on PDEs One-Dimensional Numerical Simulations Two-Dimensional Numerical Simulations Effect of Nozzles Multitube PDEs Analytical Studies on PDEs Research Objectives Chapter Supersonic Inlet Dynamics Problem Description Governing Equations Numerical Procedures and Validations Steady-State Flow Analysis Shock/Acoustic-Wave Interactions Conclusions... 79
6 Chapter 3 Quasi-One-Dimensional Analyses of PDEs Space-Time CE/SE Method Introduction to Space-Time CE/SE Method Space-Time CE/SE Method for One-Dimensional Problems Governing Equations Parameter Calibration and Code Validation Parameter Calibration ZND Detonation in a One-Dimensional Tube Flow Through a Convergent-Divergent Nozzle Flow Dynamics Parametric Study Effect of Valve Timing Effect of Nozzle Throat Area Chapter 4 Two-Dimensional Analyses of Single-Tube PDEs Governing Equations Numerical Treatment and Parallel Implementation Model Validation Calculation of Propulsive Performance Straight-Tube PDE Problem Setup Domain Decomposition Boundary Conditions Initial Conditions Detonation Initiation Results Single-Tube PDE with CD Nozzle Flow Evolution Effect of Ambient Flow Propulsive Performance Analytical Prediction of Propulsive Performance Loss Mechanisms Effect of Valve Timing Effect of Nozzle Throat and Length Summary and Conclusions Chapter 5 Two-Dimensional Analyses of Multitube PDEs System Configuration Results and Discussion Flow Evolution...18 vi
7 5.. Propulsive Performance and Loss Mechanisms Effect of Valve Timing Effect of System Geometry Summary and Conclusions Chapter 6 Summary and Future Work Summary Major Contributions and Conclusions Recommendation for Future Work Appendix A Thermodynamic Cycle Efficiencies of Brayton, Humphrey, and Ideal PDE Cycles...19 A.1 Brayton cycle... 0 A. Humphrey cycle... 1 A.3 Ideal PDE cycle... Appendix B Jacobian Matrices for Quasi-One- and Two-Dimensional Systems...3 B.1 Quasi-One-Dimensional System... 3 B. Two-Dimensional System... 4 Appendix C Procedures of Building x-t Diagram...6 Appendix D Space-Time CE/SE Method for Two-Dimensional Problems...7 D.1 Governing Equations and Their Integral Form... 7 D. Triangular Mesh, Conservation Element, and Solution Element... 8 D.3 Basic Solution Procedure D.4 The Extended Scheme D.5 Source Term Treatment D.5.1 Explicit Treatment of Source Term...38 D.5. Implicit Treatment of Source Term...39 Appendix E Reflecting Boundary Conditions on an Inviscid Solid Wall...41 Appendix F Determination of the Time Instant of the Arrival of the First Rarefaction Wave on the Head End...45 Bibliography...49 vii
8 viii List of Figures Fig. 1.1 Steady planar detonation wave in a tube... 5 Fig. 1. Schematic of Rayleigh lines and Hugoniot curve in p ~ 1/ρ plane (adapted from Kuo, 1986)... 7 Fig. 1.3 Variation of physical properties through a ZND detonation wave (adapted from Kuo, 1986)... 1 Fig. 1.4 Schematic of ZND detonation structure in p ~ 1/ρ plane (adapted from Kuo, 1986) Fig. 1.5 Smoked-foil record of a detonation (Strehlow, 1968) Fig. 1.6 ZND detonation propagation in a tube closed at one end Fig. 1.7 Space-time wave diagram for a ZND detonation wave propagation in a tube.. 15 Fig. 1.8 Schematic of pressure profile for a ZND detonation propagation in a tube closed at one end. (adapted from Bussing and Pappas, 1994) Fig. 1.9 Conceptual comparison of PDEs with other engines Fig Schematic of cycle operation for idealized PDE... 0 Fig Anticipated specific impulses of airbreathing engines (Roy, 1999)... 3 Fig. 1.1 Typical structure of airbreathing PDE (Bussing and Pappas, 1996)... 5 Fig Supersonic airbreathing pulse detonation engine Fig..1 Configurations of a mixed-compression supersonic inlet Fig.. Computational domain for inlet study Fig..3 Mach-number, pressure, and vorticity contours with different back pressures under steady-state condition Fig..4 Mach-number and pressure distributions along midline under steady-state condition (p b =.1atm) Fig..5 Pressure distributions along walls and midline of inlet and Mach-number contours within one cycle of oscillation (A = 0.05, f = 500 Hz) Fig..6 Instantaneous shock locations for different cases Fig..7 Shock position ranges with different frequencies Fig..8 Comparison of the amplitude of terminal shock oscillation with analytical result (A = 0.01)... 75
9 Fig..9 Mass response to the pressure oscillation at exit over one cycle Fig..10 Mass averaged stagnation pressure at exit over one cycle Fig..11 Axial velocity, stagnation pressure profiles at exit plane (A = 0.05, f = 500 Hz) Fig..1 Comparison of time averaged axial velocity and stagnation pressure profiles at exit plane Fig. 3.1 Mesh system and CEs/SEs in Space-Time CE/SE method (adopted from Wu, 00) Fig. 3. Comparison of detonation velocity and CJ state between ZND model and CEA Fig. 3.3 Schematic of detonation tube with spark region at closed end... 9 Fig. 3.4 Time evolution of pressure field for ZND problem (grid points = 000) Fig. 3.5 Time evolution of temperature field for ZND problem (grid points = 000) Fig. 3.6 Time evolution of reactant mass ratio field for ZND problem (grid points = 000) Fig. 3.7 Time evolution of velocity field for ZND problem (grid points = 000) Fig. 3.8 Snapshots of pressure field for ZND problem with different grid points Fig. 3.9 Schematic of convergent-divergent nozzle in the validation case Fig Comparison of pressure distributuion with analytical results Fig Configuration of the single tube and CD nozzle in the current study Fig. 3.1 Time periods during one cycle of operation Fig Temporal evolution of pressure field within one cycle of operation (τ cycle = 3 ms, τ close =.1 ms, τ purge = 0.1 ms) Fig x-t diagram for the first cycle and time histories of flow properties at head end under typical PDE operation with CD nozzle (stoichiometric H /air mixture, τ cycle = 3 ms, τ close =.1 ms, τ purge = 0.1 ms). 1 = uniform unburned region, = Taylor expansion waves, 3 = uniform region, 4 = non-simple wave region, 5 = simple wave region Fig x-t diagram for the eighth cycle and time histories of flow properties at head end under typical PDE operation with CD nozzle (stoichiometric H /air mixture, τ cycle = 3 ms, τ close =.1 ms, τ purge = 0.1 ms) Fig Effect of valve close-up time on (a) specific thrust and (b) specific impulse at four different operation frequencies; straight tube with CD nozzle; stoichiometric H /air mixture, h = 9.3 km, M = ix
10 Fig Effects of τ close on (a) specific thrust and (b) specific impulse at three different frequencies for two CD nozzles with different throat areas. The larger one has a diameter of 1 cm and the smaller one 10 cm Fig. 4.1 Generalized impulse curve for single-pulse detonation in straight tube with stoichiometric H /air mixture Fig. 4. Computational domain for straight-tube PDE Fig. 4.3 Schematic of the computational domain decomposed into 64 sub-domains Fig. 4.4 Number of cells of sub-domains Fig. 4.5 x-t diagram for first cycle and time histories of flow properties at head end under typical PDE operation (stoichiometric H /air mixture, τ cycle = 3 ms, τ close =.4 ms, τ purge = 0.1 ms). 1 = unburned region, = Taylor expansion waves, 3 = stationary region, 4 = non-simple wave region, 5 = simple wave region Fig. 4.6 Snapshots of pressure, density and their gradients fields at t = 0.7 ms Fig. 4.7 Time evolution of pressure distribution along centerline during first cycle of operation (τ cycle = 3 ms, τ close =.4 ms, τ purge = 0.1 ms) Fig. 4.8 x-t diagram for fifth cycle and time histories of flow properties at head end under typical PDE operation (stoichiometric H /air mixture, τ cycle = 3 ms, τ close =.4 ms, τ purge = 0.1 ms) Fig. 4.9 Performance parameters of ramjet engine for stiochiometric H /air mixture. 19 Fig Effect of valve close-up time on specific impulse (τ cycle = 3 ms, τ purge = 0.1 ms); straight tube with stoichiometric H /air mixture, h = 9.3 km, M = Fig Computational domain for single-tube PDE Fig. 4.1 Schematic of the computational domain decomposed into 64 sub-domains. 13 Fig Number of cells of sub-domains Fig Time evolution of Mach number field during the first cycle of operation (τ cycle = 3 ms, τ close =.1 ms) Fig Time evolution of density-gradient field during the first cycle of operation (τ cycle = 3 ms, τ close =.1 ms) Fig Time evolution of pressure ( ) and Mach number (---) distributions along centerline during first cycle of operation (τ cycle = 3 ms, τ close =.1 ms). 136 Fig Time histories of (a) pressure and (b) Mach number at midpoints of head end, nozzle throat, and nozzle exit during first cycle of operation (τ cycle = 3 ms, τ close =.1 ms) x
11 Fig Enlarged views of pressure contours at (a) 0.40 ms and (b) 0.65 ms Fig Time history of head-end pressure during first five cycles (τ cycle = 3 ms, τ close =.1ms) Fig. 4.0 Specific impulse and filling length of first five cycles (τ cycle = 3 ms, τ close =.1 ms) Fig. 4.1 Time evolution of density-gradient field during fifth cycle of operation (τ cycle = 3 ms, τ close =.1 ms) Fig. 4. Time histories of pressure and Mach number at midpoint of nozzle exit during fifth cycle of operation (τ cycle = 3 ms, τ close =.1ms) Fig. 4.3 Density-gradient field at t = 14.5 ms, with ambient flow, τ cycle = 3 ms, τ close =.1 ms Fig. 4.4 Close-up view of Mach-number contours at t = ms, with ambient flow Fig. 4.5 Instantaneous thrust and impulse during first five cycles (τ cycle = 3 ms, τ close =.1 ms) Fig. 4.6 Instantaneous impulse of nozzle during fifth cycle (τ cycle = 3 ms, τ close =.1 ms) Fig. 4.7 Schematic of flow-path analysis for PDE performance prediction Fig. 4.8 Instantaneous impulse during steady cycle (τ cycle = 3 ms, τ close =.1 ms) Fig. 4.9 Effect of valve closed time on (a) air-based specific thrust and (b) fuelbased specific impulse at three different operation frequencies; τ purge = 0.1 ms, stoichiometric H /air mixture, h = 9.3 km, M = Fig Instantaneous thrust and impulse during a steady cycle, τ cycle = 3 ms, τ purge = 0.1 ms Fig Effect of purging time on (a) air-based specific thrust and (b) fuel-based specific impulse, τ cycle = 3 ms, τ close =.1 ms Fig. 4.3 Single-tube PDE configurations (tube length = 60 cm, tube height = 16 cm): (a) baseline case, nozzle length = 0 cm, throat height = 1 cm, (b) nozzle length = 15 cm, (c) nozzle length = 1.4 cm, (d) throat height = 9 cm Fig Instantaneous thrust and impulse during steady cycle (τ cycle = 3 ms, τ close =.1 ms) Fig Instantaneous pressure impulse during steady cycle (τ cycle = 3 ms, τ close =.1 ms) xi
12 xii Fig Time history of head-end pressure during steady cycle (τ cycle = 3 ms, τ close =.1 ms) Fig. 5.1 Supersonic airbreathing pulse detonation engine Fig. 5. Operation sequence of a triple-tube PDE Fig. 5.3 Computational domains for multitube PDEs Fig. 5.4 Time evolution of density-gradient field during the first cycle of operation (τ cycle = 3 ms, τ close =.1 ms, and τ purge = 0.1 ms) Fig. 5.5 Time evolution of pressure distribution along centerline of each tube during the first cycle of operation (τ cycle = 3 ms, τ close =.1 ms, and τ purge = 0.1 ms) Fig. 5.6 Time histories of pressure at midpoints of head ends of the bottom, middle, and top tubes during the first cycle of operation (τ cycle = 3 ms, τ close =.1 ms, and τ purge = 0.1 ms) Fig. 5.7 Snapshots of pressure field showing flow interactions among tubes and nozzle during the first cycle (τ cycle = 3 ms, τ close =.1 ms, and τ purge = 0.1 ms) 187 Fig. 5.8 Specific impulse and filling length of the middle tube of the first five cycles (τ cycle = 3 ms, τ close =.1 ms, and τ purge = 0.1 ms) Fig. 5.9 Time evolution of density-gradient field during the fifth cycle of operation (τ cycle = 3 ms, τ close =.1 ms, and τ purge = 0.1 ms) Fig Time evolution of pressure distribution along centerline of each tube during the fifth cycle of operation (τ cycle = 3 ms, τ close =.1 ms, and τ purge = 0.1 ms) Fig Time histories of pressure at midpoints of (a) head ends and (b) exit of the bottom, middle, and top tubes during the fifth cycle of operation (τ cycle = 3 ms, τ close =.1 ms, and τ purge = 0.1 ms) Fig. 5.1 Time histories of Mach number at midpoints of (a) nozzle throat and (b) nozzle exit during the fifth cycle of operation (τ cycle = 3 ms, τ close =.1 ms, and τ purge = 0.1 ms) Fig Instantaneous thrust in (a) axial and (b) vertical directions during the fourth and fifth cycles (τ cycle = 3 ms, τ close =.1 ms, and τ purge = 0.1 ms) Fig Spectra of periodic instantaneous axial thrusts of single-tube and tripletube PDEs with operation timing of τ cycle = 3 ms, τ close =.1 ms, and τ purge = 0.1 ms Fig Instantaneous pressure thrust and impulse during the fifth cycle (τ cycle = 3 ms, τ close =.1 ms, and τ purge = 0.1 ms)... 0
13 Fig Axial and vertical velocity profiles at nozzle exit plane during the fifth cycle of operation (τ cycle = 3 ms, τ close =.1 ms, and τ purge = 0.1 ms) Fig Effect of valve close-up time on (a) air-based specific thrust and (b) fuelbased specific impulse; τ purge = 0.1 ms, stoichiometric H /air mixture, h = 9.3 km, M = Fig Time evolution of density-gradient field during the fifth cycle of operation (τ cycle = 3 ms, τ close =.1 ms, and τ purge = 0.1 ms), with free volume Fig Pressure contours and streamlines at t = ms (τ cycle = 3 ms, τ close =.1 ms, and τ purge = 0.1 ms), with free volume Fig. 5.0 Instantaneous axial thrust during the fifth cycle (τ cycle = 3 ms, τ close =.1 ms, and τ purge = 0.1 ms) Fig. A.1 Temperature-entropy diagram Fig. D.1 A triangular cell and its three neighbours... 9 Fig. D. Schematic of CE and SE associated with solution point (j, n)... 9 Fig. E.1 A boundary cell and its mirror image with respect to the solid wall Fig. F.1 Space-time diagram for detonation wave propagation xiii
14 xiv List of Tables Table 1.1 Survey of single-pulse experimental investigations of PDEs... 3 Table 1. Survey of multicycle experimental investigations of PDEs Table 1.3 Survey of one-dimensional numerical simulations of PDEs Table 1.4 Survey of two-dimensional numerical simulations of PDEs Table 1.5 Survey of analytical studies on PDEs... 5 Table 3.1 Comparison of numerical results of different grid resolutions with analytical solutions for the ZND problem Table 4.1 Flow properties at the CJ point and in the uniform region (p 1 = 0.9 atm, T 1 = 8 K, γ = 1.9, R = J/(kg K), q = J/kg) Table 4. Analytically predicted PDE propulsive performance under various refilling Mach numbers and purge-to-open time ratios Table 4.3 Loss summary for baseline case Table 4.4 Performance comparison among different nozzles
15 xv Nomenclature A e c c p E a e t F F F sp f f g I sp i K L L driv M m a area of engine exit plane speed of sound constant-pressure specific heat activation energy per unit mass of reactants specific total energy axial thrust thrust vector specific thrust (air-based) fuel-to-air mass ratio of reactants fuel-to-air mass ratio of the mixture of reactants and purged air gravitational acceleration specific impulse (fuel-based) unit vector in axial direction pre-exponential factor length of detonation tube length of driver gas region Mach number mass flow rate of air delivered to the engine m f mass flow rate of fuel delivered to the combustor n unit vector normal to surface
16 xvi p p e p t1 q q R s T T driv T t1 t u u u e u e pressure area-averaged pressure at engine exit plane total pressure at combustor entrance heat release per unit mass of reactants heat release per unit mass of mixture of reactants and purged air gas constant specific entropy temperature temperature of driver gas total temperature at combustor entrance time axial velocity velocity vector mass-averaged axial velocity at engine exit plane mass-averaged velocity vector at engine exit plane v x y Z β vertical velocity axial coordinate vertical coordinate mass fraction of reactants purge-to-open time ratio γ= specific heat ratio ρ density
17 xvii τ ω time period mass production rate of reactants Subscripts close cycle D e i open purge refill stage during which valve is closed PDE operation cycle detonation wave engine exit plane engine entrance plane stages during which valve is open purging stage refilling stage ambient condition 1 fresh reactant upstream of detonation wave front Chapman-Jouguet state 3 uniform region between the head end and the rear of Taylor wave
18 xviii Acknowledgements With a deep sense of gratitude, first I wish to express my sincere thanks to my advisor, Dr. Vigor Yang, for kindly providing guidance throughout the development of this study. His support, encouragement, and comments have been of greatest help at all times. Sincere thanks also go to Dr. Robert J. Santoro, Dr. John Mahaffy, and Dr. Robert F. Kunz for serving as my committee members. They monitored my work and took effort in reading and giving me with valuable suggestions on the earlier versions of this thesis. This work was supported by the Department of Defense Multidisciplinary University Research Initiative under the Office of Naval Research Grant N , with Gabriel Roy serving as the program manager. The financial support is greatly appreciated. Sincere thanks also go to Dr. Jeong-Yeol Choi for his help on this research, and to Dr. Xiaoyen Wang and Dr. Yuhui Wu for their help on the space-time method. I wish I would never forget the company I had from all the members of our research lab. In particular, I am thankful to Shanwu Wang, Danning You, Ying Huang, Nan Zong, and Yanxing Wang for their help. I take this opportunity to express my love and sincere thanks to my parents for their endless love and support. My appreciation and love also go to my brother and sisters. They taught me the value of hard work by their own examples and provided me enormous support throughout my life. Finally I wish to give a very special thank and all my love to my wife, Chunxia. Her support, love, and understanding have been invaluable to me.
19 1 Chapter 1 Introduction 1.1 Background and Motivation The combustion process is a vital mechanism in most propulsion systems. A combustion process can be characterized as either a deflagration or a detonation. The deflagration is mainly governed by mass and thermal diffusion and has a flame speed of one or more meters per second. Usually, a deflagration process produces a slight decrease in pressure and can be modeled as a constant-pressure combustion process. Engines based on the deflagration process can be constructed to operate at steady state and are easy for design optimization with modular analyses of each subsystem. Most conventional engines, such as turbofans, turbojets, ramjets, and rocket engines, utilize a steady deflagration process. In contrast to deflagration, the detonation process takes place much more rapidly and produces a supersonic combustion wave, or a detonation wave, propagating at around two thousand meters per second toward the unburned reactants. The detonation wave can be described as a strong shock wave coupled to a reaction zone. The shock wave compresses the reactants, acting like a valve between the reactants and products. The reaction thus takes place at a much higher pressure. Since there is not enough time for the pressure to reach its equilibrium, a detonation process closely approximates to a constant-volume combustion process. It is well known that an engine based on a constant-volume combustion process has higher thermodynamic efficiency than that
20 based on a constant-pressure combustion process. The potential advantage in thermodynamic cycle efficiency becomes the primary reason that has been driving people s interests in developing engines that employ detonation processes. Examples of these engine concepts include those employing standing detonation waves, such as the detonation thrusters, the detonation ramjet (dramjet), and the oblique detonation wave engine (ODWE), or those employing intermittent traveling detonation waves, such as the pulse detonation engine (PDE). The engine concepts employing standing detonation waves are hampered by the difficulty in stabilizing the detonation wave. The PDE thus becomes a more practical candidate nowadays. Early work on PDEs dates back to the 1940s (Hoffman, 1940; Nicholls et al., 1957; Dunlap et al., 1958; Krzycki, 196) and was suspended possibly due to the lack of funding in the late 1960s. Interest in PDEs was reignited in the late 1980s by the work of Helman et al. (1986). Recently, the PDEs have been recognized worldwide as a promising propulsion technology that offers potential advantages in thermodynamic cycle efficiency, hardware simplicity, and operation scalability and reliability (Bussing and Pappas, 1996; Kailasanath, 00; Wu et al., 003). Several PDE concepts have been proposed and experimentally investigated in the past. The main challenges are to develop an ignition system for repetitive detonation initiation, to integrate the inlet with the unsteady-operated detonation chamber, and to choose an optimized nozzle to achieve high performance. Although substantial efforts have been made to overcome these challenges, a real PDE-based vehicle has not emerged yet. One of the most important concerns is to estimate the propulsive performance of PDE concepts and to compare it with those of the conventional engines. In parallel to
21 3 experimental investigations, attempts were made both theoretically and numerically to estimate the performance of PDEs. However, a general agreement on the performance has not been reached yet. Most previous numerical simulations were either limited to single-pulse operation with one- and two- dimensional models, or multicycle operation with only one-dimensional models. Very few efforts have been expended to simulate a PDE with multicycle operations using multidimensional models. On the other hand, since the unsteady nature of the PDE is dominated by the unsteady flow dynamics during a steady periodic cycle, it is thus very important to understand the flow dynamics prior to calculating the performance. Also, this understanding may help in improving the PDE designs. Unfortunately, none of the previous studies have ever presented the detailed multidimensional flow evolution within a whole cycle. Hence, the main motivation of this thesis is to establish a multidimensional numerical analysis to examine the flow dynamics involved in PDEs with multicycle operations, to provide a more convincible estimation of the propulsive performance of PDEs, and to investigate the effect of the various design parameters on the performance. 1. Detonation Physics Studies of detonation phenomena date back to the end of the 19th century. The simplest theory was proposed by Chapman (1889) and Jouguet (1905), usually referred to as the CJ theory. It treats the detonation wave as a discontinuity plane in one dimension. This theory can be used to predict the detonation wave velocity without the need to know the details of the chemical reaction and the detonation wave structure. A significant
22 4 advance in the understanding of the detonation wave structure was made independently by Zeldovich (1940) in Russia, von Neumann (194) in the United States, and Döring (1943) in Germany. They considered the detonation wave as a leading planar shock wave with a chemical reaction zone behind the shock. Their treatment has come to be called the ZND model of detonation, and the corresponding detonation wave structure is called the ZND detonation wave structure. Although all the experimentally observed detonation waves have much more complex cellular three-dimensional structures resulting from the strong nonlinear coupling between gasdynamics and chemical kinetics (Glassman, 1996), the CJ theory and the ZND model, which assume a planar onedimensional detonation wave, are still very useful. An overview of them is hence given in this subsection to provide some basic knowledge on detonation physics. More detailed and extended discussions about detonation physics and phenomena can be found from several textbooks (Fickett and David, 1979; Kuo, 1986; Glassman, 1996) CJ Theory For a steady, planar, one-dimensional detonation wave (see Fig. 1.1), with both the reactants and products modeled as the same perfect gas and the detonation wave modeled as a discontinuity plane at which heat addition occurs, the conservations of mass, momentum, and energy in a coordinate system fixed at the wave front give: ρ u = ρ ( u u ) (1.1) 1 D D p + ρ u = p + ρ ( u u ) (1.) 1 1 D D γ p 1 γ p 1 u q ( u u ) γ 1 ρ + + = γ 1 ρ + 1 D D 1 (1.3)
23 5 where the velocities relative to the wave front have already been expressed out with the velocities relative to the tube; u D is the detonation wave velocity, q the heat release per unit mass of reactants due to chemical reaction, and γ the specific heat ratio; ρ, p, and u represent the density, pressure, and velocity, respectively; subscript 1 refers to the state of unburned gas or reactants and subscript for the final state, i.e., the state of the burned gas immediately behind the detonation wave. Since there are only three equations, one extra equation is needed to solve for the four unknowns p, ρ, u and u D. This extra equation will be revealed through the following analysis. u = ud u 0 u 1 = ud (relative velocity) burned gas (p, ρ ) unburned gas (p 1, ρ 1 ) wave front u ud u 1 = 0 (actual velocity) Fig. 1.1 Steady planar detonation wave in a tube Combining the mass and momentum conservation equations leads to the so-called Rayleigh relation, 1 1 ( p p )/( ) = ρ u (1.4) D 1 1 ρ ρ1 Manipulations of Eqs. (1.1) (1.3) yield the following Hugoniot relation, γ p p p p + = q γ 1 ρ ρ ρ ρ 1 ( ) ( 1)( ) 1 1 (1.5) If these two relations are plotted in the p ~ 1/ρ plane, a Rayleigh line and a Hugoniot curve can be constructed. Figure 1. shows the schematic of the Hugoniot
24 6 curve and the Rayleigh line. The point corresponding to the unburned gas state is denoted by A. Apparently, all the Rayleigh lines pass through point A. The possible final states are defined by the intersection of the Rayleigh line and the Hugoniot curve. Among all the straight lines passing through point A, there are two which are tangent to the Hugoniot curve. The corresponding tangent points are generally called as the CJ points, denoted in the figure by point U for the upper CJ point and L for the lower CJ point. The horizontal and vertical lines passing through point A correspond to a constantpressure and a constant-volume process, respectively. The Hugoniot curve is divided into five regions, i.e., regions I~V, by the two tangent lines and the horizontal and vertical lines. Region V is unphysical since the Rayleigh lines defined by Eq. (1.4) cannot have positive slope. Regions I and II are called detonation branch, within which the velocity of the wave front is supersonic; regions III and IV are called deflagration branch, within which the velocity of the wave front is subsonic. The upper CJ point corresponds to a minimum detonation velocity, whereas the lower CJ point corresponds to a maximum deflagration velocity. Through simple mathematical derivations, i.e., equating the slope of the Hugoniot curve to that of the Rayleigh line, the following relation, usually referred to as the CJ condition, can be obtained at the CJ points, u = ud u = γ p/ ρ = c or M = u / c = 1 (1.6) where c is the sound speed of the burned gas, u and M the velocity and Mach number of the burned gas relative to the wave front, respectively. The flow velocity relative to the wave front at the CJ points equaling to the local sound speed is one of the notable
25 characteristics of the CJ points. At the upper CJ point, since u + c = ud, any rarefaction waves arising behind the wave front will not overtake the detonation wave and thus a self-sustained steady detonation wave can be established. 7 I (strong detonation) U upper CJ point II (weak detonation) p V p 1 A III (weak deflagration) IV (strong deflagration) 1/ρ L 1 lower CJ point 1/ρ Fig. 1. Schematic of Rayleigh lines and Hugoniot curve in p ~ 1/ρ plane (adapted from Kuo, 1986) Region I is called the strong-detonation region. In this region, the velocity of the burned gas relative to the wave front is subsonic, i.e., u + c > ud, thus, any rarefaction waves arising behind the wave front will overtake and weaken the detonation wave. As a matter of fact, a strong detonation, also called overdriven detonation, is not stable and is thus seldom observed experimentally. It may, however, appear during a transient process or be generated with a driving piston. Region II is called the weak-detonation region. In this region, the velocity of the burned gas relative to the wave front is supersonic, i.e., u + c < u D. If the ZND detonation wave structure is adopted, the detonation wave can be considered as a shock
26 8 wave and a following heat addition zone. The gas velocity immediately behind the shock relative to the wave front is known to be subsonic from classical shock dynamics theory. On the other hand, it is also well known that for a steady flow in a constant-area tube, the fluid cannot be accelerated from subsonic to supersonic by heat addition. This means that the velocity of the burned gas relative to the wave front cannot be supersonic. Thus, region II is physically impossible as long as the ZND detonation wave structure is assumed. Another discussion leading to the same conclusion can be found in the textbook of Glassman (1996). Region III is called the weak-detonation region. The weak deflagration, or simply the deflagration, is often observed in experiments. A deflagration wave propagates toward the unburned gas at a subsonic velocity. Across a deflagration wave, the velocity of the gas relative to the wave front is accelerated within the subsonic regime, and the pressure is reduced. Region IV is called the strong-deflagration region. Passing through a strongdeflagration wave, the gas velocity relative to the wave front is to be accelerated from subsonic to supersonic. Similar to the discussion for region II, this violates the common conclusion that for a steady flow in a constant-area tube, the fluid cannot be accelerated from subsonic to supersonic by heat addition. Thus, region IV is physically impossible, and a strong deflagration is never observed experimentally. Based on the above discussions, the upper CJ point is the only possible state for a self-sustained steady detonation wave commonly observed. Thus, the CJ condition, Eq. (1.6), can be used as an additional equation along with Eqs. (1.1) ~ (1.3) to solve for the four unknowns aforementioned, i.e., p, ρ, u and u D. It is convenient to find the
27 9 detonation wave Mach number M D first and then express the other unknowns with respect to it. For concision, the corresponding mathematical manipulations are skipped, and the solutions for the unknowns as well as several other properties of the final state are listed as below. M D ud γ 1 q γ 1 q = (1.7) c γ RT γ RT u = M γ RT (1.8) D D 1 u M 1 D = RT1 (1 + γ ) M γ D (1.9) c 1+ γ M D = γ RT1 (1 + γ ) M D (1.10) M M D = γ M D (1.11) p p D γm = 1 + γ (1.1) ρ ρ 1 D D (1 + γ ) M = (1.13) 1+ γm T p/( Rρ) 1+ γm D = T1 p1/( Rρ1) (1 + γ) MD (1.14) where R is the gas constant; T 1 and c 1 are the temperature and sound speed of the unburned gas, respectively; T, c, and M, are the temperature, sound speed, and Mach number of the unburned gas, respectively.
28 10 In most cases, the square of the detonation wave Mach number, M D, is much larger than 1. Some of the above expressions can thus be approximately reduced to the following ones. 1 (1.15) 1 + γ u u D c γ 1 + γ u D (1.16) M 1 (1.17) γ p p γ M (1.18) D + γ 1 1 ρ 1+ γ (1.19) ρ γ 1 γ T γ M D T 1 1+ (1.0) 1.. ZND Detonation Wave Structure The CJ theory brought great success in predicting the detonation wave velocity. It, however, gives no information about the details of the detonation wave structure. In the early 1940s, Zeldovich (1940), von Neumann (194), and Döring (1943) independently extended the CJ theory to consider the detonation wave structure that has become the well-known ZND detonation structure. Their treatment is referred to as the ZND model. According to them, the detonation wave is interpreted as a strong planar shock wave propagating at the CJ detonation velocity, with a chemical reaction region
29 11 followed and coupled to the shock wave. The shock wave compresses and heats the reactants to a temperature at which a reaction takes place at a rate high enough for the ensuring deflagration to propagate as fast as the shock wave. From the energy point of view, the shock wave provides activation energy to ignite reaction, whereas the energy released by reaction keeps the shock moving. Their assumption that no reaction takes place in the shock wave region was based on the fact that the width of the shock wave is in the order of a few mean free paths of the gas molecules, whereas the width of the reaction region is in the order of one centimeter (Kuo, 1986). Figure 1.3 shows schematically the variation of physical properties through a ZND detonation wave. Plane 1 denotes the state of unburned gas. Plane 1' denotes the state immediately after the shock wave. Chemical reaction starts at plane 1' and finishes at plane, at which the CJ state reaches. If a single variable is used to represent the reaction progress or the degree of reaction, it will have a value of 0 at plane 1' and a value of 1 at plane. Generally, the reaction rate, such as that that follows the Arrhenius law, increases with temperature, and the chemical reaction region can be further divided into an induction and a heat addition zone. In the induction zone directly behind the shock wave where the temperature is not very high, the reaction rate is relatively slow and as a result, the temperature, pressure, and density profiles are relatively flat. In the heat addition zone behind the induction zone, the reaction rate increases drastically to high values along with a large amount of heat release from the reaction so that the gas properties change sharply.
30 T, p, ρ 1 shock wave deflagration T p induction zone heat addition zone ρ 1 1' x 1'' Fig. 1.3 Variation of physical properties through a ZND detonation wave (adapted from Kuo, 1986) The ZND detonation wave structure can be also interpreted by Hugoniot curves shown in Fig There are many paths, such as a, b, c, and d, by which a reacting mixture may pass through the detonation wave from the unburned state to the burned state (Kuo, 1986). In the limit of zero chemical-energy release in the shock, a path will reach point s, the intersection of the shock Hugoniot curve and the Rayleigh line, and then the upper CJ point. The point s is referred to as the von Neumann spike. The von Neumann spike pressure can be determined from a normal shock relation: p p s 1 = (1 + γm 1 + γ D ) 1 (1.1) Using Eq. (1.1), the von Neumann spike pressure relates to the CJ pressure as follows: p s p = 1 (1.) p p Hence, the von Neumann spike pressure is about twice of the CJ pressure. 1 1

31 13 The ZND model marks a great advance from the CJ theory in recognizing the detonation wave structure. However, all the experimentally observed detonation waves exhibit much more complex cellular three-dimensional structures. The smoked-foil record of a detonation shown in Fig. 1.5 displays the typical cellular structure (Strehlow, 1968). More detailed discussions about these structures can be obtained from the textbooks of Kuo (1986) and Glassman (1996). s d c U b von Neumann spike Hugoniot curve (q>0) p a p 1 A shock Hugoniot (q=0) 1/ρ 1 L 1/ρ Fig. 1.4 Schematic of ZND detonation structure in p ~ 1/ρ plane (adapted from Kuo, 1986) Fig. 1.5 Smoked-foil record of a detonation (Strehlow, 1968)
32 ZND Detonation Wave Propagation in a Tube This subsection considers the ZND detonation propagation in a constant-area tube that is closed at one end and open at the other, as shown schematically in Fig The tube is initially filled with a static premixed detonable mixture. Detonation is initiated at the closed end and propagates downstream toward the open end. Following the detonation wave is a centered rarefaction wave, known as the Taylor wave, emanating from the closed end to satisfy the stationary boundary condition there. After the passage of the Taylor wave, a uniform region forms. The corresponding wave diagram in the space-time plane is given in Fig Figure 1.8 schematically shows the pressure profile within the tube. The width of the detonation wave is enlarged for visualization. The states 1, s,, and 3 denote the unburned gas state, the von Neumann spike state, the CJ state, and the uniform region state, respectively. The von Neumann spike state and the CJ state can be readily determined using the equations derived in the previous subsection. The focus of this subsection is hence on the solution of the Taylor wave and uniform regions. burned gas wave front u D unburned gas Fig. 1.6 ZND detonation propagation in a tube closed at one end
33 15 3 uniform region tail Taylor wave t u 3 = 0 front detonation wave 1 unburned gas x Fig. 1.7 Space-time wave diagram for a ZND detonation wave propagation in a tube 3 uniform st nt state region n (CJ point) s von Neumann pressure spike detonation wave shock front moves at u D rarefaction Taylor heat waves addition ignition p delay 1,T 1 unburned gas 1 p 3,T 3 p,t p s,t s Fig. 1.8 Schematic of pressure profile for a ZND detonation propagation in a tube closed at one end. (adapted from Bussing and Pappas, 1994) The properties of the uniform region can be obtained as follows. Applying the Riemann invariant relation along the characteristic line passing through the Taylor wave from state to state 3 gets u c = u c γ 1 γ (1.3)
34 where u 3 and c 3 are the velocity and sound speed in the uniform region, respectively. Since u 3 = 0, the above equation yields, 16 c u M c c M 1 3 γ 1 γ 1 γ 1 D 1 = 1 = 1 M = 1 γ D + (1.4) where M is the Mach number of the gas at state expressed with Eq. (1.11). Consequently, the temperature in the uniform region is T T 3 γ 1 MD 1 = 1 γ MD + 1 (1.5) Through an isentropic relation from state to state 3, the pressure can be determined as: p p 3 γ 1 D γ D + γ 1 M 1 = 1 γ M 1 (1.6) The relation of the sound speed c 3 with the detonation wave velocity u D can be obtained by combining Eqs. (1.4), (1.10), and (1.8): c u 3 D M + 1 = (1.7) D MD With the sound speed c 3 available, the length of the uniform region, L const, at a particular instant of time t, can also be determined. Since the rear of the Taylor wave propagates at c 3, thus, L const 3 = c t (1.8) Similar to the previous subsection, considering that the square of the detonation wave Mach number, M D, is much larger than 1, the above expressions, Eqs. (1.4)~ (1.7) can be further simplified with approximation:
35 17 c c 3 γ + 1 (1.9) γ T T 3 γ + 1 γ (1.30) p p 3 γ + 1 γ γ γ 1 (1.31) c3 1 u (1.3) D The length of the uniform region can thus be approximated as: L const 1 = c3t udt (1.33) It indicates that the length of the uniform region is about halfway between the detonation wave front and the head end (Fickett and Davis, 1979). The flow properties within the Taylor wave region, ct 3 x u t, can also be derived. The Riemann invariant relation along the characteristic line from state 3 to the point (x, t) gives: D c = γ u γ 1 c (1.34) where u and c are the velocity and sound speed at point (x, t). On the other hand, since the forward characteristic lines are straight, thus, x t = u + c (1.35) Combination of the above two equations leads to the following solutions of u and c.
36 18 u x = c γ + 1 c t γ c γ 1 x = + c γ + 1 c t γ (1.36) (1.37) Other properties such as the temperature and pressure at point (x, t) are: T γ 1 x = + T3 γ + 1 c3t γ + 1 (1.38) p γ 1 x = + p3 γ + 1 c3t γ + 1 γ γ 1 (1.39)
37 Pulse Detonation Engine Concept The pulse detonation engine (PDE) is an unsteady propulsion device that produces periodic impulse by utilizing repetitive detonations. Based on whether or not to use the ambient air as working fluid, it can be classified as an airbreathing version referred to as the airbreathing PDE and a rocket version referred to as the pulse detonation rocket engine (PDRE). The PDE differs from the conventional engines by its two distinguishing characteristics: unsteady operation and detonation process. It is noteworthy that the PDE concept is also different from the widely known pulsejets, such as the German V-1 buzz bomb used in World War II. These pulsejets employ a deflagration combustion process although they are unsteady engines. A comparison of the PDE with the existing engines is briefly summarized in Fig The cycle operation, potential advantages, and typical structure of the PDE are discussed in detail in the following paragraphs. combustion process deflagration detonation Engines conventional engines (turbojet, ramjet, etc.) pulsejet (e.g., German V-1 buzz bomb ) operation process steady unsteady Pulse Detonation Engine Fig. 1.9 Conceptual comparison of PDEs with other engines
38 Cycle Operation of PDE A typical PDE cycle operation includes four basic processes: initiation of detonation wave, propagation of detonation wave, exhaust of combustion products or the blowdown process, and refilling of fresh reactants (Bussing and Pappas, 1994). These four processes are schematically shown in Fig for an idealized PDE which involves a straight detonation tube along with a valve located at the head end. reactants p 1 p 0 p 3 u 3 = 0 c 3 u a. valve closed d. blowdown Taylor wave detonation wave p 1 p 0 p 0 u= 0 products b. detonation initiation e. blowdown finished p 3 u 3 = 0 c 3 p u D p 1 p 0 p 1 p 0 c. detonation propagation f. refilling Fig Schematic of cycle operation for idealized PDE The cycle begins as the tube is filled with reactants at pressure p 1. The valve is then closed and the detonation is initiated either directly or after a deflagration-todetonation transition (DDT) by an ignition source near the closed end. The detonation wave propagates toward the open end at the CJ detonation velocity u D, usually in the order of 000 m/s. Following the detonation wave is a set of rarefaction waves known as the Taylor wave emanating from the closed end to ensure the zero velocity condition at
39 1 the closed end. The tail of the Taylor wave propagates toward the open end at the local sound speed c 3 which is in the order of 1000 m/s. Between the tail of the Taylor wave and the closed end is a uniform region, as discussed in Section The Taylor wave reduces the CJ pressure (p ) immediately behind the detonation wave to a relatively lower level (p 3 ) in the uniform region. This pressure, usually referred to as the plateau pressure, is still much higher than the ambient pressure (p 0 ) so that thrust is produced on the closed end. When the detonation wave exits the tube, another set of rarefaction waves are generated and propagate back into the tube to reduce the pressure thereby, marking the beginning of the blowdown process. The reflection of these rarefaction waves off the closed end forms another set of rarefaction waves propagating downstream toward the open end, further reducing the chamber. The unsteady blowdown process is characterized by a series of compression and rarefaction waves which are alternately generated from the closed and open ends (Bussing and Pappas, 1994). Eventually, the chamber pressure decays to the ambient level and the blowdown process is finished. Upon the end of the blowdown process, the valve opens to allow for the fresh reactants to be charged into the tube. The valve timing is controlled so that no fresh reactants escape from the open end to the ambient. This requires that the leading fresh reactants should be caught by the detonation wave of the next cycle somewhere within the detonation tube, or ideally, at the exit plane of the detonation tube. After the refilling process finishes, the valve closes and the next cycle begins. In a more practical cycle operation, the refilling process may start when the closed-end pressure decays to a prespecified pressure level instead of the ambient value,
40 to avoid the very low or even negative thrust produced on the closed end during the later period of the blowdown process. In addition, the temperature of the products near the closed end may be still very high and ignite the refilling fresh reactants if they contact directly. This kind of preignition may cause engine unstart. Thus, a purging process, i.e., filling a little inert gas or cold air before filling the reactants, would be necessary to prevent the preignition Potential Advantages of PDE Due to the much more rapid burning or material conversion rate of a detonation process than a deflagration process, PDEs possess several potential advantages over those conventional engines based on the deflagration process. The first and also the most attractive one is the higher thermodynamic cycle efficiency, which is attributed to the facts that a detonation process approximately closes to a constant-volume combustion process (Kailasanath, 00) and that a constant-volume combustion based engine cycle (the Humphrey cycle) has higher thermodynamic cycle efficiency than a constantpressure combustion based engine cycle (the Brayton cycle). The thermodynamic cycle efficiencies of the Brayton, Humphrey, and ideal PDE cycle are given in Appendix A. It has been noted that the Humphrey cycle efficiency may be 30% to 50% higher than that of Brayton cycle for stoichiometric hydrogen/air mixture (Bussing and Pappas, 1994). The potentially higher thermodynamic cycle efficiency of PDEs directly translates to their potentially higher specific impulse. Figure 1.11, provided by Adroit System Inc., shows the anticipated specific impulse and operational envelope of various airbreathing engines including PDEs, turbojets, ramjets, and scramjets using hydrogen or hydrocarbon
41 3 fuels (Roy, 1999). Clearly from this figure, PDEs have a performance advantage over their counterpart ramjet within their mutual flight regime. The lower performance of PDEs than turbojets within the regime of flight Mach number less than is due to the fact that the turbojets utilize an additional compressor for precompression of the incoming air Turbojets HYDROGEN HYDROCARBONS Specific Impulse, sec Turbojets PDE PDE Ramjets Pre-ignition Limit Note: - PDE Performance Estimated Using ASI Performance Deck - Turbojet, Ramjet and Scramjet Performance Levels Reflect Well-Designed Systems for Man-Rated Thrust Classes Scramjets 1000 Ramjets Scramjets Flight Mach Number Fig Anticipated specific impulses of airbreathing engines (Roy, 1999) In addition to their potentially higher thermodynamic cycle efficiency and specific impulse, PDEs have a wider operation range in terms of flight Mach number. The turbojets used nowadays in most commercial and military aircrafts are suitable for subsonic and low supersonic flight speed because of their high performance resulting from the precompression of the incoming air by the compressor. They become expensive and inefficient as the flight Mach number increases and cannot be used at a flight Mach number of greater than about 3 due to the cooling problem of the compressor blade. Ramjets, on the other hand, are designed for supersonic operation with a flight Mach
42 4 number greater than. They usually require solid propellant rocket boosters for accelerating to the ramjet take over speed. PDEs, however, can produce thrust at static conditions and thus have the potential to operate in both subsonic and supersonic flight regimes with competitive efficiencies. Other desirable features of PDEs over current propulsion systems include hardware simplicity and configuration scalability. PDEs do not necessarily require compressors to precompress the incoming air, nor turbines to produce work, nor boosters to produce thrust at static condition, thus significantly reducing the hardware complexity and design cost of the engine. Unlike pulsejets, which are tuned to the acoustical resonances of the combustion chamber, PDEs are uncoupled from the acoustical chamber resonance (Eidelman et al., 1990). It is theoretically possible to construct PDEs of a large range of sizes and thrust levels. In addition, the detonation frequency is physically restricted by the filling velocity of the fresh reactants into the detonation tube and is thus also scalable. In summary, PDEs offer the potential advantages of higher thermodynamics cycle efficiency and specific impulse, wider operating region, hardware simplicity, and operation scalability over other existing propulsion systems. However, it should be mentioned that, in spite of these advantages, PDEs have also encountered a lot of challenging design issues such as the low-energy repetitive detonation initiation, inlet integration, nozzle optimization, and so forth. A real PDE-powered vehicle will not emerge until all these challenging issues are resolved.
43 Interface Initiator Mixer Interface Distribution Manifold Typical Structure of PDE Figure 1.1 shows schematically the typical structure of an airbreathing PDE, which includes the following components (Bussing and Pappas, 1996): inlet, fuel and/or oxidizer sources, distribution manifolds, mixer, initiator, detonation tube, nozzle, and interfaces. The incoming air delivered by the inlet is distributed by the air manifold and mixes with the fuel distributed by the fuel manifold from the fuel source. The resultant mixture is fed into the detonation tube for detonation. The detonation products exhaust through the nozzle to generate thrust. Oxidizer Source Distribution Manifold Inlet Detonation Tube Nozzle Distribution Manifold Fuel Source Fig. 1.1 Typical structure of airbreathing PDE (Bussing and Pappas, 1996) All conventional airbreathing engines require an inlet to compress the air from the freestream velocity and pressure to lower velocity and higher pressure for further processing by other engine components. So do the airbreathing PDEs. The inlet of conventional airbreathing engines is designed to provide stable airflow to the combustor
44 6 with the highest possible recovery of total pressure and lowest possible external drag and weight (Yang and Cappuccio, 1991). In airbreathing PDEs, because of the strong pressure waves arising from the unsteady operation of the detonation tube, additional concerns should be placed in the inlet design. Several approaches have been proposed. The first is to design an inlet manifold large enough to dampen the pressure waves. It is, however, not practical for volume-limited applications (Bussing and Pappas, 1996). The second approach is to bleed excess air between detonation cycles through a well-designed inlet/detonation tube manifold (Bussing and Pappas, 1996). A more practical approach would be to utilize a combustor consisting of multiple detonation tubes that operate out of phase to enable continuous airflow to the combustor (Bussing and Pappas, 1996) so that the pressure waves propagating to the inlet are significantly reduced to a level within the stable margin of the inlet. The inlet/detonation tube interface serves both to isolate the detonation tube flowfield from the inlet flowfield during the detonation initiation and propagation and the blowdown processes, and to allow for the air and reactants to be delivered to the detonation tube during the purging and refilling processes. An example of this interface is a mechanical valve located at the head end of the detonation tube as mentioned in Section Another way to achieve the same purpose would be through some kind of aerodynamic means. The fuel source supplies fuel to the mixer through the fuel distribution manifold. In some cases, a separate oxidizer source and oxidizer manifold may be required to reduce the time and physical distance required for detonation initiation. The mixer is to provide efficient mixing of fuel and air, and/or fuel and oxidizer for further detonation.
45 7 The initiator is used to initiate the detonation wave in the detonation tube. The detonation can be initiated either directly through a large amount of energy deposition, or indirectly through a low-energy deposition along with a deflagration-to-detonation transition (DDT) process. In general, the energy required for a direct initiation of fuel/air mixture is impractical for repetitive operation. On the other hand, the DDT length associated with the indirect initiation might be quite large. One of the possible ways to reduce the DDT length is to fill the initiator section with the fuel/oxidizer mixture which is known to be more detonable than its corresponding fuel/air mixture. The detonation is first initiated in the initiator section, usually referred to as the predetonator, and then propagates into the detonation tube to initiate the detonation in the fuel/air mixture. The detonation tube is the kernel part designed to sustain and confine the detonation process. Since the tube wall is exposed periodically to high-temperature, high-pressure detonation products and low-temperature, low-pressure reactants, the selection of proper material and the cooling of the detonation tube are two major design considerations. In addition, the size of the detonation tube should be scaled to satisfy the performance requirement such as the thrust level and the operation frequency. The nozzle plays an important role in determining the PDE performance. In conventional steady engines, the nozzle is simply optimized by matching the exhaust pressure with the ambient pressure. This approach is, however, not available for PDEs since the exhaust flow is unsteady and the exit pressure is not constant. The situation is further compounded by the presence of the strong shock waves arising from the detonation process. Therefore, the nozzle design of PDEs represents a challenging task.
46 8 1.4 Literature Survey on PDE Studies Studies of PDEs have been conducted for several decades. The first reported work on intermittent or pulse detonation engines is attributed to Hoffman (1940) in Germany. The device involved no valves. Holes were bored in a long detonation tube to allow gas jets to escape. The heights of the gas jets escaping through the holes were used to indicate the progress of the combustion wave and the onset of the detonation. Both gaseous acetylene and liquid benzene fuels were employed with oxygen in his experiments. He found that a continuous injection of the combustible mixture leads to only a narrow range of ignition frequencies that produce an intermittent detonation cycle. He also pointed out the importance of the spark plug location with respect to the tube length. World Wall II prevented further work by Hoffmann and colleagues. A substantial effort was made by Nicholls et al. (1957) at the University of Michigan in the United States. They performed a series of single- and multiple-cycle detonation experiments with hydrogen/oxygen, hydrogen/air, acetylene/oxygen, and acetylene/oxygen mixtures in a stainless-steel detonation tube mounted on a pendulum platform suspended by support wires. The tube has a length of 18.9 cm (6 feet) and an internal diameter of.54 cm (1 inch). Fuel and oxidizer were injected coannually from the head end of the tube and ignited by a spark plug located 5.4 cm (10 inches) downstream. A maximum frequency of 35 Hz was obtained in their tests. The most promising results were demonstrated for the hydrogen/air mixture, where fuel-based specific impulses up to 100 s were reached and agreed well with the predictions from their simplified theoretical analyses. However, the agreement was partly fortuitous since
47 9 the measured thrust-time history was significantly different from the theoretical results. Moreover, because a low-energy spark ignitor was used in their experiments and no deflagration-to-detonation transition (DDT) augmentation device was utilized, it is not clear whether full detonation waves were realized. In a setup similar to Nicholls, Krzycki (196) performed experimental investigations of PDEs at the US Naval Ordinance Test Station. A gaseous propane/air mixture was continuously injected at the head end of the detonation tube through a reverse-flow injector and ignited by an automobile spark plug at frequencies up to 60 Hz. The power output of the spark plug varied inversely with the ignition frequency and was only 0.65 J at the frequency of 60 Hz. This fact implies that a substantial part of the combustion process occurring in the detonation tube was deflagration. Krzycki also used the method of characteristics to calculate the pressure history at the head end of the detonation tube, with the effect of the blowdown process taken into account. Based on his well-documented experimental results, Krzycki concluded that the PDEs are not promising for propulsion application. Possibly due to this conclusion, most experimental works related to the PDE concept were stopped in the late 1960 s. A different design concept was proposed by Nicholls et al. (1966). They examined the feasibility of a rocket motor that utilized a rotating detonation wave propagating in an annular combustor chamber. Both hydrogen/oxygen and methane/oxygen mixtures were employed in their experiments. A unidirectional detonation wave was created after transition from a deflagration wave. However, multicycle operations were not achieved. Their experiments and accompanying analyses
48 30 indicated that the ideal performance of such a rocket motor is essentially the same as that of a conventional rocket engine. Applications of the pulse detonation devices to fields rather than propulsion were reported in Russia in the 1980s. Korovin et al. (1981) examined the efficiency of thermal oxidation of nitrogen in a detonation reactor involving intermittent detonation waves with initiation frequencies from to 16 Hz. The reactor was reported to be able to operate without significant changes for 000 hours. Smirnov and Boichenko (1986) studied intermittent detonations of a gasoline/air mixture in a 3-m-long tube with frequencies up to 8 Hz, aiming at improving the efficiency of a commercial rock-crushing apparatus. In the late 1980s, Helman and colleagues (1986) reexamined the PDE concept at the US Naval Postgraduate School. They carried out a series of experiments with an ethylene/air mixture, showing the first successful self-aspirating airbreathing PDE. The system was operated at frequencies up to 5 Hz, the maximum frequency allowed by the solenoid valve that was used to control the gas flow. An important new idea employed in their experiments is the use of a predetonator to overcome the energy requirement for detonation initiation. The detonation was first initiated in the predetonator, a small tube containing an ethylene/oxygen mixture, and then transmitted to the primary detonation tube. The volume of the predetonator is only % of that of the primary detonation tube. Based on the experimental results, they suggested that frequencies of 150 Hz and specific impulse in the range of s might be obtained in a practical PDE. Since the renewed work of Helman et al., there has been a growing interest in the PDE as an advanced propulsion system. A number of reviews can be obtained from the literature. Eidelman et al. (1991) reviewed some of the early research as well as that
49 31 done in the late 1980s. Bussing and Pappas (1996) discussed the basic theory and design concepts. Kailasanath (000) reviewed the applications of detonations to propulsion. A comprehensive review of the more recent progress in PDE research was provided by Kailasanath (003). Wu, Ma, and Yang (003) summarized the experimental work up to date. For clarity, the research on PDEs since 1986 is divided into three categories: experimental, numerical, and analytical studies, and is reviewed in the following subsections Experimental Studies on PDEs Much effort has been expended in studying various important aspects of PDEs experimentally. These studies can be divided into single-pulse and multicycle experiments and are briefly summarized in Tables 1.1 and 1.. Single-pulse experiments involve only the detonation initiation and propagation and the blowdown processes, whereas multicycle experiments include the additional purging and refilling processes. Single-pulse experiments can be used to determine the detonation initiation energy required for a given mixture, to measure the detonation wave properties, and to validate the concepts, serving as the basis for the more complex multicycle experiments. Both hydrogen and hydrocarbon fuels were involved in the experiments. The hydrocarbon fuels include both gaseous fuels such as ethylene (C H 4 ) and propane (C 3 H 8 ) and liquid fuels such as JP10 (C 10 H 16 ). Ethylene (C H 4 ) was selected by many researchers because of its well-documented detonation properties and as a common decomposition of some typical heavy hydrocarbon fuels.
50 3 Table 1.1 Survey of single-pulse experimental investigations of PDEs reference propellants tube length ignitor energy DDT augmentation impulse measurement Hinkey et al. (1995) H /air H /O unknown 1.7 J Shchelkin spiral pressure history load cell Sterling et al. (1996) H /air cm N/A unspecified device N/A Broda et al. (1999) C H 4 /air 18.9 cm 3.5 J half-disk protrusion N/A Daniau et al. (000) C H 4 /O 6.5~10 cm 30 J direct initiation Shchelkin spiral ballistic pendulum Sanders et al. (000) C H 4 /air C H 4 /O 135 cm N/A Shchelkin spiral N/A Sinibaldi et al. (000) C H 4 /O /N cm 0.33~8.31 J none N/A Litchford (001) H /O 90 cm 0.11 J Shchelkin spiral load cell Sinibaldi et al. (001) C H 4 /air C H 4 /O C 3 H 8 /O 10 cm N/A N/A N/A Cooper et al. (00) C H 4 /O /N C 3 H 8 /O /N 60.9~150 cm 0.03 J Shchelkin spiral blockage plate orifice plate ballistic pendulum Lieberman et al. (00) C 3 H 8 /O /N 100 cm 0.03 J hot jet initiation ballistic pendulum Meyer et al. (00) H /air 91.4 cm N/A Shchelkin spiral extended cavity coannulus N/A Cooper et al. (003) C H 4 /O cm 0.03 J none ballistic pendulum
51 33 Table 1. Survey of multicycle experimental investigations of PDEs reference propellants tube length ignitor energy DDT augmentation Aarnio et al. (1996) H /air 11.9 cm 1.7 J N/A Sterling et al. (1996) Stuessy and Wilson (1996) H /O C H 4 /O 15. cm 50.8 cm N/A unspecified device impulse measurement pressure history load cell N/A frequency 5 Hz 33 Hz 100 Hz H /O 53.3 cm N/A N/A N/A 10~1 Hz Hinkey et al. (1997) H /air 91.4 cm 1.5 J N/A N/A 10 Hz Stuessy and Wilson (1997) C 3 H 8 /O 53.3 cm N/A N/A N/A 0.4~8.5 Hz Brophy et al. (1998) JP10/O 15.~76. cm 1.4 J N/A N/A 5 Hz Schauer et al. (1999) H /air 91.4 cm (1~4 tubes) N/A Shchelkin spiral N/A 0.5~100 Hz (per tube) Broda et al. (1999) C H 4 /air 18.9 cm 4~8 J obstacle N/A 8~10 Hz Brophy and Netzer (1999) Zitoun and Desbordes (1999) JP10/O 9 cm 0.5 J N/A N/A 10 Hz C H 4 /O 6.1~43.6 cm 35 J none pressure history 1~15 Hz Schauer et al. (000) H /air 91.4 cm N/A Shchelkin spiral pressure history 14~40 Hz Watts et al. (000) C H 4 /air N/A 5 J obstacle N/A 10 Hz Falempin et al. (001) C H 4 /O 5.0~4.6 cm N/A N/A N/A 80 Hz Litchford (001) H /O 90 cm 0.11 J Shchelkin spiral load cell 5 Hz McManus et al. (001) H /air 5.4 cm 0.0 J N/A load cell 10~35Hz Frankey et al. (00) H /air cm N/A Shchelkin spiral pressure history 11~1 Hz Shimo et al. (00) C H 4 /air 8. cm N/A Shchelkin spiral N/A 15 Hz Brophy et al. (00) C H 4 /air JP10/O 5 cm N/A N/A pressure history 80 Hz 30 Hz Farinaccio et al. (00) C 3 H 8 /O 40 cm N/A N/A load cell 10~5 Hz Brophy et al. (003) C H 4 /air C 3 H 8 /air 100 cm N/A obstacle N/A 30 Hz Meyers et al. (003) C 3 H 8 /O 7.6~30.5 cm N/A Shchelkin spiral pressure history 4.4~0 Hz Rasheed et al. (003) H /air 100 cm N/A orifice plate spring-damper 10 Hz Shehadeh et al. (003) C H 4 /O /N 184 cm N/A N/A spring-damper 10 Hz
52 Impulse Measurements Impulse is one of the key performance measures of a PDE. Several techniques have been proposed for the impulse measurement. The most straightforward one is to integrate the pressure history at the closed end of the detonation tube. This technique doesn t require complex measurement setup but can be implemented only to a simple detonation tube without internal obstacles. Another popular technique used in singlepulse experiments is known as ballistic pendulum technique, in which the detonation tube is suspended as a pendulum by support wires and the impulse is determined by measuring the maximum horizontal deflection of the tube (Cooper et al., 003). In multicycle experiments, the load cell technique is often used. In this technique, the force history is directly measured by the load cell attached to the detonation tube through a load cell cage (Hinkey et al., 1995). Since the negative thrust cannot be recorded, the impulse may be overestimated in this technique. In addition, the response of the structure must be taken into account. Other reported techniques include using damped thrust stand (Schaller et al., 001) and spring-damper system (Shehadeh et al., 003). Due to the limitation of each technique, a combination of these techniques may be required to obtain reliable impulse measurements. Hinkey et al. (1995) measured the impulse in their single-pulse experiments using both the pressure history and load cell techniques and found that the impulse from the pressure history is about 0% lower than that from the load cell data. With the measured impulse and the weight of fuel to generate this impulse, the propulsive performance parameter such as the specific impulse can be readily obtained. It should be mentioned that the specific impulse calculated from these direct-connect experiments doesn t represent the specific impulse of PDEs at flight condition, under
53 35 which the engine inlet and the momentum of the incoming air must be taken into account. On the other hand, because the purging and refilling processes are not included in the single-pulse experiments and the negative thrust may appear during these two processes, the impulses from single-pulse experiments are usually lower than those from multicycle experiments Detonation Initiation Detonation initiation is one of the major challenges in the PDE design. A detonation can be initiated either directly through a large amount of energy deposition or indirectly through a low-energy deposition along with a deflagration-to-detonation (DDT) process. Typical values for direct initiation energy for hydrocarbon fuel/air mixtures are of the order of Kilo-Joules to Meg-Joules (Benedick et al., 1986). The deposition of such high initiation energies is impractical for repetitive initiations. Most PDE experiments have thus relied on a DDT process for detonation initiation. According to the literature (Oppenheim, 1963; Lee and Moen, 1980; Kuo, 1986), a DDT process consists of the following sequence of events: 1) deflagration initiation a deflagration combustion is initiated by a low-energy deposition; ) shock wave formation the energy released by the deflagration increases the volume of the products and generates a train of weak compression waves that propagate into the reactants ahead of the flame and finally merge into a shock wave; 3) onset of an explosion in an explosion the shock wave heats and compresses the reactants ahead of the flame, creates a turbulent reaction zone within the flame front, and eventually cause one or more explosive centers formed behind the shock front; 4) overdriven detonation formation
54 36 strong shock waves are produced by the explosions and couple with the reaction zone to form a overdriven detonation; 5) stable detonation establishment the overdriven detonation wave decreases to a steady speed at around the CJ detonation velocity. The distance from the ignition to the detonation formation point is referred to as the DDT length, which is in general a function of the fuel and oxidizer, the tube diameter and geometry, the tube wall surface roughness, and the method used to ignite the mixture. Sinibaldi et al. (000) investigated the dependence of the DDT length on the ignition energy, ignition location, and mixture stoichiometry for a C H 4 /O /N mixture. They found that ignition energies above 0.8 J had little effect on DDT lengths. The ignition location tests revealed that when the ignitor was placed 1.33 tube diameter from the head wall, the DDT length could be reduced by up to 3%. Their results also showed that the mixture equivalence ratio significantly affects the DDT length. The minimum DDT length of around 7.5 cm for the C H 4 /O mixture was obtained with an equivalence ratio of 1.. A drastic increase in DDT length was observed when the equivalence ratio is less than In general, the DDT length could be large compared to the tube length used in PDE experiments. Hinkey et al. (1995) carried out a series of tests with H /O mixtures of various equivalence ratios and found that the DDT lengths are on the order of 30 to 100 cm. They thus suggested using some DDT augmentation devices to enhance the DDT process and reduce the DDT length, which was adopted in most late PDE experiments. In the early multicycle experimental work of Nicholls (1957) and Krzycki (196), it is not clear whether full detonation waves were realized because a low-energy
55 37 spark ignitor was used in their experiments and no DDT augmentation devices were implemented. A classical approach for DDT enhancement is to place a spiral, known as the Shchelkin spiral (Shchelkin, 1940), into the detonation tube. Hinkey et al. (1995) first applied this approach to their single-pulse PDE experiments with H /O mixture and found that the Shchelkin spiral reduced the DDT length by a factor of about 3. In addition to the Shchelkin spirals, other internal obstacles such as half-disk protrusions (Broda et al., 1999), blockage plates and orifice plates (Cooper et al., 00), and coannulus (Mayer et al., 00) have also been used by various researchers. It should be noted, however, while enhancing the DDT processes, all these obstacles result in significant total pressure loss and degrade the propulsive performance. Cooper et al. (00) reported that the DDT lengths could be reduced by an average of 65% in various C 3 H 8 /O /N and C H 4 /O /N mixtures using obstacles with a blockage ratio of 0.43, whereas the impulse was reduced by up to 5%. Another traditional detonation initiation concept involves using a predetonator (Helman et al., 1986), which is in essence a detonation-to-detonation initiator. A detonation is initiated in a more easily detonable mixture called as the driver gas and then propagates into and initiates a detonation in the primary mixture. A simple example of this concept is to fill a fuel/oxygen mixture or the driver gas in an initiation section near the closed end of the detonation tube (Hinkey et al., 1995; Sanders et al., 000). The minimum length of the initiation section is the DDT length of the driver gas. The aforementioned DDT augmentation devices can be further implemented within the initiation section to achieve more rapid initiation. A disadvantage of this concept is the
56 38 need to carry an additional driver gas or oxygen generator, which increases the system weight. The additional driver gas also lowers the specific impulse since the weight flow rates of both the fuel and the driver gas should be taken into account in calculating the specific impulse. To mitigate this disadvantage, the amount of the driver gas or the volume of the driver gas region must be as small as possible. A practical way to reduce the volume of the driver gas region is to utilize an additional smaller tube for the driver gas. This additional tube, usually with a volume on the order of 1% of that of the main detonation tube, is called a predetonator. The detonation transmission from the predetonator to the main detonation tube is thus a key issue in the predetonator applications (Sinibaldi et al., 001; Santoro et al., 003). Diffraction of detonation from a small tube into an unconfined space has been extensively investigated in the past (Lee, 1984; Desbordes, 1988). According to the literature, a successful detonation transmission happens if the tube diameter is larger than the critical diameter. This critical diameter is usually expressed in terms of the detonation cell size of the mixture. It is now commonly accepted that the critical diameter is about thirteen times of the detonation cell size for smooth circular tubes. The detonation transmission from the predetonator to the main detonation tube has also been investigated recently (Sinibaldi et al., 001; Santoro et al., 003; Brophy, et al., 003). Successful detonation transmission from the predetonator to the main detonation tube could be achieved at predetonator tube diameters less than the critical diameter because of the confinement of the transition region and main detonation tube (Santoro et al., 003).
57 39 Other techniques proposed for promptly achieving detonation initiation include hot jet initiation, detonation wave focusing, etc. Hot jet initiation was observed by Knystautas et al. (1979) for sensitive fuel-oxygen mixtures. Lieberman et al. (00) recently demonstrated the possibility of using a hot jet to initiate a detonation in a short detonation tube filled with the C 3 H 8 /O /N mixture. The idea of the detonation wave focusing is to initiate the detonation in the main detonation tube through the merging of the detonation waves from a bunch of small tubes (Jackson and Shepherd, 00) Numerical Studies on PDEs In addition to experimental investigations, substantial attempts were made to numerically study the single-pulse and multicycle operations of various PDEs consisting of single or multiple detonation tubes with or without nozzles and ejectors. Based on the spatial dimensions used, these numerical studies can be classified into one-dimensional or quasi-one-dimensional and two-dimensional or axisymmetric simulations, as summarized in Tables 1.3 and 1.4, respectively. In contrast to experiments in which ethylene (C H 4 ) is often used as the fuel, most numerical studies use hydrogen (H ) as the fuel because of its relatively simpler chemical kinetics. Another significant difference between experiments and simulations is the detonation initiation. In experiments, as discussed in Sec , the detonation is usually initiated indirectly through a low-energy deposition along with a DDT process since the direct initiation with high-energy deposition is not practical. In numerical simulations, however, a small spark region with high temperature and pressure is commonly implemented to directly initiate the detonation. In addition, because of the
58 40 lack of the DDT process and because there is no frequency limitation arising from the hardware such as the solenoid valves, the operating frequencies are much higher in numerical simulations than those that can be achieved in experiments. In spite of many simplifications used in the numerical simulation, its capabilities in providing the detailed unsteady flowfield make it a practical and efficient methodology for PDE performance and flow dynamic analyses. Table 1.3 Survey of one-dimensional numerical simulations of PDEs reference exit B.C. propellants chemical kinetics tube length spark length nozzle frequency (cycles) Cambier and Adelman (1988) N/A H /air 16-step 7-species 50 cm cm divergent 667 Hz (3 cycles) Bussing (1994) N/A H /O H /air 18-step 7-species 0 cm 0. cm none single pulse Sterling et al. (1995) constant pressure H /air equilibrium chemistry 100 cm 0.5 cm none 0 Hz (6 cycles) Cambier and Tegner (1998) N/A H /air N/A 10 cm 0.4 cm divergent 1000~600 Hz Kailasanath et al. (1999) Fong and Nalim (000) relaxing pressure constant pressure H /air 48-step 8-species 0 cm 0. cm none single pulse H /air N/A 10. cm N/A none 30~150Hz Mohanraj and Merkle (000) constant pressure H /O 1-step -species 50 cm 0.1 cm divergent CD 30 Hz Ebrahimi and Merkle (00) constant pressure H /O 16-step 8-species 0 cm 0. cm none 400 Hz (3 cycles) Ebrahimi et al. (00) varying pressure with D correction H /O 1-step -species 10. cm 0.1 cm none 00~1000 Hz Wu, Ma, and Yang (003) zerogradient H /air 1-step -species 60 cm 0.0cm CD 00~400 Hz
59 41 Table 1.4 Survey of two-dimensional numerical simulations of PDEs reference Eidelman et al. (1990) Lynch and Edelman (1996) Cambier and Tegner (1998) Eidelman and Yang (1998) num. of tubes propellants 1 C H 4 /air Li et al. (000) 1 C H 4 /air Li and Kailasanath (001) Allgood et al. (00) Ebrahimi et al. (00) Kawai and Fujiwara (00) Li and Kailasanath (00) Yungster and Perkins (00) Li and Kailasanath (003) Povinelli and Yungster (003) Tangirala et al. (003) Wu, Ma, and Yang (003) chemical kinetics energy release behind detonation 1 H /air 7-step 6-species tube length 8cm 16 cm 8cm 16 cm spark length nozzle cycles/ frequency N/A none single pulse 1~ cm none single pulse 1 H /air N/A 10 cm 0.4 cm divergent single pulse 1 C H /air 1-step 16 cm N/A 1 C H 4 /O 1 H /O /Ar -step inductionparameter -step inductionparameter -step inductionparameter convergent divergent single pulse 50 cm 1.5 cm none single pulse 135 cm cm none single pulse 50.8 cm N/A ejector single pulse 1 H /O 16-step 8-species 10. cm 0.1 cm none single pulse 1 H /O /Ar 1 C H 4 /O -step inductionparameter -step inductionparameter 10~40 cm N/A none cycles 10~500 cm 1 cm none single pulse 1 H /O 19-step 9-species 18.9 cm N/A ejector 1 C H 4 /O C H 4 /air -step inductionparameter 50 cm jet initiation none 5 cycles ( 1 Hz) single pulse 1 C H 4 /air 36-step 0-species 100 cm 0.5~1 cm none single pulse 1 Yungster (003) 1 Ebrahimi et al. (001) Ebrahimi and Merkle (00) Ebrahimi et al. (003) H /air C H 4 /O 3-step 7-species 38-step 1-species 100 cm 0.5 cm none single pulse 1 H /air 1-step -species 60 cm 0.0 cm none 00~400 Hz H /O H /air 19-step 9-species 100 cm 0.5 cm divergent 3 cycles ( 110Hz) H /O 16-step 8-species 10 cm N/A CD single pulse H /O 16-step 8-species 10 cm N/A CD single pulse 1~3 H /O 16-step 8-species 10~30 cm N/A CD single pulse Ma et al. (003) 1; 3 H /air 1-step -species 60 cm 0.0 cm CD 50~333 Hz
60 One-Dimensional Numerical Simulations One of the first numerical studies on PDE reported in the literature was attributed to Cambier and Adelman (1988). Quasi-one dimensional simulations with multi-step finite rate chemical kinetics were carried out for a 50-cm-long detonation tube attached to a 43-cm-long diverging nozzle with stoichiometric H /air mixture. The detonation was initiated at the closed end by a -cm-long spark region with a temperature of 1500 K. The refilling process started when the head-end pressure fell to 3.5 atm. The fresh reactants moved at speeds up to 350 m/s. The engine reached steady cyclic operation by the third cycle with a cycle frequency of about 667 Hz. Specific impulses up to 6507 s were reported. These very high specific impulses may be due to the facts that their calculations were based on the gross thrust from the exit plane and that the contribution from the spark region on the impulse was not accounted for. Sterling et al. (1995) also conducted one-dimensional simulations with H /air mixture. The detonation tube is 100 cm long. The spark region has a length of 0.5 cm with a temperature of 3000 K and a pressure of 50 atm. The refilling process began when the head-end pressure decayed to the atmospheric pressure. They calculated the specific impulse for the sixth cycle based on the head-end pressure history and obtained a value of 515 s, which is much smaller than that of Cambier and Adelman (1988). Cambier and Tegner (1998) examined the effect of the spark region on the performance in their quasi-one-dimensional and two-dimensional simulations with H /air mixture for a 10-com-long detonation tube with various divergent nozzles. The spark region spans 0.4 cm, with a temperature of 500 K and a pressure of 50 atm. They observed that the contribution from the spark region on the single-pulse peak impulse
61 43 ranges from 17% to 7%. After subtracting this contribution, they obtained specific impulses of 3500 s ~ 4100 s based on the head-end pressure history of their quasi-onedimensional multicycle results. In addition to the differences in the operation conditions and in the calculation methods for the specific impulse, the exit boundary condition plays another important factor that cause the differences in the reported specific impulses from one-dimensional simulations (Kailasanath et al., 1999). Choosing appropriate exit boundary conditions represents a major challenge in the one-dimensional simulations for PDEs. In general, if the outflow is supersonic, extrapolation of the condition from the inside can be used. However, for subsonic outflow, the flow inside the domain near the exit relates to the flowfield outside the domain, which is unknown from the one-dimensional simulations. The situation is further compounded by the existence of the unsteady detonation waves and other associated waves. Strictly, there are no accurate exit boundary conditions for this kind of complex unsteady subsonic outflow. Most one-dimensional simulations have relied on a fixed-pressure boundary condition for the outflow (Cambier and Adelman, 1988; Starling, 1995). Ebrahimi et al. (00) used the fixed-boundary condition as well as a varying-pressure condition based on corrections from two-dimensional simulations. They found that with the fixedpressure condition, the flow chokes as soon as the detonation wave arrives at the exit, whereas the varying-pressure result shows a duration of a subsonic outflow before choking. Kailasanath et al. (1999) utilized a relaxing-pressure boundary condition. The pressure is set to reach the ambient value in a relaxation length from the end of the detonation tube. A larger value of the relaxation length implies a slower relaxation of
62 44 pressure to ambient. Based on single-pulse operation, they observed that the specific impulse is larger for slower relation cases. They then concluded that the variations in specific impulses reported in the literature could be explained on the basis of exit boundary conditions used Two-Dimensional Numerical Simulations In spite of the computational efficiency of the one-dimensional simulations for performance predictions, the difficulty in specifying the exit boundary condition makes them less attractive. Multi-dimensional simulations with computation domain including both the detonation tube and the external region are required in order to faithfully describe the system dynamics, especially in the near field of the tube exit where the flow is intrinsically multi-dimensional, and to provide more accurate performance predictions. This subsection will provide a brief review on some of the two-dimensional simulations. Issues related to nozzle and multitube will be discussed in other subsections. Eidelman et al. (1990) carried out two-dimensional axisymmetric simulations for a valveless PDE with C H 4 /air mixture. Both internal and external flowfields were included in their computational domain. The system simulated consisted of a cylindrical detonation tube with a length of 8 or 16 cm. Its operation is a little different from that described in Sec The detonation is initiated at the aft open end and travels toward the head end where the thrust wall, fuel injector, and air inlet are located, ejecting burned gases through both the open end and the air inlet. Air is entrained into the detonation tube when the pressure falls below the atmospheric pressure during part of the cycle. Since no valves are required to separate the air inlet and the detonation tube, this kind of
63 45 PDE is self-aspirating and is called valveless PDE. From a scaling study based on singlepulse operation, they concluded that the thrust of the detonation tube increases linearly with the detonation tube length when the other parameters are kept constant. This conclusion, however, is incorrect or misleading, since the thrust they calculated was based on only a portion of a cycle. Lynch and Edelman (1996) conducted two-dimensional axisymmetric simulations with multi-step finite rate chemical kinetics for H /air mixture for a valveless PDE similar to that analyzed by Eidelman et al. (1990). They investigated the flow dynamics with two types of air inlet. In the straight inlet case, a large recirculation zone is formed behind the thrust surface upon the inflow of the fresh air. This recirculation zone may cause an increase in the time required to entrain the air and to purge the products. By using a scoop inlet, the recirculation zone is reduced. They suggested additional inlet shaping and viscous entrainment effects to obtain optimizing design. Most of the recent two-dimensional studies focused on single-tube PDEs with detonation initiated at the closed end. Ebrahimi et al. (00) carried out two-dimensional simulations with a H /O mixture to provide exit boundary condition corrections for their one-dimensional simulations. Li and Kailasanath (001) looked at the single-pulse flowfield evolution under full or partial fills for a C H 4 /O mixture. The two-step induction-parameter chemical kinetic model was adopted, in which combustion radicals are formed in the first step, which is represented by an induction parameter, and the energy is released in the second step. This model has also been used by other researchers for H /O mixtures (Allgood et al., 00; Kawai and Fujiwara, 00). In a later work of Li and Kailasanath (00), they further investigated the effect of partial filling on the
64 46 propulsive performance and observed that the fuel-based specific impulse increases as the partial filling ratio decreases for single-pulse operation. A scaling relation of the specific impulses between the partial and full fillings was then proposed. Many of the two-dimensional simulations are limited to single-pulse operations. However, significant differences exist between single-pulse and multicycle computations and the conclusions from single-pulse studies may not be applied to multicycle cases directly (Cambier and Tegner, 1998; Yungster, 003; Wu, Ma, and Yang, 003). To date, two- dimensional simulations with multicycle operations are rather sparse. Kawai and Fujiwara (00) carried out two-dimensional simulations for the first two cycles of a straight tube PDE containing an Ar-diluted stoichiometric H /O mixture, with attention paid to the injection behavior during the nd cycle. Yungster and Perkins (00) conducted multicycle simulations of various PDE-ejector configurations utilizing H /O mixture. The thrust and mass flow rate over five cycles are presented. They stated that more cycles might be required to establish some kind of limit cycle or steady periodic cycle. Up to now, two-dimensional simulations with steady periodic cycle attained have been reported only by Ma and colleagues (Wu, Ma, and Yang, 003; Ma et al., 003) Effect of Nozzles The detonation products exhausting from the detonation tube carry a large amount of internal energy. A nozzle is thus needed to convert this internal energy to kinetic energy to improve the performance. In conventional steady engines, the nozzle is optimized by matching the exit pressure with the ambient pressure. The nozzle designs for PDEs, however, are complicated by the unsteady nature of the PDEs, especially the
65 47 complex shock waves resulting from the repetitive detonations. To date, no theory for PDE nozzle designs has been developed. Several numerical and experimental studies that focused on the effect of nozzles on the PDE performance are reviewed in the following paragraphs. Cambier and Adelman (1988) considered a 43-cm-long divergent nozzle attached to a 50-cm-long detonation tube in their quasi-one-dimension multicycle simulations with a H /air mixture. They stated that other designs with a convergent section and throat cause the detonation waves to reflect as shock waves from the converging section. The reflected shock waves elevate the head-end pressure, interfere with the refilling process, and lower the cycle frequency. On the other hand, a divergent nozzle causes reflected rarefaction waves that propagate back into the tube to allow rapid refilling processes. A cycle frequency of as high as 667 Hz was reported in their studies with a divergent nozzle. However, they didn t compare the propulsive performance numbers between the divergent nozzle and other nozzles. It is thus unclear which kind of nozzle is better for achieving higher propulsive performance. Cambier and Tegner (1998) investigated the effects of five different divergent nozzles on the performance based on quasi-one-dimensional multicycle simulations and two-dimensional single-pulse simulations. The lengths of the detonation tube and the nozzle are 10 cm and 5 cm, respectively. Both the tube and nozzles were initially filled with a H /air mixture. Their single-pulse results indicate that the divergent nozzles can increase the impulse and that the bell-shaped nozzle produces a higher impulse than those with shapes of positive curvatures. In addition, significant differences were observed
66 48 between single-pulse and multicycle results, and between quasi-one-dimensional and two-dimensional results. Eidelman and Yang (1998) also considered different nozzle shapes, i.e. three divergent and three convergent nozzles, in their two-dimensional single-pulse simulations. The detonation tube was filled with a C H /air mixture, whereas the nozzle was filled with air. Their results showed that both the convergent and divergent nozzles drastically increase the PDE performance. Convergent nozzles lead to significant increases in impulse generation time and rapid changes in thrust due to shock wave reflections and relative later times in attaining the peak impulses. Divergent nozzles tend to generate impulse rapidly during detonation product expansion due to the increase in effective thrust wall area so that the peak impulses are reached earlier. These peak impulses, however, are followed by rapid reductions due to the negative thrust generated during the overexpansion of the detonation products. Among the three divergent nozzles, the bell-shaped nozzle produces the highest peak impulse. Mohanraj and Merkle (000) used quasi-one-dimension multicycle simulations to study the effects of the divergent and convergent-divergent (CD) nozzles at different back pressures. The injection pressure is fixed at one atmosphere. They found that both types of nozzles provide performance benefit at low back pressures, while the divergent nozzle causes performance deterioration at high back pressures. Their results also showed that divergent nozzles lead to higher cycle frequency. More recently, Yungster (003) examined the effect of divergent nozzles on PDE performance in his two-dimensional simulations with operations up to 3 cycles. Both H /O and H /air mixtures were employed. The detonation tube and nozzles are 100 cm
67 49 and 40 cm long, respectively. In the single-pulse operation, the nozzles can utilize some of the energy carried by the detonation products to significantly augment the impulse obtained from the detonation tube alone. Impulse augmentation ratios of up to.34 and 1.41 were obtained with the bell-shaped nozzle for H /O and H /air mixtures, respectively. In multicycle operation, however, the performance augmentation is very limited or even negative because of the nozzle flow overexpansion during most of the purging and refilling periods. He stated that in order for the nozzle to remain effective after the first cycle, the combustion products must be purged from the nozzle before the next cycle is started. This will, however, reduce the cycle frequency. The effect of nozzles was also investigated in several experiments. Stuessy and Wilson (1997) conducted multicycle experiments with and without conical exhaust nozzles. They noted that the inclusion of the nozzle improves the performance. Daniau et al. (000) investigated the effects of divergent nozzles of different shapes and lengths on the performance of a PDE based on single-pulse experiments. They also observed that bell-shaped nozzles are especially efficient. Cooper et al. (00) carried out single-pulse experiments and investigated the effect of a 30-cm-long divergent nozzles attached to a cm-long detonation tube. They found that the divergent nozzle had a negligible effect, increasing the specific impulse by an average of 1% which is within the experimental uncertainty. The observations and conclusions reported in these previous numerical and experimental studies indicate the nozzle effect on the PDE performance is far from mature. More studies based on multicycle operations need to be conducted.
68 Multitube PDEs In addition to the nozzle, another way that may improve the PDE performance is the use of multiple detonation tubes (Ma et al., 003). The concept of multitube designs is not new. In as early as 1950, Goddard considered a valved multiple combustor deflagration-based pulse jet engine (Goddard, 1950). Bussing proposed a rotary valve multitube pulse detonation engine concept in 1995 by combining some aspects of the Goddard design and the detonation process (Bussing, 1995). It consists of several detonation tubes coupled to an air inlet and fuel source via a rotary valve. The rotary valve isolates the steady operation of the air inlet and fuel system from the unsteady operation of the detonation tubes and allows the filling of some of the detonation tubes while detonation occurs in other tubes. A simple performance model, including the contributions from the inlet, the mixer, the combustor, and the nozzle, was proposed by Bratkovich and Bussing (1995) to examine the aforementioned multitube PDE performance characteristics over a wide range of flight regime. Recently, an in-house four-detonation-tube research PDE was built at the US Air Force Research Laboratory, serving as a test-bed for detonation initiation concept, high frequency operation, heat transfer studies, multitube detonation engine operation, and pulse jet research (Schauer, 001). It used a valve system based on the Quad-4, a sixteen-valve, four-cylinder automobile engine from General Motors. A rotary position sensor was adapted to the intake camshaft to provide both an index of the valve timing sequence and the relative position of the valves. Each detonation tube can operate at frequencies of up to 100 Hz. Numerical investigations on multitube PDEs also commenced recently. Mohanraj et al. (001) presented an approximate model for a PDE with five detonation tubes. Time
69 51 accurate one-dimensional solution of the flowfield was obtained for only one tube. Time delayed versions of this solution were used to model the other tubes. Their results showed that the filling process in a multitube PDE can be markedly different from that in a single-tube PDE. For example, increasing the fill time does not affect the fill fraction in the tubes at some conditions. They also observed that the number of cycles needed to attain steady periodic operation in a multitube configuration is typically larger. Although this approach saves computational effort, the resultant error due to the model approximation is difficult to estimate and may likely be quite large. Ebrahimi et al. (001) conducted two-dimensional simulations for a dual-tube PDE, but with only the first-pulse operation. They found that the pressure induced by the detonation in the neighboring tube is nearly as large as that produced by the detonation itself and that the shock wave produced by the detonation is sufficient to initiate combustion in the adjacent tube filled with fresh reactants. In a more recent work (Ebrahimi et al., 003), the effects of the number of tubes and the tube length on the flowfield interaction among tubes were investigated based on the first-pulse operation. The results indicate that the flowfield interaction among three tubes is approximately a factor of three smaller than that between two tubes, but that increased tube length has no significant effect. The first multidimensional numerical study on multitube PDEs involving multicycle operations was conducted by Ma et al. (003) Analytical Studies on PDEs The intrinsic unsteady nature of the PDE operation process makes the theoretical analyses rather difficult or even impossible. On the other hand, it is desirable to develop
70 5 simple analytical models that can be used to rapidly and reliably predict the PDE performance and to conduct parametric studies. Several analytical models have been proposed in the past and are summarized in Table 1.5. Based on how the impulse is obtained, these models fall into two classes. One class employs unsteady gasdynamic analysis to determine the instantaneous pressures and forces acting on the thrust wall and calculate the impulse as the integration of them (Nicholls, et al., 1957; Wintenberger et al., 00; Wintenberger and Shepherd, 003). The other class, without the need to consider the unsteady wave process within the detonation tube, obtains the impulse or specific impulse of the engine by deriving the flow properties at the exit plane (Talley and Coy, 00; Heiser and Pratt, 00; Wu, Ma, and Yang, 003). Table 1.5 Survey of analytical studies on PDEs classification based on impulse calculation head-end pressure exit-plane properties reference Nicholls et al. (1957) Wintenberger et al. (003) Wintenberger and Shepherd (003) Talley and Coy (00) Heiser and Pratt (00) Wu, Ma, and Yang (00) remarks Only constant pressure portion was considered. Decaying pressure portion was modeled through dimensional analysis and experimental calibration. Filling process was incorporated. The cycle consists of a constant-volume combustion, a constant-volume blowdown, and a constant-pressure filling process. Classical thermodynamic cycle analysis was applied to an ideal PDE cycle to predict the upper limit of the PDE performance. The Heiser and Pratt (00) approach was extended to accommodate property variations across the detonation wave front.
71 53 The most simplified model was reported by Nicholls et al. (1957) in conjunction with their straight-tube experiments. The pressure at the head end remains constant until the arrival of the first rarefaction wave generated as the detonation wave emerges from the open end. The head-end pressure then decays due to the continuing arriving of more rarefaction waves. Only the contribution of the constant pressure portion was considered and the contribution of the decaying pressure period was neglected. Consequently, this model underpredicted the impulse. Recently, Wintenberger et al. (003) presented a semi-analytical model for a single-pulse detonation tube. Both the constant pressure and decaying pressure portions are considered. The duration and amplitude of the constant pressure portion is determined by analyzing the gasdynamics of the self-similar flow behind a steadily moving detonation wave within the tube. The decaying pressure portion is analyzed using dimensional analysis, leaving a nondimensional parameter to be obtained through experimental calibrations. Wintenberger and Shepherd (003) later extended this model to multicycle operations by accommodating the refilling process. These models, however, are only useful for predicting the impulse from a simple straight detonation tube. The constant volume limit model proposed by Talley and Coy (00) is based on a cycle consisting of a constant-volume combustion process, a constant-volume blowdown process, and a constant-pressure filling process. The characteristic wave transit times are assumed to be much shorter than the blowdown time. During the blowdown process, the gases in the chamber are modeled as being time varying but spatially uniform while venting occurs through an infinitely thin nozzle with quasi-steady
72 54 flow. When the chamber pressure reaches the fill pressure, the filling process begins and is modeled as a constant-pressure process. Heiser and Pratt (00) applied the classical thermodynamic cycle analysis to an ideal PDE thermodynamic cycle. The detonation wave converts the reactants to the products with CJ properties. These products are then assumed to isentropically expand to the atmospheric pressure. They recognized that no simple device can fulfill this unsteady isentropic expansion process but the upper limit of the performance can be established through this assumption. After the thermodynamic cycle efficiency is obtained, the specific impulse can be readily determined through the control-volume energy balance. This model was later extended by Wu, Ma, and Yang (003) to accommodate property variations across the detonation wave front. The advantage of this model over that proposed by Tally and Coy (00) is that the detonation combustion is considered. However, since all thermodynamic cycle analyses are based on an assumption that all the fluid elements experience the same processes at same sequence, the purging and refilling processes involved in a PDE can thus not be incorporated. Moreover, comparisons with more accurate numerical simulations should be made in order to judge its accuracy in predicting the upper performance limit. 1.5 Research Objectives The primary objective of this research is to evaluate the concept of airbreathing PDEs, to investigate their flow dynamics, to determine their performance, to identify the
73 55 various loss mechanisms, and to examine the effects of the operation timing and system geometry. Figure 1.13 schematically shows the airbreathing PDE studied herein. It includes a supersonic inlet with mixed compression, an air manifold/acoustic cavity, a rotary valve, a combustion chamber containing single or multiple detonation tubes, and a convergent-divergent nozzle. Hydrogen is used as the fuel. As a specific example, the flight condition with a flight altitude of 9.3 km and a flight Mach number of.1 is considered. The static pressure and temperature are 0.9 atm and 8 K, respectively, corresponding to a total pressure of.65 atm and a total temperature of 48 K. manifold rotary valve inlet isolator combustor nozzle inlet air diffuser & distributor fuel manifold & injector multiple-tube combustor controller nozzle Fig Supersonic airbreathing pulse detonation engine In Chapter, the supersonic inlet dynamics is studied. The time-dependent Favre-averaged Navier-Stokes equations along with a two-equation turbulence model are solved by a finite-volume method, with a four-stage Runge-Kutta time integration technique for temporal discretization and the Harten-Yee upwind TVD scheme for spatial
74 56 discretization. The steady-state inlet flow dynamics and the response of the inlet shock system to downstream pressure disturbance are investigated. Chapter 3 introduces the recently developed space-time conservation element/solution element method and utilizes it to the quasi-one-dimensional study of a single-tube PDE. Chemical kinetics is simulated using a simple one-progress-variable model for a stoichiometric hydrogen/air mixture. The flow dynamics is examined through numerically obtained x-t diagrams. The effects of operating frequency and valve close-up time on the propulsive performance are investigated. In Chapter 4, two-dimensional analyses are carried out for single-tube PDEs with or without CD nozzles under multicycle operations. The two-dimensional code is efficiently parallelized by implementing the message-passing-interface (MPI) library and a domain decomposition technique. The flow dynamics involved in the PDE operation is examined in detail. A flow-path based performance prediction model is proposed to estimate the upper performance limit of the current PDE system. The various performance loss mechanisms are identified. The effects of operation timing including the cycle time or frequency, valve close-up time, and purge time on the propulsive performance are comprehensively studied. Moreover, the effects of nozzle configurations in terms of the nozzle length and throat area are examined. In Chapter 5, multitube airbreathing PDEs with repetitive operations are studied by means of two-dimensional simulations. The combustor consists of three detonation tubes. The flow evolution and tube interactions are carefully examined and the various loss mechanisms are identified. The effects of operating timing such as the cycle time and the valve close-up time were investigated systematically. Comparisons with the
75 57 single-tube results are made. The effect of the system geometry is partially assessed by considering a free volume between the detonation tubes and the common nozzle. Finally, Chapter 6 summarizes the present work and provides several recommendations for the future work.
76 58 Chapter Supersonic Inlet Dynamics The inlet and its interaction with combustor represent a crucial aspect in the development of any airbreathing engine, including PDEs. The inlet is designed to capture and supply stable airflow at a rate demanded by the combustor, and to maintain high pressure recovery and stability margin at various engine operating conditions. The overall vehicle performance depends greatly on the energy level and flow quality of the incoming air. A small loss in inlet efficiency may translate to a substantial penalty in engine thrust. Moreover, any change in the inlet flow structure may modify the downstream combustion characteristics and subsequently lead to undesirable behaviors, such as flame blow-off and flashback. Thus, matching inlet behavior to engine requirements is of fundamental importance to designers (Yang and Cappuccio, 1990). In addition to its primary function of supplying air, an inlet has a determining influence on the dynamics of the entire system through its intrinsic unsteadiness and interactions with the combustion chamber. Typically, pressure waves are produced in the combustion chamber and propagate upstream to interact with the inlet flow through a manifold where mixing of air and fuel occurs. The resultant flow oscillations in the inlet diffuser then either propagate downstream in the form of acoustic waves or are convected downstream with the mean flow in the form of vorticity and entropy waves, and further reinforce the unsteady motions in the combustor. A feedback loop is thus established between the inlet and combustor. The situation is much more complicated in a supersonic airbreathing PDE due to its pulsed operation.

77 59.1 Problem Description In this chapter, axisymmetric two-dimensional simulations are conducted for a mixed-compression supersonic inlet as shown in Fig.1. The cowl radius is R c = 3.4 cm. This inlet is designed for a flight Mach number of.1 and a flight altitude of 9.3 km. The static pressure and temperature of the freestream are 0.9 atm and 8 K, respectively. The corresponding total pressure and temperature are.65 atm and 48 K, respectively. The time-dependent Favre-averaged Navier-Stokes equations are solved by a finitevolume method, with a four-stage Runge-Kutta time integration technique for temporal discretization and the Harten-Yee upwind TVD scheme (Harten, 1983; Yee, 1989) for spatial discretization. The specific objectives of this work are: 1) to understand the overall shock and flow structures in a realistic supersonic inlet, ) to examine the effects of downstream disturbances on inlet dynamics, 3) to investigate the influences of the viscous boundary layer and flow separations downstream of the terminal shock, and 4) to provide entrance information for further combustor simulations unit: cm Fig..1 Configurations of a mixed-compression supersonic inlet
78 60. Governing Equations The analysis for the supersonic inlet flows is based on the axisymmetric, Favreaveraged conservation equations of mass, momentum, and energy. In a vector notation, this set of equations becomes Q + ( E Ev) + ( F Fv) = H (.1) t x r where x and r stand for the axial and radial coordinates, respectively. The conserved variable vector Q, convective flux vectors E and F, diffusion flux vectors E v and F v, and source vector H are defined as Q = r[ ρρ, u, ρv, ρe ] T t (.) E = r u u + p uv e + p u (.3) [ ρ, ρ, ρ,( ρ ) ] T t F = r v uv v + p e + p v (.4) [ ρ, ρ, ρ,( ρ ) ] T t E = r[0, τ, τ, uτ + vτ q ] T (.5) v xx xr xx xr x F = r[0, τ, τ, uτ + vτ q ] T (.6) v xr rr xr rr r H = r[0,0, p τ,0] T θθ (.7) In the above equations, standard notations in fluid mechanics are used. The stress tensor τ and the heat flux vector q are given by τ xx = µ ( u/ x /3 u ) (.8) τ rr = µ ( v/ r /3 u ) (.9) τ xr = µ ( v/ x+ u/ r) (.10) τ = µ ( v/ r /3 u ) (.11) θθ
79 The divergence in cylindrical coordinates is defined as 61 q = λ T / x (.1) x q = λ T / r (.13) r u 1 ( rv) u = + x r r (.14) The pressure p and temperature T are obtained through the equation of state for a perfect gas as 1 p = ( γ 1)[ ρet ρ( u + v )] (.15) T = p/( ρr) (.16) where γ and R are the specific heat ratio and gas constant, respectively. These two parameters are taken as: γ = 1.4 and R = 87 J/kg K for air. components, The viscosity µ and thermal conductivity λ contain both laminar and turbulent µ = µ + µ, λ = λ + λ (.17) l t l t The laminar component of viscosity µ is obtained from the Sutherland law (White, 1974), l µ l T0 + S T = (.18) µ T + S T where µ 0 is the Sutherland law reference viscosity, T 0 the Sutherland law reference temperature, and S the Sutherland law temperature. For the current problem, these constants are: T K, µ kg/m s, S 110 K = = =.
80 The turbulent viscosity µ is evaluated with a two-layer model of Rodi (1991). t This model combines the standard high-reynolds-number k-ε model in the bulk flow region with a one-equation model near the wall. In the bulk flow region, the distributions of the turbulent kinetic energy k and its dissipation rate ε are calculated from the turbulence transport equations. In the viscosity-affected near-wall region, the turbulent kinetic energy is still determined from the transport equation, but the dissipation rate is determined from a prescribed length-scale distribution. The details of the application of this model can be obtained from the thesis of Oh (1994). The laminar and turbulent thermal conductivities λl and λ t are calculated as 6 C µ C µ λ = p l p t l =, λt (.19) Prl Prt where C p is the specific heat at constant pressure. The laminar Prandtl number the turbulent Prandtl number Pr t are taken to be 0.73 and 0.9, respectively. Pr l and.3 Numerical Procedures and Validations The governing equations outlined above are solved numerically by means of a finite-volume methodology. Temporal discretization is obtained using a four-stage Runge-Kutta integration method. The spatial discretization employs an upwind totalvariation-diminishing (TVD) scheme developed by Harten (1983) and Yee (1989) in generalized coordinates for the convective terms and second-order central-differencing method for the diffusion terms. Specific details of the numerical algorithm can be obtained from Oh (1994).
81 The boundaries encountered in the internal and external flowfields of an axisymmetric supersonic inlet include inflow, outflow, symmetry, wall, and far-field conditions. Since the inflow is supersonic along the boundary, the flow variables are fixed at their corresponding free stream values. At the exit boundary of the inlet duct, a constant back pressure is prescribed with other flow variables deduced from the interior points for the steady-state calculations. For the unsteady calculations, a sinusoidal pressure fluctuation is applied at the outflow boundary of the inlet duct, with the implementation of the non-reflective boundary conditions proposed by Watson and Myers (1991). For the symmetry boundary, the normal velocity and the normal gradients of the axial velocity, pressure, and temperature are set to zero. A non-slip boundary condition is applied along the wall, together with zero normal gradients of pressure and temperature. Finally, the flow variables at the far-field boundary are extrapolated from the interior along the characteristic lines based on the solution of a simple wave (Roache, 198) to avoid shock reflections. In order to assess the accuracy of the aforementioned numerical method, a wide variety of flow problems were tested by Oh (1994). A calculation was carried out for a supersonic flow over a cone with a semi-vertex cone angle of 0 degrees. The free stream Mach number and pressure is.1 and 0.9 atm, respectively. Both Mach number and pressure distributions agree very well with the exact numerical solution of the ordinary differential equation derived by Taylor and Maccoll (199). The turbulence model is tested for a turbulent boundary layer on a flat plate. The calculated velocity profile at 1410 Re = θ agrees very well with the DNS data (Spapart, 1988). 63
82 64.4 Steady-State Flow Analysis The steady-state flowfields are first studied to understand the overall flow structures in a realistic supersonic inlet and to provide a baseline for studying the response of the inlet flow to downstream disturbances. The computational domain, as shown in Fig.., comprises the internal flow region (inner domain) that contains most of the essential flow structure, and the external flow region (outer domain), which becomes important when flow spillage over the cowl lip occurs at subcritical operating conditions. Two sizes of grids are used in order to obtain grid independent solution. The fine grid consists of points for the inner domain and points for the outer domain, while the coarse grid consists of points for the inner domain and points for the outer domain. Both grids are stretched toward the walls to provide sufficient resolution of turbulent boundary layer. Results from the steady-state calculations using these two grids show that the relative difference in terms of the terminal shock position is less than %, which demonstrates that grid independence is satisfied. To save CPU time, the coarse grid will be used in the later unsteady-flow calculations. A more strict grid-independent study may be conducted based on the Richardson extrapolation (Roache, 1997). outer domain inner domain Fig.. Computational domain for inlet study
83 65 Figure.3 presents the Mach-number, pressure, and vorticity contours at two different back pressures (p b =.1 and. atm), which are carefully chosen such that the engine operates at a supercritical condition to provide a sufficient shock stability margin. Under these conditions, the two leading conical shocks generated by the double-cone centerbody compress the airflow externally, merge slightly above the cowl lip, and form a strong oblique shock, which extends into the external-flow region. In addition, a shock stemming from the cowl inner surface continues downstream, hitting and reflecting from both cowl and centerbody walls, and finally leading to a terminal normal shock. The flow in this region undergoes a compression-expansion cycle, being compressed by reflecting shocks and expanded by expansion waves. The wavy Mach number and pressure distributions along the middle line of the inlet duct for the case of p b =.1 atm, as shown in Fig..4, clearly depict this feature. The flow finally becomes subsonic after passing through the normal shock located in the divergent section of the diffuser. During this process, the inlet recovers a high percentage of the free stream total pressure by decelerating the air flow through the shock train. The total pressure recovery coefficients are 84% for the case of p b =.1 atm and 88% for the case of p b =. atm, and the Mach number immediately in front of the terminal shock are 1.4 and 1.3, respectively. At the same time, the flow direction, which is originally deflected away by the leading shocks, is adjusted back to the axial direction. Due to the viscous effect, boundary layers exist on both the cowl and centerbody walls. The growth of the boundary layer and shock-wave/boundary-layer interactions play important roles in dictating the inlet flow structure. The presence of the boundary layer prohibits a discontinuous change in pressure across the shock near the wall since the
84 66 flow in the inner part of the boundary layer is subsonic. The overall pressure rise across the shock is partly transmitted upstream through the boundary layer, causing the streamlines in that region to diverge (Green, 1970). Consequently, the boundary layer thickens and may be separated from the wall if the pressure rise across the shock is sufficiently large. Due to its interaction with the boundary layer, the terminal shock is no longer a strictly normal shock. An oblique shock is formed due to the abrupt thickening of the boundary layer and runs into the terminal shock. If the flow deflects away enough after the leading oblique shock, a rear oblique shock may be formed from the intersection of the leading oblique shock and the main shock to form the lambda-shock (Dyke, 1997). On the other hand, the flow passing through the stronger normal shock will be slower than that passing through the oblique shock systems. Thus, vortex sheets emanate from the shock bifurcation points, convect downstream, and maybe interact with each other. This phenomenon is clearly depicted in the vorticity contours in Fig..3. Furthermore, the vorticity displays more complicated structure due to the different compression histories of the flow just upstream of the terminal shock. However, the pressure distribution in the transverse direction behind the terminal shock is quite uniform, in order to satisfy the condition of equal static pressure in that direction. This implies a non-uniformity of total pressure in the transverse direction. The abrupt thickening of the boundary layer downstream of the normal shock acts like a convergent nozzle by reducing the effective duct area, accelerating the subsonic flow after the shock with an associated pressure drop. The sudden decrease in pressure (or sudden increase in Mach number) after the terminal shock in the core flow region, as shown in Fig..4, is attributed to this effect.
85 67 Mach-number Contours p b =.1 atm tmp p b =. atm tmp Pressure Contours p b =.1 atm tmp p b =. atm tmp Vorticity Contours p b =.1 atm p b =. atm Fig..3 Mach-number, pressure, and vorticity contours with different back pressures under steady-state condition
86 Mach number p, atm x, m 0.0 Fig..4 Mach-number and pressure distributions along midline under steady-state condition (p b =.1atm).5 Shock/Acoustic-Wave Interactions The steady-state flowfields with back pressure of.1 atm are used to initialize the unsteady flow calculations, considering that the terminal shock in this case is further downstream, which means it has a larger stability margin. The downstream disturbance is simulated by imposing a sinusoidal pressure oscillation at the exit plane: where ω is the angular frequency, p = Apb sin( ωt) (.0) πf, with f the frequency. A wide range of A and f are considered with A = 0.05 and f = 500 Hz as the baseline case. Figure.5 shows the pressure distributions along both cowl and centerbody walls and the midline over one cycle of oscillation for the baseline case. The corresponding Mach-number contours near the terminal shock are also presented. Different time
87 intervals are chosen in order to display more key structures of the unsteady flowfield. The oscillation cycle begins when the terminal shock is at its steady-state position. As the terminal shock progresses upstream, the Mach number before the shock decreases. However, that does not necessarily mean that the terminal shock weakens. It is the relative Mach number with respect to the terminal shock that determines the strength of the shock. The numerical results indicate that the moving shock has a velocity as large as 40 m/s as it moves upstream for the baseline case. With this in consideration, the terminal shock may strengthen first and weaken then. The terminal shock reverses its direction after it reaches the farthest upstream position by the time of about ω t = π. Similarly, as the terminal shock moves downstream, it first strengthens but soon becomes weaker, now that it has a larger downstream moving velocity and the relative Mach number becomes smaller. As the velocity of the shock increases, the shock may finally turns into a pressure pulse. On the other hand, a strong adverse pressure gradient wave gradually forms farther downstream and eventually steepens into a secondary shock. This secondary shock becomes stronger as it moves upstream and finally combines into the primary shock (or pressure pulse) to form a stronger shock. The shape of the terminal shock also changes as it moves upstream or downstream. The S in Fig..5 stands for the separation point on the centerbody wall. It can be seen that the terminal shock will always induce boundary layer separation as long as it reaches certain strength. It is worth mentioning that in the last plot of Fig..5, two separation points can be found, the first one is induced by the terminal shock, and the second one is induced by the pressure gradient resulting from the acoustic wave and area changing. 69
88 70 Pressure Mach Number (0 M 1.74, M = 0.04 ) p/p 0, ωt=0(t=11.17ms) 0.78 top wall midline bottom wall Ms = 1.43 S p/p 0, p/p 0, p/p 0, 1.0 ωt=π/ (t = ms) ωt=π (t = 1.17 ms) ωt=7π/6 (t = 1.34 ms) Ms = 1.30 S Ms = 1.30 S Ms = 1.38 p/p 0, p/p 0, 1.0 ωt=3π/ (t = 1.67 ms) ωt=5π/3 (t = 1.84 ms) Ms = 1.46, 1.17 Ms = 1.46 S 1 S x/r c x/r c S Fig..5 Pressure distributions along walls and midline of inlet and Mach-number contours within one cycle of oscillation (A = 0.05, f = 500 Hz)
89 71 Figure.6 shows the instantaneous terminal shock locations for several cases. The shock location is determined by finding a position with Mach number equal to 1. The terminal shock begins to respond after the time required for the disturbance to travel upstream to it. It then may oscillate around its mean position and be stabilized after one or two cycles, or be disgorged out of the inlet as for the case of A = 0.1 and f = 500 Hz. It is evidently shown that the shock exhibits larger upstream and downstream excursions for lower frequency and higher amplitude disturbance. It can also be seen that the farthest upstream excursion of the shock moves gradually from upstream to downstream during the initial response stage, which can be rationalized as follows. When the acoustic pressure wave (left-running) hits the normal shock, part of the pressure wave is absorbed by the shock and the remainder is reflected as a right-running wave. This reflected wave could either strengthen the left-running wave or weaken it, depending on the phase angle difference between the two. Thus, for the first few cycles in which the reflected wave does not fully interact with the left-running wave in the entire subsonic diffuser section, the shock responds primarily to the left-running wave at first, and then gradually responds to the combined left- and right-running waves. In the present study, the reflecting wave seems to weaken the left-running wave, causing the phenomena aforementioned. The shock oscillation displays a nearly sinusoidal shape for the cases with small disturbance, and the mean position of the terminal shock is very close to the steady-state position. However, when the disturbance becomes larger, many nonlinear phenomena emerge. The oscillation of the terminal shock is no longer sinusoidal. The shock moves faster downstream than upstream. A significant characteristic is that a secondary shock forms and the primary shock disappears sometime within the cycle. The
90 7 discontinuous line sections in Fig..6(b) are due to this phenomenon. In the extreme case, say, for the case of A = 0.1 and f = 500 Hz, the terminal shock is disgorged out of the inlet, and engine unstart (Seddon and Goldsmith, 1999) may happen. In Fig..7, the position ranges of the terminal shock are given. For the cases with A = 0.05, the upmost point is the farthest downstream position of the secondary shock. It is quite clear that the range decreases as the frequency increases. The amplitude of the shock oscillation has been derived by Culick and Rogers (1983) under one dimensional, linear, and inviscid assumption. In the present study, the flowfield displays multidimensional effects as mentioned before, however, the motion of the terminal shock is mainly determined by the pressure wave behind it, which is nearly one dimensional. Figure.8 displays good agreements of the amplitudes of terminal shock oscillations with the analytical results. Air flow matching is an important issue for the inlet. The mass flow rate entering the inlet does not change during the supercritical operating conditions, but oscillations of mass flow rate do change at the exit of inlet due to shock motion. Figure.9 presents the ratio of relative mass flow rate fluctuation to the relative amplitude of pressure oscillation. It is observed that the oscillation of pressure causes larger oscillation of mass flow rate. For an engine with constant fuel injection rate, this implies that the equivalence ratio would fluctuate more severely, perhaps enhancing combustion instability. The phase angle differences between the mass and pressure oscillations are 1.16π, 1.06π, 0.95π, and 0.97 π for the four cases given in Fig..9, respectively. Total pressure recovery is another important issue of inlet. A small loss of inlet total pressure may cause considerable loss in engine thrust. Figure.10 presents the mass
91 73 averaged total pressure at exit over one cycle of oscillation for several cases. It is found that the averaged total pressures appear nearly sinusoidal oscillations. The main effect on the averaged total pressures is from the amplitude of pressure oscillation, while the frequency has a minor effect. The flow distributions at the exit plane of the inlet provide the coupling between the inlet and combustor. Figure.11 shows the axial velocity and total pressure profile at the exit plane over one cycle of oscillation for the baseline case. The steady-state results are also plotted for comparison. It can be seen that the unsteady profiles have similar shapes with the steady ones. However, the pressure oscillations cause very large velocity oscillations, which can reach 60% near the centerbody wall. This may exert substantial influence on the combustor environments. Figure.1 compares the time-averaged axial velocity and stagnation pressure profiles with those of steady-state, indicating that they are very close.
92 f = 50 Hz f = 500 Hz f = 1000 Hz x s /R c time, ms (a) A = A = 0.05, f = 500 Hz A=0.05,f=1000Hz 4.0 A = 0.10, f = 500 Hz x s /R c time, ms (b) A = 0.05, 0.10 Fig..6 Instantaneous shock locations for different cases
93 75 x s /R c terminal shock at steady state A=0.01, farthest upstream point.4. A=0.01, farthest downstream point A=0.05, farthest upstream point..0 A=0.05, farthest downstream point frequency, Hz Fig..7 Shock position ranges with different frequencies amplitude, x s /R c numerical result 0.1 analytical result frequency, Hz Fig..8 Comparison of the amplitude of terminal shock oscillation with analytical result (A = 0.01)
94 76 0 1/π π 3/π π (m e '/m e )/A...0 A = 0.05, f = 50 Hz A = 0.05, f = 500 Hz.0 A = 0.05, f = 1000 Hz 1.0 A = 0.10, f = 1000 Hz /π π 3/π π ωt Fig..9 Mass response to the pressure oscillation at exit over one cycle A = 0.05, f = 50 Hz A = 0.05, f = 500 Hz A = 0.05, f = 1000 Hz A = 0.10, f = 1000 Hz p 0,e /p 0, /π π 3/π π ωt Fig..10 Mass averaged stagnation pressure at exit over one cycle
95 y/rc 1.0 steady state τ =0/6T 1.0 τ =1/6T 0.8 τ =/6T τ =3/6T 0.8 τ =4/6T 0.6 τ =5/6T u e, m/s (a) Axial velocity y/r c steady state 0.4 τ = 0/6 T τ = 1/6 T 0.4 τ = /6 T 0. τ = 3/6 T τ = 4/6 T 0. τ = 5/6 T p 0,e /p 0, (b) Stagnation pressure Fig..11 Axial velocity, stagnation pressure profiles at exit plane (A = 0.05, f = 500 Hz)
96 y/r c _ u e,m/s (a) Axial velocity A = 0.05, f = 50 A = 0.05, f = 500 A = 0.05, f = 1000 A = 0.10, f = 1000 steady state y/r c _ p 0,e /p 0, A = 0.05, f = 50 A = 0.05, f = 500 A = 0.05, f = 1000 A = 0.10, f = 1000 steady state (b) Stagnation pressure Fig..1 Comparison of time averaged axial velocity and stagnation pressure profiles at exit plane
97 79.6 Conclusions Interactions between the shock waves and pressure waves were numerically investigated for a viscous flowfield in an axisymmetric, mixed-compression supersonic inlet diffuser by solving the unsteady Navier-Stokes equations with a two-equation turbulence model in cylindrical coordinates. A 500 Hz sinusoidal pressure disturbance with amplitude of 5% of the mean static pressure was applied to the exit plane as a baseline case. A number of notable features observed in this study are given below. 1) The acoustic response of the inlet flow increases with increasing amplitude of the imposed oscillation, but decreases with frequency. ) For a relatively large pressure oscillations (such as the case of A=5%), the adverse pressure gradient farther downstream of the terminal shock can steepen to form a secondary shock, while the primary shock may turn into a pressure pulse. Under an extreme case, the terminal shock may be disgorged out of the inlet to cause engine unstart. 3) Vorticities generated from the intersection points of the terminal shock and oblique shocks change their position in both axial and transverse directions as the terminal shock moves, resulting in a significant multi-dimensional effect. 4) Shock-induced flow-separation pockets on both walls form and disappear as the terminal shock moves. 5) The pressure oscillation causes a larger mass flow rate oscillation and severe axial velocity oscillation, which may exert strong influence on the combustor flowfield.
98 80 Chapter 3 Quasi-One-Dimensional Analyses of PDEs It has been pointed out that one-dimensional or quasi-one-dimensional simulations are not enough for the PDE analysis since they cannot correctly account for the effect of the exit boundary conditions. However, for a PDE with a convergentdivergent (CD) nozzle, the exhaust flow may exhibit supersonic behavior during most of the cycle period. Therefore, quasi-one-dimensional simulations are still acceptable and are conducted in this chapter as a preliminary step. Two-dimensional analyses will be considered in next chapters. The recently developed space-time conservation element/solution element (CE/SE) method is implemented because it circumvents the deficiencies of existing numerical methods for treating detonation waves and shock discontinuities. Chemical kinetics is modeled by a one-progress-variable scheme which is calibrated with NASA CEA code. The diffusive transport is neglected in the current study because of its minor role in determining detonation dynamics and system performance. 3.1 Space-Time CE/SE Method Introduction to Space-Time CE/SE Method The space-time conservation element and solution element (CE/SE) method was originally developed by S.C. Chang at NASA Glenn Research Center and was first published out in 1995 (Chang, 1995). It is a high-resolution and genuinely
99 81 multidimensional numerical method for solving conservation laws. This method differs substantially in both concept and methodology from other well-established methods, such as finite-difference, finite-volume, finite-element, and spectral methods. It has many nontraditional features, such as a unified treatment of space and time, enforcement of flux conservation in the space-time domain, introduction of solution and conservation elements to construct simple stencil, treatment of independent variables and their spatial derivatives as unknowns to be solved simultaneously, and no interpolation or extrapolation required to evaluate fluxes at cell interfaces. The development of the CE/SE method was motivated by the fact that physical conservation laws are actually a collection of statements of flux conservation in spacetime. Mathematically, these laws are represented by a set of integral equations, and the differential form of these laws is obtained from the integral form by assuming that the physical solution is smooth. For a physical solution in a region with rapid variations, this smoothness assumption is difficult to be realized by a numerical approximation that uses only a limited number of discrete variables. The situation becomes even worse in the presence of large gradients or discontinuities. Thus, a method designed to obtain numerical solutions to the differential form without enforcing flux conservation is a fundamental disadvantage in modeling physical phenomena with steep gradients. In contrast, a numerical solution obtained from a method that enforces flux conservation both locally and globally will always retain the basic physical reality of flux conservation even in a region involving discontinuities (Chang, 1995). With this consideration, the CE/SE method was designed to treat space and time as a single entity, and the integral form of the conservation laws are solved to ensure both
100 8 local and global flux conservation in space and time. In comparison, finite-difference, finite-element, and spectral methods deal with the differential form of the conservation laws. The traditional finite-volume method attempts to enforce flux conservation in space and/or time, but it treats space and time separately in the sense that flux conservation cells are defined only in the space domain. In the finite-volume method, a flux must be assigned at any interface separating two neighboring cells, and the flux is typically evaluated by extrapolating or interpolating the mesh values at the neighboring cells. This evaluation generally requires ad hoc techniques such as flux limiters or slope limiters. These ad hoc techniques usually involve the calculation of the eigenvector matrices of the Jacobian matrices, which may complicate the coding and increase the computational time. The CE/SE method introduces two types of cells in the space-time domain: conservation elements (CEs) and solution elements (SEs). The union of the CEs covers the whole computational domain. Physical conservation laws are enforced on each CE. The SEs are designed to facilitate the evaluation of the fluxes at interfaces separating neighboring CEs. Several unique features are adopted for this purpose. (1) Each SE is chosen to cover some interfaces of neighboring CEs. () A solution point is defined within each SE to hold both the basic independent variables and their spatial derivatives as unknowns to be solved simultaneously, while the time derivatives are obtained by satisfying the differential form of the governing equations at the solution point. (3) Each physical flux vector is approximated in terms of some simple smooth functions within each SE. With the above strategies, the CE/SE method is able to enforce both local and global flux conservation in space and time with flux evaluation being an integral part of
101 83 the solution procedure and requiring no interpolation or extrapolation. As a result, the CE/SE method is more efficient than the traditional finite-volume method in terms of coding complexity and computational burden. A distinguished feature of the Space-Time CE/SE method is that it can fully control numerical dissipation, even down to zero if necessary. This is important in simulating flows involving small disturbances such as sound waves. Relatively large numerical dissipation introduced by numerical schemes can lead to the annihilation of small disturbances. Unexpected numerical dissipation may overwhelm physical dissipation, causing a complete distortion of the solution. Thus, a solver that can fully control its numerical dissipation is desirable. For conventional methods, numerical dissipation is adjusted by varying the magnitude of added artificial dissipation terms. With a few exceptions, numerical dissipation in almost every traditional scheme cannot be reduced to zero even without artificial dissipation terms. A study of finite-difference analogues of a simple convection equation shows that a numerical analogue is free of numerical dissipation only if it does not violate certain space-time invariant properties of the convection equation (Chang, 199). In other words, numerical dissipation may be considered as a result of symmetry-breaking by a numerical scheme. An ideal scheme must be able to reserve this symmetry property in order to avoid numerical dissipation. Because of the intrinsic nature of space-time unity, the Space-Time CE/SE method is perfectly suited to constructing such schemes. Its ability to accurately simulate both small disturbances and strong shock waves has been proven in treating various problems involving interactions between shock waves and sound waves (Loh et al., 1996).
102 Space-Time CE/SE Method for One-Dimensional Problems This subsection, adopted from Wu (00) with minor modifications, describes the solution procedure of the Space-Time CE/SE method for one-dimensional systems governed by Q E + = H t x (3.1) Since the Space-Time CE/SE method treats space and time as a single entity, the computational domain for spatially one-dimensional problems becomes a twodimensional Euclidean space E = ( x, ). Define h = ( EQ, ) as the current vector in E. t The Gaussian divergence theorem in E leads to the integral form, which is a more physically basic form: h ds= HdV (3.) sv ( ) V The second step is to construct the CEs and SEs. The computational domain E is discretized equally in space and time, and the dimension of each cell is assumed to be x by t. Following the suggestion of Yu and Chang (1997), the conservation element CE(j, n) and the solution element SE(j, n) are both defined to cover the rectangular area ABCDEFA with a line segment AG sticking out on top of the rectangle, as shown in Fig Each CE(j, n) can be divided into two sub-elements: CE _ (j, n) and CE + (j, n). The boundaries of CE _ (j, n) are AB, BC, CD, and DA, while CE + (j, n) is enclosed by FA, AD, DE, and EF. Note that the line segments BC and CD belong to the solution element SE(j-1/, n-1/) and the line segments DE and EF to SE(j+1/, n-1/).
103 85 G n+1/ B A F n t x C CE (j, n) CE + (j, n) D E n-1/ n-1 j-1 j-1/ j j+1/ j+1 Fig. 3.1 Mesh system and CEs/SEs in Space-Time CE/SE method (adopted from Wu, 00). For any point (x, t) SE(j, n), the dependent variable vector Q(x, t), flux vector E(x, t), and source term vector S(x, t) are approximated by Q * (x, t; j, n), E * (x, t; j, n), and H * (x, t; j, n), respectively, whose definitions are given below. n n n Q ( x, t; j, n) = Q + ( Q ) ( x x ) + ( Q ) ( t t ) (3.3) * n j x j j t j n n n E ( x, t; j, n) = E + ( E ) ( x x ) + ( E ) ( t t ) (3.4) * n j x j j t j * n n n n H ( xt, ; j, n) = H + ( H ) ( x x ) + ( H ) ( t t ) (3.5) j x j j t j where the label ( ) denotes the corresponding quantities evaluated at mesh point (j, n) n j whose coordinate is (x j, t n ). Q * (x, t; j, n), E * (x, t; j, n), and H * (x, t; j, n) are actually firstorder Taylor's expansions of Q(x, t), E(x, t), and H(x, t) at point (j, n), respectively. Moreover, all terms on the right-hand sides in the above approximations are only functions of n Q j, ( Q ), and x n j ( Q ) because 1) both t n j n E j and n H j are only functions of n Q j, and ) ( E ), ( H ) n x n j x j ( E ), and ( H ) n are only functions of t n j t j n Q j, ( Q ), and n x j ( Q ) t n j due to the following relations:
104 86 ( E ) n = A n ( Q ) n, ( H ) n = D n ( Q ) n (3.6) x j j x j x j j x j ( E ) n = A n ( Q ) n, ( H ) n = D n ( Q ) n (3.7) t j j t j t j j t j where n E n n H A j ( ) j and D j ( ) Q Q n j are the Jacobian matrices of the convective flux vector E and source term vector H at (x j, t n ), respectively. The Space-Time CE/SE method further requires the above solution approximations to satisfy the following differential form of the governing equations within SE(j, n) except the line segment AG that sticks out on the top of the solution element. Q t E + = H x * * * (3.8) Substitution of equations (3.3)-(3.5) into the above equation leads to n n n ( Q ) + ( E ) = H (3.9) t j x j j From which ( Q ) can be expressed as function of t n j n Q j and ( Q ). x n j Define * * * h ( x, t; j, n) ( E ( x, t; j, n), Q ( x, t; j, n)) as the approximation of the current density vector h = ( EQ, ) within the conservation element CE(j, n). Then the fluxes at AB and FA can be evaluated in terms of n Q j and ( Q ). Similarly, the fluxes at other boundaries of CE(j, n) (i.e., BC, CD, DE, and EF ) can be obtained by applying equations (3.3)-(3.9) to the solution elements SE(j±1/, n-1/). With the fluxes at all the boundaries of CE(j, n) being evaluated, the integral form of the conservation laws, equation (3.), can be readily enforced on CE(j, n). x n j
105 87 n 1 1 n 1/ n 1/ n 1/ n 1/ Qj HdV = Qj 1/ + Qj+ 1/ + Rj 1/ Rj+ 1/ RHS x CE ( j, n) (3.10) where R is defined as n x n t n ( t) n n R j ( Qx ) j + E j Aj ( E x ) (3.11) j 4 x 4 x After n Q j are solved from equation (3.10), ( Q ) can be evaluated using the x n j following oscillation-suppressing procedure. First, the solutions at point (j±1/, n) are approximated using the first-order Taylor series expansions as shown below. n n Q' j 1/ Q + n ± j ( Qx± ) j ± (3.1) x / n n 1/ t n 1/ Q ' j± 1 / = Q j± 1/ + ( Qt ) j± 1/ (3.13) where (Q ) + n x+ j and (Q ) + n x j are two numerical analogues of ( Q ) at point (j, n) evaluated x n j from the right and left sides, respectively. Define function W as α + x α x+ α α x + x x+ W ( x+, x ; α) = (3.14) + x Then ( Q ) can be calculated using x n j n + n + n ( Q ) = W (( Q ),( Q ) ; α) (3.15) x j x+ Usually, α is chosen as an integer of. Before closing this section, there are two points to be emphasized. First, even though numerical dissipation has been introduced into the scheme during the above oscillation-suppressing procedure, conservation laws are strictly enforced on CE(j, n). Moreover, since the union of all conservation elements covers the entire computational j x j
106 88 domain, global conservation is also enforced strictly. Second, although the order of the accuracy of the solution approximations, equations (3.3)-(3.5), is second order, the actual accuracy of the above scheme is comparable to that of 4-6th order compact difference schemes when nonlinear Euler problems are modeled. This is because second order is its nominal order of accuracy, and is only meaningful for linearized equations. For nonlinear problems, the flux conservation property ensures that the space-time method possesses an order of accuracy much higher than its nominal one. In addition, the spacetime method has surprisingly small dispersive errors in nonlinear calculations, which also contributes to the enhancement of its accuracy (Wang, et al., 1994). 3. Governing Equations The conservation equations of mass, momentum, energy, and species concentration in a quasi-one-dimensional system can be written in the following vector form. Q E + = H (3.16) t x The conserved variable vector Q, convective flux vector E, and source vector H are defined as ρ ρu Q =, ρet ρz ρu ρu + p E =, u( ρet + p) ρuz ρu 0 1 da ρu 0 H = + Adx u( ρet + p) 0 ρuz ω (3.17)
107 In the above equations, ρ, u, e t, Z and A represent the density, velocity, specific total energy, mass fraction of reactant, and area of cross section, respectively. The pressure p is obtained through the equation of state for a perfect gas as, 89 p = ( γ 1) ρ[ et u / Zq] (3.18) with γ the specific heat ratio, q the heat release per unit mass of reactant. The mass production rate ω is obtained using the Arrhenius expression, ω = KρZ exp( E / RT ) (3.19) with K the pre-exponential reaction rate factor, Ea the activation energy per unit mass of reactant, R the gas constant, and T the temperature which can be obtained using perfect gas state equation: a T = p / ρr (3.0) It is noted that there are five parameters (γ, R, q, Ea and K) associated with the above governing equations. Determination of these parameters is discussed in the following section. The Jacobian matrices of the flux and source vectors are given in Appendix B. 3.3 Parameter Calibration and Code Validation Parameter Calibration Among the five parameters γ, R, q, Ea, and K, the first three are thermodynamic parameters that determine the detonation wave properties such as the CJ state and wave speed. These three parameters are calibrated with the NASA CEA code (McBride and Gordon, 1996) for a stoichiometric H /air mixture, as described below.
108 90 Two sets of CJ detonation solutions, one from the CEA code and the other from analytical formulation given in Sec. 1..1, are first obtained for a series of different unburned pressures and temperatures: p 1 = 1, atm, T 1 = 300, 350, 400, 450, 500 K. The simulated annealing (SA) optimization algorithm (Belegundu and Chandrupatla, 1999) is then applied to find the optimum values of γ, R, and q by minimizing the relative difference in terms of T CJ /T 1, p CJ /p 1 and u D between these two sets of solutions. The following values are obtained. γ = 1.90, R = J/(kg K), q = J/kg (3.1) The analytical CJ detonation velocity and CJ state based on these parameters are compared with those from CEA code and shown in Fig. 3.. It is observed that both the CJ temperature and pressure agree with the CEA results very well, with a maximum relative error less than 8%, and have the same trends as T 1 increases. The detonation velocity differs in the trend. For example, the analytical CJ detonation velocity increases with T 1, while the detonation velocity from CEA code decreases with T 1. Although the trend is different, the relative errors for the detonation velocity are still small, e.g., less than 3%. These small relative errors indicate that the current one-progress-variable model represents a good approximation in predicting the detonation wave properties. The other two parameters, Ea and K, are chemical kinetic parameters. Their primary influence appears in the internal structure of a detonation wave front, and the effect on the overall flow evolution and propulsion performance are relatively minor. The following values, adopted from Mohanraj and Merkle (000), are used for these two parameters. Ea = J/kg, K = s 1 (3.)
109 91 T CJ /T 1, p CJ /p ZND CEA D CJ D CJ p CJ /p 1 T CJ /T 1 p 1 =1atm T 1 (K) D CJ (m/s) (a) p 1 = 1 atm T CJ /T 1, p CJ /p ZND CEA D CJ D CJ p CJ /p 1 T CJ /T 1 p 1 =atm T 1 (K) D CJ (m/s) (b) p 1 = atm Fig. 3. Comparison of detonation velocity and CJ state between ZND model and CEA
110 ZND Detonation in a One-Dimensional Tube The code is first validated for a ZND detonation in a one-dimensional tube as discussed in Sec Figure 3.3 shows the schematic of the physical problem. The 0 cm-long tube is closed at the head end and open at the other. Initially, it is filled with static, premixed stoichiometric hydrogen/air at temperature T 1 = 300 K and pressure p 1 = 1 atm. A small energetic spark region spanning 0.0 cm with temperature T i = 000 K and pressure p i = 30 atm is placed at the head end to initiate detonation. spark region (p i = 30 atm and T i = 000 K) stoichiometric hydrogen/air at p 1 = 1 atm and T 1 = 300 K Fig. 3.3 Schematic of detonation tube with spark region at closed end A series of calculations are carried out with five different grid resolutions to conduct grid-dependence study as well as validation. The grid points of these grids are 1000, 000, 4000, 8000, 16000, respectively. Figures 3.4~3.7 show the time evolutions of pressure, temperature, mass fraction and velocity, respectively, for the case of grid points of 000. These figures clearly depict the propagation of a self-sustained and fullydeveloped detonation wave. The leading shock, the rarefaction wave region, and the uniform region can also be observed. The small non-uniform region of temperature near the head end is due to the remaining effect of the initial spark. Figure 3.8 shows the snapshots of pressure profiles at t = 80 µs with different grid resolutions. These profiles collapse into a single one, demonstrating nearly perfect
111 93 satisfaction of grid dependence. The only exception is that the pressure immediately after the shock (spike pressure) increases with grid resolution. This is due to the fact that the higher the resoltuion, the less the degree of reaction across the shock front, thus leading to a higher spike pressure. Theoretically, the von Neummann spike pressure can be reached by using tremendously high resolution grid. However, significant round-errors appear with high reslolution grid, leaving the spike pressure unreachable in practice. In a worst case, too fine grid may cause unphysical soltutions. It is found that the detonation is not ignited with the finest grid (grid points = 16000). Similar phenomenon was also reported by Ebrahimi et al. (1999). Table 3.1 compares the numerical solutions of different grid resolutions in terms of detonation velocity, von Neummann spike pressure, CJ state, and head-end pressure. The analytical solutions, obtained from the formulation given in Sections 1..1~1..3, are also listed for comparison. All these values are in perfect agreement with each other except for the von Neumann spike pressure.
112 t = µs 0 0 p, atm x, m Fig. 3.4 Time evolution of pressure field for ZND problem (grid points = 000) t = µs T, K x, m Fig. 3.5 Time evolution of temperature field for ZND problem (grid points = 000)
113 t = µs Z x, m Fig. 3.6 Time evolution of reactant mass ratio field for ZND problem (grid points = 000) t = µs u, m/s x, m Fig. 3.7 Time evolution of velocity field for ZND problem (grid points = 000)
114 96 Fig. 3.8 Snapshots of pressure field for ZND problem with different grid points Table 3.1 Comparison of numerical results of different grid resolutions with analytical solutions for the ZND problem grid points u D, m/s p s, atm p CJ, atm T CJ, K u CJ, m/s p 3, atm analytical ± ± ± ± detonation can not be initiated
115 Flow Through a Convergent-Divergent Nozzle A calculation is carried out for a non-reacting flow through a nozzle with a length of 1 m and a cross-section area of A(x) = 1 + (x 1), as shown in Fig 3.9. The stagnation pressure (P 0 ), stagnation temperature (T 0 ) and back pressure (p b ) are atm, 400 K, and 1.5 atm, respectively. Specific heat ratio γ is taken as 1.4. The analytical solution can be easily obtained from the classical gasdynamics. Figure 3.10 compares the pressure distribution with the analytical solution and perfect agreement is observed. A(x) = 1 + ( x -1 ) P 0 =atm T 0 = 400 K γ =1.4 p b =1.5atm Fig. 3.9 Schematic of convergent-divergent nozzle in the validation case p, atm numerical 0.5 analytical x, m Fig Comparison of pressure distributuion with analytical results
116 Flow Dynamics The validated quasi-one-dimensional code is then used to study the flow dynamics and system performance of an airbreathing PDE with a convergent-divergent (CD) nozzle. The reason for choosing a CD nozzle is that other types of nozzles such as convergent, divergent and plug nozzles have been studied by many researchers and limited performance improvements on the performance were found. On the other hand, the CD nozzle results in a supersonic exit flow during most of the cycle period, thus reducing the error induced by the exit boundary condition. The tube has a length of 60 cm and a diameter of 16 cm, with a valve located at the head end as shown in Fig The valve is supposed to be either fully closed or fully open. The nozzle has a length of 0 cm, with a 45 convergent angle and a 15 divergent angle. The diameters of the nozzle throat and exit are 1 cm and 0 cm, respectively. valve 16 cm 1 cm 0 cm cm 0 cm Fig Configuration of the single tube and CD nozzle in the current study As a specific example, the flight condition involving an altitude of 9.3 km and a Mach number of.1 is considered. The free stream static pressure and temperature are 0.9 atm and 8 K, respectively, corresponding to a total pressure of.65 atm and a total temperature of 48 K. The supersonic inlet at this flight condition has been studied
117 99 in Chapter. Based on the inlet analyses, the exit flow of the inlet has a total temperature of 48 K and a total pressure of.3 atm. By assuming 5% loss of the total pressure within the manifold, the total pressure at the entrance of the combustor becomes.1 atm, where the total temperature is still 48K. The cyclic operation of the PDE is controlled by a valve located at the entrance of the combustor. Generally, there are two modes of valve operation (Mohanraj and Merkle, 000). One is external mode, i.e., the timing of the valve opening and closing is specified externally. The other is internal mode. In this mode, the opening and closing procedures are controlled by the flow condition inside the detonation tube, e.g., using a pre-specified threshold pressure for valve open and a chemical sensor in the detonation tube for valve close. In the present study, the first mode is chosen and the valve response time is neglected for simplicity, i.e., the valve is either fully closed or fully open. Furthermore, the valve open area is equal to that of the detonation tube. The engine operation sequence, as shown schematically in Fig. 3.1, is thus controlled by three time periods: the valve close-up period (τ close ) during which the valve is closed and the tube undergoes detonation initiation and propagation and blowdown processes, the purging period (τ purge ) during which a small amount of cold air is injected into the tube to prevent preignition of fresh reactants, and the refilling period (τ refill ) during which the combustible mixture is delivered to the tube. The sum of these three periods equals the operation cycle time (τ cycle ), that is, τ cycle = τ close + τ purge + τ refill.
118 100 detonation initiation and propagation; blow-down purge refill τ close τ purge τ refill Fig. 3.1 Time periods during one cycle of operation The boundary conditions at the head end of the detonation tube are specified according to the engine operation. During the valve close-up stage, the head end is modeled as a rigid wall. During the purging stage, the total temperature and total pressure are specified as 48 K and.1 atm, respectively, as mentioned in Section II. The axial velocity is obtained with extrapolation, and the reactant mass fraction is set to zero. During the refilling stage, the same conditions are used except that the reactant mass fraction is set to unity. At the exit of the nozzle, the boundary conditions are determined from the flow condition at exit. If the flow is supersonic, all flow variables are extrapolated from inside. If the flow is subsonic, the exit pressure is specified as the ambient pressure and other flow variables are extrapolated. A series of calculations are conducted for various operation parameters. A particular case with τ cycle = 3 ms, τ close =.1 ms, and τ purge = 0.1 ms is first studied in detail to investigate the flow dynamics of the airbreathing PDE. The detonation tube is initially filled with a stoichiometric H /air mixture at ambient pressure and temperature. It takes about 6 cycles to reach a stable operation. Figure 3.13 presents the temporal evolution of the pressure field within one cycle of operation. Detonation is initiated immediately after the valve is closed. The detonation wave moves downstream and catches the leading fresh reactant at about x = 36 cm. It then degenerates to a non-
119 101 reactive shock wave. Expansion waves from the interface reduce the pressures on both sides. When the shock wave reaches the convergent section of the nozzle, a reflected shock wave is formed and travels upstream. This reflected shock is reflected again when it reaches the head end of the combustor. On the other hand, the average chamber pressure decreases as the mass flows out of the combustor and nozzle. As the purging stage begins, a shock wave is generated due to the pressure difference across the valve. It is observed that the nozzle throat remains choked during most of the cycle period. A more clear and detailed wave pattern is numerically obtained through the Eulerian approach as detailed in Appendix C. Figure 3.14 shows the x-t diagram during the first cycle. The time history of the flow properties at head end is also presented. The detonation wave is ignited in a very short time and propagates at a uniform CJ velocity of 1935 m/s in the unburned region (region 1), followed by the Taylor expansion waves (region ) to satisfy the stationary condition at head end. A uniform region (region 3) is then formed behind the tail of Taylor waves. At t = ms, the detonation wave arrives the reactant-product interface (point A), which is also the nozzle inlet, and transits to a non-reactive shock wave continuing to the nozzle exit. At the same time, expansion waves are generated from the interface. However, these expansion waves are soon overridden by the later formed compression waves from the convergent section of the nozzle. A shock wave is eventually formed due to the coalescence of the compression waves. This shock wave arrives at the head end at t = ms (point B) and reflects again, causing an abrupt increase of the head-end pressure, which can be clearly observed in the time history of head-end pressure. This leads to a significant difference in the head-end pressure history from that of Wintenberger et al. (003) which was based on an
120 10 ideal modeling. Expansion waves are also emanated from the nozzle throat, result in a non-simple wave region when interacting with the Taylor waves, form a simple wave region (region 5) after passing through the tail of the Taylor waves, and cause a gradual decrease of head-end pressure. Inside the nozzle, flow chokes shortly after the primary shock passing through the throat. A secondary shock is then generated due to the interaction of the supersonic flow later induced by flow expansion from the divergent section and the subsonic flow immediately following the primary shock. The flow within the divergent section becomes fully supersonic after this secondary shock moves out of the nozzle. When the purging stage begins at t =.1 ms, the head-end pressure increases suddenly and two discontinuities appear: a shock wave caused by the pressure difference across the valve and a contact surface caused by the temperature difference between the hot product and the cold air. It can be clearly seen that the left-traveling characteristics deflect when passing through these two discontinuities. The refilling stage begins 0.1 ms later, causing a third discontinuity, i.e., a contact surface between reactant and air. This contact surface travels to x = 3 cm at the end of the first cycle, representing a partial filling for the next cycle. Under the effects from the previous cycle, the wave pattern becomes much more complicated during later cycles. Figure 3.15 shows the x-t diagram and time history of head-end properties for a stable cycle. A significant difference from the first cycle is the absence of the pressure plateau due to the effects of the shock waves and expansion waves from the previous cycle. However, many phenomena are still similar, such as the propagation of detonation wave, Taylor expansion waves, choked throat, contact surfaces induced by purging and refilling, and so on.
121 103 p, atm p, atm p, atm p, atm p, atm 0 τ =0.15ms 15 (propagation stage) τ =0.5ms τ =0.75ms τ =1.5ms τ =.15ms (purgingstage) 1 0 τ =.5 ms (refilling stage) p, atm 1 p, atm 0 1 τ =.50ms x, m Fig Temporal evolution of pressure field within one cycle of operation (τ cycle = 3 ms, τ close =.1 ms, τ purge = 0.1 ms)

122 104 Fig x-t diagram for the first cycle and time histories of flow properties at head end under typical PDE operation with CD nozzle (stoichiometric H /air mixture, τ cycle = 3 ms, τ close =.1 ms, τ purge = 0.1 ms). 1 = uniform unburned region, = Taylor expansion waves, 3 = uniform region, 4 = non-simple wave region, 5 = simple wave region.


123 105 Fig x-t diagram for the eighth cycle and time histories of flow properties at head end under typical PDE operation with CD nozzle (stoichiometric H /air mixture, τ cycle = 3 ms, τ close =.1 ms, τ purge = 0.1 ms).
124 Parametric Study Effect of Valve Timing A parametric study is conducted to study the timing effect on system performance by varying τ cycle and τ close. The purge time τ purge is fixed at 0.1 ms. Figure 3.16 shows the effect of τ close on the specific thrust F sp, defined as the cycle-averaged thrust per unit of air mass flow rate, and the fuel-based specific impulse, I sp, at four different cycle frequencies of 00, 50, 333, and 400 Hz. The corresponding cycle periods are 5, 4, 3, and.5 ms, respectively. The specific thrust increases as τ close decreases for all of the frequencies considered herein. This can be explained as follows. For a given τ cycle and τ purge, a smaller τ close translates to a shorter blow-down process. The resultant higher chamber pressure during the refilling stage increases the loading density of fresh reactants. The increased refilling period also enhances the amount of reactants delivered to the chamber. Combined, these two factors result in a higher cycle-averaged chamber pressure and consequently a higher specific thrust. It should be noted, however, that the lower bound of τ close is subject to three practical constraints. The first is concerned with inlet overpressurization. The head-end pressure must not exceed the stagnation pressure of the inlet air to allow for purging and refilling when the valve is open. The second is related to chamber over-filling. The fresh reactants should not flow out of the nozzle to the external region before being burned completely unless after-burning is considered. The third constraint, although commonly satisfied in practical cases, is that τ close should be sufficiently long to cover at least the time required for detonation initiation and
125 107 propagation throughout the entire chamber. The upper bound of τ close (or the lower bound of τ refill ) is based on the requirement that an appropriate amount of fresh reactants be delivered to the chamber to produce thrust. The effect of τ close on the fuel-based specific impulse follows the same trend as that of the air-based specific thrust, except for a small range of τ close close to its lower bound. The specific impulse and specific thrust satisfy the following relation, I sp F (1 sp + τ / τ ) purge refill = (3.3) fg As τ close decreases, the factor (1 + τ purge/ τ refill ) decreases and may override the increase of F sp, consequently leading to a decrease in I sp, as shown in Fig. 3.16b. For a given cycle period, τ close determines the filling length of fresh reactants. A larger τ close (or smaller τ refill ) leads to a smaller filling length in most cases and consequently decreases the specific impulse. This result, however, is in contrast to the previous experimental (Cooper and Shepherd, 00) and numerical (Li and Kailasanath, 00) observations for single-pulse operations, which concluded that the specific impulse increases as the filling length decreases. One factor contributing to this discrepancy is that in single-pulse studies, the pressure and temperature of reactants are preconditioned to ambient values, while in the present multicycle study, the flow conditions of the refilled mixture depend on the timing of the engine operation. The use of a choked CD nozzle also exerted a substantial influence on the chamber dynamics. Significant differences thus exist between single-pulse and multicycle operations. The conclusions from single-pulse studies may not be applied to multicycle cases directly.
126 108 specific thrust F sp,m/s τ cycle =.5ms 3ms inlet over-pressurization combustor overfilled 4ms 5ms τ close,ms (a) specific thrust 4000 I sp,s τ cycle =.5ms 3ms inlet over-pressurization combustor overfilled 4ms 5ms τ close,ms (b) specific impulse Fig Effect of valve close-up time on (a) specific thrust and (b) specific impulse at four different operation frequencies; straight tube with CD nozzle; stoichiometric H /air mixture, h = 9.3 km, M =.1.
127 109 Figure 3.16 also demonstrates the existence of an optimum frequency for achieving a maximum performance. At a low cycle frequency, more reactants can be recharged into the detonation tube. As a consequence, a higher chamber pressure can be reached and the engine efficiency improves. However, a large refilling time associated with low-frequency operation may cause chamber over-filling and thus degrade the performance. These two conflicting effects result in an optimum frequency. In the present study, the operating frequency of 50 Hz (τ cycle = 4 ms) offers the best performance. The highest specific impulse is 3676 s, slightly lower than its ramjet counterpart of 3866 s with optimum nozzle flow expansion (Wu, Ma, and Yang, 003) Effect of Nozzle Throat Area The effect of the nozzle throat area was also studied. Figure 3.17 compares the performances between the aforementioned CD nozzle and another CD nozzle with a smaller throat diameter of 10 cm. A smaller throat implies higher chamber pressure, therefore, performance gains are observed for those τ close that are larger than their corresponding optimums. A smaller throat also leads to an earlier inlet overpressurization. Apparently, the operating ranges for τ close are narrower with the smaller throat under frequencies of 333 Hz and 50 Hz. For the 00 Hz case, however, the operating range becomes wider, since the lower limit is determined by combustor overfilling for the larger throat under this frequency while a smaller throat can postpone the combustor overfilling. An even smaller throat with a diameter of 8 cm was also tested. A too small throat is not beneficial because of the inlet over-pressurization.
128 110 specific thrust F sp,m/s larger throat τ cycle =3ms inlet over-pressurization combustor overfilled 4ms smaller throat 5ms τ close,ms (a) specific thrust 4000 smaller throat Isp, s larger throat τ cycle =3ms inlet over-pressurization combustor overfilled 4ms 5ms τ close,ms (b) specific impulse Fig Effects of τ close on (a) specific thrust and (b) specific impulse at three different frequencies for two CD nozzles with different throat areas. The larger one has a diameter of 1 cm and the smaller one 10 cm.
129 111 Chapter 4 Two-Dimensional Analyses of Single-Tube PDEs One-dimensional simulations are computationally efficient. Nevertheless, they cannot provide detailed multidimensional flow dynamics and cannot be applied to a PDE involving multiple detonation tubes. Multidimensional simulations with computation domain including both the detonation tube and the external region are required in order to faithfully describe the system dynamics, especially in the near field of the tube exit where the flow is intrinsically multidimensional, and to provide more accurate performance predictions. However, the difficulties of using very fine grid to resolve the significant flow structure and running many time steps to reach steady periodic operation have limited previous multidimensional simulations of PDEs. Two-dimensional multicycle simulations, to the knowledge of the author, has not been reported elsewhere in the literature. In the current study, an efficient parallel computing technology coupling to the high fidelity Space-Time CE/SE method is implemented to overcome these difficulties. 4.1 Governing Equations The analysis is based on the two-dimensional conservation equations of mass, momentum, and energy and takes into account finite-rate chemical kinetics. Diffusive effects are neglected in the current study because of their minor roles in determining the overall flow dynamics and propulsive performance of PDEs. If the chemical reaction rate
130 11 is expressed with a single progress variable, the resultant governing equations can be written in the following vector form: Q + E + F = H (4.1) t x y where the dependent variable vector, Q, convective flux vectors, E and F, and source vector, H, are defined as: ρ ρu Q = ρv, ρet ρ Z ρu ρu + p E = ρuv, u( ρet + p) ρuz ρv ρuv F = ρv + p, v( ρet + p) ρvz 0 0 H = 0 0 ω (4.) In the above equations, ρ, u, v, e t, and Z represent the density, axial velocity, vertical velocity, specific total energy, and progress variable (i.e., mass fraction of reactant), respectively. The pressure p is obtained through the equation of state, p = ( γ 1) ρ[ et ( u + v ) / Zq] (4.3) where γ is the specific heat ratio and q the heat release per unit mass of reactant. For a one-step, irreversible reaction, the mass production rate of reactant ω is ω = KρZ exp( E / RT ) (4.4) where K is the pre-exponential factor, T the temperature, E a the activation energy per unit mass of reactant, and R the gas constant. The five parameters involved in the above equations remain the same as those in Chapter 3. The Jacobian matrices of the flux and source vectors of Eq. (4.1) are given in Appendix B. a
131 Numerical Treatment and Parallel Implementation A two-dimensional unstructured triangular mesh non-reacting Euler solver based on the space-time CE/SE method has been developed by Wang and Chang (1999). The ideas and solution procedure are identical to the one-dimensional version described in Chapter 3. The details of the space-time CE/SE method for two-dimensional problems are given in Appendix D. In the current study, a two-dimensional code is developed and efficiently parallelized by implementing the message-passing-interface (MPI) library and the domain decomposition technique. The parallel code is then executed on an in-house Beowulf cluster. Beowulf is a multi-computer architecture for parallel computations. A Beowulf system is a cluster of PCs (or workstations) including server nodes and client nodes connected through network such as switch ( This system has only a history of several years. The first Beowulf Cluster was built by NASA in The current in-house Beowulf cluster was built up in 1997 and has been extended to a large parallel system consisting of 350 workstations and several high-speed switches. Parallel virtual machine (PVM) and message passing interface (MPI) are software systems for writing message-passing parallel programs that run on a cluster. PVM used to be the de facto standard until MPI appeared. The MPI is standardized by the MPI Forum and available on all massively parallel supercomputers. To effectively use the Beowulf system, the task should be properly distributed among the processors. A common approach is to decompose the computational domain into sub-domains and assign each sub-domain to a different processor. The objective of
132 114 domain decomposition is to balance the computational workload and memory occupancy of processing nodes while keeping the inter-node communication as small as possible. In the current work, a software package, METIS, which is a family of programs for partitioning unstructured graphs and hypergraphs and computing fill-reducing orderings of sparse matrices (Karypis and Kumar, 1998), is used for domain decomposition. 4.3 Model Validation As part of the model validation effort, a series of single-pulse calculations were conducted for a straight tube of 60 cm in length initially filled with a stoichiometric mixture of hydrogen and air at preconditioned pressure p 1 and temperature T 1. A spark region spanning 0. mm near the head end with a temperature of,000 K and a pressure of 30 atm was employed to directly initiate the detonation wave. Four different numerical grids with the sizes of 0., 0.1, 0.05, and 0.05 mm were used to check the solution accuracy in terms of grid independence. All of the calculated pressure profiles collapsed onto a single curve, with the CJ properties matching the analytical values exactly. As a result, the 0. mm grid was chosen for the entire study to alleviate the computational burden. For a single-pulse operation, the head-end pressure remains at a plateau value p 3 for certain period soon after the detonation initiation, and then decays gradually to a level lower than the ambient state. The impulse on the thrust wall can be determined by integrating temporally the force exerted on the head end from t = 0 to the instant when the head-end pressure reaches the ambient value. The contribution to the impulse from the ignition source is estimated to be less than 0.5%. Figure 4.1 shows the
133 115 impulse per unit cross-sectional area as a function of the plateau pressure p 3 and the detonation residence time τ D (defined as the tube length L divided by the detonation wave velocity u D, i.e., τ D L/u D ). Results can be correlated well in the following form I / A= 4.1( p p )τ (4.5) 3 1 D Impulse/Area, N s/m present results Kailasanath (003) (p 3 -p 1 )τ D,Pa s Fig. 4.1 Generalized impulse curve for single-pulse detonation in straight tube with stoichiometric H /air mixture. This expression is quite similar to those obtained from the semi-analytical analysis of Wintenberger et al. (003) and the experimental work of Falempin et al. (001). The constants of proportionality differ slightly in the various studies, suggesting dependence on the details of experimental procedure and operating conditions. The generalized formula proposed by Kailasanath (003) based on his numerical simulations for hydrogen/air, ethylene/oxygen, and propane/oxygen mixtures has a larger constant of proportionality of One factor contributing to this disparity may be differences in
134 116 ignition source. The width of the detonation initiation region used by Kailasanath (003) is 0 mm, as opposed to 0. mm in the present simulations. Nonetheless, the above parametric study demonstrates the capacity and fidelity of the present approach for the PDE performance analysis. 4.4 Calculation of Propulsive Performance The propulsive performance of the PDE must be calculated appropriately. There are several ways to experimentally measure the impulse, such as integrating the pressure force on the thrust wall, using the ballistic pendulum, load cell, damped thrust stand, and spring-damper system, as discussed in Sec In numerical simulations, the impulse or thrust can be obtained either by integrating the pressure force on the thrust wall or through a momentum balance fro the entire system. The latter is more practical for PDEs including both inlet and nozzle and is detailed as below. Considering a control volume that contains the fluid within the entire engine, the momentum conservation gives: CV ρu dv + [ ρ + ( p p ) ] ds = 0 t uu n n (4.6) CS where CV represents the control volume and CS the control surface which can be further divided into three parts: the entrance plane S i, the exit plane S e, and the remaining surface S w. Defining m e, u e, and pe as m e = ρu nds (4.7) Se
135 u e = 1 ds m ρ uu n e Se 117 (4.8) p e 1 = pds A (4.9) e Se the instantaneous thrust, in a vector form, can thus be derived: ρu F= { [ m eue m au i] + [( pe p ) Aei] } dv (4.10) t The second term on the right-hand side is arisen from the unsteady effect. For a steady periodic operation, the cycle average of this term becomes zero, and the cycle-averaged thrust becomes CV ( ) F = m u m u i p p Ai (4.11) e e a e e where the bracket denotes the cycle-averaged quantities. Because of the symmetric property of the system, the vertical component of the cycle-averaged thrust is zero, and the axial component is ( ) F = m u m u + p p A (4.1) e e a e e This formulation is identical to the conventional one obtained for steady engines, except for the averaging symbol. The two terms on the right-hand side are referred to as momentum thrust and pressure thrust, respectively. The air-based specific thrust and fuel-based specific impulse are then calculated as F sp F = (4.13) m a I sp F = (4.14) m g f
136 118 It should be pointed out that, since the valve timing, the total pressure, and the total temperature in front of the valve are prespecified, the air mass match between the combustor and the inlet is achieved either by adjusting the width of the combustor, which is a free parameter in two-dimensional simulations, or by changing the size of the inlet. Otherwise, the computational domain should be extended more upstream to cover a choked section so that the mass flow rate instead of the total pressure is specified at the entrance boundary. 4.5 Straight-Tube PDE As a first approach, a single straight tube is considered to provide direct insight into the chamber dynamics without complications arising from the nozzle Problem Setup The computational domain is shown schematically in Fig. 4.. The detonation tube measures 60 cm in length and 16 cm in height, which are similar to the dimensions of contemporary ramjet combustors for air defense applications. An external region is included to circumvent the difficulty of specifying boundary conditions at the tube exit. The computational domain is discretized into unstructured triangular grid cells, with for the detonation tube and for the external region. This dense grid resolves the detailed detonation propagation in the axial direction and was selected after performing a grid independence analysis of the computed solution such as pressure profile along the axial direction. The cell size near the head end is about 0.4 mm in the
137 axial direction and mm in the vertical direction. It increases to about 5 mm at the external boundary. 119 Fig. 4. Computational domain for straight-tube PDE Domain Decomposition The computational domain is decomposed into 64 sub-domains using the METIS software (Karypis and Kumar, 1998) for parallel computing. This domain decomposition technique allows for the balance of the computational workload and memory occupancy of processors, while keeping the inter-processor communications as low as possible, and thus obtaining a high parallel efficiency. With METIS, each cell is marked with a number to which sub-domain (or sub-grid) it belongs. A user code is then needed to gather this information and write out sub-grid data into different grid files. Figure 4.3 schematically shows the computational domain that decomposed into 64 sub-domains. The number of cells for each sub-domain is given in Fig. 4.4, demonstrating a quite evenly decomposition of grid cells.

138 10 Fig. 4.3 Schematic of the computational domain decomposed into 64 sub-domains number of cells sub-domain Fig. 4.4 Number of cells of sub-domains
139 Boundary Conditions The boundary conditions at the head end of the detonation tube are specified according to the engine operation. During the valve close-up stage, the head end is modeled as a rigid wall. During the purging stage, the total temperature and total pressure are specified as 48 K and.1 atm, respectively. The axial velocity is obtained with extrapolation, and the reactant mass fraction is set to zero. During the refilling stage, the same conditions are used except that the reactant mass fraction is set to unity. At the open boundary of the external region, a non-reflecting boundary condition is implemented (Wang and Chang, 1999). The slip wall boundary conditions are detailed in Appendix E Initial Conditions The detonation tube is initially filled up with a stoichiometric hydrogen/air mixture at the ambient pressure (0.9 atm) and temperature (8 K), whereas the other region is filled with the ambient air Detonation Initiation Detonation initiation is assured by a small driver region near the head end that extends across the entire tube cross section. The temperature and pressure of the driver gas are,000k and 30 atm, respectively. Because of the high energy density associated with the driver gas, its effect on the propulsive performance could be quite large. Cambier and Tegner reported an effect of 17 to 7% on the single-pulse impulse for a PDE system with a 10-cm-long detonation tube and a 5-cm-long divergent nozzle
140 1 (Cambier and Tegner, 1998). In the present study, several lengths of the driver region were tested and the smallest one of 0. mm was selected to minimize the effect of the initiation source on the propulsive performance. The thermal energy per unit area of this initiation source is approximated as p drivρdriv driv = [ γ /( γ 1)] driv driv 0.7 / (4.15) ct L p L J cm Its effect on the propulsive performance can be estimated by comparing the thermal energy of the initiation source with the heat that could be released from the detonation of the reactant within the tube: ct p drivρdrivldriv [ γ /( γ 1)] pdrivldriv = 0.5% (4.16) qρl [ q/( RT)] pl The net effect appears to be limited Results A series of analyses are conducted over a wide range of operation parameters. The CFL number used is 0.5, whereas the corresponding time step is about ms. The typical turn-around time for one cycle of calculation is about 10 hours on an in-house PC cluster consisting of 64 Pentium II processors. The baseline case has τ cycle of 3 ms and τ close of.4 ms. It takes about 5 cycles to reach steady cyclic operation. Figure 4.5 shows the x-t diagram for the first cycle of operation, obtained by tracing the characteristic lines of the flowfield along the centerline of the tube. The time histories of the flow properties at the head end are also presented. Procedures for building the x-t diagram are given in Appendix C.

141 13 Fig. 4.5 x-t diagram for first cycle and time histories of flow properties at head end under typical PDE operation (stoichiometric H /air mixture, τ cycle = 3 ms, τ close =.4 ms, τ purge = 0.1 ms). 1 = unburned region, = Taylor expansion waves, 3 = stationary region, 4 = non-simple wave region, 5 = simple wave region. The detonation wave is directly initiated by a hot driver gas and propagates downstream at the CJ detonation velocity toward the unburned mixture (region 1). It then induces the Taylor expansion waves (region ) in order to satisfy the stationary condition at the head end, causing a uniform region (region 3) with constant flow properties in the upstream.
142 14 The detonation wave reaches the reactant/air interface at the tube exit at t = ms (point A), which deviates slightly from the following analytical prediction by 0.6% due to the effect of the externally imposed ignition source. τ D L 0.6 m = = = ms (4.17) u 1956 m/s D The wave then degenerates to a non-reactive shock (i.e., the primary shock wave) proceeding further downstream into the external region, followed by a contact surface separating the ambient air and combustion products. A sonic region is gradually formed near the tube exit due to the local flow expansion, as evidenced by the clustered characteristic lines in the x-t diagram. Downstream of the sonic region, the flow is expanded to become supersonic and finally leads to the formation of a secondary shock to match with the subsonic flow behind the primary shock. This secondary shock wave moves further downstream, meeting with expansion waves originating from the primary shock wave. These complicated flow structures can be also observed in Fig. 4.6, which shows the instantaneous pressure and density and their gradient fields at t = 0.7 ms. Many salient features are clearly examined, including the expansion fans, vortices, and the rolled-up slip lines developed as the shock diffracts over the edge of the tube exit. As the detonation wave catches the reactant/air interface and the resultant primary shock wave travels outside the tube, a series of expansion waves are generated and propagate upstream, resulting in a non-simple wave region (region 4) when interacting with the incoming Taylor waves. A simple wave region (region 5) is recovered after passing through the Taylor waves. The first expansion wave reaches the head end at t = ms (point B), which can be determined by considering the interaction between the
143 15 expansion and the Taylor waves and the sound speed in region 3. A similarity solution has been derived by Wintenberger et al. (003) and is detailed in Appendix F. The analytical solution gives L L t = + α (4.18) u c D 3 where α is function of γ and M D and can be calculated as, γ + 1 ( γ 1) 1 1 ( γ M D + 1) α = (1 + ) 1 M D ( γ + 1)( MD + 1) (4.19) Application of Eqs. (4.18) and (4.19) gives rise to an analytical value of ms. The slight difference between the numerical and the analytical solutions may be attributed to the numerical resolution and dissipation near the tube exit. On the arrival of the first expansion wave at the head end, the pressure begins to decay gradually. These expansion waves reflect off the head end and form another series of expansion waves, further reducing the chamber pressure. The downstream-traveling expansion waves weaken the secondary shock, and eventually cause it to move upstream. The head-end pressure decays to 0.3 atm at t =.4 ms, at which point the purging stage begins. The head-end temperature is 158 K at this instant. Because of the pressure difference across the entrance plane, a right-running shock wave is established, along with a series of central expansion waves and a contact surface between the burned gas and the cold air. Another contact surface forms between the fresh reactants and purging air when the refilling stage commences 0.1 ms later. The corresponding refilling pressure, velocity, and Mach number are about 0.91 atm, 500 m/s, and 1., respectively.


144 16 The time evolution of the pressure distribution along the centerline during the first cycle of operation is shown in Fig The flow evolution during a steady operation cycle is examined. Figure 4.8 shows the x-t diagram and time histories of flow properties at the head end for the fifth cycle. The main flow features remain qualitatively the same as those in the first cycle. However, the secondary shock wave disappears, since the flow behind the primary shock wave is already supersonic. In addition, the head-end pressure and temperature begin to decay earlier relative to the first cycle, due to the rarefaction waves produced from the previous cycle. It should also be noted that the detonation wave catches the leading fresh reactant at x = 51. cm instead of at the tube exit. Fig. 4.6 Snapshots of pressure, density and their gradients fields at t = 0.7 ms.
145 17 p, atm p, atm p, atm p, atm 6 t = 0.0 ms (propagation) t = 0.40 ms (blow-down) 0 3 t = 0.80 ms (blow-down) 1 0 t = 1.0 ms (blow-down) t = 1.60 ms (blow-down) p, atm t =.0 ms (blow-down) p, atm p, atm p, atm 0 t =.45 ms (purging) 1 0 t =.80 ms (refilling) x, m Fig. 4.7 Time evolution of pressure distribution along centerline during first cycle of operation (τ cycle = 3 ms, τ close =.4 ms, τ purge = 0.1 ms).


146 18 Fig. 4.8 x-t diagram for fifth cycle and time histories of flow properties at head end under typical PDE operation (stoichiometric H /air mixture, τ cycle = 3 ms, τ close =.4 ms, τ purge = 0.1 ms). The impulse of each cycle is calculated by considering the momentum balance over a control volume enclosing the entire engine. The cycle-averaged specific thrust (air-based) and specific impulse (fuel-based) are then obtained by dividing the impulse by the air mass and fuel weight for each cycle, respectively. For the baseline case, the fuelbased specific impulse is 38 s.
147 19 For comparison, the performance parameters and flow conditions of a corresponding ramjet engine with perfect nozzle flow expansion are given in Fig. 4.9, which has a specific impulse of about 3866 s. Thus, with the straight-tube configuration, the PDE performs even worse than the ramjet engine freestream conditions: M =.1, h = 9.3 km T 0, = 48 K, p 0, =.65 atm T = 8 K, p = 0.9 atm combustor conditions: M 3 = 0.1, M 4 = 0.6, Φ = 1.0(H ) T 0,4 = 47 K, p 0,4 =.05 atm T 4 = 458 K, p 4 = 1.97 atm inlet exit conditions: M = 0.9, m = 1.01 kg/s T 0, = 48 K, p 0, =.3 atm T = 4 K, p =.10 atm engine performance: F = 1105 N (48 lbf) I sp = 3866 s Fig. 4.9 Performance parameters of ramjet engine for stiochiometric H /air mixture A parametric study was carried out to examine the effect of various operating times on the system performance. Figure 4.10 shows the result as a function of τ close. The highest specific impulse obtained is 906 s. This is far lower than its theoretical limit of 563 s (Wu, Ma, and Yang, 003), which assumes isentropic flow processes in the inlet and nozzle. Although the calculated specific impulse can be improved by optimizing the operation frequency and timing, the net gain appears to be limited with the current design. Several fundamental mechanisms responsible for such an unacceptable performance have been identified. First, at high altitudes, the straight-tube design fails to preserve the chamber pressure during the refilling stage at a level sufficient to meet the
148 130 requirements for the mass loading density of fresh reactants. Second, the low chamber pressure in the refilling stages causes a high-speed reactant stream in the tube, and subsequently results in a large performance loss. It is well established that the stagnation pressure drop due to energy addition is proportional to the square of the Mach number. In the present case, the local Mach number may reach a value of up to 1. during the refilling process. The ensuing loss of thermodynamic efficiency becomes exceedingly large compared with conventional propulsion systems with subsonic combustions. Third, the lack of an appropriate flow expansion device downstream of the detonation tube gives rise to an extremely complicated flow structure near the tube exit. The internal energy of the exhaust flow cannot be effectively converted to the kinetic energy for thrust generation, further deteriorating the situation τ cycle =.5ms I sp,s 000 τ cycle =3ms τ close,ms Fig Effect of valve close-up time on specific impulse (τ cycle = 3 ms, τ purge = 0.1 ms); straight tube with stoichiometric H /air mixture, h = 9.3 km, M =.1
149 Single-Tube PDE with CD Nozzle In light of the limited performance of the straight-tube design, much effort was expended to study the effect of nozzle configuration on the system propulsive performance. The nozzle design for PDEs poses a serious challenge because of the intrinsically unsteady nature of the pulse detonation process. Recent studies on the nozzle effect, as been reviewed in Chapter 1, indicate that the nozzle configuration may significantly change the thrust delivered by an engine. In addition to its influence on specific impulse through modification of the gas expansion process, the nozzle affects the chamber flow dynamics and, consequently, the timing of various phases of the engine operation cycle, especially for high-altitude and space applications. The present work focuses on a choked convergent-divergent (CD) nozzle because of its effectiveness in preserving the chamber pressure during the blowdown and refilling stages. In contrast, divergent and plug nozzles do not possess such an advantage, especially under highaltitude conditions, in spite of their superior performance for a single-pulse operation at sea level. Figure 4.11 shows schematically the computational domain. The detonation tube remains the same as in Sec The CD nozzle has a length of 0 cm and a throat height of 1 cm, with a 45 convergent angle and a 15 divergent angle. The computational domain is discretized into 5548 unstructured triangular grid cells, with for the detonation tube, for the nozzle, and for the external region. Figures 4.1 and 4.13, respectively, show the decomposed sub-domains and the number of cells of the sub-domains.

150 13 Fig Computational domain for single-tube PDE Fig. 4.1 Schematic of the computational domain decomposed into 64 sub-domains number of cells sub-domain Fig Number of cells of sub-domains
151 Flow Evolution A series of analyses are conducted over a wide range of operation parameters. The baseline case has an operation cycle period (τ cycle ) of 3 ms, a valve close-up time (τ close ) of.1 ms, and a purge time (τ purge ) of 0.1 ms. The ambient flow is treated as stationary. Figures 4.14 and 4.15 show the time evolution of the Mach number and density-gradient fields during the first cycle of operation, respectively. The corresponding pressure and Mach-number distributions along the centerline of the computational domain are displayed in Fig Figure 4.17 shows the time histories of pressure and Mach number at the midpoints of the head end, nozzle throat, and nozzle exit. Initially, the detonation tube is filled with a stoichiometric hydrogen/air mixture at the ambient pressure and temperature. The cycle begins with the valve closed. Detonation is then initiated by the driver gas near the head end and propagates downstream toward the unburned mixture. It is immediately followed by a centered rarefaction wave known as the Taylor wave (Taylor, 1950; Fickett and Davis, 000), which decreases the pressure and brings the flow to rest in order to satisfy the stationary condition at the head end. Between the head end and the rear of the Taylor wave is a uniform region with constant flow properties. These wave structures have also been presented in detail in Sec. 4.5 by means of a numerically obtained x-t diagram. The detonation wave speed, u D, Mach number, M D, and the flow properties at CJ point can be obtained analytically based on the standard CJ theory. The flow properties of the uniform region can be derived through the Riemann invariant relation and the isentropic
 (g) (c)")
 (j) Fig.")


152 134 (a) (f) (b) (g) (c) (h) (d) (i) (e) (j) Fig Time evolution of Mach number field during the first cycle of operation (τ cycle = 3 ms, τ close =.1 ms)
 (g) (c)")
 (j) Fig.")

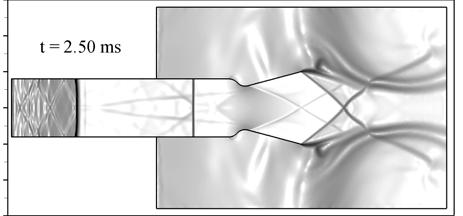

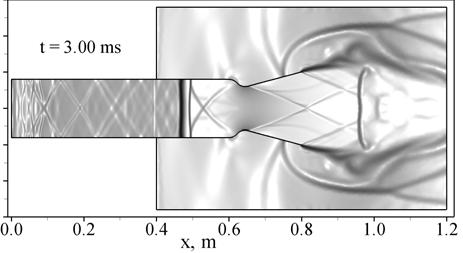
153 135 (a) (f) (b) (g) (c) (h) (d) (i) (e) (j) Fig Time evolution of density-gradient field during the first cycle of operation (τ cycle = 3 ms, τ close =.1 ms)
154 p, atm p, atm p, atm p, atm p, atm p, atm p, atm p, atm p, atm p, atm t = 0.15 ms (propagation) t = 0.40 ms t = 0.50 ms t = 0.65 ms (blowdown) t = 0.80 ms t = 1.00 ms t = 1.45 ms t =.15 ms (purging) t =.50 ms (refilling) t = 3.00 ms x, m 1 M 0 1 M 0 1 M 0 1 M 0 1 M 0 1 M 0 1 M 0 1 M 0 1 M 0 1 M 136 Fig Time evolution of pressure ( ) and Mach number (---) distributions along centerline during first cycle of operation (τ cycle = 3 ms, τ close =.1 ms) (a) (b) (c) (d) (e) (f) (g) (h) (i) (j)
155 137 (a) (b) Fig Time histories of (a) pressure and (b) Mach number at midpoints of head end, nozzle throat, and nozzle exit during first cycle of operation (τ cycle = 3 ms, τ close =.1 ms)
156 138 relation from the CJ point to the uniform region (Fickett and Davis, 000; Wintenberger et al., 003). The resultant analytical formulations have been given in Chapter 1 and are summarized again as below. M D = γ 1 γ q RT 1 + γ 1 γ q RT 1 + 1, ud MD γ RT1 = (4.0) M M D = γ M D 1 + 1, p 1 + γm D = p 1 + γ 1, T T 1 1+ γ M D = (1 + γ ) MD (4.1) p p 3 γ 1 D γ D + γ 1 M 1 = 1 γ M 1, T T 3 γ 1 MD 1 = 1 γ MD + 1 (4.) Equation (4.0) yields a detonation wave Mach number of 5.94 and a detonation wave speed of 1956 m/s, which agrees well with the 1950 m/s obtained from the NASA CEA code (McBride and Gordon, 1996). The simulated flow properties at the CJ point and in the uniform region coincide with the corresponding analytical predictions (e.g., deviation of less than 0.1% for the CJ properties and 0.4% for the uniform region properties), as manifested in Table 4.1. Table 4.1 Flow properties at the CJ point and in the uniform region (p 1 = 0.9 atm, T 1 = 8 K, γ = 1.9, R = J/(kg K), q = J/kg) numerical analytical p, atm T, K M P 3, atm T 3, K C 3, m/s
157 139 At t = 0.15 ms, the detonation wave travels to x = 9.5 cm, and the length of the uniform region becomes 15.0 cm. These two lengths deviate slightly from the following analytical predictions by about 0.6% due to the effect of the detonation initiation process. x = u t = 1956 m/s 0.15 ms = 9.3 cm (4.3) D D x3 = c3 t = 1006 m/s 0.15 ms = 15.1 cm (4.4) where c 3 is the sound speed in the uniform region. Generally, the length of the uniform region is about halfway between the detonation wave front and the head end (Fickett and Davis, 000), as demonstrated by the following relation: c u 3 D γ RT M D = = (4.5) M M D γ RT1 D The detonation wave continues downstream and reaches the reactant/air interface at the tube exit at t = ms. It then degenerates to a non-reacting shock wave (i.e., the primary shock wave) due to the lack of energy support from chemical reaction. Meanwhile, a series of expansion waves are generated and propagate upstream. The primary shock wave proceeds further downstream through the nozzle and reflects off the convergent wall. Its propagation through the nozzle throat resembles the shock diffraction over a convex curved wall (Han and Yin, 1993). At t = 0.40 ms, the primary shock wave has reached the divergent section and is curved due to effect of the expansion waves generated from the curved wall, and the two reflected shock waves have intersected with each other. Along the curved wall, the flow behind the primary shock is locally expanded to supersonic, leading to the formation of two shock waves stemming out from the wall, as can be seen clearly in the enlarged pressure field in Fig. 4.18a. On
 (b) Fig. 4.18 Enlarged views of pressure contours at (a) 0.40 ms and (b) 0.65 ms At t = 0.")
158 140 the other hand, the interaction of the upstream-traveling expansion waves with the downstream-traveling Taylor wave causes a small zero-gradient region, as evidenced by the blank region located at about x = 53 cm from head end in Fig. 4.15b and by the pressure contours in Fig. 4.18a. (a) (b) Fig Enlarged views of pressure contours at (a) 0.40 ms and (b) 0.65 ms At t = 0.50 ms, the primary shock wave arrives at the nozzle exit. The pressure and temperature on the centerline immediately behind the shock wave are.76 atm and 57 K, respectively, corresponding to a shock wave Mach number of.93, which is much
159 141 smaller than the original detonation wave Mach number of Within the detonation tube, the upstream-traveling expansion waves have passed through the downstreamtraveling Taylor wave so that the length of the uniform region begins to decrease. The two reflected shock waves intersect with each other, propagate further upstream, and hit and reflect off the tube walls, leading to more complicated shock wave structures. At t = 0.65 ms, the primary shock wave has moved out of the nozzle. The shock Mach number is.53 at the center and reduces to about 1 near the wall due to strong flow expansion around the edge of nozzle exit. This is consistent with Skews study (Skews, 1967) on the shock-wave diffraction over a sharp corner, in which the shock Mach number near the wall approaches to 1 for large corner angles. On the other hand, due to the velocity difference between the exhaust and the ambient flow, slip lines (or vortex sheets) are formed and roll up, as can be observed more clearly in the snapshots (e) and (f) of Fig At t = 0.65 ms, the center of the upper spiral vortex sheet is positioned at x = m and y = m, at which the flow is stationary and has a pressure of as low as 0.18 atm. More quantitative work on the vorticity production in shock diffraction was recently conducted by Sun and Takayama (003). In the inner region near the edge, the flow accelerates from subsonic to sonic due to expansion waves emanated from the edge, and finally a Prandtl-Meyer expansion fan is formed, as evidenced in Fig. 4.18b. The expanded supersonic flow is terminated by a downstream secondary shock attached to the vortex sheet. It should be noted that although the flow structure resembles that of shock diffraction over a sharp corner (Sun and Takayama, 003; Skews, 1967; Korobeinikov and Urtiew, 1986; Dyke, 1997), it is complicated by the flow non-uniformity resulting from detonation and contact surface. Within the detonation tube, the downstream shock
160 14 waves tend to catch up with the upstream shock wave, forming a lambda-shock structure, as displayed in Fig. 4.15d. These shock waves continue upstream and finally lead to a nearly normal leading shock wave (see Fig. 4.15e). At t = 1.00 ms, part of the primary shock wave has moved out the computational domain. The centers of the spiral vortex sheets move slowly to (0.89 m, ±0.175 m), whereas the pressure further decreases to 0.07 atm. The secondary shocks attached to the vortex sheets have jointed together. The Prandtl-Meyer expansion fans originated from the edges still exist, and the pressure at the nozzle exit plane is about 0.48 atm, higher than the ambient value of 0.9 atm, demonstrating that the nozzle flow remains underexpanded. In the vicinity of the nozzle throat, the sonic region has just grown from near the wall to the entire throat section. The curved sonic line, as evidenced in Fig. 4.14f, starts at the wall slightly upstream of the throat and crosses the nozzle centerline downstream of the throat (Hodge and Koenig, 1995). The Mach number at the midpoint of the nozzle throat is less than unity (see Fig. 4.17b). Along the centerline downstream of the sonic line, the flow is still slightly below sonic and then accelerated to supersonic near the exit plane due to the expansion waves emanated from the edge of the nozzle exit (see Fig. 4.16f). The Mach number at the midpoint of the nozzle exit plane is about Inside the detonation tube, the upstream-traveling expansion waves and leading shock wave have reached the head end and been reflected, terminating the head-end pressure plateau that remained for ms. The head-end pressure thus decays gradually, followed by an abrupt increase, as displayed in Fig. 4.17a. The zigzag shape of the headend pressure history during 1 to ms arises from the reflection of the subsequent upstream-traveling expansion waves and shock waves off the head-end.
161 143 As the blowdown process continues, the pressure within the tube and nozzle decays. At t = 1.45 ms, the nozzle exit pressure decreases to 0.13 atm at the midpoint and 0.1 atm at the wall, and the nozzle flow has developed to be overexpanded. Also, the Prandtl-Meyer expansion fans disappear and oblique shocks form near the edges. Within the nozzle, the flow downstream of the curved sonic line becomes supersonic, and the Mach number at the midpoint of nozzle exit is about.. The valve opens at t =.10 ms, and the purging process begins. The head-end pressure is about 0.6 atm prior to the valve opening, whereas the total pressure at the combustor entrance is.1 atm from the inlet analyses in Chapter 1. As a result of this large pressure difference, a right-running shock wave is established along with a contact surface between the burned and the purged gases, as shown in Figs. 4.14h and 4.15h. The shock wave and the contact surface are located at 0.06 m and 0.0 m from head end at this time instant, respectively. The temperature increases from 370 K to 1916 K across the contact surface, and the Mach number decreases from 1.04 to Another contact surface forms between the fresh reactants and the purged air when the refilling process commences 0.1 ms later. The corresponding refilling pressure and velocity are 1.16 atm and 43 m/s, respectively. At t =.50 ms, the shock wave and the two contact surfaces travel to 0.5, 0.18, and 0.13 m, respectively. The pressure at the nozzle exit decays to 0.06 atm. The external flow structures bear a close resemblance to those of an overexpanded nozzle flow at steady-state condition (Hodge and Koenig, 1995), e.g., the oblique shocks intersect with each other and reflect off the slip lines (or shear layers) to generate expansion waves, as displayed in Fig. 4.15i. A Mach intersection (Hodge and
162 144 Koenig, 1995) of the two oblique shocks may happen as the intersection point moves upstream with a further decay of the nozzle exit pressure. At the end of the cycle (t = 3.0 ms), the shock wave resulting from the purging process moves out of the nozzle and interacts with the existing waves, further complicating the external flowfield. The fresh reactant fills the tube up to about twothirds. The pressure of the reactant ranges from 1.16 atm at the head end to 0.60 atm at the leading point, which is significantly higher than the ambient pressure of 0.9 atm. The velocity of the reactant ranges from 430 to 600 m/s, in contrast to the initial stationary condition. The flow tends to reach steady cyclic condition as the cycle repeats. Figure 4.19 shows the time history of the head-end pressure during the first five cycles. Significant differences between the first and later cycles are observed. Specially, the pressure plateau during the first ms does not appear in later cycles because of the rarefaction of waves from the previous cycle. On the other hand, because of the higher pressure of the refilled reactants, the head-end pressure immediately after detonation is higher in later cycles than in the first cycle. Figure 4.0 shows the specific impulse and the filling length of each cycle. The filling length is defined as the length at which the detonation wave catches the leading fresh reactant. Calculation of the specific impulse is given in the next subsection. The specific impulse of the second cycle is much higher than that of the first cycle due to the higher loading density of the reactant during the second cycle. The specific impulse and the filling length reach steady values of 340 s and 47.5 cm, respectively. In this paper, the relative difference of specific impulse between two
163 continuous cycles being less than 0.1% will be used as the quantitative criterion for reaching steady cyclic operation. 145 Fig Time history of head-end pressure during first five cycles (τ cycle = 3 ms, τ close =.1ms) I sp,s filling length, m cycle Fig. 4.0 Specific impulse and filling length of first five cycles (τ cycle = 3 ms, τ close =.1 ms)


164 146 (a) (d) (b) (e) (c) (f) Fig. 4.1 Time evolution of density-gradient field during fifth cycle of operation (τ cycle = 3 ms, τ close =.1 ms) Figure 4.1 shows the time evolution of the density-gradient field during the fifth cycle, at which the steady cyclic operation is reached. Although the time sequence is the same as that of the first cycle, quite different flow patterns are obtained due to the effect of flow non-uniformity arising from the previous cycle. The reactant has already had a speed of about 500 m/s before being burned, the detonation wave thus propagates faster to the tube exit, e.g., the detonation wave front travels 36.8 cm at t = 1.15 ms in contrast to 9.5 cm in the first cycle. In the external region, the pressure level is lower because
165 147 the flow remains overexpanded during a large amount of the cycle period. From the time history of the pressure at the midpoint of the nozzle exit shown in Fig. 4., the flow is overexpanded from 1.0 through 1.3 ms and from 1.9 through 15.0 ms, in contrast to about 1.6 ms of overexpansion during the first cycle. The Mach number at the midpoint of the nozzle exit remains supersonic throughout the whole cycle. From the time evolution of the Mach-number field (not shown), the nozzle is choked during most of the cycle period, thus helping preserve the chamber pressure. The results presented here suggest again that the PDE analysis should be based on multicycle operations. Fig. 4. Time histories of pressure and Mach number at midpoint of nozzle exit during fifth cycle of operation (τ cycle = 3 ms, τ close =.1ms)
166 Effect of Ambient Flow In the above simulation case, the ambient flow is neglected, i.e., the external flowfield is initially stationary and a non-reflection boundary condition is used. In a real flight condition, however, the ambient flow is not stationary and will interact with the exhaust flow. To consider its effect, a supersonic inflow with a velocity of 636 m/s is applied at the left boundary of the external region (see Fig. 4.11). Figure 4.3 shows the density-gradient field at t = 14.5 ms, which can be compared with Fig. 4.1e for the baseline case. A close-up view of the Mach number contours is shown in Fig In spite of the drastic change of the flow structure in the external region, the flowfield within the detonation tube and nozzle remains nearly the same. This is attributed to the fact that the flow at the nozzle exit plane is supersonic during the whole cycle, and thus the ambient flow effect cannot propagate into the chamber to affect the geodynamics therein. As a result, the specific thrust and specific impulse are unchanged. On the other hand, since the ambient flow modifies the external flowfield, it thus affects the engine drag, which is beyond the scope of this paper. The ambient flow will be treated as stationary for all the other simulation cases.

167 149 Fig. 4.3 Density-gradient field at t = 14.5 ms, with ambient flow, τ cycle = 3 ms, τ close =.1 ms Fig. 4.4 Close-up view of Mach-number contours at t = ms, with ambient flow
168 Propulsive Performance Figure 4.5 shows the instantaneous axial thrust calculated with Eq. (4.10) by neglecting the last term (i.e., the time-derivative term) during the first five cycles. Initially, the thrust is negative, i.e., 636 N, since the fluid at the engine exit plane is stationary. The exit flow starts at t = 0.47 ms when the primary shock wave moves out of the nozzle, leading to a sudden jump in thrust. This kind of peak exists in each cycle. During the later part of the blowdown stage, the thrust becomes negative due to the low pressure and density at the exit plane. The thrust changes from negative to positive again when the shock resulting from the purging process reaches the exit plane. During a steady periodic cycle, e.g., the fifth cycle, the time duration of negative thrust is about 0.7 ms, that is, from 14.0 to 14.7 ms. With Eqs. (4.1)-(4.14), the cycle-averaged thrust obtained is 86 N, and the specific thrust and specific impulse are 86 m/s and 340 s, respectively. This specific impulse is much higher than that achieved with only a straight tube. It is noteworthy that the CD nozzle significantly increases the performance because of its effectiveness in preserving the chamber pressure during the blowdown and refilling stages, rather than by thrust generation on the nozzle wall itself. The impulse generated on the nozzle wall can be obtained either by integrating the overpressure force on the wall or by applying momentum balance between the entrance and exit planes of the nozzle. Both are shown in Fig Although they don t coincide with each other at every time instant, the cumulate impulses generated over the fifth cycle are exactly the same, i.e., N s, which provides an essential validation check on the present
169 performance calculations. The negative impulse of nozzle has also been reported by Yungster (003) for divergent nozzles. 151 (a) (b) Fig. 4.5 Instantaneous thrust and impulse during first five cycles (τ cycle = 3 ms, τ close =.1 ms)
170 15 Fig. 4.6 Instantaneous impulse of nozzle during fifth cycle (τ cycle = 3 ms, τ close =.1 ms) Analytical Prediction of Propulsive Performance Although the CD nozzle increases the propulsive performance significantly, the specific impulse of 340 s for the baseline case is still below its ramjet counterpart of 3866 s with perfect nozzle flow expansion. It is desirable to develop simple analytical models that can be used to rapidly and reliably predict the PDE performance and to directly compare with the numerical simulation results. Several analytical models have been proposed in the past and are summarized in Chapter 1. Based on how the impulse is obtained, these models fall into two classes. One employs unsteady gasdynamic analysis to determine the instantaneous pressures and forces acting on the thrust wall and calculate the impulse as the integration of them (Nicholls et al., 1957; Wintenberger et al., 003). The other obtains the engine impulse
171 153 by deriving the flow properties at the exit plane (Wu, Ma, and Yang, 003; Heiser and Pratt, 00; Talley and Coy, 00). The analytical model presented here follows the approach of Heiser and Pratt (00), but takes into account the effects of the refilling velocity and the purging process to provides a more accurate prediction. Figure 4.7 schematically shows the flow path for the analysis. Note that the subscripts, 1,, and e represent the states of the freestream, unburned gas, CJ point, and exit plane, respectively. The procedure is detailed as below. energy balance M T,p, u T t1,p 1 CJ isentropic t1 T 1,p 1 T,p T perfect match e u e inlet combustor nozzle e Fig. 4.7 Schematic of flow-path analysis for PDE performance prediction i. Determine the total temperature T t1 and total pressure p t1 at the entrance of the combustor from the inlet flow analysis. ii. Obtain the reactant temperature T 1 and pressure p 1 by assuming a refilling Mach number M 1. iii. Calculate the CJ temperature T and pressure p using Eqs. (4.0) and (4.1). iv. Calculate the exit temperature by assuming an isentropic flow expansion from the CJ state to the exit plane with a perfect pressure match: e γ 1 γ ( / ) T = T p p (4.6)
172 v. Deduce the exit velocity by applying the energy balance from the combustor entrance to the engine exit plane: 154 ue = q cp( Te Tt1) (4.7) vi. Obtain the specific thrust and specific impulse: Fsp = (1 + f ) ue u, Isp = Fsp /( fg) (4.8) If the purging process is further incorporated, the exit temperature can be recalculated based on the following average: T = ( T τ + T τ )/τ (4.9) e e1 purge e refill open where T e1 and T e are the temperatures obtained by assuming isentropic flow expansion from the purged-gas state (T 1, p 1 ) and the CJ state (T, p ) to the exit plane with perfect pressure match, respectively. γ 1 γ e1 1( / 1) T = T p p, γ 1 γ e ( / ) T = T p p (4.30) Also, f and q need to be replaced by the overall fuel-to-air mass ratio f and the heat addition per unit mass of the mixture of the reactants and purged gas q, respectively. f = f τ / τ = f(1 β ) (4.31) refill open q = q τ / τ = q(1 β ) (4.3) refill open where β is defined as β = τ / τ (4.33) purge open The specific thrust and specific impulse then become F = (1 + f ) u u, I = F /( fg) (4.34) sp e sp sp
173 155 Based on the above analysis, the specific thrust and specific impulse are functions of γ, R, q, f, p, T t1, p t1, M 1, and β. If the current system is to be considered, the first seven parameters are fixed values, that is, γ = 1.90, R = J/(kg K), q = J/kg, f = 0.09 (for stoichiometric H/air reactants), p = 0.9 atm, T t1 = 48 K, and p t1 =.1 atm, and M 1 and β are two free parameters. The effects of these two parameters are then considered. Table 4. lists the predicted PDE performance under various M 1 and β. The result from the baseline numerical simulation case, which has an average refilling Mach number of 0.93 and β of 1/9, is also listed for comparison. The first condition represents an ideal one which has zero refilling velocity and no purging process, and has an I sp of 4360 s. Both the specific thrust and specific impulse decrease as M 1 increases. This can be directly explained from the aforementioned analytical formulas. As M 1 increases, T 1 decreases, leading to an increase in M D, as given by Eq. (4.0). The combination of Eqs. (4.1), (4.6), and (4.7) indicates that T e increases and u e decreases as M D increases. Thus, F sp and I sp decrease. The decrease in performance with the increase of M 1 can also be explained from the entropy point of view, since the entropy rise across the detonation wave is expressed as T p s = s s1 = cp ln Rln T p γ γmd 1+ γmd γ γ γ γ = cpln c ln p M D (1 + γ) M D 1 γ γ (4.35) the increase in M 1 leads to increase in M D and s, thus degrading the performance.
174 156 Table 4. Analytically predicted PDE propulsive performance under various refilling Mach numbers and purge-to-open time ratios Condition (p t1 =.1 atm, T t1 = 48 K) F sp, m/s I sp, s (1) M 1 = 0, β = τ purge /τ open = () M 1 = 0.93, β = (3) M 1 = 0, β = 1/ (4) M 1 = 0.93, β =1/ baseline numerical simulation case Comparison between the first and third conditions of Table 4. indicates that F sp decreases and I sp increases with β. The effect of β is quite similar to the partial filling effect for single-pulse operation (Cooper and Shepherd, 00; Li and Kailasanath, 00). A larger β translates to a larger air-to-fuel mass ratio. The heat released from combustion thus needs to increase the kinetic energy of more extra air, leading to a decrease in exit velocity. The specific thrust thus decreases. On the other hand, the overall fuel-to-air mass ratio f, defined by Eq. (4.31), decreases faster than the specific thrust, leading to a increase in specific thrust. The effect of β can be seen more clearly through the Taylor series expansion of F sp and I sp with respect to β. F = + f u u F Aβ (4.36) 0 sp (1 ) e sp(1 ) I = F fg I + A β (4.37) 0 sp sp /( ) sp[1 (1 ) ] where 1 1 c ( T T )/ q u A = 1 c ( T T )/ q u u 0 0 p e e1 e 0 0 p e t1 e (4.38)
175 157 and 0 F sp, 0 I sp, 0 T e, and u 0 e denote the specific thrust, specific impulse, exit temperature, and exit velocity at zero purge time, respectively. For the current system, A 0.7. Therefore, F sp decreases and I sp increases with β, and since (1 A) β > Aβ, the relative increase in I sp is less than the relative decrease in F sp. From Table 4., when β increases from 0 to 1/9, F sp decreases by 7.7% and I sp increases by 3.8%, which agrees well with the predictions from Eqs. (4.36) and (4.37) Loss Mechanisms In addition to the losses in the inlet and manifold mentioned in Chapter, there are several losses in the combustor and nozzle of a PDE, including the viscous damping, the loss due to heat transfer to the wall, the loss due to refilling velocity, nozzle expansion loss, flow divergence loss, and internal flow loss. The viscous damping and heat transfer losses will not be considered in the current study. The loss due to refilling velocity has been discussed in Sec As the refilling Mach number M 1 increases from 0 to 0.93, the specific impulse decreases by 6.5% from 457 s to 435 s, as shown in Table 4.. The performance discrepancy (about 5%) between the baseline numerical simulation case and the fourth condition given in Table 4. is attributed to 1) nozzle expansion loss or pressure-mismatch loss, ) flow divergence loss, and 3) internal flow loss. These three loss mechanisms are discussed in the following paragraphs. In conventional steady engines, the nozzle configuration is optimized such that the exit pressure matches with the ambient pressure. This condition, however, does not exist for PDEs due to their unsteady operations. The resultant performance loss, referred
176 158 to as the nozzle expansion loss, can be estimated through a post-processing analysis. This post-process allows the recorded exhaust flow to be compressed or expanded isentropically to match the ambient pressure and calculates the corresponding ideal specific impulse. For the baseline case, this ideal specific impulse is 3604 s, and the nozzle expansion loss is thus about 6.0%. Figure 4.8 shows the temporal variations of momentum impulse and pressure impulse during a steady periodic cycle for the baseline case. Although the pressure impulse is much smaller than the momentum impulse, it is not zero. As mentioned in Sec , the nozzle is overexpanded from 1.0 through 1.3 ms and from 1.9 through 15.0 ms, and is underexpanded otherwise. At the end of the cycle, the momentum impulse and pressure impulse are.7 and N s, respectively, demonstrating an overall effect of overexpansion of the nozzle flow. Fig. 4.8 Instantaneous impulse during steady cycle (τ cycle = 3 ms, τ close =.1 ms)
177 159 The flow divergence loss results from the exhaust velocity vector angularity (Berton, 1991; Mattingly, 1996), and is generally characterized by a nozzle divergence coefficient defined as the ratio of actual axial exhaust momentum to that from an ideal nozzle where all of the exhaust flow is axial. For the current PDE system, the nozzle divergence coefficient can be expressed by η = d e e e e mu mu (4.39) where u e and u e are defined as u e = 1 uds m ρ u n e Se (4.40) 1 u n u = e u v ds m ρ + e Se (4.41) Equation (4.39) gives rise to a value of 98.7% for the baseline case, which is slightly lower than the analytical value for a steady two-dimensional nozzle flow with a divergence angle of θ =15 : sinθ ηd = = 98.9% (4.4) θ This means that the flow divergence loss in PDEs is about the same as that in conventional steady engines. The nozzle divergence coefficient directly relates to the loss in gross thrust. The loss in thrust due to flow divergence can be readily obtained after taking into account the freestream momentum, ε d = 1 mu mu mu mu e e a e e a (4.43) which leads to a value of.0% for the baseline case.
178 160 The internal flow loss is mainly attributed to the shock waves and their interactions within the internal flowfield. In the analytical performance prediction, the flow is assumed to experience an isentropic expansion from the CJ state to the exit plane. However, there exist complicated shock waves within the internal flowfield as described in Sec The associated entropy increase and total pressure drop lead to a performance loss. It is formidable to estimate the internal flow loss directly from the flowfield. Nevertheless, since the sum of the nozzle expansion loss, the flow divergence loss, and the internal flow loss is 4.5%, i.e., the deviation of the simulated performance from the analytical prediction (condition 4 in Table 4.), an internal flow loss of 16.5% can thus be obtained for the baseline case. This large internal flow loss is unique for PDEs and is one of the major disadvantages that degrade the PDE performance. The quantitative values of the various losses discussed above are summarized in Table 4.3 for the baseline case. Table 4.3 Loss summary for baseline case loss mechanism loss in specific impulse a loss due to refilling velocity 8.5% nozzle expansion loss 6.0% flow divergence loss.0% internal flow loss 16.5% total 33% a relative loss based on the baseline numerical result of 340 s
179 Effect of Valve Timing Parametric studies are conducted to investigate the timing effect on the propulsive performance by varying the cycle time τ cycle, valve close-up time τ close, and purge time τ purge. Figure 4.9 shows the effect of τ close on the specific thrust F sp and the specific impulse I sp for three different τ cycle :.5, 3 and 4 ms, corresponding to operation frequencies of 400, 333, and 50 Hz, respectively. The purge time τ purge is fixed at 0.1 ms. Similar studies have been conducted in Chapter 3 based on quasi-one-dimensional simulations. When the straight-tube design is compared at the same operating condition, the present system with a choked CD nozzle can indeed substantially improve the engine performance by a margin of 5%. For each frequency considered herein, the specific thrust increases as τ close decreases. This can be explained as below. For a given τ cycle and τ purge, a smaller τ close brings the following four positive effects. First, the blowdown process is shorter, and the resultant higher chamber pressure during the refilling stage increases the loading density of fresh reactant. Second, the increased refilling period enhances the amount of reactant delivered to the chamber, thus increasing the chamber pressure. Third, the duration of negative thrust is shorter. It has been pointed out in Sec that negative thrust may appear at the later part of the blowdown process due to the low-energy level of the gases in the combustor. Figure 4.30 shows the instantaneous thrust and impulse during a steady cycle for three cases with different τ close. The solid line represents the baseline case. When τ close decreases from.4 to 1.8 ms, the time duration of negative thrust decreases
180 16 specific thrust F sp,m/s (a) τ cycle =.5ms 3ms inlet over-pressurization combustor overfilled 4ms τ close,ms I sp,s 000 τ cycle =.5ms 3ms 4ms 1000 (b) inlet over-pressurization combustor overfilled τ close,ms Fig. 4.9 Effect of valve closed time on (a) air-based specific thrust and (b) fuel-based specific impulse at three different operation frequencies; τ purge = 0.1 ms, stoichiometric H /air mixture, h = 9.3 km, M =.1.

181 163 (a) (b) Fig Instantaneous thrust and impulse during a steady cycle, τ cycle = 3 ms, τ purge = 0.1 ms.
182 164 from about 1.5 ms to 0.4 ms. Finally, the internal flow loss decreases. For a smaller τ close, the head-end pressure is higher as the valve opens. Correspondingly, the shock resulting from the pressure difference across the valve is weaker. In addition, the reactant temperature T 1 increases, leading to a weaker detonation wave, i.e., the detonation wave number M D calculated with Eq. (4.0) is smaller. Since the internal flow loss is mainly associated with the shock interactions within the flowfield, it thus decreases as the shock waves weaken. These combined effects make F sp decrease rapidly as τ close increases. It should be noted, however, the lower bound of τ close is subject to three practical constraints, as mentioned in Chapter 3. The first is concerned with the inlet overpressurization. The head-end pressure must not exceed the total pressure of the inlet air to allow for purging and refilling when the valve is open. Otherwise, reverse flow may occur and cause engine unstart. This kind of lower bound is denoted by the open circles on the curves of τ cycle =.5 and 3 ms. The second is related to chamber overfilling. The fresh reactant should not flow out of the nozzle to the external region before being burned completely unless afterburning is considered. This kind of lower bound is usually reached in low-frequency operations, as denoted by the full circle on the τ cycle = 4 ms curve. The third constraint, although commonly satisfied in practical cases, is that τ close should be sufficiently long to cover at least the time required for detonation initiation and propagation throughout the entire chamber. The upper bound of τ close (also the lower bound of τ refill ) lies in the requirement that an appropriate amount of fresh reactant be delivered to the chamber to produce thrust.
183 165 The effect of τ close on the specific impulse follows the same trend as that of the specific thrust, except for a small range of τ close near its lower bound. The specific impulse and specific thrust satisfy the following relation: I sp F (1 sp + τ / τ ) purge refill = (4.44) fg As τ close decreases, the factor (1 + τ purge/ τ refill ) decreases and may override the increase of F sp, consequently leading to a decrease in I sp, as shown in Fig. 4.9b. Also observed in Fig. 4.9 is the existence of an optimum frequency. For a given τ close and τ purge, a lower frequency translates to a longer refilling period. As a consequence, a higher chamber pressure can be reached, and the engine performance increases. However, a large refilling time associated with low-frequency operation may cause chamber overfilling and thus degrade the performance. These two conflicting effects result in an optimum frequency. Among the three frequencies considered herein, the 333 Hz (τ cycle = 3 ms) operation offers the best performance margin. The highest specific impulse is 367 s, slightly lower than its ramjet counterpart of 3866 s with optimum nozzle flow expansion. The effect of τ purge on the propulsive performance is also studied. Figure 4.31 shows the specific thrust and specific impulse at different τ purge with τ cycle of 3 ms and τ close of.1 ms. The full symbols denote the numerical simulation results, and the open ones denote the analytical predictions based on the procedures proposed in Sec A performance loss of about 0% (or 5% relative to the numerical results) is observed, similar to that for the baseline case. The specific thrust decreases with τ purge, while the
184 166 specific impulse increases with τ purge, which can be explained as follows. For given τ cycle and τ close, a larger τ purge translates to a larger air-to-fuel mass ratio. The heat released from combustion thus needs to increase the kinetic energy of more extra air, leading to a decrease in exit velocity. The decreased τ refill also degrades the specific thrust. Combined, the specific thrust decreases. On the other hand, the factor (1 + τ purge/ τ refill ) in Eq. (4.44) increases and overrides the decrease in specific thrust. The specific impulse thus increases. Note that since τ open is fixed (0.9 ms), the effect of τ purge is thus equivalent to that of β discussed in Sec based on analytical predictions. The increase of specific impulse is usually at the price of more decrease in specific thrust. In the present study, when τ purge increases from 0 to 0.4 ms, the specific impulse increases about 14%, whereas the specific thrust decreases about 37%.
185 τ cycle =3ms,τ close =.1ms 1000 F sp,m/s 750 0% performance loss anlytical numerical (a) τ purge,ms 5000 τ cycle =3ms,τ close =.1ms % performance loss I sp,s 3000 anlytical numerical 000 (b) τ purge,ms Fig Effect of purging time on (a) air-based specific thrust and (b) fuel-based specific impulse, τ cycle = 3 ms, τ close =.1 ms.
186 Effect of Nozzle Throat and Length In addition to the operation timing, the nozzle configuration represents another important factor that affects the PDE propulsive performance. In conventional steady engines, the nozzle is optimized by matching the exit pressure to the ambient pressure. This simple criterion, however, is not applicable to PDEs because the intrinsically unsteady pulse detonation process leads to an unsteady pressure field at the exit plane. Both numerical (Cambier and Tegner, 1998; Eidelman and Yang, 1998) and experimental (Daniau et al., 001; Cooper and Shepherd, 00) studies on the effect of nozzles on the PDE performance have been reported recently. Most of them, however, were limited to single-pulse operation, and the question of nozzle optimization is far from resolved. In general, the nozzle affects not only the performance through the modification of the gas expansion process, but also the chamber dynamics and is coupled with the operation timing, further compounding the problem. A complete nozzle optimization for PDE thus requires tremendous computation resources. Instead of conducting such an optimization, the main purpose of the present nozzle study is to investigate the qualitative effect of the nozzle configuration on the PDE propulsive performance. It has been demonstrated in the previous subsections that the CD nozzle significantly increases the performance that can be obtained with only a straight tube. In this subsection, the effect of the CD nozzle configuration in terms of the nozzle length and the throat is further examined. Figure 4.3 shows the four nozzle configurations considered herein. The baseline configuration, as described earlier, has a length of 0 cm and a throat height of 1 cm. In the second configuration, the nozzle length is reduced to 15 cm. The third nozzle has an even smaller length of 1.4 cm, with an exit area equal to
187 that of the tube. The fourth one has a throat height of 9 cm, which is 5% smaller than that of the baseline nozzle. 169 (a) (b) (c) (d) Fig. 4.3 Single-tube PDE configurations (tube length = 60 cm, tube height = 16 cm): (a) baseline case, nozzle length = 0 cm, throat height = 1 cm, (b) nozzle length = 15 cm, (c) nozzle length = 1.4 cm, (d) throat height = 9 cm.
188 170 (a) (b) Fig Instantaneous thrust and impulse during steady cycle (τ cycle = 3 ms, τ close =.1 ms)
189 171 Simulations have been conducted for all the configurations with the same timing: τ cycle of 3 ms, τ close of.1 ms, and τ purge of 0.1 ms. Figure 4.33 shows the instantaneous thrust and impulse during a steady cycle. The corresponding performance parameters are listed in Table 4.4. The effect of the nozzle length can be examined from the results of the first three configurations. Both the thrust and impulse curves for these three configurations are very close. Compared to the baseline configuration, the second and third ones have I sp of 0.1% and 1% lower, respectively. Therefore, the nozzle length has a minor effect on the propulsive performance. The pressure impulse shown in Fig demonstrates that the overall effect of the second and third nozzles is underexpansion instead of overexpansion for the baseline nozzle. The underexpansion losses are 6% and 7%, respectively. The nominal perfect-expansion nozzle, in the sense of zero cycleaveraged pressure impulse, thus has a length between 15 cm (second nozzle) and 0 cm (baseline nozzle). Figure 4.35 shows the time history of the head-end pressure during a steady cycle. The first three curves coincide, manifesting the fact that the nozzle length only affects the gas expansion process within the divergent section of nozzle, but not the gasdynamics within the detonation tube. Table 4.4 Performance comparison among different nozzles Nozzle F sp, m/s I sp, s imperfect nozzle expansion loss flow divergence loss Baseline %, overexpansion.0% nozzle length = 15 cm %, underexpansion.5% nozzle length = 1.4 cm %, underexpansion.6% throat height = 9 cm %, overexpansion.0%
190 17 Fig Instantaneous pressure impulse during steady cycle (τ cycle = 3 ms, τ close =.1 ms) Fig Time history of head-end pressure during steady cycle (τ cycle = 3 ms, τ close =.1 ms)
191 173 The nozzle throat area, on the other hand, affects both the nozzle expansion process and the flow dynamics within the detonation tube, and thus has a much more significant effect on the performance. The impulse at the end of the cycle for the fourth configuration is apparently higher than the others. The corresponding I sp of 3597 s is 6% higher than that of the baseline configuration, attributed to the following factors. The smaller throat helps preserve the chamber pressure, as evidenced in Fig The refilling pressure for the fourth configuration is about 1.49 atm, higher than the 1.4 atm for the baseline configuration. Consequently, the refilling Mach number of 0.76 is smaller than the 0.93 for the baseline configuration. In addition, the imperfect nozzle expansion loss is reduced, as listed in Table 4.4. All these factors lead to a higher propulsive performance for a smaller throat. Nevertheless, the relation of the propulsive performance and the nozzle throat area is not monotonic. As the nozzle throat becomes exceedingly small, the internal flow loss associated with the shock interactions increases since the shocks reflected off the nozzle convergent wall become stronger. Furthermore, a longer blowdown process may be required to avoid inlet over-pressurization, thus degrading the performance. These two negative effects and the aforementioned positive effects result in the existence of an optimum nozzle throat area. To find the optimum nozzle throat area requires conducting a large number of simulations because of the coupling between the effects of the nozzle throat and operation timing. A presumptive estimation is that the optimum nozzle may improve the best performance of the baseline nozzle by 6%, that is, the highest I sp of about 389 s, which is only slightly higher than its ramjet counterpart of 3866 s with perfect nozzle flow expansion. Further improvement of the system design and optimization thus need to
192 174 be conducted to make the PDEs competitive with other conventional engines. One such improvement is to use multiple detonation tubes, which will be presented in the next Chapter. Finally, it is noteworthy that the analyses based on single-pulse operation may lead to totally different trends for the nozzle effect. For example, during the first cycle, the overall effect of all four nozzles is underexpansion, and the impulse at the end of the first cycle for the baseline configuration is higher than that for the fourth configuration. A realistic analysis of nozzle effect on PDE performance should thus be based on multicycle instead of single-pulse operations. 4.7 Summary and Conclusions The thrust chamber dynamics in single-tube airbreathing PDEs with multicycle operations has been studied by means of two-dimensional simulations. The system under consideration includes a supersonic inlet, an air manifold, a rotary valve, a single-tube combustor, and a convergent-divergent nozzle, which is designed for the flight condition at an altitude of 9.3 km and a flight Mach number of.1. The combustion and gasdynamics involved in the detonation initiation and propagation, blowdown, purging, and refilling processes are examined in detail. A flow-path based performance prediction model is proposed to estimate the upper performance limit of the current PDE system. The various performance loss mechanisms, such as the imperfect nozzle expansion loss, flow divergence loss, and internal flow loss, are identified. The effects of operation timing, including the cycle time, valve close-up time, and purge time, and nozzle
193 175 configurations in terms of nozzle length and throat area on the propulsive performance are investigated systematically. The analyses presented in this paper can be effectively utilized to provide guidelines for the PDE design and to identify the various loss mechanisms limiting the PDE performance. A number of important conclusions drawn from the present studies are given as below. (1) The imperfect nozzle expansion loss resulted from the mismatch between the exit and ambient pressures is unavoidable in PDEs because the intrinsically unsteady pulse detonation process leads to an unsteady pressure field at the exit plane. The internal flow loss is mainly attributed to the shock waves and their interactions within the internal flowfield. These two losses reach 6% and 16.5% for the baseline case, respectively, composing the major factors that degrade the propulsive performance and render the PDE less attractive. () There exists an optimum operation frequency for achieving the best performance margin. At a given frequency and purge time, a smaller valve close-up time increases the performance in most cases. On the other hand, for a given frequency and valve close-up time, a larger purge time decreases the specific thrust and increases the specific impulse. (3) The nozzle length has a minor effect on the propulsive performance since it only modifies the gas expansion process within the divergent section. The throat area, in contrast, affects both the gas expansion process and the gasdynamics within the chamber, thus exerting a much more significant effect. Among the four nozzle configurations studied herein, the smaller throat improves the performance up to 6%, whereas the nozzle length affects the performance by only 1%. A smaller throat tends to increase the
194 176 performance by raising the chamber pressure. However, an exceedingly small throat renders negative effects due to the related longer blowdown process and larger internal flow loss. An optimum throat thus exists. (4) Significant differences exist between single-pulse and multicycle operations. A realistic analysis of PDE performance should be based on multicycle instead of singlepulse operations. The best specific impulses obtained for the current PDE system with a stoichiometric hydrogen/air mixture, e.g., 367 s for the baseline configuration and 389 s for an optimum nozzle, are only close to or slightly higher than its ramjet counterpart of 3866 s. Further improvement of the design philosophy and optimization of the system configuration and operation timing thus need to be conducted to make the PDEs competitive with conventional engines.
195 177 Chapter 5 Two-Dimensional Analyses of Multitube PDEs Chapter 4 has focused on the thrust chamber dynamics and propulsive performance of single-tube airbreathing PDEs. At a flight altitude of 9.3 km and Mach number of.1, the best specific impulse for a baseline configuration with a stoichiometric hydrogen/air system is 367 s, which is slightly lower than its ramjet counterpart of 3866 s. Further improvements of the system design are thus required to make the PDE competitive with other conventional engines. One of the improvements is to use a combustor consisting of multiple detonation tubes operating sequentially. In principle, this multitube design offers the following advantages: (1) Delivering air from inlet to multiple detonation tubes reduces the inlet loss associated with the airflow stagnation during the period when none of the tubes are being filled. In a single-tube PDE, this time period takes up a large part of the cycle time and may cause inlet unstart. () Exhaust from multiple detonation tubes discharging into a common nozzle provides a more stable nozzle flow and helps to increase the nozzle exit pressure which would be quite low in a single-tube PDE during the later part of the blowdown process and the purging and refilling processes, and thus improves the nozzle performance. (3) The detonation wave from one tube can precompress the reactants in other tubes. (4) The purging and refilling processes are less coupled with the blowdown process, thus leading to a wider range of operation timing.
196 178 (5) The overall engine operation frequency is increased, usually by a factor equal to the number of detonation tubes used. Meanwhile, the degree of unsteadiness is reduced. (6) It provides the potential of fluidic thrust vectoring. This chapter attempts to develop a comprehensive numerical analysis dealing with the thrust chamber dynamics in multitube PDEs with repetitive operations, to examine the flow interaction among the detonation tubes, and to investigate the effects of operation timing and system geometry on the propulsive performance. 5.1 System Configuration The system under consideration is shown schematically in Fig It includes a co-axial supersonic inlet with mixed compression, an air manifold, a rotary valve, a combustor consisting of multiple detonation tubes, and a common convergent-divergent (CD) nozzle. This PDE was designed for a flight altitude of 9.3 km and a flight Mach number of.1, corresponding to the flight condition of advanced missiles. The static pressure, static temperature, total pressure, and total temperature of the freestream are 0.9 atm, 8 K,.65 atm, and 48 K, respectively. The total pressure at the entrance of the combustor is set to.1 atm according to the study of the inlet aerodynamics. The cyclic operation of the PDE is controlled by a valve system located at the entrance of the combustor. The detonation tubes operate sequentially with a fixed time lag between each, as shown schematically in Fig. 5. for three detonation tubes. The left ends (head ends) of the tubes are assumed to be fully open or fully closed for simplicity.
197 179 The operation sequence of each tube is the same as that for a single-tube PDE, which is controlled by three time periods: the valve close-up period (τ close ), the purging period (τ purge ), and the refilling period (τ refill ). The cycle period of each tube is the sum of the above three periods. It may, however, be different from that for the engine. For clarity, the parameter τ cycle is used to represent the cycle period based on each tube, that is, τ cycle = τ close + τ purge + τ refill. manifold rotary valve inlet isolator combustor nozzle Fig. 5.1 Supersonic airbreathing pulse detonation engine tube open tube close tube 3 b p f d b tube b p f d b tube 1 d b p f d p detonation purge b f blowdown refill Fig. 5. Operation sequence of a triple-tube PDE
198 180 (a) without free volume (b) with free volume Fig. 5.3 Computational domains for multitube PDEs Practical multitube PDE configurations are three-dimensional. Nevertheless, conducting full three-dimensional simulation of these systems requires tremendous computational resources. The present work thus considers only planar systems to conduct two-dimensional simulations. The resultant flow phenomena and the performance trend are believed to be qualitatively the same as those from the threedimensional analysis. In addition, the two-dimensional analysis presented here provides direct comparisons with that on single-tube PDEs in Chapter 4.
199 181 Figure 5.3 shows the computational domains for the two configurations considered herein. The combustor contains three detonation tubes, each with a height of 5 cm. The tubes are spaced 0.5 cm apart. The nozzle adopts the baseline shape used in Chapter 4, which has a length of 0 cm and a throat height of 1 cm, with a 45 convergent angle and a 15 divergent angle. In the first configuration, the length of the detonation tubes is 60 cm, and the tubes extend to the nozzle entrance. In the second configuration, the length of the detonation tubes decreases to 45 cm, leaving a free volume of 15 cm long between the detonation tubes and the nozzle. The same external region is included in the computational domains for both configurations. The numbers of unstructured grid cells for these two cases are 6354 and 66436, respectively. 5. Results and Discussion A series of simulations are conducted over a wide range of operation parameters for both configurations. The flow evolution, as well as the interactions among the multiple detonation tubes, is first presented in detail for a baseline case, serving as a basis for the further performance analysis and parametric studies. The engine propulsive performance is then obtained, and the various loss mechanisms are identified. Finally, the effects of the valve timing and the system geometry on the propulsive performance are discussed.
200 Flow Evolution The baseline case for the first configuration has an operation cycle period (τ cycle ) of 3 ms, leading to a 1 ms time lag between tubes. The valve close-up time (τ close ), purging time (τ purge ), and refilling time (τ refill ) are.1 ms, 0.1 ms, and 0.8 ms, respectively. The ambient flow is treated as stationary because of its minor effect on the propulsive performance. Figure 5.4 shows the time evolution of the density-gradient field during the first cycle of operation. The corresponding pressure distribution along the centerline of each tube is given in Fig. 5.5, and the time histories of pressure at the midpoint of the head end of each tube in Fig Initially, the bottom tube is partially (75%) filled with a quiescent stoichiometric hydrogen/air mixture at the ambient pressure (0.9 atm) and temperature (8 K), whereas the other region is filled with the ambient air. Detonation is directly initiated in the bottom tube by a driver gas region spanning 0. mm near the head end with a temperature of 000 K and a pressure of 30 atm. This small amount of driver gas has been demonstrated to have neglectable contribution to the engine impulse in Chapter 4. The detonation wave then propagates downstream at a Chapman-Jouguet (CJ) speed of 1956 m/s, followed by the Taylor wave and a uniform region as have been discussed in Chapter 4. The CJ pressure and temperature are atm and 663 K, respectively, whereas the pressure and temperature of the uniform region are.158 atm and 133 K, respectively. At t = 0.15 ms, the detonation wave has traveled approximately one half of the tube length, and the uniform region spreads about halfway between the detonation wave front and the head end, as also demonstrated in Chapter 4. The middle tube is in
 top: refilling mid:")
 top: ignition")
 top:")
")
 top: purging mid: detonation bot:")


201 183 (a) (f) top: close mid: purging bot: detonation (b) top: refilling mid: blowdown bot: blowdown (g) top: close mid: refilling bot: blowdown (c) top: ignition mid: blowdown bot: blowdown (h) top: close mid: refilling bot: blowdown (d) top: detonation mid: blowdown bot: purging (i) top: close mid: ignition bot: blowdown (e) top: blowdown mid: blowdown bot: refilling (j) top: purging mid: detonation bot: blowdown top: blowdown mid: blowdown bot: ignition Fig. 5.4 Time evolution of density-gradient field during the first cycle of operation (τ cycle = 3 ms, τ close =.1 ms, and τ purge = 0.1 ms)
202 184 p, atm p, atm p, atm p, atm p, atm p, atm p, atm p, atm 6 t = 0.15 ms t = 0.60 ms t = 0.80 ms t = 1.00 ms t = 1.15 ms t = 1.50 ms 0 3 t =.00 ms t =.15 ms 10 top tube middle tube bottom tube t =.50 ms (i) 0 3 t = 3.00 ms (j) x, m Fig. 5.5 Time evolution of pressure distribution along centerline of each tube during the first cycle of operation (τ cycle = 3 ms, τ close =.1 ms, and τ purge = 0.1 ms) p, atm p, atm (a) (b) (c) (d) (e) (f) (g) (h)
203 185 Fig. 5.6 Time histories of pressure at midpoints of head ends of the bottom, middle, and top tubes during the first cycle of operation (τ cycle = 3 ms, τ close =.1 ms, and τ purge = 0.1 ms) the purging stage. The two vertical lines represent the shock wave and the contact surface induced by the pressure difference across the valve as the purging process begins. The pressure and velocity behind the shock wave are 1.0 atm and 411 m/s, respectively. The detonation wave in the bottom tube reaches the reactant/air interface located at 40 cm from head end at t = 0.0 ms. It then degenerates to a non-reacting shock wave, the primary shock wave. Meanwhile, a series of expansion waves are generated at the interface. The expansion waves propagate both downstream along with the Taylor wave to the tube exit and upstream to the head end. The upstream-traveling expansion waves interact and pass through the Taylor wave and thus reduce the length of the uniform region, as displayed in Fig. 5.5b. The first expansion wave arrives at the head end at t = 0.65 ms, and consequently, the head-end pressure begins to decay gradually. As the
204 186 expansion waves reflect off the head end, another series of expansion waves form and propagate downstream toward the tube exit, further reducing the pressure in the bottom tube. The primary shock wave reaches the bottom tube exit at t = ms. It then diffracts at the tube exit and reflects from the nozzle walls, causing complex waves propagating upstream into all the three tubes and downstream into the nozzle, as displayed in the snapshot of t = 0.60 ms in Fig A close-up view of these flow developments and the flow interactions among the tubes and nozzle are given in Fig The primary shock wave has been significantly weakened by the expansion waves from the interface before emerging from the bottom tube, e.g., the pressure behind the shock decays to 3.05 atm. Its possibility to initiate detonations in the neighbor tubes is thus avoided. The flow structures related to the diffraction of the shock wave around the upper edge of the bottom tube, such as the Prandtl-Meyer expansion fan, the vortex, and the secondary shock, and the shock reflected from the nozzle wall are all clearly seen in Fig. 5.7b. In Fig. 5.7c, the diffracted and reflected shock waves have propagated into the middle and bottom tubes, respectively, and the pressures behind them are 0.3 and.40 atm. On the other hand, the upper part of the leading shock hits the edge connecting the middle and top tubes, whereas the right part propagates in the divergent section of the nozzle. Along the curved wall, the flow behind the leading shock is locally expanded to supersonic, leading to the formation of a shock wave stemming out from the wall, as evidenced in Fig. 5.7c. The upper part of the leading shock then hits (Fig. 5.7d) and reflects off (Fig. 5.7e) the upper wall of the nozzle. In the top tube, the first shock relates to the diffracted part and the second one to the reflected shock from the lower wall of the
. In addition, because of the relative low strength, they will not initiate detonations if encountering fresh reactant. (a) (d) (b) (e) (c) (f) Fig. 5.7 Snapshots of pressure field showing flow interactions among tubes and nozzle during the first cycle (τ cycle = 3 ms, τ close =.")
205 187 nozzle. The pressures behind these two shocks are 0.37 and 0.53 atm, respectively. The shock waves established in all the three tubes propagate upstream and elevate the pressure therein (see Figs. 5.5b and 5.5c). In addition, because of the relative low strength, they will not initiate detonations if encountering fresh reactant. (a) (d) (b) (e) (c) (f) Fig. 5.7 Snapshots of pressure field showing flow interactions among tubes and nozzle during the first cycle (τ cycle = 3 ms, τ close =.1 ms, and τ purge = 0.1 ms) At t = 0.80 ms, the primary shock wave has emerged from the nozzle into the external region. Vortices are formed near the edges of the nozzle exit. Except for the asymmetrical pattern, the external flowfield exhibits quite similar structures to that of the
206 188 single-tube case. Within the combustor, the reflected shock in the bottom tube propagates toward the head end faster than those in the middle and top tubes, due to the larger sound speed related to the high temperature of the products in the bottom tube. The middle tube is in the refilling stage. The shock wave induced in the purging process travels to the location of 45 cm and is going to meet the upstream-traveling waves induced by the detonation of the bottom tube. The middle tube ends the refilling process and ignites at t = 1 ms. At this time instant, the purge-induced contact surface locates at x = 37 cm and the leading fresh reactant at x = 3 cm. The purge-induced shock has interacted with the upstreamtraveling waves induced by the detonation of the bottom tube. At t = 1.15 ms, the detonation wave in the middle tube reaches x = 37 cm. It is faster than the detonation wave in the bottom tube since the reactant in the middle tube has already had a velocity of about 411 m/s prior to detonation. The top tube undergoes the purging process. At a slightly later time, the detonation wave in the middle tube catches the leading fresh reactant at x = 39 cm and degenerates to a non-reacting shock wave. The resultant shock wave proceeds further downstream and interacts with the waves induced previously by the detonation wave of the bottom tube, causing very complicated flow structures in the nozzle and the external regions, as displayed in Fig. 5.4f. Two Prandtl-Meyer expansion fans are seen at the exit of the middle tube. The top tube is now in the refilling process, with a refilling pressure of 1.0 atm and a refilling velocity of 411 m/s. The interaction of the downstream- and upstream-traveling shock waves leads to a high pressure region with pressure up to. atm in the top tube, as shown in Fig. 5.5f. This pressure is not high enough to initiate a detonation in the top tube, but may interfere with the refilling
207 189 process. The refilling process should thus be finished before the upstream-traveling shock wave arrives at the head end. Otherwise, inlet over-pressurization may happen. For the current case, the shock wave propagates toward the head end at a speed of as low as about 16 m/s, and thus permits enough time for the refilling process. It reaches x = 11 cm as the refilling process finishes. Ignition occurs in the top tube at t = ms while the middle and bottom tubes undergo blowdown process. The aforementioned upstream-traveling shock wave interacts with the detonation wave and Taylor wave and reflects off the head end at about t =.15 ms, causing an abrupt raise in head-end pressure, as evidenced in Fig In Fig. 5.4h, the detonation wave has passed through the leading fresh reactant at x = 31. cm and degenerated to a non-reacting shock wave. At t =.5 ms, the shock wave has moved out of the nozzle to further interact with the local flowfield in the external region. Reflected shock waves can be seen in all the three tubes near their exits. The pressures behind these shocks, from bottom to top, are 0.8, 1.8, and 4.0 atm. The bottom tube is in the refilling stage. The refilling pressure and velocity are 1.30 atm and 380 m/s, respectively. The bottom tube finishes the refilling process at t = 3.0 ms, the end of the first cycle, whereas the middle and top tubes are in the blowdown process. The leading fresh reactant in the bottom tube reaches x = 35.5 cm. The upstream-traveling shock wave induced by the detonation of the top tube has interacted with the purge-induced shock wave and contact surface and propagated into the fresh reactant, denoted by the pressure jump at about x = 3 cm in Fig. 5.5j.
208 190 Comparing with the flow evolution described in Chapter 4 for a single-tube PDE, the current one bears the following characteristics. First, the flowfield exhibits asymmetry and is much more complicated. Second, the expansion pattern of the nozzle is not as apparent as that in the single-tube case, in which the Prandtl-Meyer expansion fan, representing an underexpanded nozzle flow, or the oblique shock wave, representing an overexpanded nozzle flow, can be clearly observed near the nozzle exit during certain periods of the blowdown process. Third, the pressure in a tube is raised not only by the shock waves induced by the detonation wave of this tube but also by the shock waves induced by the detonation waves from other tubes. The flow tends to attain a steady periodic condition as the cycle repeats. Figure 5.8 shows the specific impulse and the middle tube filling length of each cycle. The specific impulse is calculated based on the momentum balance over a control volume enclosing the entire engine, as detailed in Chapter 4. The filling length is defined as the length at which the detonation wave catches the leading fresh reactant. By using the quantitative criterion proposed in Chapter 4, i.e., the relative deviation in cycle-averaged specific impulses of two continuous cycles being less than 0.1%, the current baseline case reaches steady periodic operation at the fifth cycle. The time evolution of the densitygradient field during this cycle is shown in Fig. 5.9, and the corresponding pressure distribution along the centerline of each tube is given in Fig Quite different flow patterns are obtained due to the effect of flow non-uniformity arising from the previous cycle. The flowfield at t = ms is almost the same as that at t = 1.00 ms, verifying again that the steady periodic operation has been reached. The averaged refilling pressures of the bottom, middle, and top tubes are 1.36, 1.16, and 1.4 atm, respectively.
209 191 The corresponding refilling Mach numbers are 0.85, 1.0, and 0.94, and the refilling velocities are 361, 440, and 39 m/s, respectively. The filling lengths of the bottom, middle, and top tubes are 39.0, 38.8, and 40.5 cm, respectively, slightly smaller than the 47.5 cm for the single-tube case I sp,s filling length, m cycle Fig. 5.8 Specific impulse and filling length of the middle tube of the first five cycles (τ cycle = 3 ms, τ close =.1 ms, and τ purge = 0.1 ms)
 top: blowdown")
 top: blowdown mid: refilling bot: blowdown")
 top: blowdown mid:")


210 19 (a) (f) top: blowdown mid: blowdown bot: ignition (b) top: refilling mid: blowdown bot: blowdown (g) top: blowdown mid: purging bot: detonation (c) top: ignition mid: blowdown bot: blowdown (h) top: blowdown mid: refilling bot: blowdown (d) top: detonation mid: blowdown bot: purging (i) top: blowdown mid: ignition bot: blowdown (e) top: blowdown mid: blowdown bot: refilling (j) top: purging mid: detonation bot: blowdown top: blowdown mid: blowdown bot: ignition Fig. 5.9 Time evolution of density-gradient field during the fifth cycle of operation (τ cycle = 3 ms, τ close =.1 ms, and τ purge = 0.1 ms)
211 p, atm p, atm p, atm p, atm p, atm p, atm p, atm p, atm p, atm p, atm t = 1.00 ms t = 1.15 ms t = 1.50 ms t = ms t = ms t = ms 4 0 t = ms t = ms t = ms 0 t = ms 1 (a) (b) (c) (d) (e) (f) (g) (h) (i) (j) top tube middle tube bottom tube top bot. mid x, m Fig Time evolution of pressure distribution along centerline of each tube during the fifth cycle of operation (τ cycle = 3 ms, τ close =.1 ms, and τ purge = 0.1 ms)
212 194 (a) (b) Fig Time histories of pressure at midpoints of (a) head ends and (b) exit of the bottom, middle, and top tubes during the fifth cycle of operation (τ cycle = 3 ms, τ close =.1 ms, and τ purge = 0.1 ms) Figure 5.11 shows the time histories of the pressure at the midpoints of the head end and the exit of each tube, to provide more quantitative inspection on the tube interactions. In Fig. 5.11a, the highest peak on each trace corresponds to the initiation of
213 195 detonation at the head end. The second peak on the bottom tube trace, point A, indicates the shock wave induced by the detonation of the top tube arriving at the head end. The second peak on the middle tube trace, point B, relates to the arrival of the shock wave induced by the detonation of the bottom tube. This detonation wave also induces a shock wave that propagates into the top tube, interferes with the refilling process, and causes a small jump in the head-end pressure of the top tube, as evidenced by point E. The raised pressure is still less than the total pressure of the incoming gas so that the refilling process continues. The second peak on the top tube trace, point C, results from the detonation wave of the middle tube. Similarly, this detonation wave induces a shock wave in the bottom tube that leads to a small jump in the head-end pressure (point F). The third peak, point D, corresponds to the arrival of the shock wave resulting from the purge-induced shock in the middle tube. This purge-induced shock, however, exhibits little effect on the bottom tube head-end pressure. The reason is that the bottom tube has a supersonic exhaust flow when the purge-induced shock emerges from the middle tube. It is noted that all the aforementioned peak pressures exceed the total pressure of the gas immediately in front of the tubes. They should be thus within the period with valve closed. Otherwise, reverse flow may occur at the entrance of the detonation tubes and engine unstart happens. In Fig. 5.11b, the first peaks on the three traces, points A, B, and C, correspond to the arrival of the detonation-degenerated shock wave at the tube exit. The second peaks on the traces of the bottom and top tubes, points D and E, correspond to the arrival of the reflected shocks from the nozzle wall. The middle tube, nevertheless, doesn t have this kind of peak because the middle tube exit is farther from the nozzle wall, and a
214 196 supersonic exhaust flow is developed soon after the detonation-degenerated shock wave emerges from the middle tube. The flowfield within the common nozzle, as can be seen in Fig. 5.9, is quite different from that of the single-tube PDE. Multiple asymmetrical transverse waves exist within the common nozzle and disorganize the choke pattern which appears in the nozzle of the single-tube PDE during most of the cycle period. The nozzle throat in the multitube PDE seems to play a role less important to the performance than in the singletube PDE. The complexity of the nozzle flow is also evidenced in Fig. 5.1, in which the time histories of the Mach number at the midpoints of the nozzle throat and exit planes are displayed. In the single-tube PDE, the nozzle is choked during the entire cycle except for a small period during which the detonation-degenerated shock wave sweeps the throat region. The typical choke pattern is represented by a curved sonic line that starts at the wall slightly upstream of the throat and crosses the nozzle centerline downstream of the throat. As a result, the Mach number at the midpoint of the throat is less than unity and remains quite smooth during most time of the cycle as demonstrated in Fig. 5.1a. However, in the multitube PDE, the Mach number at the midpoint of the throat exhibits significant variation and is either larger than or far below unity during a large portion of the cycle. The choke effect of the nozzle throat is thus quite weak. In Fig. 5.1b, the Mach numbers at the midpoint of the nozzle exit plane also display significant difference, such as the three large peaks appearing in the triple-tube trace. Both Mach numbers, however, are larger than unity during the entire cycle.
215 197 (a) (b) Fig. 5.1 Time histories of Mach number at midpoints of (a) nozzle throat and (b) nozzle exit during the fifth cycle of operation (τ cycle = 3 ms, τ close =.1 ms, and τ purge = 0.1 ms)
216 Propulsive Performance and Loss Mechanisms Because of the intrinsic unsteady nature of PDEs, their propulsive performance must be calculated appropriately. A detailed description of the performance calculation based on the momentum balance over a control volume enclosing the entire engine has been given in Chapter 4. Figure 5.13 shows the instantaneous thrust in both axial and vertical directions, obtained from Eq. (4.10) by negelecting the last term. The single-tube PDE results are also included for comparison. In Fig. 5.13a, a very high peak up to N exists for the single-tube PDE, corresponding to the arrival of the primary shock wave at the nozzle exit plane. The deviation of the peak value from the cycle-averaged value represents a quantitative measure of the degree of unsteadiness of the engine thrust. For the triple-tube PDE, the number of peaks increases to three in each cycle, but the peak magnitudes are significantly reduced, e.g., by a factor of about three, rendering a substantial improvement in engine steadiness. The three peaks represent the arrival of the detonation-degenerataed shock waves of the bottom, middle, and top tubes at the nozzle exit plane, respectively. The second peak related to the middle tube is higher because the shock wave from the middle tube experiences less diffraction and reflection than those from the other two tubes. The same reason also leads to a much lower peak related to the middle tube in the lateral thrust (Fig. 5.13b). The increase of the peak number modifies the spectral property of the thrust. Figure 5.14 represents the spectra of the instantaneous axial thrusts. Clearly, the dominant frequency of the single-tube PDE is equal to the tube operation frequency, i.e., 333 Hz. However, that of the triple-tube PDE is increased by three times to 1000 Hz.
217 199 (a) (b) Fig Instantaneous thrust in (a) axial and (b) vertical directions during the fourth and fifth cycles (τ cycle = 3 ms, τ close =.1 ms, and τ purge = 0.1 ms) Also observed in Fig. 5.13a is that the time duration of negative thrust of tripletube PDE is significantly decreased to nearly zero, whereas that of the single-tube PDE is about 0.7 ms, e.g., from 14.0 to 14.7 ms during the fifth cycle. This is due to the fact that the exhaust flow of low energy level during the later part of the blowdown stage and the
218 00 refilling stage of a single-tube PDE is avoided in multitube PDE by the sequential operations of the tubes. For exapmle, when one tube is in the later part of the blowdown stage, the other tubes may be in the earlier part of the blowdown stage. Figure 5.13b demonstrates the existance of a considerable lateral thrust up to 1000 N in the current triple-tube PDE, thereby causing unnecessary vibration of the vehicle. One way to mitigate this problem is to implement tube-pairs. Each tube-pair includes two detonation tubes which are located at symmertic positions and operate synchronously to ensure symmetric operation and consequently eliminates the lateral thrust. In some cases, however, the lateral thrust can also be appropriately utilized for thrust vectoring. Fig Spectra of periodic instantaneous axial thrusts of single-tube and triple-tube PDEs with operation timing of τ cycle = 3 ms, τ close =.1 ms, and τ purge = 0.1 ms The cycle-averaged specific impulse and specific thrust during a steady periodic cycle, e.g., the fifth cycle, are 3540 s and 895 m/s, respectively. These performance
219 01 numbers are about 4% higher than those of the baseline single-tube PDE given in Chapter 4. The multitube design thus slightly improves the propulsive performance. To identify the various loss mechanisms, the flow-path based analytical performance prediction model proposed in Chapter 4 is used to predict the upper performance limit. This model requires specifying the refilling Mach number. As mentioned in Sec. III.A, the refilling Mach numbers of the bottom, middle, and top tubes are 0.85, 1.0, and 0.94, respectively. The average is Interestingly, it is just the same as that for the baseline single-tube PDE. The corresponding upper limit of the specific impulse is thus 435 s. Comparing the simulated specific impulse to this upper limit, a performance loss of about 19.6% is obtained. This performance loss includes the imperfect nozzle expansion loss, the flow divergence loss, and the internal flow loss. Based on the calculation methods provided in Chapter 4, the three losses for the current baseline triple-tube PDE are 3%,.3%, and 14.3%, respectively. Compared to the baseline single-tube PDE, the nozzle expansion loss is significantly reduced, the internal flow loss is slightly reduced, and the flow divergence loss remains about the same. The 4% increase in propulsive performance of the triple-tube PDE thus comes from the reduction of the imperfect nozzle expansion loss and the internal flow loss. Figure 5.15 shows the instantaneous pressure thrust and impulse during a steady periodic cycle. The single-tube results are also included for comparison. In conventional steady engines with optimized nozzle, the exit pressure is equal to the ambient pressure, and the pressure thrust is thus zero. For unsteady engines such as PDE, the closer the pressure thrust to zero, the less the imperfect nozzle expansion loss. It is clear in Fig. 5.15a that the pressure thrust of the triple-tube PDE remains closer to zero than that of the
220 0 single-tube PDE, demonstrating a reduction in the imperfect nozzle expansion loss. The cumulative pressure impulse over the cycle is less than zero, as can be seen in Fig. 5.15b, indicating the overall effect of the nozzle flow is overexpansion. (a) (b) Fig Instantaneous pressure thrust and impulse during the fifth cycle (τ cycle = 3 ms, τ close =.1 ms, and τ purge = 0.1 ms)
221 03 The flow divergence loss results from the exhaust velocity vector angularity. Figure 5.16 compares the velocity profiles at the nozzle exit plane during a steady periodic cycle between the triple- and single-tube PDEs. The asymmetric pattern of the triple-tube results are clearly observed. However, the velocities from both cases are very close, leading to almost the same flow divergence losses. t 1 = 1.15 ms t = 1.50 ms t 3 = ms t 4 = ms t 5 = ms t 6 = ms single tube triple tube Fig Axial and vertical velocity profiles at nozzle exit plane during the fifth cycle of operation (τ cycle = 3 ms, τ close =.1 ms, and τ purge = 0.1 ms) The internal flow loss is mainly attributed to the shock waves and their interactions within the internal flowfield. In spite of the much more complicated shock interactions within the multitube PDE flowfield, the strengths of the shock waves related to the diffraction around the tube exit and the reflection from the nozzle wall are
222 relatively smaller than the strength of the shock wave related to the reflection from the nozzle wall in the single-tube PDE, leading to a slightly smaller internal flow loss Effect of Valve Timing A parametric study is conducted to investigate the timing effect on the propulsive performance by varying the cycle time τ cycle and the valve close-up time τ close. The purge time τ purge is fixed at 0.1 ms. Figure 5.17 shows the effects of τ close on the specific thrust F sp and the specific impulse I sp for two τ cycle : 3 ms and 4 ms. The single-tube results are also included for comparison. Clearly, the multitube design helps improve the propulsive performance. The specific thrust increases as τ close decreases for each frequency considered herein. The explanation of this trend for single-tube PDEs presented in Chapter 4 also applies here. Briefly, for a given τ cycle and τ purge, a smaller τ close leads to higher loading density of fresh reactant, a larger amount of reactant delivered to the chamber, a shorter period of negative thrust, and less internal flow loss, and thus results in a higher specific thrust. The lower bound of τ close is subjected to three practical constraints as mentioned in Chapter 4. For single-tube PDEs, it has been demonstrated in Chapter 4 that there exists an optimum frequency for a given configuration, which is attributed to the following two conflicting effects: 1) more reactants can be recharged into the detonation tube at a lower cycle frequency and ) an exceedingly large refilling time associated with a lowfrequency operation may cause chamber overfilling and thus degrade the performance. A
223 05 similar conclusion is found for multitube PDEs. Figure 5.17b indicates that the lower frequency of 50 Hz (τ cycle = 4 ms) offers not only a wide operating range but also higher performance than the higher frequency of 333 Hz (τ cycle = 3 ms). The optimum frequency is thus less than 333 Hz. However, further parametric studies are needed to determine this. A comparison between the triple-tube and single-tube results demonstrates the superiority of the multitube design. For the 333 Hz operation, the triple-tube PDE has performances of about 4% to 5% higher than those of single-tube PDEs. For the 50 Hz operation, the triple-tube PDE possesses both a wider operation range and higher performance. The lower bound of τ close related to the combustor overfilling in the singletube PDE doesn t appear in the triple-tube PDE. Instead, the performance increases as τ close decreases until the lower bound related to the inlet over-pressurization is reached. This is attributed to the fact that in the multitube PDE, the pressure in a detonation tube within the refilling process can be raised by the detonation-degenerated shock waves from other tubes, as discussed in Sec In contrast, the chamber pressure during the refilling process of the single-tube PDE may be quite low, especially for cases with very long blowdown process, thus resulting in high refilling velocity and chamber overfilling. The highest specific impulse obtained for the current design is 3870 s, at an operation timing with τ cycle of 4 ms and τ close of 1.8 ms. This performance number slightly exceeds its ramjet counterpart of 3866 s with optimum nozzle flow expansion and can be further improved by optimizing the operation timing.
224 06 specific thrust F sp,m/s (a) 4000 τ cycle =3ms triple tube single tube inlet over-pressurization combustor overfilled 4ms τ close,ms 3000 I sp,s τ cycle =3ms (b) triple tube 4ms single tube inlet over-pressurization combustor overfilled τ close,ms Fig Effect of valve close-up time on (a) air-based specific thrust and (b) fuel-based specific impulse; τ purge = 0.1 ms, stoichiometric H /air mixture, h = 9.3 km, M =.1.
225 Effect of System Geometry In addition to the operation timing, the system geometry represents another important factor that affects both the flow dynamics and the propulsive performance of a multitube PDE. The system geometry includes many independent variables, such as tube length, nozzle length, nozzle throat and exit areas, and so on. Generally, the study of the geometrical effect requires much effort due to the need to regenerate the computational grid. In Chapter 4 for single-tube PDEs, the effect of the CD nozzle configuration has been investigated by varying the nozzle length and throat area. In this chapter, the effect of a free volume located between the multiple tubes and the common nozzle, as depicted in Fig. 5.3, is considered. The purpose of adding such a free volume is to provide a buffer region to smooth the flowfield and improve the operation steadiness. Figure 5.18 shows the time evolution of the density-gradient field during the fifth cycle. The operation timing remains identical to that for the baseline case. The refilling lengths for the bottom, middle, and top tubes are 33.6, 44.3, and 34.8 cm, respectively. The averaged refilling Mach numbers are 0.88, 1.0, and 0.99, respectively. The flowfield characteristics within the detonation tubes and the external region are quite similar in nature to those without free volume. Within the free volume, however, the flow exhibits very complicated structures. In addition to the diffraction and reflection of the shock waves from the three detonation tubes, the interactions of the supersonic exhaust flow from the detonation tubes with the subsonic flow within the corner regions near the conjunction of the combustor and the convergent nozzle wall lead to the formation of standing-like shock waves. These shock waves may be quite strong. For example, the shock wave located at the middle of the free volume has a pressure ratio of as high as 5.
 top: detonation mid: blowdown bot: purging (f) top: purging mid: detonation bot:")

, with free volume These shock waves represent certain internal flow loss and have no contribution to raise the")

226 08 (a) (d) top: blowdown mid: purging bot: detonation (b) top: refilling mid: blowdown bot: blowdown (e) top: blowdown mid: refilling bot: blowdown (c) top: detonation mid: blowdown bot: purging (f) top: purging mid: detonation bot: blowdown top: blowdown mid: blowdown bot: refilling Fig Time evolution of density-gradient field during the fifth cycle of operation (τ cycle = 3 ms, τ close =.1 ms, and τ purge = 0.1 ms), with free volume These shock waves represent certain internal flow loss and have no contribution to raise the detonation tube pressure. Only those shock waves that propagate back into the tubes have such contribution. The interactions of the exhaust flows and the corner zones also result in the formation of recirculation zones, as evidenced in Fig. 5.19, in which two large and one small recirculation zones between the bottom tube exit, and the upper corner and one large recirculation zone between the bottom tube exit and lower corner

227 09 zone can be clearly seen. This kind of flow structure further increases the internal flow loss and is thus detrimental to the propulsive performance. A plug nozzle may be a better candidate for multitube PDE since it permits certain tube interactions through moving shock waves within the detonation tubes while keeping away the standing-like shock waves from the internal flowfield. Fig Pressure contours and streamlines at t = ms (τ cycle = 3 ms, τ close =.1 ms, and τ purge = 0.1 ms), with free volume Fig. 5.0 shows the instantaneous axial thrust during a steady periodic cycle for both configurations. The second peak related to the middle tube detonation is slightly reduced with the addition of the free volume, while the first and third peaks related to the other two tubes remain the same. Therefore, the improvement in operation steadiness by the free volume is very limited. The specific impulse and specific thrust are 337 s and 855 m/s, respectively. These values are lower than those without free volume and are even lower than those of the single-tube PDE, demonstrating a negative effect of the free volume on the propulsive
Thrust Chamber Dynamics and Propulsive Performance of Multitube Pulse Detonation Engines
 JOURNAL OF PROPULSION AND POWER Vol. 21, No. 4, July August 2005 Thrust Chamber Dynamics and Propulsive Performance of Multitube Pulse Detonation Engines Fuhua Ma, Jeong-Yeol Choi, and Vigor Yang Pennsylvania
Model for the Performance of Airbreathing Pulse-Detonation Engines
 JOURNAL OF PROPULSION AND POWER Vol. 22, No. 3, May June 2006 Model for the Performance of Airbreathing Pulse-Detonation Engines E. Wintenberger and J. E. Shepherd California Institute of Technology, Pasadena,
A MODEL FOR THE PERFORMANCE OF AIR-BREATHING PULSE DETONATION ENGINES
 A MODEL FOR THE PERFORMANCE OF AIR-BREATHING PULSE DETONATION ENGINES E. Wintenberger and J.E. Shepherd Graduate Aeronautical Laboratories, California Institute of Technology, Pasadena, CA 91125 An analytical
THERMODYNAMIC ANALYSIS OF COMBUSTION PROCESSES FOR PROPULSION SYSTEMS
 2nd AIAA Aerospace Sciences Paper 2-33 Meeting and Exhibit January -8, 2, Reno, NV THERMODYNAMIC ANALYSIS OF COMBUSTION PROCESSES FOR PROPULSION SYSTEMS E. Wintenberger and J. E. Shepherd Graduate Aeronautical
Contents. Preface... xvii
 Contents Preface... xvii CHAPTER 1 Idealized Flow Machines...1 1.1 Conservation Equations... 1 1.1.1 Conservation of mass... 2 1.1.2 Conservation of momentum... 3 1.1.3 Conservation of energy... 3 1.2
Application of Steady and Unsteady Detonation Waves to Propulsion
 Application of Steady and Unsteady Detonation Waves to Propulsion Thesis by Eric Wintenberger In Partial Fulfillment of the Requirements for the Degree of Doctor of Philosophy California Institute of Technology
On thermodynamic cycles for detonation engines
 On thermodynamic cycles for detonation engines R. Vutthivithayarak, E.M. Braun, and F.K. Lu 1 Introduction Detonation engines are considered to potentially yield better performance than existing turbo-engines
An analytical model for the impulse of a single-cycle pulse detonation tube
 Preprint, see final version in Journal of Propulsion and Power, 19(1):22-38, 23. http://dx.doi.org/1.2514/2.699. See also the erratum (JPP 2(4) 765-767, 24) and responses to comments by Heiser and Pratt
Carbon Science and Technology
 ASI RESEARCH ARTICLE Carbon Science and Technology Received:10/03/2016, Accepted:15/04/2016 ------------------------------------------------------------------------------------------------------------------------------
PARAMETRIC AND PERFORMANCE ANALYSIS OF A HYBRID PULSE DETONATION/TURBOFAN ENGINE SIVARAI AMITH KUMAR
 PARAMETRIC AND PERFORMANCE ANALYSIS OF A HYBRID PULSE DETONATION/TURBOFAN ENGINE By SIVARAI AMITH KUMAR Presented to the Faculty of the Graduate School of The University of Texas at Arlington in Partial
Application of a Laser Induced Fluorescence Model to the Numerical Simulation of Detonation Waves in Hydrogen-Oxygen-Diluent Mixtures
 Supplemental material for paper published in the International J of Hydrogen Energy, Vol. 30, 6044-6060, 2014. http://dx.doi.org/10.1016/j.ijhydene.2014.01.182 Application of a Laser Induced Fluorescence
ANALYSIS OF PULSE DETONATION TURBOJET ENGINES RONNACHAI VUTTHIVITHAYARAK. Presented to the Faculty of the Graduate School of
 ANALYSIS OF PULSE DETONATION TURBOJET ENGINES by RONNACHAI VUTTHIVITHAYARAK Presented to the Faculty of the Graduate School of The University of Texas at Arlington in Partial Fulfillment of the Requirements
Fundamentals of Rotating Detonation. Toshi Fujiwara (Nagoya University)
") Fundamentals of Rotating Detonation Toshi Fujiwara (Nagoya University) New experimental results Cylindical channel D=140/150mm Hydrogen air; p o =1.0bar Professor Piotr Wolanski P [bar] 10 9 8 7 6 5 4
Fundamentals of Rotating Detonation Toshi Fujiwara (Nagoya University) New experimental results Cylindical channel D=140/150mm Hydrogen air; p o =1.0bar Professor Piotr Wolanski P [bar] 10 9 8 7 6 5 4
Impulse of a Single-Pulse Detonation Tube
 Impulse of a Single-Pulse Detonation Tube E. Wintenberger, J.M. Austin, M. Cooper, S. Jackson, and J.E. Shepherd Graduate Aeronautical Laboratories California Institute of Technology Pasadena, CA 91125
Lecture 7 Detonation Waves
 Lecture 7 etonation Waves p strong detonation weak detonation weak deflagration strong deflagration / 0 v =/ University of Illinois at Urbana- Champaign eflagrations produce heat Thermal di usivity th
Parametric study for performance optimization of pulse detonation engines
 Parametric study for performance optimization of pulse detonation engines by Hasan Zakaria Rouf A thesis submitted in partial fulfillment of the requirements for the degree of Master of Science in Mechanical
Please welcome for any correction or misprint in the entire manuscript and your valuable suggestions kindly mail us
 Problems of Practices Of Fluid Mechanics Compressible Fluid Flow Prepared By Brij Bhooshan Asst. Professor B. S. A. College of Engg. And Technology Mathura, Uttar Pradesh, (India) Supported By: Purvi Bhooshan
CFD Simulation of Internal Flowfield of Dual-mode Scramjet
 CFD Simulation of Internal Flowfield of Dual-mode Scramjet C. Butcher, K. Yu Department of Aerospace Engineering, University of Maryland, College Park, MD, USA Abstract: The internal flowfield of a hypersonic
Recently, a novel concept of a multi-mode pulse detonation wave based propulsion system for hypersonic
 Detonation Wave Propagation in an Ejector-Augmented Pulse Detonation Rocket Tae-Hyeong Yi, Donald R. Wilson and Frank K. Lu Aerodynamics Research Center, University of Texas at Arlington, Arlington, TX
Richard Nakka's Experimental Rocketry Web Site
 Página 1 de 7 Richard Nakka's Experimental Rocketry Web Site Solid Rocket Motor Theory -- Nozzle Theory Nozzle Theory The rocket nozzle can surely be described as the epitome of elegant simplicity. The
IX. COMPRESSIBLE FLOW. ρ = P
 IX. COMPRESSIBLE FLOW Compressible flow is the study of fluids flowing at speeds comparable to the local speed of sound. This occurs when fluid speeds are about 30% or more of the local acoustic velocity.
Thermoacoustic Instabilities Research
 Chapter 3 Thermoacoustic Instabilities Research In this chapter, relevant literature survey of thermoacoustic instabilities research is included. An introduction to the phenomena of thermoacoustic instability
AA210A Fundamentals of Compressible Flow. Chapter 13 - Unsteady Waves in Compressible Flow
 AA210A Fundamentals of Compressible Flow Chapter 13 - Unsteady Waves in Compressible Flow The Shock Tube - Wave Diagram 13.1 Equations for irrotational, homentropic, unsteady flow ρ t + x k ρ U i t (
UNIVERSITY OF CINCINNATI
 UNIVERSITY OF CINCINNATI Date: June 14,2005 I, Arun Prakash Raghupathy, hereby submit this work as part of the requirements for the degree of: Master of Science in: Mechanical Engineering It is entitled:
Jet Aircraft Propulsion Prof. Bhaskar Roy Prof A M Pradeep Department of Aerospace Engineering Indian Institute of Technology, Bombay
 Jet Aircraft Propulsion Prof. Bhaskar Roy Prof A M Pradeep Department of Aerospace Engineering Indian Institute of Technology, Bombay Module No. #01 Lecture No. # 07 Jet Engine Cycles For Aircraft propulsion
Oblique Detonation Wave Engine: Preliminary Design and Performance Prediction
 Oblique Detonation Wave Engine: Preliminary Design and Performance Prediction A project present to The Faculty of the Department of Aerospace Engineering San Jose State University in partial fulfillment
doi: /j.combustflame
 doi: 10.1016/j.combustflame.2011.10.001 Combustion and Flame (Accepted for Publication, 2011 October 4th) Title: Optical and Thrust Measurement of a Pulse Detonation Combustor with a Coaxial Rotary Valve
NUMERICAL SIMULATION OF UNSTEADY NORMAL DETONATION COMBUSTION AJJAY OMPRAKAS. Presented to the Faculty of the Graduate School of
 NUMERICAL SIMULATION OF UNSTEADY NORMAL DETONATION COMBUSTION by AJJAY OMPRAKAS Presented to the Faculty of the Graduate School of The University of Texas at Arlington in Partial Fulfillment of the Requirements
Pulse Detonation Propulsion
 S.M. Frolov N. Semenov Institute of Chemical Physics Moscow RUSSIA smfrol@chph.ras.ru ABSTRACT The objective of theoretical, computational and experimental studies outlined in this lecture note was to
P 1 P * 1 T P * 1 T 1 T * 1. s 1 P 1
 ME 131B Fluid Mechanics Solutions to Week Three Problem Session: Isentropic Flow II (1/26/98) 1. From an energy view point, (a) a nozzle is a device that converts static enthalpy into kinetic energy. (b)
GAS DYNAMICS. M. Halük Aksel. O. Cahit Eralp. and. Middle East Technical University Ankara, Turkey
 GAS DYNAMICS M. Halük Aksel and O. Cahit Eralp Middle East Technical University Ankara, Turkey PRENTICE HALL f r \ New York London Toronto Sydney Tokyo Singapore; \ Contents Preface xi Nomenclature xiii
Cellular structure of detonation wave in hydrogen-methane-air mixtures
 Open Access Journal Journal of Power Technologies 91 (3) (2011) 130 135 journal homepage:papers.itc.pw.edu.pl Cellular structure of detonation wave in hydrogen-methane-air mixtures Rafał Porowski, Andrzej
The ramjet cycle. Chapter Ramjet flow field
 Chapter 3 The ramjet cycle 3. Ramjet flow field Before we begin to analyze the ramjet cycle we will consider an example that can help us understand how the flow through a ramjet comes about. The key to
AME 513. " Lecture 8 Premixed flames I: Propagation rates
 AME 53 Principles of Combustion " Lecture 8 Premixed flames I: Propagation rates Outline" Rankine-Hugoniot relations Hugoniot curves Rayleigh lines Families of solutions Detonations Chapman-Jouget Others
Jet Aircraft Propulsion Prof. Bhaskar Roy Prof. A.M. Pradeep Department of Aerospace Engineering
 Jet Aircraft Propulsion Prof. Bhaskar Roy Prof. A.M. Pradeep Department of Aerospace Engineering Indian Institute of Technology, IIT Bombay Module No. # 01 Lecture No. # 08 Cycle Components and Component
Design and Optimization of De Lavel Nozzle to Prevent Shock Induced Flow Separation
 Advances in Aerospace Science and Applications. ISSN 2277-3223 Volume 3, Number 2 (2013), pp. 119-124 Research India Publications http://www.ripublication.com/aasa.htm Design and Optimization of De Lavel
Dynamic Pressure Characterization of a Dual-Mode Scramjet
 26 th ICDERS July 30 th August 4 th, 2017 Boston, MA, USA Dynamic Pressure Characterization of a Dual-Mode Scramjet Camilo Aguilera, Amardip Ghosh, Kyung-Hoon Shin, Kenneth H. Yu Department of Aerospace
Analytical Models for the Thrust of a Rotating Detonation Engine
 Analytical Models for the Thrust of a Rotating Detonation Engine Joseph E. Shepherd Professor of Aeronautics and Mechanical Engineering joseph.e.shepherd@caltech.edu Graduate Aerospace Laboratories California
Shock and Expansion Waves
 Chapter For the solution of the Euler equations to represent adequately a given large-reynolds-number flow, we need to consider in general the existence of discontinuity surfaces, across which the fluid
DETONATION HAZARD CLASSIFICATION BASED ON THE CRITICAL ORIFICE PLATE DIAMETER FOR DETONATION PROPAGATION
 DETONATION HAZARD CLASSIFICATION BASED ON THE CRITICAL ORIFICE PLATE DIAMETER FOR DETONATION PROPAGATION by Mitchell Cross A thesis submitted to the Department of Mechanical and Materials Engineering In
Laminar Premixed Flames: Flame Structure
 Laminar Premixed Flames: Flame Structure Combustion Summer School 2018 Prof. Dr.-Ing. Heinz Pitsch Course Overview Part I: Fundamentals and Laminar Flames Introduction Fundamentals and mass balances of
1. (20 pts total 2pts each) - Circle the most correct answer for the following questions.
 - Circle the most correct answer for the following questions.") ME 50 Gas Dynamics Spring 009 Final Exam NME:. (0 pts total pts each) - Circle the most correct answer for the following questions. i. normal shock propagated into still air travels with a speed (a) equal
ME 50 Gas Dynamics Spring 009 Final Exam NME:. (0 pts total pts each) - Circle the most correct answer for the following questions. i. normal shock propagated into still air travels with a speed (a) equal
MACH REFLECTION INDUCED DETONATION IN A REACTIVE FLOW. Supervising Professor Name Frank Lu. Donald Wilson. Albert Tong
 MACH REFLECTION INDUCED DETONATION IN A REACTIVE FLOW The members of the Committee approve the master s thesis of Walid Cederbond Supervising Professor Name Frank Lu Donald Wilson Albert Tong Copyright
DESIGN AND NUMERICAL ANALYSIS OF ASYMMETRIC NOZZLE OF SHCRAMJET ENGINE
 ISSN (O): 393-869 DESIGN AND NUMERICAL ANALYSIS OF ASYMMETRIC NOZZLE OF SHCRAMJET ENGINE Lokesh Silwal lokusilwal@gmail.com Sajan Sharma thesajansharma@gm ail.com Nitish Acharya nitishacharya1818@g mail.com
Detonation of Gas Particle Flow
 2 Detonation of Gas Particle Flow F. Zhang 2.1 Introduction Fine organic or metallic particles suspended in an oxidizing or combustible gas form a reactive particle gas mixture. Explosion pressures in
Applied Gas Dynamics Flow With Friction and Heat Transfer
 Applied Gas Dynamics Flow With Friction and Heat Transfer Ethirajan Rathakrishnan Applied Gas Dynamics, John Wiley & Sons (Asia) Pte Ltd c 2010 Ethirajan Rathakrishnan 1 / 121 Introduction So far, we have
Section 4.1: Introduction to Jet Propulsion. MAE Propulsion Systems II
 Section 4.1: Introduction to Jet Propulsion Jet Propulsion Basics Squeeze Bang Blow Suck Credit: USAF Test Pilot School 2 Basic Types of Jet Engines Ramjet High Speed, Supersonic Propulsion, Passive Compression/Expansion
THEORETICAL AND EXPERIMENTAL INVESTIGATIONS ON CHOKING PHENOMENA OF AXISYMMETRIC CONVERGENT NOZZLE FLOW
 8 TH INTERNATIONAL CONGRESS OF THE AERONAUTICAL SCIENCES THEORETICAL AND EXPERIMENTAL INVESTIGATIONS ON CHOKING PHENOMENA OF AXISYMMETRIC CONVERGENT NOZZLE FLOW Ryuta ISOZUMI*, Kazunori KUBO*, Daisuke
A Computational Study on the Thrust Performance of a Supersonic Pintle Nozzle
 June 30 - July 3, 2015 Melbourne, Australia 9 P-10 A Computational Study on the Thrust Performance of a Supersonic Pintle Nozzle Ruoyu Deng Department of Mechanical Engineering Andong National University,
In which of the following scenarios is applying the following form of Bernoulli s equation: steady, inviscid, uniform stream of water. Ma = 0.
 bernoulli_11 In which of the following scenarios is applying the following form of Bernoulli s equation: p V z constant! g + g + = from point 1 to point valid? a. 1 stagnant column of water steady, inviscid,
CONTENTS Real chemistry e ects Scramjet operating envelope Problems
 Contents 1 Propulsion Thermodynamics 1-1 1.1 Introduction.................................... 1-1 1.2 Thermodynamic cycles.............................. 1-8 1.2.1 The Carnot cycle.............................
Pulse Detonation Propulsion
 S.M. Frolov N. Semenov Institute of Chemical Physics Moscow RUSSIA smfrol@chph.ras.ru ABSTRACT The objective of theoretical, computational and experimental studies outlined in this lecture note was to
Direct Simulation of Ultrafast Detonations in Mixtures
 Direct Simulation of Ultrafast Detonations in Mixtures Patrick D. O Connor *, Lyle N. Long * and James B. Anderson * Department of Aerospace Engineering, The Pennsylvania State University, University Park,
Lecture with Numerical Examples of Ramjet, Pulsejet and Scramjet
 Lecture 41 1 Lecture with Numerical Examples of Ramjet, Pulsejet and Scramjet 2 Problem-1 Ramjet A ramjet is flying at Mach 1.818 at an altitude 16.750 km altitude (Pa = 9.122 kpa, Ta= - 56.5 0 C = 216.5
MONTANA STATE UNIVERSITY DEPARTMENT OF MECHANICAL ENGINEERING. EMEC 426 Thermodynamics of Propulsion Systems. Spring 2017
 MONTANA STATE UNIVERSITY DEPARTMENT OF MECHANICAL ENGINEERING EMEC 426 Thermodynamics of Propulsion Systems Spring 2017 Instructor: Dr. Alan H. George Office: Roberts 119 Office Hours: to be announced
MONTANA STATE UNIVERSITY DEPARTMENT OF MECHANICAL ENGINEERING. EMEC 426 Thermodynamics of Propulsion Systems. Spring 2018
 MONTANA STATE UNIVERSITY DEPARTMENT OF MECHANICAL ENGINEERING EMEC 426 Thermodynamics of Propulsion Systems Spring 2018 Instructor: Dr. Alan H. George Office: Roberts 119 Office Hours: to be announced
DEVELOPMENT OF A COMPRESSED CARBON DIOXIDE PROPULSION UNIT FOR NEAR-TERM MARS SURFACE APPLICATIONS
 DEVELOPMENT OF A COMPRESSED CARBON DIOXIDE PROPULSION UNIT FOR NEAR-TERM MARS SURFACE APPLICATIONS Erin Blass Old Dominion University Advisor: Dr. Robert Ash Abstract This work has focused on the development
ANALYSIS OF THE PREDICTION ABILITY OF REACTION MECHANISMS FOR CFD MODELING OF THE COMBUSTION IN HIGH VELOCITY ENGINES
 ANALYSIS OF THE PREDICTION ABILITY OF REACTION MECHANISMS FOR CFD MODELING OF THE COMBUSTION IN HIGH VELOCITY ENGINES V. Kopchenov*, S. Batura*, L. Bezgin*, N. Titova*, A. Starik* *CIAM, Russia Keywords:
AA214B: NUMERICAL METHODS FOR COMPRESSIBLE FLOWS
 AA214B: NUMERICAL METHODS FOR COMPRESSIBLE FLOWS 1 / 29 AA214B: NUMERICAL METHODS FOR COMPRESSIBLE FLOWS Hierarchy of Mathematical Models 1 / 29 AA214B: NUMERICAL METHODS FOR COMPRESSIBLE FLOWS 2 / 29
DEVELOPMENT OF A ONE DIMENSIONAL ANALYSIS PROGRAM FOR SCRAMJET AND RAMJET FLOWPATHS
 DEVELOPMENT OF A ONE DIMENSIONAL ANALYSIS PROGRAM FOR SCRAMJET AND RAMJET FLOWPATHS Kathleen Tran and Walter F. O'Brien, Jr Center for Turbomachinery and Propulsion Research Virginia Polytechnic Institute
Numerical investigation of second-law characteristics of ramjet throttling
 Scholars' Mine Masters Theses Student Research & Creative Works Spring 2012 Numerical investigation of second-law characteristics of ramjet throttling Jonathan Albert Sheldon Follow this and additional
Rocket Propulsion. Combustion chamber Throat Nozzle
 Rocket Propulsion In the section about the rocket equation we explored some of the issues surrounding the performance of a whole rocket. What we didn t explore was the heart of the rocket, the motor. In
William A. Sirignano Mechanical and Aerospace Engineering University of California, Irvine
 Combustion Instability: Liquid-Propellant Rockets and Liquid-Fueled Ramjets William A. Sirignano Mechanical and Aerospace Engineering University of California, Irvine Linear Theory Nonlinear Theory Nozzle
AME 436. Energy and Propulsion. Lecture 11 Propulsion 1: Thrust and aircraft range
 AME 436 Energy and Propulsion Lecture 11 Propulsion 1: Thrust and aircraft range Outline!!!!! Why gas turbines? Computation of thrust Propulsive, thermal and overall efficiency Specific thrust, thrust
Unified Quiz: Thermodynamics
 Unified Quiz: Thermodynamics October 14, 2005 Calculators allowed. No books or notes allowed. A list of equations is provided. Put your ID number on each page of the exam. Read all questions carefully.
Compressible Flow. Professor Ugur GUVEN Aerospace Engineer Spacecraft Propulsion Specialist
 Compressible Flow Professor Ugur GUVEN Aerospace Engineer Spacecraft Propulsion Specialist What is Compressible Flow? Compressible Flow is a type of flow in which the density can not be treated as constant.
Modelling Nozzle throat as Rocket exhaust
 Vol. 3, Issue. 4, Jul - Aug. 2013 pp-2502-2506 ISSN: 2249-6645 Modelling Nozzle throat as Rocket exhaust Keshava Rao P. 1, Komma Rahul 2, Souda Dinesh 3 1 (Mechanical Engineering, CBIT College, India)
MODELING & SIMULATION OF ROCKET NOZZLE
 MODELING & SIMULATION OF ROCKET NOZZLE Nirmith Kumar Mishra, Dr S Srinivas Prasad, Mr Ayub Padania Department of Aerospace Engineering MLR Institute of Technology Hyderabad, T.S Abstract This project develops
AME 436. Energy and Propulsion. Lecture 15 Propulsion 5: Hypersonic propulsion
 AME 436 Energy and Propulsion Lecture 5 Propulsion 5: Hypersonic propulsion Outline!!!!!! Why hypersonic propulsion? What's different about it? Conventional ramjet heat addition at M
Initiation of stabilized detonations by projectiles
 Initiation of stabilized detonations by projectiles P. Hung and J. E. Shepherd, Graduate Aeronautical Laboratory, California Institute of Technology, Pasadena, CA 91125 USA Abstract. A high-speed projectile
Boundary-Layer Theory
 Hermann Schlichting Klaus Gersten Boundary-Layer Theory With contributions from Egon Krause and Herbert Oertel Jr. Translated by Katherine Mayes 8th Revised and Enlarged Edition With 287 Figures and 22
Computational Fluid Dynamics Analysis of Advanced Rocket Nozzle
 Research Article International Journal of Current Engineering and Technology E-ISSN 2277 4106, P-ISSN 2347-5161 2014 INPRESSCO, All Rights Reserved Available at http://inpressco.com/category/ijcet Computational
NAPC Numerical investigation of axisymmetric underexpanded supersonic jets. Pratikkumar Raje. Bijaylakshmi Saikia. Krishnendu Sinha 1
 Proceedings of the 1 st National Aerospace Propulsion Conference NAPC-2017 March 15-17, 2017, IIT Kanpur, Kanpur NAPC-2017-139 Numerical investigation of axisymmetric underexpanded supersonic jets Pratikkumar
Numerical Simulation and Modeling of Combustion in Scramjets
 Western Michigan University ScholarWorks at WMU Dissertations Graduate College 12-2015 Numerical Simulation and Modeling of Combustion in Scramjets Ryan James Clark Western Michigan University, clark_r@icloud.com
 Tutorial Materials for ME 131B Fluid Mechanics (Compressible Flow & Turbomachinery) Calvin Lui Department of Mechanical Engineering Stanford University Stanford, CA 94305 March 1998 Acknowledgments This
Periodic oscillation and fine structure of wedge-induced oblique detonation waves
 Acta Mech. Sin. (211) 27(6):922 928 DOI 1.17/s149-11-58-y RESEARCH PAPER Periodic oscillation and fine structure of wedge-induced oblique detonation waves Ming-Yue Gui Bao-Chun Fan Gang Dong Received:
FUNDAMENTALS OF GAS DYNAMICS
 FUNDAMENTALS OF GAS DYNAMICS Second Edition ROBERT D. ZUCKER OSCAR BIBLARZ Department of Aeronautics and Astronautics Naval Postgraduate School Monterey, California JOHN WILEY & SONS, INC. Contents PREFACE
UNIVERSITY OF CALGARY. Stability of Detonation Wave under Chain Branching Kinetics: Role of the Initiation Step. Michael Anthony Levy A THESIS
 UNIVERSITY OF CALGARY Stability of Detonation Wave under Chain Branching Kinetics: Role of the Initiation Step by Michael Anthony Levy A THESIS SUBMITTED TO THE FACULTY OF GRADUATE STUDIES IN PARTIAL FULFILLMENT
Mass flow determination in flashing openings
 Int. Jnl. of Multiphysics Volume 3 Number 4 009 40 Mass flow determination in flashing openings Geanette Polanco Universidad Simón Bolívar Arne Holdø Narvik University College George Munday Coventry University
 This article was published in an Elsevier journal. The attached copy is furnished to the author for non-commercial research and education use, including for instruction at the author s institution, sharing
TURBINE BURNERS: Engine Performance Improvements; Mixing, Ignition, and Flame-Holding in High Acceleration Flows
 TURBINE BURNERS: Engine Performance Improvements; Mixing, Ignition, and Flame-Holding in High Acceleration Flows Presented by William A. Sirignano Mechanical and Aerospace Engineering University of California
FLUID MECHANICS 3 - LECTURE 4 ONE-DIMENSIONAL UNSTEADY GAS
 FLUID MECHANICS 3 - LECTURE 4 ONE-DIMENSIONAL UNSTEADY GAS Consider an unsteady 1-dimensional ideal gas flow. We assume that this flow is spatially continuous and thermally isolated, hence, it is isentropic.
Physics and Applications of Gaseous Detonation
 Physical Gas Dynamics Lab., Nagoya University 1 Physics and Applications of Gaseous Detonation Toshi FUJIWARA, FF Lab, Nagoya 465-0093 also Department of Aerospace Engineering, Nagoya University, Nagoya
S. Kadowaki, S.H. Kim AND H. Pitsch. 1. Motivation and objectives
 Center for Turbulence Research Annual Research Briefs 2005 325 The dynamics of premixed flames propagating in non-uniform velocity fields: Assessment of the significance of intrinsic instabilities in turbulent
Lecture-2. One-dimensional Compressible Fluid Flow in Variable Area
 Lecture-2 One-dimensional Compressible Fluid Flow in Variable Area Summary of Results(Cont..) In isoenergetic-isentropic flow, an increase in velocity always corresponds to a Mach number increase and vice
The Turbofan cycle. Chapter Turbofan thrust
 Chapter 5 The Turbofan cycle 5. Turbofan thrust Figure 5. illustrates two generic turbofan engine designs. The upper figure shows a modern high bypass ratio engine designed for long distance cruise at
AEROSPACE ENGINEERING DEPARTMENT. Second Year - Second Term ( ) Fluid Mechanics & Gas Dynamics
 Fluid Mechanics & Gas Dynamics") AEROSPACE ENGINEERING DEPARTMENT Second Year - Second Term (2008-2009) Fluid Mechanics & Gas Dynamics Similitude,Dimensional Analysis &Modeling (1) [7.2R*] Some common variables in fluid mechanics include:
AEROSPACE ENGINEERING DEPARTMENT Second Year - Second Term (2008-2009) Fluid Mechanics & Gas Dynamics Similitude,Dimensional Analysis &Modeling (1) [7.2R*] Some common variables in fluid mechanics include:
FLIGHT DYNAMICS. Robert F. Stengel. Princeton University Press Princeton and Oxford
 FLIGHT DYNAMICS Robert F. Stengel Princeton University Press Princeton and Oxford Preface XV Chapter One Introduction 1 1.1 ELEMENTS OF THE AIRPLANE 1 Airframe Components 1 Propulsion Systems 4 1.2 REPRESENTATIVE
Steady waves in compressible flow
 Chapter Steady waves in compressible flow. Oblique shock waves Figure. shows an oblique shock wave produced when a supersonic flow is deflected by an angle. Figure.: Flow geometry near a plane oblique
Detonation initiation by hypervelocity projectiles
 Detonation initiation 1 Detonation initiation by hypervelocity projectiles J. Bélanger, M.Kaneshige,J.E.Shepherd California Institute of Technology Pasadena, CA 91125 USA Abstract: We report experimental
1. For an ideal gas, internal energy is considered to be a function of only. YOUR ANSWER: Temperature
 CHAPTER 11 1. For an ideal gas, internal energy is considered to be a function of only. YOUR ANSWER: Temperature 2.In Equation 11.7 the subscript p on the partial derivative refers to differentiation at
UNIT 1 COMPRESSIBLE FLOW FUNDAMENTALS
 UNIT 1 COMPRESSIBLE FLOW FUNDAMENTALS 1) State the difference between compressible fluid and incompressible fluid? 2) Define stagnation pressure? 3) Express the stagnation enthalpy in terms of static enthalpy
EQUATION OF STATE FOR MODELING THE DETONATION REACTION ZONE
 EQUATION OF STATE FOR MODELING THE DETONATION REACTION ZONE D. Scott Stewart and Sunhee Yoo Department of Theoretical and Applied Mechanics University of Illinois, Urbana, IL 61801, USA William C. Davis
Aerothermodynamics of High Speed Flows
 Aerothermodynamics of High Speed Flows Lecture 5: Nozzle design G. Dimitriadis 1 Introduction Before talking about nozzle design we need to address a very important issue: Shock reflection We have already
AOE 3114 Compressible Aerodynamics
 AOE 114 Compressible Aerodynamics Primary Learning Objectives The student will be able to: 1. Identify common situations in which compressibility becomes important in internal and external aerodynamics
ONE DIMENSIONAL ANALYSIS PROGRAM FOR SCRAMJET AND RAMJET FLOWPATHS
 ONE DIMENSIONAL ANALYSIS PROGRAM FOR SCRAMJET AND RAMJET FLOWPATHS Kathleen Tran and Walter F. O'Brien, Jr Center for Turbomachinery and Propulsion Research Virginia Polytechnic Institute and State University
Investigation of Transonic Flow Behavior around a Three- Dimensional Turret Using Particle Image Velocimetry
 Investigation of Transonic Flow Behavior around a Three- Dimensional Turret Using Particle Image Velocimetry Carlos Caballero College of Engineering, University of Florida Light distortions produced by
Axisymmetric SCRamjet Engine Design and Performance Analysis
 International Space Planes and Hypersonic Systems and Technologies Conferences 6-9 July 215, Glasgow, Scotland 2th AIAA International Space Planes and Hypersonic Systems and Technologies Conference AIAA
Application of Computational Fluid Dynamics in Discontinuous Unsteady Flow with Large Amplitude Changes; the Shock Tube Problem
 Application of Computational Fluid Dynamics in Discontinuous Unsteady Flow with Large Amplitude Changes; the Shock Tube Problem KHALED ALHUSSAN Research Assistant Professor, Space Research Institute, King