Mechanical Properties of Cellular Core Structures
|
|
|
- Everett Gallagher
- 5 years ago
- Views:
Transcription
1 Mechanical Properties of Cellular Core Structures Hazem E. Soliman Dissertation submitted to the Faculty of the Virginia Polytechnic Institute and State University in partial fulfillment of the requirements for the degree of Doctor of Philosophy in Aerospace Engineering Rakesh K. Kapania, Chair Romesh C. Batra Jonathan T. Black Alan J. Brown March 21, 2016 Blacksburg, Virginia Keywords: Honeycomb, Cellular Core, Equivalent Continuum, Sandwich Panels Copyright 2016, Hazem E. Soliman
2 Mechanical Properties of Cellular Core Structures Hazem E. Soliman (Abstract) Cellular core structures are the state-of-the-art technology for light weight structures in the aerospace industry. In an aerospace product, sandwich panels with cellular core represent the primary structural component as a given aerospace product may contain a large number of sandwich panels. This reveals the necessity of understanding the mechanical behavior of the cellular core and the impact of that behavior on the overall structural behavior of the sandwich panel, and hence the final aerospace product. As the final aerospace product must go through multiple qualification tests to achieve a final structure that is capable of withstanding all environments possible, analyzing the structure prior to testing is very important to avoid any possible failures and to ensure that the final design is indeed capable of withstanding the loads. To date, due to the lack of full understanding of the mechanical behavior of cellular cores and hence the sandwich panels, there still remains a significant lack of analytical capability to predict the proper behavior of the final product and failures may still occur even with significant effort spent on pre-test analyses. Analyzing cellular core to calculate the equivalent material properties of this type of I
3 structure is the only way to properly design the core for sandwich enhanced stiffness to weight ratio of the sandwich panels. A detailed literature review is first conducted to access the current state of development of this research area based on experiment and analysis. Then, one of the recently developed homogenization schemes is chosen to investigate the mechanical behavior of heavy, non-corrugated square cellular core with a potential application in marine structures. The mechanical behavior of the square cellular core is then calculated by applying the displacement approach to a representative unit cell finite element model. The mechanical behavior is then incorporated into sandwich panel finite element model and in an in-house code to test the predicted mechanical properties by comparing the center-of-panel displacement from all analyses to that of a highly detailed model. The research is then expanded to cover three cellular core shapes, hexagonal cores made of corrugated sheets, square cores made of corrugated sheets, and triangular cores. The expansion covers five different cell sizes and twenty one different core densities for each of the core shapes considering light cellular cores for space applications, for a total of 315 detailed studies. The accuracy of the calculated properties for all three core shapes is checked against highly detailed finite element models of sandwich panels. Formulas are then developed to calculate the mechanical properties of the three shapes of cellular cores studied for any core density and any of the five cell sizes. An error analysis is then performed to understand the quality of the predicted equivalent properties considering the panel size to cell size ratio as well as the facesheet thickness to core thickness ratio. II
4 The research finally expanded to understand the effect of buckling of the unit cell on the equivalent mechanical property of the cellular core. This part of the research is meant to address the impact of the local buckling that may occur due to impact of any type during the manufacturing, handling or assembly of the sandwich panels. The variation of the equivalent mechanical properties with the increase in transverse compression load, until the first folding of the unit cell is complete, is calculated for each of the three core shapes under investigation. III
5 Dedication To my Parents IV
6 Acknowledgments First, I would like to thank my advisor, Prof. Rakesh K. Kapania from the Aerospace and Ocean Engineering Department of Virginia Tech for all his teaching, guidance, and support throughout this dissertation. His insight and comprehensive knowledge of aerospace structures provided me a great opportunity of learning. I am also grateful to the other members of my committee: Prof. Romesh C. Batra from the Engineering, Science and Mechanics Department, Prof. Jonathan T. Black from the Aerospace and Ocean Engineering Department, and Prof. Alan Brown from the Aerospace and Ocean Engineering Department for their valuable advices and for serving on my dissertation committee. Special remembrance of Late Prof. Liviu Librescu from the Engineering Science and Mechanics Department and Late Prof. Owen Hughes from the Aerospace and Ocean engineering Department for their great guidance and inspiration. Finally, I would like to thank my wife and my beautiful daughters for their patience, understanding, encouragement, and inspiration throughout this dissertation. V
7 Contents 1. Introduction Overview of Sandwich Panels with Cellular Core Types of Cellular Cores Cellular Core as Part of the Sandwich Panel Mechanical Properties of Cellular Core Buckling of Cellular Core Overview of the Present Work Homogenization of Cellular Core Homogenization Gibson and Ashby Homogenization Technique Hohe and Becker Homogenization Technique Hohe and Becker Results Other Homogenization Techniques Heavy Square Shape Core for Marine Applications Introduction Heavy Square Core for Marine Application Plate Theories Formulation Square Core Model for the Strain Energy Homogenization Process Detailed Finite Element Models...65 VI
8 3.6 Sandwich Panel and Core Properties Geometric Properties Materials, Loads and Boundary Conditions Results Continuum Properties Sandwich Panel Results ESLA Assessment Concluding Remarks Light Cellular Cores for Space Applications Introduction Unit Cell Detailed Finite Element Models Sandwich Panel Finite Element Models Results Continuum Properties Effect of Cell Size Mechanical Properties Accuracy Assessment Assessment of Geometric Parameter Effect: Error Analysis Concluding Remarks Homogenization Model Introduction VII
9 5.2 Partial Homogenization Models Full Homogenization Models Assessment of Literature Homogenization Models Elastic-Plastic Buckling of Cellular Core due to Transverse Compression Introduction Highly Detailed Finite Element Models Linear Buckling Analysis Nonlinear Buckling Analysis Degradation in Mechanical Properties Unit Cell Modeling Concluding Remarks Summary and Conclusions Summary Conclusions Future Work References VIII
10 List of Figures Figure 1-1: ExpaAsym Core Manufacturing Process... 4 Figure 1-2: Sandwich Panel with ExpaAsym Core... 5 Figure 1-3: Truss core Bulk Kagome unit cell... 5 Figure 1-4: Auxetic Triangular Core... 7 Figure 1-5: Auxetic Triangular Core Sandwich Panel... 7 Figure 1-6: Quasi-Kagome Truss Core Unit Cell... 9 Figure 1-7: Sandwich Panel with Quasi-Kagome Truss Core... 9 Figure 2-1: Unit Hexagonal Cell...40 Figure 2-2: Selection of a representative unit cell within a parallelogram...43 Figure 2-3: Beam local coordinate system...43 Figure 2-4: Corrugated Sheets for Hexagonal Honeycomb...49 Figure 2-5: Unit cell chosen by Hohe and adopted here for results reproduction...50 Figure 2-6: Diagonal Normal components of the stiffness matrix...50 Figure 2-7: Off-diagonal coupling components of the stiffness matrix...51 Figure 2-8: Diagonal shear components of the stiffness matrix...51 Figure 2-9: Hexagonal honeycomb unit cell (Nast [50])...53 Figure 2-10: Shi and Tong [52] unit cell for hexagonal honeycomb...55 Figure 3-1: Sandwich panel with square shape core...59 Figure 3-2: Representative volume element of the square core...64 Figure 3-3: Beam representation of the square core cell walls...65 IX
11 Figure 3-4: Square core unit cell detailed finite element model created using ABAQUS...66 Figure 3-5: Detailed model of sandwich panel with square core (Facesheets removed for clarity)...67 Figure 3-6: Geometric Properties of Sandwich Panel with Square Core...68 Figure 3-7: C 1111, C 2222, C 3333 variation with the core relative density...71 Figure 3-8: C 1133, C 2233, C 1313, C 2323 variation with the core relative density 72 Figure 3-9: C 1212 variation with the core relative density...72 Figure 3-10: ABAQUS Results for Transverse Displacement of the Detailed Model...74 Figure 4-1: Core shapes under investigation...80 Figure 4-2: Representative unit cells...82 Figure 4-3: Unit cell models for hexagonal core...82 Figure 4-4: Unit cell models for square core...82 Figure 4-5: Unit cell models for triangular core...83 Figure 4-6: Corrugated sheets leading to core shapes in the current study...84 Figure 4-7: Unit cell coordinate system and cell wall thickness distribution...85 Figure 4-8: Detailed finite element model of sandwich panel with hexagonal core...88 Figure 4-9: Detailed finite element model of sandwich panel with square core...88 Figure 4-10: Detailed finite element model of sandwich panel with triangular core...89 X
12 Figure 4-11: Finite element models for mesh convergence study...91 Figure 4-12: Sandwich panel finite element models with core modeled as a continuum...92 Figure 4-13: Variation of E x with core density for 1/8 cell size...93 Figure 4-14: Variation of E y with core density for 1/8 cell size...94 Figure 4-15: Variation of E z with core density for 1/8 cell size...94 Figure 4-16: Variation of G yz with core density for 1/8 cell size...95 Figure 4-17: Variation of G xz with core density for 1/8 cell size...95 Figure 4-18: Variation of G xy with core density for 1/8 cell size...96 Figure 4-19: Variation of E x with core density for 5/32 cell size...96 Figure 4-20: Variation of E y with core density for 5/32 cell size...97 Figure 4-21: Variation of E z with core density for 5/32 cell size...97 Figure 4-22: Variation of G yz with core density for 5/32 cell size...98 Figure 4-23: Variation of G xz with core density for 5/32 cell size...98 Figure 4-24: Variation of G xy with core density for 5/32 cell size...99 Figure 4-25: Variation of E x with core density for 3/16 cell size...99 Figure 4-26: Variation of E y with core density for 3/16 cell size Figure 4-27: Variation of E z with core density for 3/16 cell size Figure 4-28: Variation of G yz with core density for 3/16 cell size Figure 4-29: Variation of G xz with core density for 3/16 cell size Figure 4-30: Variation of G xy with core density for 3/16 cell size Figure 4-31: Variation of E x with core density for 1/4 cell size Figure 4-32: Variation of E y with core density for 1/4 cell size Figure 4-33: Variation of E z with core density for 1/4 cell size XI
13 Figure 4-34: Variation of G yz with core density for 1/4 cell size Figure 4-35: Variation of G xz with core density for 1/4 cell size Figure 4-36: Variation of G xy with core density for 1/4 cell size Figure 4-37: Variation of E x with core density for 3/8 cell size Figure 4-38: Variation of E y with core density for 3/8 cell size Figure 4-39: Variation of E z with core density for 3/8 cell size Figure 4-40: Variation of G yz with core density for 3/8 cell size Figure 4-41: Variation of G xz with core density for 3/8 cell size Figure 4-42: Variation of G xy with core density for 3/8 cell size Figure 4-43: Variation of mechanical properties with cell size, hexagonal core Figure 4-44: Variation of mechanical properties with cell size, square core Figure 4-45: Variation of mechanical properties with cell size, triangular core Figure 4-46: Error variation with Y/w and t f /t c hexagonal PCOMP 1.0 pcf 120 Figure 4-47: Error variation with Y/w and t f /t c hexagonal CHEXA 1.0 pcf 121 Figure 4-48: Error variation with Y/w and t f /t c hexagonal PCOMP 1.6 pcf 121 Figure 4-49: Error variation with Y/w and t f /t c hexagonal CHEXA 1.6 pcf 122 Figure 4-50: Error variation with Y/w and t f /t c hexagonal PCOMP 2.3 pcf 122 Figure 4-51: Error variation with Y/w and t f /t c hexagonal CHEXA 2.3 pcf 123 Figure 4-52: Error variation with Y/w and t f /t c hexagonal PCOMP 3.0 pcf 123 Figure 4-53: Error variation with Y/w and t f /t c hexagonal CHEXA 3.0 pcf 124 Figure 4-54: Error variation with Y/w and t f /t c square PCOMP 1.0 pcf XII
14 Figure 4-55: Error variation with Y/w and t f /t c square CHEXA 1.0 pcf Figure 4-56: Error variation with Y/w and t f /t c square PCOMP 1.6 pcf Figure 4-57: Error variation with Y/w and t f /t c square CHEXA 1.6 pcf Figure 4-58: Error variation with Y/w and t f /t c square PCOMP 2.3 pcf Figure 4-59: Error variation with Y/w and t f /t c square CHEXA 2.3 pcf Figure 4-60: Error variation with Y/w and t f /t c square PCOMP 3.0 pcf Figure 4-61: Error variation with Y/w and t f /t c square CHEXA 3.0 pcf Figure 4-62: Error variation with Y/w and t f /t c triangular PCOMP 1.0 pcf.128 Figure 4-63: Error variation with Y/w and t f /t c triangular CHEXA 1.0 pcf.129 Figure 4-64: Error variation with Y/w and t f /t c triangular PCOMP 1.6 pcf.129 Figure 4-65: Error variation with Y/w and t f /t c triangular CHEXA 1.6 pcf.130 Figure 4-66: Error variation with Y/w and t f /t c triangular PCOMP 2.3 pcf.130 Figure 4-67: Error variation with Y/w and t f /t c triangular CHEXA 2.3 pcf.131 Figure 4-68: Error variation with Y/w and t f /t c triangular PCOMP 3.0 pcf.131 Figure 4-69: Error variation with Y/w and t f /t c triangular CHEXA 3.0 pcf.132 Figure 5-1: Sandwich panel coordinate system Figure 5-2: Homogenization models assessment, 1/8 Cell, E x /E c Figure 5-3: Homogenization models assessment, 5/32 Cell, E x /E c Figure 5-4: Homogenization models assessment, 3/16 Cell, E x /E c Figure 5-5: Homogenization models assessment, 1/4 Cell, E x /E c Figure 5-6: Homogenization models assessment, 3/8 Cell, E x /E c Figure 5-7: Homogenization models assessment, 1/8 Cell, E y /E c Figure 5-8: Homogenization models assessment, 5/32 Cell, E y /E c Figure 5-9: Homogenization models assessment, 3/16 Cell, E y /E c XIII
15 Figure 5-10: Homogenization models assessment, 1/4 Cell, E y /E c Figure 5-11: Homogenization models assessment, 3/8 Cell, E y /E c Figure 5-12: Homogenization models assessment, 1/8 Cell, E z /E c Figure 5-13: Homogenization models assessment, 5/32 Cell, E z /E c Figure 5-14: Homogenization models assessment, 3/16 Cell, E z /E c Figure 5-15: Homogenization models assessment, 1/4 Cell, E z /E c Figure 5-16: Homogenization models assessment, 3/8 Cell, E z /E c Figure 5-17: Homogenization models assessment, 1/8 Cell, G xz /E c Figure 5-18: Homogenization models assessment, 5/32 Cell, G xz /E c Figure 5-19: Homogenization models assessment, 3/16 Cell, G xz /E c Figure 5-20: Homogenization models assessment, 1/4 Cell, G xz /E c Figure 5-21: Homogenization models assessment, 3/8 Cell, G xz /E c Figure 5-22: Homogenization models assessment, 1/8 Cell, G yz /E c Figure 5-23: Homogenization models assessment, 5/32 Cell, G yz /E c Figure 5-24: Homogenization models assessment, 3/16 Cell, G yz /E c Figure 5-25: Homogenization models assessment, 1/4 Cell, G yz /E c Figure 5-26: Homogenization models assessment, 3/8 Cell, G yz /E c Figure 6-1: Schematic of sandwich panel with an insert (cross section) Figure 6-2: Hexagonal representative unit cell FEMs (0.50" Core Height)160 Figure 6-3: Square representative unit cell FEMs (0.50" Core Height) Figure 6-4: Triangular representative unit cell FEMs (0.50" Core Height) 160 Figure 6-5: Coordinate system for representative unit cells XIV
16 Figure 6-6: 1/4 core height, 1/8 cell size, critical buckling load comparison Figure 6-7: 1/4 core height, 5/32 cell size, critical buckling load comparison Figure 6-8: 1/4 core height, 3/16 cell size, critical buckling load comparison Figure 6-9: 1/4 core height, 1/4 cell size, critical buckling load comparison Figure 6-10: 1/4 core height, 3/8 cell size, critical buckling load comparison Figure 6-11: 1/2 core height, 1/8 cell size, critical buckling load comparison Figure 6-12: 1/2 core height, 5/32 cell size, critical buckling load comparison Figure 6-13: 1/2 core height, 3/16 cell size, critical buckling load comparison Figure 6-14: 1/2 core height, 1/4 cell size, critical buckling load comparison Figure 6-15: 1/2 core height, 3/8 cell size, critical buckling load comparison Figure 6-16: 3/4 core height, 1/8 cell size, critical buckling load comparison Figure 6-17: 3/4 core height, 5/32 cell size, critical buckling load comparison XV
17 Figure 6-18: 3/4 core height, 3/16 cell size, critical buckling load comparison Figure 6-19: 3/4 core height, 1/4 cell size, critical buckling load comparison Figure 6-20: 3/4 core height, 3/8 cell size, critical buckling load comparison Figure 6-21: 1 core height, 1/8 cell size, critical buckling load comparison Figure 6-22: 1 core height, 5/32 cell size, critical buckling load comparison Figure 6-23: 1 core height, 3/16 cell size, critical buckling load comparison Figure 6-24: 1 core height, 1/4 cell size, critical buckling load comparison Figure 6-25: 1 core height, 3/8 cell size, critical buckling load comparison Figure 6-26: Buckling modes shapes for the hexagonal core, 0.5 core height Figure 6-27: Buckling modes shapes for the square core, 0.5 core height 172 Figure 6-28: Buckling modes shapes for the triangular core, 0.5 core height Figure 6-29: Buckling mode shape variation for 1/8 cell size hexagonal core Figure 6-30: Hexagonal Core, Loss in Buckling Capability as Core Height Increase XVI
18 Figure 6-31: Square Core, Loss in Buckling Capability as Core Height Increase Figure 6-32: Triangular Core, Loss in Buckling Capability as Core Height Increase Figure 6-33: Nonlinear buckling for hexagonal core Figure 6-34: Load vs. Z displacement variation for 1/8 cell 3.1 pcf hexagonal core Figure 6-35: Nonlinear buckling for triangular core Figure 6-36: Load vs. Z displacement variation for 1/8 cell 3.1 pcf triangular core Figure 6-37: Nonlinear buckling for square core Figure 6-38: Load vs. Z displacement variation for 1/8 cell 3.1 pcf square core Figure 6-39: Process followed to calculate the degradation in the properties Figure 6-40: Degradation in E z of hexagonal core Figure 6-41: Degradation in E z of triangular core Figure 6-42: Degradation in E z of square core Figure 6-43: Deformed Shape Comparison (2D vs. 3D elements) Figure 6-44: Load vs. Z Displacement Comparison (2D vs. 3D elements) Figure 6-45: Y displacement comparison along the core height Fully Buckled Figure 6-46: Y displacement comparison along the core height Max Load XVII
19 Figure 6-47: Y displacement comparison along the core height Intermediate Figure 6-48: Y displacement comparison along the core height Intermediate XVIII
20 List of Tables Table 3-1: Degrees of freedom per node...63 Table 3-2: Constitutive behavior of continuum equivalent square core...70 Table 3-3: Results for sandwich panel analyses...74 Table 3-4: Results for ESLA model vs. detailed 3D model...75 Table 4-1: List of cellular core cell sizes and densities analyzed...80 Table 4-2: Geometric dimensions for hexagonal core unit cell...85 Table 4-3: Geometric dimensions for square core unit cell...86 Table 4-4: Geometric dimensions for triangular core unit cell...87 Table 4-5: Exact panel sizes for sandwich panels analyzed (X,Y)...89 Table 4-6: Number of elements and nodes for detailed models with hexagonal core...90 Table 4-7: Number of elements and nodes for detailed models with square core...90 Table 4-8: Number of elements and nodes for detailed models with triangular core...90 Table 4-9: Finite element models and results for mesh convergence study models...91 Table 4-10: Factors A & B for Eq. (4.1) Table 4-11: Factors C & D for Eq. (4.1) Table 4-12: Poisson s Ratios Table 4-13: Percentage drop in hexagonal core modulus per 0.1 increase in cell size XIX
21 Table 4-14: Percentage drop in square core modulus per 0.1 increase in cell size Table 4-15: Percentage drop in triangular core modulus per 0.1 increase in cell size Table 4-16: Displacement results comparison for hexagonal core Table 4-17: Displacement results comparison for square core Table 4-18: Displacement results comparison for triangular core Table 4-19: Larger panel sizes analyzed XX
22 Chapter 1 1. Introduction 1.1 Overview of Sandwich Panels with Cellular Core One of the most important requirements in the design process of an aerospace product is the need for a higher stiffness to weight ratio. The capability of an aerospace product whether the product is an aircraft, missile, launch vehicle, or spacecraft is highly dependent on the payload mass capability of the product. This fact brought into the aerospace industry the concept of sandwich panels. Sandwich panels are usually constructed of thin face-sheets and a light thick core. The thin face-sheets in combination with the light thick core provide high bending capability of the panel without the need to add significant amount of material to the panel. Nowadays, with the
23 Chapter 1. Introduction proven capabilities of sandwich panels to increase the stiffness of the component while maintaining high stiffness to weight ratio, other industries such as automotive, marine and sports equipment are also implementing sandwich panels in many applications and are investigating the expansion of that use to many other products. As every product must have specific requirements related to both stiffness and mass as well as testing under a certain set of loads before certification for use, the analysis capability of products employing sandwich panels in their design must provide the correct analyses results and therefore the proper design verification prior to moving forward with the testing and production phases. Even with modern numerical algorithms and ultra-fast computers, the structural analysis of products employing sandwich panels can become very complicated, especially with products employing tens, or hundreds in some cases, of sandwich panels in a single product such as aircraft, spacecraft and launch vehicles. Furthermore, the budget and schedule constraints necessitate the search for efficient methods to analyze the product providing the same or higher quality results. The accurate analyses results are required to confirm that a product meets the specification and is capable of withstanding the loads it will be subjected to during both testing and mission life. Inaccurate analyses and poor assumptions can often lead to failure during testing which may have a significant impact on the product schedule and budget. Additionally, safe testing relies on pre-test analyses predictions. Inaccurate predictions may cause testing to be halted until a better correlation between experimental and 2
24 Chapter 1. Introduction numerical simulations is achieved for stresses, displacements and accelerations during static and dynamic testing to ensure safe testing of the product. With the available finite element analysis software, the need for finding efficient analysis methods relies mostly on the level of understanding of the physics of sandwich panels when subjected to loading. This understanding is highly dependent on the understanding of the panel core behavior and the impact of core design on the overall behavior of the sandwich panels. That said, the understanding of the core mechanical properties is essential in order to analyze the product properly. 1.2 Types of Cellular Cores Different types of cellular cores have been studied by researchers trying to achieve higher overall bending stiffness and stiffness to weight ratios. The most well-known is the hexagonal honeycomb which is extensively being used in the aerospace applications. Identifying alternatives that may provide better properties for certain applications remains an abiding goal for many researchers. This is another area where the analyses capabilities lack and all analytically developed core shapes/types must be verified through testing since analyses capabilities are still limited and the error level in predicting the correct mechanical behavior of sandwich panel core is at a higher level than desirable. Additionally, even for the standard, hexagonal shape, honeycomb core, testing is required when a new change in the design of a 3
25 Chapter 1. Introduction panel is pursued either by changing the thickness of the face-sheets, number of plies and ply layup angles for composite face-sheets. Velea et al. [1 3] studied a novel cellular core namely ExpaAsym (Figure 1-1 and Figure 1-2). The objective of the study was to find an open cell low cost cellular core. The work evaluated, numerically and experimentally, the out-of-plane shear elastic properties of the core [2] and the variation of these elastic properties with geometric parameters of the core. Twenty one geometric cases of the ExpaAsym core were studied varying two geometric parameters. The analytical work was performed using a detailed finite element model of the unit cell and the analytical results for the out-of-plane shear elastic properties showed good agreement with the test data. The in-plane elastic properties of the ExpaAsym were derived [3] analytically by representing a quarter of the unit cell using beam elements and applying Catigliano's second theorem. Varying geometric parameters of the unit cell, the results for the in-plane elastic moduli showed good agreement with the test data. Figure 1-1: ExpaAsym Core Manufacturing Process 4
![Chapter 1. Introduction Figure 1-2: Sandwich Panel with ExpaAsym Core Lee et al. [4] developed a multilayer truss core called Semi-Wire-Woven Bulk Kagome (Figure 1-3).](/docs-images/86/94090989/images/26-0.jpg "The core is fabricated by assembling wires in 3- D.")

26 Chapter 1. Introduction Figure 1-2: Sandwich Panel with ExpaAsym Core Lee et al. [4] developed a multilayer truss core called Semi-Wire-Woven Bulk Kagome (Figure 1-3). The core is fabricated by assembling wires in 3- D. Fiber reinforced composite rods and yarns are helically-formed and screw-inserted in six evenly distributed directions to fabricate the Kagome truss-like structure in which the wires cross one another with minimum deflection. The core was subjected to transverse compression tests. The test results showed, for the same core density, comparable compressive properties to those of traditional Hexagonal honeycomb but the manufacturing process seems to be far more complicated. Figure 1-3: Truss core Bulk Kagome unit cell 5
27 Chapter 1. Introduction Another type of cores is known as the channel core. Channel cores are typically made of corrugated sheets bonded to the face-sheets forming open continuous channels. Seong et al. [5] studied the behavior of sandwich panels with bi-directional channel cores. Panels of the dimensions 30 mm (width) 160 mm (length) 2.9 mm (thickness) with various core pattern angles of 0, 30, 45, 60 and 90 were subjected to three-point bending tests and showed quasi-isotropic behavior similar to that of uni-directional channel core sandwich panels. The use of bi-directional channel cores add a second geometric parameter which provides additional flexibility for optimization of the bending stiffness of the sandwich panel. Michelis and Spitas [6] presented an auxetic, i.e., negative Poisson's ratio, triangular core (Figure 1-4 and Figure 1-5) manufactured using the Directionally Reinforced Single-Yarn (DIRIS) architecture concept of creating directionally reinforced high strength cores. Analytical prediction of the core mechanical properties using finite element model of the sandwich panel with auxetic triangular core was carried out. Results of the analytical prediction were compared to those of three-point and four-point bending test data. The results showed the finite element simulation over-predicting the mechanical properties of the sandwich panel. 6
28 Chapter 1. Introduction Figure 1-4: Auxetic Triangular Core Figure 1-5: Auxetic Triangular Core Sandwich Panel Huber and Klaus [7] presented syntactic foam core that can be implemented in sandwich panels without the use of adhesive layers between the core and face-sheets. The sandwich panel is produced in a single stage 7
29 Chapter 1. Introduction manufacturing process. The syntactic foam consists of an epoxy resin filled cellular glass foam granules. Three-point bending tests were performed on sandwich panels with composite reinforced glass fibers face-sheets and the proposed syntactic foam core. The three-point bending tests showed slightly higher bending stiffness for the traditional sandwich panels implementing adhesive between the core and face-sheets. The researchers attributed this to the increased thickness of the sandwich panel due to the additional adhesive layer. The use of aluminum foam core in sandwich panels was presented by many researchers. Styles et al. [8] studied the aluminum foam core thickness effect on the failure behavior in four-point bending tests. In an effort to predict the failure, an analytical finite element model was developed implementing an earlier constitutive model for the foam core. The analysis and tests were performed for a 5 mm core thickness and 20 mm core thickness panels. The analytical finite element model predicted the general failure behavior/deformation well but the magnitude of the failure load was under-predicted by 25% while the displacement at which failure occured was over-predicted by 60%. The under-prediction of the failure load was attributed to the size effect, ratio of cell size to specimen size, of the foam core as other studies showed this ratio to be of significant impact on the properties of the sandwich panel with a foam core. Lim et al. [9] presented a new idea for manufacturing metallic truss core leading to quasi-kagome truss core (Figure 1-6 and Figure 1-7). The yield and elastic buckling properties of the core, as a homogeneous material, were 8

30 Chapter 1. Introduction estimated using simple mechanics assuming the Kagome to be made of struts connected with ball joints. Failure due to three-point bending was studied through detailed finite element models of the sandwich panel as well as testing. Figure 1-6: Quasi-Kagome Truss Core Unit Cell Figure 1-7: Sandwich Panel with Quasi-Kagome Truss Core Burlayenko, and Sadowski [10] presented the idea of foam-filled hexagonal honeycomb core with three different grades of polyvinyl chloride 9
31 Chapter 1. Introduction (PVC) foam and studied the effect of filling the core with foam on the dynamic characteristics of the sandwich panel. The core out-of-plane properties were estimated using detailed finite element model of a quarter of a cell as the representative unit cell of the core. The study concluded that filling the core with the foam material considered had no impact on the global mode shapes corresponding to linear buckling, free vibration and load-displacement curve from nonlinear buckling of the sandwich panel. However, the natural frequency of the sandwich panel reduces slightly due to the increase in the mass caused by adding the foam while the increase in the stiffness does not have an equivalent impact. Some researchers [11 14] also studied different shapes and combinations of truss like cores, others [15, 17] studied different shapes of foam-like cellular cores while yet others [17] studied cores made of plastic materials. 1.3 Cellular Core as Part of the Sandwich Panel In an effort to understand the behavior of the cellular core when used in a sandwich panel and its impact on the panel's overall behavior, many researchers studied sandwich panels with cellular cores at the panel level and arrived at conclusions related to the behavior of the core within the sandwich panel. This type of study may be helpful for simple problems, however, for complicated systems composed of tens or hundreds of sandwich panels each of which has its own face-sheet configuration, core thickness, core density, and even various core densities within the same panel itself in different 10
32 Chapter 1. Introduction regions, representing the complicated system in an analytical finite element model becomes a far more complicated and expensive endeavor. Giglio et al. [18] adopted a virtual testing concept using finite element simulations to replicate transverse compression tests performed to sandwich panels with Al2024-T3 face-sheets and hexagonal Nomex TM honeycomb core. They concluded that the accuracy of the finite element model is significantly impacted by the size of the representative panel model compared to the tested panel. Biagi and Smith [19] studied sandwich beams with corrugated/channel core subjected to in-plane compression. Both the face-sheets and the core were made of SAE340 stainless steel. The study compared analytical and numerical (finite element simulations) approaches to test data for in-plane compression loading in the direction normal to the corrugation and focused on the different failure modes such as face wrinkling, macro buckling and shear buckling. The results of the work showed consistent over-prediction of the failure load using the analytical and numerical approaches compared to test data with accurate prediction of the failure mode for all cases except for a few exceptions. The reason for the exceptions was attributed to test setup for those cases and sample imperfections such as global curvature. Yang et al. [20] studied the behavior of sandwich panels of Glass-Fiber- Reinforced-Plastic (GFRP) face-sheets and balsa wood core, in addition to different arrangements of foam core, when subjected to blast loading. The study included a total of 50 numerical finite element test simulations to 11
33 Chapter 1. Introduction investigate the global and local blast resistance of the sandwich panels with different core set-ups. The study concluded that the additional foam layers have shown to provide a good protection for both the core and the facesheets by absorbing energy by plastic deformations/crushing. Additionally, the core shear failure starts as a circle of finite radius and spreads towards the center causing the final failure. Sha et al. [21] studied the four-point bending failure of sandwich beams with single and two layers of foam core experimentally and by the means of finite element modeling simulations. The study identified two basic failure modes, indentation which happens on the beam surface and on the foam core adjacent to the inner and outer rollers and is driven by maximum compressive strain and the core shear strain which happens between the inner and outer rollers and is driven by maximum shear strain. The study also concluded that the failure mode of the sandwich plate is dependent on the geometrical parameters of the sandwich panel; namely the face-sheets thickness, the core thickness and the overall sandwich panel thickness. In the case, where indentation is the failure mode, the sandwich panel does have the capability to absorb more energy. Homogenization of stitched foam Core was studied by Lascoup et. al. [22] to achieve final elastic properties of the sandwich panel. The rigidity of the homogenized core is obtained as the sum of the rigidity matrix of the individual components of the unit cell weighted by their volume fractions. The analytical results of four point bending were compared to experimental results and showed a reasonable agreement. 12
34 Chapter 1. Introduction Some researchers [23 25] focused their studies on the dynamic behavior of sandwich panels while others [26, 28] presented homogenization schemes for sandwich panels including the face-sheets in the homogenized properties. Denli and Sun [23] performed optimization of sandwich panels to reduce noise radiation while maintaining minimum weight. The study was performed for sandwich beams with honeycomb and re-entrant cores. Both the core and face-sheets were made of aluminum. The study also achieved an optimized core shape for minimum sound radiation. Mahfuz et al. [24] performed quasi-static and High Strain Rate compression tests for sandwich panels. The sandwich panels had composite face-sheets of 1.9mm thickness and PVC foam core of 12.7mm thickness. Two types of foam were used in the study, regular cross-linked foam and linear foam. The linear foam is a type of foam with a lighter degree of crosslinking. Three core densities of the cross-linked foam were studied, 75, 130 and 300 kg/m 3 while only one core density, 130 kg/m 3, was used for the linear foam. The tests were performed for the sandwich panels at ambient, hot and cold temperatures. The study concluded that the linear foam had a better performance as compared to the cross-linked foam. They also concluded that at higher temperatures, the compressive strength suffers degradation that increases with the increase in the core density. At cold temperatures, however, the compressive strength increases slightly. Hohe and Librescu [25] studied the effect of face-sheet and core anisotropy on the buckling of sandwich panels. Their study included both 13
35 Chapter 1. Introduction flat and curved panels and was performed in the context of a geometrically nonlinear higher-order sandwich panel shell model. The model captures both the local face wrinkling instability and its interaction with global buckling, as well as the geometry and curvature effects. The model was shown to be efficient compared to available test data. Buannic et al. [26] studied the homogenization of sandwich panels with corrugated/channel cores. The core shapes studied were straight walls, curvilinear, hat shape, reference stiffened panel, and triangular shape channels. The homogenization method lead to equivalent Kirchhoff-Love plate model with properties providing good results for in-plane and pure bending problems while less accuracy was seen in problems with transverse shear loading. The authors assumed decoupling of the plate bending and transverse shear behaviors and proposed a Reissner-Mindlin model for calculating the transverse shear properties of the equivalent plate. The authors concluded that the alternate method for calculating the transverse shear properties is good only for sandwich plates with corrugated/channel cores under investigation. Xu and Qiao [27] studied the homogenization of sandwich panels with hexagonal honeycomb. The study introduced an adaptation of the homogenization theory to study periodic plates and extended it to include the transverse shear deformation theory. In order to solve the resulting complicated set of equations with a reasonable approximation, the authors presented the Multi-Pass Homogenization (MPH) technique. The MPH technique is based on the idea that the homogenization of an object may be 14
36 Chapter 1. Introduction processed by its principal axes one by one, i.e., the homogenized results obtained along one axis can be applied in the next pass along another axis. The final solution was presented in closed form for direct calculation of the equivalent properties of the sandwich panel that included both the hexagonal core and face-sheets. The authors recommended the use of the formulas with a set of correction coefficients developed through a finite element study of the sandwich panels. Lebee and Sab [28] applied the Bending-Gradient Plate Theory which was developed by the authors as an extension of the Reissner-Mindlin theory as applied to heterogeneous plates to sandwich panels with a folded core. The authors did not present any results as an application of the theory and did not provide any verification of the proposed homogenization method. Thomsen [29] presented a higher order theory for laminated plates with terminating plies and its application to sandwich panels with CFRP face sheets and honeycomb cores. The theory analyzes sandwich plates of arbitrary N high stiffness layers separated by (N-1) compliant interfaces. Three case studies were considered and the results showed well correlation to test data. Goswami and Becker [30] performed finite element study of unit cell of sandwich panel with honeycomb core to understand the core to face-sheet debonding failure. The model considered 4mm cell walls and 0.05mm cell wall thickness which lead to cell size of 0.27" and relative density of 0.5. The study focused on the application of in-plane loading and the resulting 15
37 Chapter 1. Introduction stress concentration between the core cell walls and the face-sheets leading to debonding and subsequent crack. The study then proceeded with the calculation of the energy release rate to understand the stresses around the crack and made the observation that there are significant amount of stress concentration that develops at the interface of the core and face-sheets. Goswami and Becker then studied the dependence of energy release rate on the cell wall thickness and on core thickness. The study showed that doubling the cell wall thickness leads to almost doubling the energy release rate and a similar effect was noticed for the core thickness. Rothschild et al. [31] studied the nonlinear behavior of foam core within the sandwich panel and presented finite element simulation using core shear properties derived from test data of sandwich panel with foam core. The study aimed to using the test data into finite element modeling performed using FENRIS software in order to obtain good correlation between the finite element model and test data. Material characteristics was taken directly from uniaxial compression and uniaxial tension tests and was applied separately. The finite element model showed good correlation relative to four-point bending test data. Akay and Hanna [32] performed low-energy impact tests on sandwich panels with composite face-sheets and two different types of core, foam core and Nomex honeycomb core and compared the failure behavior between the two configurations. The compressive failure of sandwich panels with graphite face-sheets and three different types of core was studied by Minguet et. al. [33]. The three core types were regular hexagonal honeycomb, Nomex 16
38 Chapter 1. Introduction honeycomb and Rohacell foam. The study included the core thickness impact on the compressive failure of sandwich panels and was found to have a significant effect. Both studies showed that the core thickness, density, and type have a significant impact on the behavior of sandwich panels under compression loading. 1.4 Mechanical Properties of Cellular Core The mechanical behavior of the cellular core plays an important role in the overall structural behavior of the sandwich panel. The variation of the core type as well as geometric parameters can significantly change the behavior of the core and hence the behavior of the sandwich panel. Attempts to determine the mechanical properties of the core have been the focus of many researchers. Some researchers [34 40] focused on the in-plane (panelwise) properties while others [41 47] assumed the in-plane properties to be of low importance and focused on the out-of-plane (panel-wise) properties. Dai and Zhang [34] assessed the capability of the G-A Meso-Mechanics Method and the Homogenization Method in predicting the effect of cell size on the variation of the in-plane moduli of the cellular core and concluded that neither method has that capability as both methods calculate the cellular core moduli on the basis of the cellular core volume fraction (i.e., relative density). Dai and Zhang then developed the Bending Energy Method which assumes that the cellular core to be two dimensional with the cell walls represented as struts assembled together forming a beam. By applying a pure bending load to the beam, the bending strain energy is then calculated as the 17
39 Chapter 1. Introduction summed contribution of all the struts in the beam. Hence, due to the cell periodicity along the beam length, the strain energy calculation is made only over the length of a unit cell and a closed form for the moduli of the unit cell are derived in terms of the cell wall length and thickness. Chen and Ozaki [35] studied the effect of core height on the in-plane modulus of hexagonal core. The study was carried out through finite element analysis employing MSC. Marc finite element software and applying the stiffness approach. The study concluded that the core height effect can not be neglected when estimating the in-plane modulus of regular honeycomb core, that is hexagonal core with all cell walls of the same thickness. The in-plane moduli of the hexagonal honeycomb made of corrugated sheets and the effect of core relative density on the in-plane moduli was studied by Balawi and Abot [36, 37]. The study was performed numerically and experimentally on honeycombs of relative density ranging from commercial low-density to solid construction material and concluded a semilinear variation of in-plane effective moduli with the core density and showed that the effective moduli in the two in-plane directions are not similar as predicted in other studies. The effect of the core height on the inplane stiffness of the honeycomb core was also studied by Becker [38]. Becker developed closed form solutions for the hexagonal core in-plane stiffness matrix coefficients and validated the results using a finite element model of the same unit cell selected for the closed form solution. However, the unit cell selected by Becker [38] is not a repetitive unit cell that would generate the hexagonal core. Karakoc and Freund [39] presented an 18
40 Chapter 1. Introduction experimental method to obtain the in-plane compliance matrices of Nomex honeycomb core. The study performed uni-axial tests at 0, 45, and 90 angles relative to the longitudinal direction of the core and the displacements and forces were measured during the tests. The experiment results were then processed with transformation and least square functions to obtain the inplane elastic parameters of the core. Torquato et al. [40] derived equivalent properties of hexagonal, square, triangular and Voronoi cellular solids by relating the effective Young's modulus and shear modulus of the cellular core with the effective thermal conductivity which is then calculated on the basis of the volume fraction (relative density) of the cellular solid. The result is a macroscopically isotropic set of in-plane properties. Other researchers [41 47] focused on the out-of-plane properties of the cellular core. Qiao et al. [41] presented a multi-objective optimization algorithm for the transverse shear stiffness of sinusoidal shape, tubular and hexagonal shape cellular core employing the homogenization scheme presented by Xu et al. [44] for the transverse shear constants. Pan et al. [42, 43] studied the transverse shear properties of honeycomb and the effect of core thickness on the transverse shear stiffness. The study included an experimental investigation to study the different stages of honeycomb deformation when subject to transverse shear. The experimental study concluded that the honeycomb goes through four stages of deformation. First is the elastic deformation stage which includes bending 19
41 Chapter 1. Introduction and shear deformation of the cell walls. Second is the plastic deformation stage in which wrinkling of the cell walls occur. Third stage is the one in which the fracture of the cell walls occur while in the fourth stage debonding between the core and face-sheets occur. The experimental investigation concluded that the failure mechanism of honeycomb is very complicated and needs further investigation. Pan et al. also performed finite element analysis of unit cell under transverse shear. This finite element study concluded that the bending deformation of the longitudinal cell walls is anti-symmetric along the core height direction and is similar to that of a cantilever beam while the shear deformation of the inclined cell walls includes bending deformation as well as shear deformation. Based on the conclusions from the finite element study, Pan et al. performed a theoretical analysis of the transverse shear stiffness of the honeycomb and derived closed form solution for the transverse shear stiffness of the honeycomb that includes all deformation modes of the cell walls leading to the inclusion of the core height effect in the closed form. Xu et al. [44] presented a 2D homogenization scheme for the calculation of the transverse shear constants of sinusoidal, tubular and hexagonal core shapes. The homogenization scheme is based on a zero-order approximation of a two scale asymptotic expansion. The homogenization scheme ignores the height dimension of the core in the calculation of the transverse shear constants. Xu et al. concluded that their homogenization process corresponds to the lower bound of transverse shear stiffness of sandwich structures. 20
42 Chapter 1. Introduction Meraghni et al. [45] studied the transverse shear stiffness of hexagonal and tubular core. The study assumes all in-plane properties of the core to be zero while the out-of-plane properties are being predicted by expanding the finite element modeling technique of representative unit cells developed by Grediac [46]. The representative unit cells in the finite element model are taken as a portion of unit cell with symmetry considerations. The results of the finite element models were then compared to those of test data and analytic expressions for the transverse shear stiffness. Results for the tubular core showed consistent over-prediction of the transverse shear stiffness by the finite element model and the analytic method. For the hexagonal honeycomb core, the finite element model and the analytic method shows consistent under-prediction of the transverse shear stiffness as compared to the test data. Meraghni also developed an analytical technique to derive the transverse properties of the cellular core by considering the unit cell of the hexagonal honeycomb as two plies in a laminate and applied the classical lamination theory to the two ply laminate to obtain the equivalent transverse properties. The results of this analytical technique will be assessed in Chapter 5 as part of this work. Penzien and Didriksson [47] were the first to derive a closed form solution for predicting the transverse shear stiffness of honeycomb. The analytical approach followed was by selecting a half of unit cell for the analysis and applying a shear force in the longitudinal direction. Starting with the equations of equilibrium and with the assumption of plane stress for the cell walls, the normal and shear stresses were calculated and substituted 21
43 Chapter 1. Introduction in the strain energy expression and a closed form solution for the transverse shear stiffness was calculated. The results were compared to test data and showed agreement within 10%. Multiple attempts were made by researchers to predict the in-plane and out-of-plane of the cellular cores. Gibson and Ashby [48, 49] presented closed-form linear formulas for the calculation of equivalent honeycomb properties to describe all states of stress except for the transverse shear stiffness. The in-plane properties were assumed to be isotropic and were calculated on the basis of representing the cell walls as beams. The in-plane Poisson s ratios were calculated from the formulas to be unity. The out-ofplane modulus was calculated based on the relative density of the material of the cell walls as a function of the core material. Gibson and Ashby concluded that the calculation of the transverse shear properties for exact values is only possible with numerical solutions. The authors then presented formulas for upper and lower bounds of the transverse shear moduli using the theorems of minimum potential energy and that of minimum complimentary energy. Simplified approximate formulas for the properties of the square and triangular cores were presented applying the same principles. In studying the hexagonal honeycomb, Nast [50] followed the same path as Gibson and Ashby [48, 49] for the calculation of the out-of-plane modulus. For the in-plane moduli, Nast used the combination of one longitudinal cell wall and two inclined cell walls as a unit cell and applied forces in the two in-plane directions independently and then used simple 22
44 Chapter 1. Introduction mechanics to derive the in-plane moduli. The boundary conditions did not use symmetry which accounts for the repetitiveness of the unit cell. For the transverse shear modulus, the cell walls were assumed to be presented as thick beams. The resulting properties of the honeycomb showed 1.15 inplane Poisson's ratio and near zero for the other two Poisson's ratios. The inplane moduli are also shown to be very low. These results did not agree with the test results shown by Nast [50] as part of his study. Nast concluded that the reason for the disagreement is due to the manufacturing processes. Masters and Evans [51] divided the deformation of hexagonal unit cell into three parts, flexure, stretching and hinging. Considering the simple force displacement relationship, a stiffness constant was derived for each of the three parts of the deformation and the formulae derived by Gibson and Ashby [48, 49] were rewritten in terms of the flexure, stretching and hinging constants. Masters and Evans concluded that the behavior of the hexagonal core is isotropic in the in-plane directions. Shi and Tong [52] derived a homogenization scheme based on a twoscale method for the homogenization of periodic media and applied it to hexagonal honeycomb. The results for the transverse shear stiffness are identical to those derived by Penzien and Didriksson [47]. For the in-plane properties, the Poisson's ratios derived were equal to unity, the two in-plane moduli were found to be equal indicating an isotropic behavior in the inplane directions. In continuation of their previous work, Gibson and Ashby [48, 49] along with other researchers [53, 54] studied the effects of non- 23
45 Chapter 1. Introduction uniformity in the cell wall arrangements on the mechanical properties of the two-dimensional cellular solids. Hohe and Becker [55 57] developed a homogenization approach based on the fundamental concept that for any volume element containing cellular material, there is an equivalent homogeneous continuum element that has the same strain energy per unit surface area as the cellular structure, provided that both volume elements are subjected to the same loading and boundary conditions. The displacement field for each of the cell walls within the unit cell is assumed to be uniform in the core height direction and hence the cell walls are represented as beams and the Timoshenko beam displacement field is assumed for each of the cell walls. The strain field in each of the cell walls is calculated using the appropriate strain-displacement relations. The stress field is then calculated through Hooke's law in conjunction with the plane stress assumption. The total strain energy is then calculated as the volume integration of the strain energy density and then the stiffness matrix coefficients are calculated by differentiating the sum of the total strain energy of all the cell walls within the volume element containing the representative unit cell. This homogenization approach, being the one of the latest ones developed and covers all stiffness constants of the cellular core, was chosen to be implemented to assess its accuracy within this work. Such an evaluation of this model has not been undertaken earlier. 24
46 Chapter 1. Introduction 1.5 Buckling of Cellular Core Buckling and crushing of cellular core has been of interest to many researchers. This is due to the exceptional energy absorption capability of cellular cores. Many researchers [58 69] have investigated buckling and crushing of cellular cores of types and shapes other than the traditional hexagonal honeycomb core. The in-plane buckling of these cores was studied [58 64] by many researchers while others [65 69] focused on the out-of-plane buckling. Fan et al. [58] studied the in-plane buckling of multiple shapes including the square, Kagome-shape, asterisk-shape (Isogrid), and diamond-shape cores. The buckling analysis performed by Fan et al. depends on the assumption of representing the cell walls as beams. Ohno et al. [59] focused on the buckling of square shape honeycomb when subjected to in-plane biaxial compression. Chung and Waas [60 62] performed experiments on circular shape core under in-plane loading. Papka and Kyriakides [63 65] also focused on circular shape core under in-plane loading and performed experiments as well as analyses to understand the buckling, crushing and collapse of the circular core. Zuhri et al. [66] studied the out-of-plane compressive properties of square and triangular core shapes made of co-mingled flax fiber reinforced polypropylene and polylactide polymers. Zhang and Zhang [67] studied the energy absorption capability of thin plates connected at different angles forming triangular, Kagome and star shapes. The effect of the angle between 25
47 Chapter 1. Introduction the thin plates on the crush resistance of the formed shape was investigated. Liang and Chen [68] presented the triple series solution of the buckling modes for square shape core and derived formulas for the critical compressive skin in the face-sheets of the sandwich structure. Wang and McDowell [69] performed a theoretical study of the Kagome and square cell shapes with relatively high density core to derive initial yield surfaces. Kim and Christensen [70] studied the compressive buckling and shear buckling strength of the triangular, star-cell and hexagonal core shapes and performed tests to verify the developed models. Côté et al. [71] studied the out-of-plane behavior of square cell subject to transverse compression. The square core studied was manufactured of slotted 304 steel sheets. Studying the buckling behavior of the traditional hexagonal honeycomb was performed by multiple researchers [72 86]. Buckling under in-plane loading studies [72 77] included testing as well as theoretical predictions of the behavior of hexagonal core. Hou et al. [72] presented in-plane compression testing of sandwich panels with graded core that is in part traditional hexagonal core and in another is re-entrant core. The compressive buckling and quasi-static edge-wise compression loading tests were performed until the structure reached the state of collapse. The graded core was made of Kevlar woven fabric/419 epoxy prepreg. Hou et al. concluded that the sandwich panels with graded core showed interesting capabilities in terms of flat-wise compression and edge-wise loading compared to existing sandwich panels. 26
48 Chapter 1. Introduction Yang et al. [73, 74] studied the buckling of hexagonal shape core with two imperfections under in-plane loading. The two imperfections considered in the study are the cell wall thickness at the cell walls connection points and the cell wall edge straightness. The study dealt with the cell wall edges as beams representing the cell walls and assumed the honeycomb deformation under in-plane loading to result in a repetitive cell configuration. The theoretical solution developed was proved efficient using finite element modeling but only for the cases where the thickness variation and cell wall curvatures are small. As the cell wall curvature and thickness variation become large, the theoretical solution was inefficient. Karagiozova and Yu [75] analytically identified the plastic deformation modes of hexagonal honeycomb with high cell wall thickness to length ratio. The analytical approach is dependent on the assumption that under biaxial loading, the cell wall edges deform in a rigid manner with hinge rotations at the cell wall to cell wall connections. The deformations under different combination of biaxial loading are then analytically derived based on the geometry of the deformed shape and the dissipated energy is calculated. Karagiozova and Yu concluded that the limit analysis approach used provides a realistic prediction to the deformation modes for hexagonal honeycomb with high cell wall thickness to length ratio. Okumura et al. [76] used the homogenization theory and a symmetric bifurcation condition to analyze the post buckling behavior of elastic honeycomb subject to in-plane biaxial compression. Okumura et al. concluded that the third mode namely Flower-Like mode grows under 27
49 Chapter 1. Introduction macroscopic strain control while the first and second modes namely uniaxial and biaxial mode respectively grow under macroscopic stress control. They also concluded that future work should consider the plasticity and viscoplasticity of cell walls since such inelasticity enhances the possibility of macroscopic as well as microscopic instability under in-plane biaxial loading. The buckling of honeycomb was also studied by Zhang and Ashby [77] who introduced a large deformation theory using the stiffness method to calculate the collapse surface for honeycomb under in-plane biaxial loading. Zhang and Ashby compared their analytical model results to those of Nomex honeycomb testing and concluded that the critical buckling load is highly dependent on the core density while the shape of the collapse surface is highly dependent on the cell geometry and independent of the core density. Many researchers [78 86] studied the out-of-plane behavior of cellular cores. The main objective of these studies was to understand the buckling and crushing capabilities and hence the energy absorption capacity. Nia and Parsapour [78] studies four cell configurations with two subset types for each configurations. The four configurations are the triangular, square, hexagonal and octagonal shapes. The two subset types are a type with inner cell walls connecting the mid-sides of the external cell walls and a type with inner cell walls connecting the corners of the external cell walls. All unit cells were manufactured of Aluminum of 0.1 mm thickness and cell walls were connected together with liquid adhesive. Two samples of each unit cell and subset type were manufactured and all unit cell samples were subjected 28
50 Chapter 1. Introduction to quasi-static out-of-plane loading. Nia and Parsapour also presented finite element simulations of the experiments performed. The finite element simulations were performed using LS-DYNA software. The research concluded that for each configuration, the multi-cell subset types absorbed higher level of energy than the simple configuration with the hexagonal and octagonal multi-cell configurations absorbing the highest amount of energy per unit mass. Zhang et al. [79] also performed out-of-plane compression tests to hexagonal honeycombs made of Aluminum with cell wall thickness of mm. The purposes of the tests were to first understand the effect of the number of unit cells included in the test on the compressive behavior of honeycomb and second to understand the effect of the internal angle on the compressive behavior. For the second aim of the tests, the number of unit cells included in each sample test was the same but the internal angle was varied between the values 60, 90, 120, and 180. Numerical simulations were also performed by Zhang et al. using LS-DYNA software. The study showed that varying the internal angle has insignificant effect (less than 10%) on the compressive behavior and crush strength of the honeycomb. The insignificant effect of the internal angle variation was attributed to the double thickness cell walls. The study also concluded that the boundary effect due to different boundary conditions was found to have important effect on the crush resistance of honeycomb. Based on the numerical simulations performed, Zhang et al. concluded that a Y-shape unit cell can 29
51 Chapter 1. Introduction well represent the honeycomb structure and provide accurate prediction for the crush resistance of hexagonal honeycomb. Asprone et al. [80] studied the compressive response of hexagonal honeycomb made of Nomex paper taking into account two manufacturing imperfections, the thickness of the cell wall and the elastic modulus of the material. The study was performed for honeycomb of core density 48 kg/m 3 (3.0 pcf) and nominal cell size of mm (1/8"). The study was performed experimentally and numerically. The numerical part of the study employed ABAQUS finite element software in combination with a random sampling method of the elements of the mesh to apply the imperfections. Asprone et al. concluded that Nomex honeycomb compressive behavior is more sensitive to thickness imperfections than to Young's modulus variations. Xu et al. [81] performed an experimental study on the out-of-plane compressive response of Aluminum honeycomb made of Al The study included three different core densities and two cell sizes and aimed to understand the effect of specimen dimension, strain rate, core density, and cell size on the compressive response of Aluminum honeycomb. The study derived semi-empirical relations to describe the effect of core density and strain rate on the plateau stress and concluded that the average plateau force has a linear relationship with the specimen size. However, the plateau stress varies with the specimen dimension. Xu et al. recommended that the specimen size to be 9 9 cells for this type of test. The study also concluded that the core density is the main factor with significant effect on the compressive response of honeycomb. Additionally, the study concluded that 30
52 Chapter 1. Introduction under dynamic loading, the stress-strain curves show strong strength enhancements with the increase in the strain rate. Wilbert et al. [82] studied the buckling and progressive crushing of Aluminum honeycomb of relative density, cell size of 9.53 mm (0.375") and core height of 15.9 mm (0.625"). The core was studied within a quasi static experiment using displacement control tests. The study showed that the core shows deformation localized at the center of the core height and core crushes by progressive formation of folds. Numerical simulations of the core behavior were performed employing ABAQUS finite element software to study the effect of mesh, domain size, and geometric imperfections on the buckling and collapse of the core. Wilbert et al. concluded that buckling occurs in the elastic regime of the material at stress levels much lower than the values reported by other researchers. The post buckling response is stable and stiff as expected. The membrane and bending stresses yield the material and the response develops a limit load which represents the compressive strength of the honeycomb. For the particular honeycomb studied, the collapse stress was 67% higher than the buckling stress. Zhang and Ashby [83] studied the different failure modes of honeycomb under out-of-plane compression and transverse shear load. The study was performed analytically and experimentally and defined three main failure modes namely buckling, de-bonding and fractures of the honeycomb. Experiments were performed on Nomex, Aluminum and steel honeycombs. The study concluded that for Nomex core under out-of-plane compression, 31
53 Chapter 1. Introduction two failure modes are identified, first is elastic buckling with two or more folds forming across the cell walls and second is fracture with the stress reaching a maximum and then dropping down to a value less than a third of that maximum and then increasing again. For honeycombs made of Aluminum and steel, plastic yielding dominated the failure for all core densities. For the shear tests, the Nomex honeycomb failure was dominated by buckling for core of relative density < 0.1 while de-bonding dominated for core of relative density > 0.1. A far simpler analytical model for the crushing strength of honeycombs was presented by Wierzbicki [84]. The model was based on energy consideration in conjunction with the minimum principle in plasticity. A formula was derived relating the crush strength of the honeycomb to the cell size, cell wall thickness, and the yield stress of the material. Wierzbicki concluded that the solution presented is more accurate than that presented earlier by McFarland [85]. Jiménez and Triantafyllidis [86] studied the buckling of rectangular and hexagonal core under combined out-of-plane compression and transverse shear loading. The study proposed a theoretical approach to determine the critical loads and Eigenmodes of honeycomb free of imperfections. The theoretical method combines Bloch wave representation theory for the eigenmodes with the analytical solution of the linearized von Kármán plate equations. Jiménez and Triantafyllidis studied the rectangular and hexagonal honeycombs under compressive loading, transverse shear loading and combined compressive and transverse shear and concluded that the buckling 32
54 Chapter 1. Introduction mode is highly dependent on the type of loading as the addition of the transverse shear to the out-of-plane compression loading reduces the critical out-of-plane strain and affects the wavelengths of the critical eigen modes. 1.6 Overview of the Present Work The use of honeycomb panels is increasing rapidly and is propagating into many industries due to the high strength to weight ratio. During the design phase of a product, analyzing the structure to the loads during its life cycle and proving the validity of the structural design is a major milestone. Even with the significant improvement in the computation capabilities of modern computers, modeling in full detail and analyzing honeycomb panels can become extremely expensive especially when tens or hundreds of honeycomb panels are being used in the structure. The key solution to this problem is the homogenization of the honeycomb core. That is finding the mechanical properties of a continuum equivalent to the honeycomb. The homogenization of the honeycomb core enables modeling the honeycomb using a much simplified form and therefore reduces the modeling effort and analyses cost significantly. Another very important task for researchers is to find the core shape that would provide the maximum performance for the sandwich panel. As the use of honeycomb is increasing, the question of 'is there another core shape or core type that can provide the same capability but at lower density?' or 'Can we obtain better performance for the same mass by changing the core shape or type?' is rising and investigations of 33
55 Chapter 1. Introduction different core types and shapes have been carried out by multiple researchers. We have discussed in Section 1.2 the different core types, shapes and manufacturing techniques that have been developed by researchers over the past few decades. Additionally, as discussed in Section 1.4, some researchers developed analytical formulas to calculate the out-of-plane properties and assumed the in-plane properties to be of much less importance and/or equivalent to zero while others focused only on the inplane properties. Others attempted to develop formulas for all constitutive constants of the traditional honeycomb. One of the most recent homogenization schemes developed for cellular core is the strain energy based homogenization scheme developed by Hohe et al. [55 57]. Being one of the most recent homogenization schemes developed to derive all the constitutive constants of cellular cores, this homogenization scheme was chosen for accuracy assessment. Chapter 2 of this dissertation will discuss some of the mostly highlighted work for the calculation of the core properties as well as the details of Hohe's homogenization scheme. A study, funded by the Office of Naval Research, was performed to assess the properties of the high density square shape core for use in marine construction. The purpose of this study was to achieve lighter weight ships and hence better performanc. The accuracy of Hohe's homogenization scheme as applied to this high density cellular core of the square shape will be studied in Chapter 3. 34
56 Chapter 1. Introduction In Chapter 4, the low density cellular cores of hexagonal, square and triangular shapes will be studied. The mechanical properties of the continuum equivalent to each of the three core shapes will be obtained using detailed finite element models of unit cells representing each of the core shapes. Formulas for calculating the mechanical properties as a function of the core density for any cell size in the range 1/8" 3/8" and core density in the range pcf are developed. A detailed comparison between the three core shapes for the different stiffness parameters of the equivalent continuum is then discussed. Finally, the effect of panel size to cell size ratio as well as panel facesheet thickness to core thickness ratio on the accuracy of the continuum model is discussed. In Chapter 5, an assessment of the mostly referenced and extensively used homogenization models in the literature will be assessed for accuracy. The assessment results show that a detailed study of these models need to be performed in order to create a more accurate model for all constitutive properties of the continuum equivalent to the cellular core. With regard to the plastic behavior of cellular cores, all studies performed to date on the buckling of cellular cores focused mainly on the compressive capability and the energy absorption capability of the cellular core. To the best of our knowledge, no previous work has studied the effect of the deformation resulting from buckling under transverse compression loading on the mechanical properties of the continuum equivalent to the core. This problem becomes important in the case of dented panels. When a face-sheet is dented, the core is also buckled and therefore the panel suffers 35
57 Chapter 1. Introduction a local loss of stiffness. The variation of the mechanical properties of the continuum equivalent to the cellular core as the cellular core buckle under transverse compression is studied in Chapter 6. The study shows that the core modulus in the sandwich panel normal direction drop by 80% for all three core shapes. 36
58 Chapter 2 2. Homogenization of Cellular Core 2.1 Homogenization One of the most difficult problems associated with the use of sandwich panels is the analysis of such a type of structure. This is due to the cost associated with the detailed modeling of the cellular core. The solution to this problem has been considered to be 'The Homogenization of the Cellular Core'. Homogenization is simply defining a homogeneous material that possesses the same mechanical properties as those of the cellular core. Once obtained, modeling the cellular core is significantly simplified and an analysis of the entire sandwich structure could be carried out at a significantly lower cost. The problem that arises next is making the
59 Chapter 2. Homogenization of Cellular Core assumptions for this homogenization and the validity of these assumptions in deriving the mechanical properties of the continuum, homogeneous material, which is equivalent to the cellular core. This problem is difficult due to both the complexity of the cellular core and the variation of its stiffness characteristics with the geometric characteristics; namely the shape of the cellular core, the angle between the cell walls, the cell wall thickness, and the cell size. Additionally, as the manufacturing techniques of composite materials improve, the capability of manufacturing cellular cores of composite materials is also significantly improving. This made the homogenization problem even more difficult since composite materials possess some level of uncertainty in the mechanical properties of composites. In this Chapter, a recent homogenization techniques as well as those that have been extensively employed by other researchers will be briefly discussed. These techniques will also be assessed for accuracy in the following chapters. One of the most recent techniques is the Hohe and Becker's homogenization technique which is based on the concept of strain energy equivalence between the cellular core and its equivalent continuum. The assessment of this technique is highly important for the following reasons: a) The technique adopts the assumption of representing the cell walls as beams. This assumption was adopted by many previous researchers that performed simple beam mechanics in order to obtain closed form solutions for the properties of the continuum equivalent to the cellular core, b) This technique is one of the most recent techniques presented in the 38
60 Chapter 2. Homogenization of Cellular Core literature and it has taken into account the contribution of all previous related work, and c) The technique is generalized to be implemented to any core shape and takes into account the calculation of all stiffness constants of the continuum equivalent to the cellular core. 2.2 Gibson and Ashby Homogenization Technique Although the majority of the work performed by Gibson and Ashby [13, 40, 48, 49, 53, 54, 77, 83] was related to the foam core, the homogenization technique presented [49] for cellular core of the hexagonal shape as well as the triangular and square core shapes is considered the corner stone for most of the subsequent attempts to find the mechanical properties of the continuum equivalent to the cellular core. This is due to the assumption of representing the cell walls as beams that was adopted in their work and subsequently followed by many other researchers. Representing the cell walls as beams, the cellular core representation is reduced to the 2-D representation shown in Figure 2-1. When the honeycomb is subjected to stresses in the x or y directions, equilibrium is reached through bending of the beams representing the angled cell walls which has a length of l, thickness of t, and depth of b. With the use of the beam theory, the deflection of the beam is calculated and substituted into the strain formula and hence the Young's modulus in the x and y directions can be calculated using Eq. (2.1). 39
61 Chapter 2. Homogenization of Cellular Core y x l t Figure 2-1: Unit Hexagonal Cell E E E E x c y c t l t l 3 3 cos 1sin 1sin sin cos 3 2 where: E c : The modulus of elasticity of the cellular core material l : Cell wall length t : Cell wall thickness Eq. (2.1) The in-plane Poisson's ratio xy is also calculated using the strains derived from the beam deformation and is found to be 1. The in-plane shear modulus is calculated in a similar manner and the formula in Eq. (2.2) was provided. G E xy c t l 3 1sin 3 cos Eq. (2.2) 40
62 Chapter 2. Homogenization of Cellular Core For the out-of-plane properties of the honeycomb, Gibson and Ashby presented the out-of-plane modulus E z as the honeycomb material modulus E c scaled by the area of the load bearing section which is equivalent to the ratio of the core density divided by the core material density, known as the relative density. The out-of-plane modulus of the continuum equivalent to the core is then calculated using Eq. (2.3). E z V f E Eq. (2.3) c where: V f : The cellular core volume fraction It must be noted that the resulting out-of-plane modulus as derived by Gibson and Ashby excluded the effect of geometry on the out-of-plane modulus, i.e., regardless of the shape of the cellular core, the out-of-plane modulus will be the same for the same relative density. For the transverse shear moduli, Gibson and Ashby concluded that the exact calculations of the transverse shear moduli are possible only using numerical methods while theoretically upper and lower bounds can be obtained using the theorems of minimum potential energy and that of minimum complimentary energy. For the case of G xz, the upper and lower bounds were found to be equivalent which led to an exact formula. The resulting upper and lower bounds for the transverse shear moduli presented by Gibson and Ashby are shown in Eq. (2.4). 41
63 Chapter 2. Homogenization of Cellular Core G G xz c t cos l 1sin 2 1 2sin Gyz t 8 1 sin t l 2(1 sin )cos G c l 3cos Eq. (2.4) The simplified assumptions leading to Eqs. (2.1) (2.4) and advances made in honeycomb core testing as well as numerical methods to analyze these cores were the factors that prompted researchers to attempt finding more accurate analytical solutions for determining the properties of the continuum equivalent material to the honeycomb core. 2.3 Hohe and Becker Homogenization Technique Hohe and Becker [55 57] presented a homogenization procedure based on the strain energy equivalence between two bodies if they both have the same response to the same type of loading, subjected to the same set of boundary conditions and have the same shape with the exception that one of the bodies contains a cellular structure while the second body is a continuum. Hohe and Becker applied this equivalence to honeycomb structures assuming the existence of an equivalent continuum structure. The determination of the stiffness matrix started with the assumption that the deformations in each cell wall of the cellular structure will follow the exact deformation pattern of its edge, i.e., the displacement field is uniform through the depth of the cell wall. The process starts by selecting a representative volume element (unit cell) within a parallelogram as shown in Figure
64 Chapter 2. Homogenization of Cellular Core Figure 2-2: Selection of a representative unit cell within a parallelogram Hohe and Becker then splits up the volume element into individual cell walls connected at the nodal points, in the two dimensional format shown in Figure 2-3. The next step is then calculating the deformation of each cell wall with the assumption that the edge of the cell wall deforms as a beam. v (2)2 v (2)1 2 v (1)1 v (1)2 x 2 1 x 1 Figure 2-3: Beam local coordinate system With each node having 4 degrees of freedom, the three translations and the rotation about the out-of-plane axis (x 3 ) of the beam local coordinate system as shown in Figure 2-3, the total displacement field of each cell wall, represented as beam, is assumed to consist of three parts: x3 43
65 Chapter 2. Homogenization of Cellular Core 44 a) Homogeneously distributed normal deformation in the beam local x 1 -x 3 plane ) ( (1)1 (2)1 1 ) ( (1)1 (2)1 (1)1 ) ( x x u x l v v x u x l v v v x u i I i I i I Eq. (2.5) b) Bending and shear deformation in the x 1 -x 2 plane 0 ) ( ) ( ) ( i II i II i II x u C x C x C x C E ht x u x C E ht l C x C x C E ht x u Eq. (2.6) where: (2) ) (2 (1) ) (4 (1)2 (2) (2) (1) (1)2 (2) l v v l t E h C l v v l t E h C
66 Chapter 2. Homogenization of Cellular Core C t v(2)2v(1)2 2 E h (1) (2) 1 l C4 E ht v(1) t (1 ) Timoshenko theory 2 5 l 0 Euler - Bernoulli theory plane c) Homogeneously distributed transfer shear deformation in the x 1 -x 3 u u u III 1 III 2 III 3 ( x ) i ( x ) i ( x ) i 0 0 v(1)3 v(2)3 l v(1)3 x 1 Eq. (2.7) where E and in Eqs. (2.5) (2.7) are the elastic constants of the cellular core material, l is the cell wall (beam) length, t is the cell wall thickness, h is the cell wall height, and v(i)j is the deformation of the ith node in the beam s jth direction. The total displacement field is given by u = u I i + u II i + u III i. From the displacement field, the strain field of the cell wall can be obtained by partial differentiation. The stress field is then obtained from the strain field via Hooke s law in conjunction with the plane stress assumption in the cell wall. The strain energy of the cell wall is then obtained as the volume integration 45
67 Chapter 2. Homogenization of Cellular Core 46 of the sum of the products of the components of stress and strain. The result of this process lead to the following: ) (1 2 1 ) (1 1 1 ) 2( K K l t K l t K l E ht W Eq. (2.8) where, (2)1 (1) (2)1 (1) T 33 l v l v l v l v K (2) (2)2 (1) (1) (2) (2)2 (1) (1)2 2 T l v l v l v l v K, l v l v l v l v K and K (2)3 (1) (2)3 (1)3 4, (2) (1) (2) (1) 3 T T To determine the nodal deflections, a relation between the stress resultants and the nodal deflections is needed. The stress resultants are
68 Chapter 2. Homogenization of Cellular Core 47 obtained by differentiating the strain energy (Eq. (2.8)) with respect to the nodal deflections. The result is expressed in matrix form as follows: (2) (1) (2) (1) K K K K K K F F v v Eq. (2.9) Where T )1) ( )3, ( )2, ( )1, ( ( ) ( i M i F i F i F i F are the nodal forces T )) ( )3, ( )2, ( )1, ( ( ) ( i i v i v i v i v are the nodal deflections And the stiffness matrices are given as: / / ) ( / ) ( / / ) ( / ) ( t l l l l E h t t l l l l E h t 1 11 K K / )/ ( / ) 1 ( t l l l l E ht K
69 Chapter 2. Homogenization of Cellular Core K E h t 2 0 l (1 ) l / (1 ) / l / l t 4 12 K K E h t 2 l (1 ) l 0 0 l 0 0 T The aforementioned relations provide a linear system of equations, the solution of which in conjunction with periodic boundary conditions applied to the representative volume element, considering homogeneous strain filed, provides the nodal deflections of the entire volume element. The nodal deflections are then used to calculate the strain energy for the individual cell walls using Eq. (2.8). The average strain energy density for the representative volume element is then calculated from the strain energy of the individual cell wall. The effective elasticity tensor is then calculated by means of differentiation of the strain energy density with respect to the strain tensor. 2.4 Hohe and Becker Results The procedure introduced by Hohe and Becker is one of the most recent techniques for obtaining the full constitutive behavior of a continuum equivalent to the cellular structure. For this reason, this homogenization technique was chosen for accuracy assessment. In order to do so, the first step was building a code to reproduce the results presented by Hohe and 48
70 Chapter 2. Homogenization of Cellular Core Becker [56] for hexagonal honeycomb made of corrugated sheets (Figure 2-4). Figure 2-4: Corrugated Sheets for Hexagonal Honeycomb The unit volume for the hexagonal honeycomb was first chosen as shown in Figure 2-5. The results were presented by Hohe and Becker and reproduced here for the hexagonal honeycomb with the honeycomb angle '' varying between 60 and 150. All cell walls are of equivalent length 'l'. The angled cell walls have a cell wall thickness of 't' while the straight cell walls have a thickness of '2t'. An in-house code was developed to understand the method and reproduce the results for the hexagonal honeycomb. The reproduced results for the constitutive behavior of the honeycomb with the honeycomb angle varying between 60 and 150 are shown in Figure 2-6 through Figure 2-8. The results are normalized by the honeycomb material Young's modulus. The results for C 1112, C 2212, C 3312, and C 1122 are not shown since results for these components of the constitutive behavior are zero. 49
71 Chapter 2. Homogenization of Cellular Core x 2 l, 2t l, t l, t x 1 Figure 2-5: Unit cell chosen by Hohe and adopted here for results reproduction C1111 C 1111 C2222 C 1.5 C C [ ] Figure 2-6: Diagonal Normal components of the stiffness matrix 50
72 Chapter 2. Homogenization of Cellular Core C2233 C C1133 C -0.4 C1122 C [ ] Figure 2-7: Off-diagonal coupling components of the stiffness matrix C2323 C 2323 C1313 C 0.6 C1212 C [ ] Figure 2-8: Diagonal shear components of the stiffness matrix 51
73 Chapter 2. Homogenization of Cellular Core For the traditional honeycomb, the honeycomb angle is typically 120. It is worth noting here that the results obtained for the traditional hexagonal honeycomb based on Hohe and Becker homogenization scheme suggest that the traditional hexagonal honeycomb behaves in a transversely isotropic manner. This is evident by the equivalence between C 1111 and C 2222 shown in Figure 2-6 for 120. When the honeycomb angle is 90, the shape of the honeycomb core becomes rectangular. As can be seen above, the results obtained based on Hohe and Becker's homogenization scheme suggests that the rectangular shape has a zero constitutive coefficient in the x 1 direction. Additionally, the off-diagonal coupling components C 1122 and C 1133 are zero which indicate a zero Poisson's ratio for the 1-2 and 1-3 planes ( 12 and 13 ). For honeycomb angle less than 90, the honeycomb becomes the so called 'reentrant core'. The predicted constitutive behavior indicates a very low value for the constitutive coefficient in the x 1 direction while C 1122 and C 1133 have negative values which indicate a negative Poisson's ratio for the 1-2 and 1-3 planes ( 12 and 13 ), the so called auxetic material system. For honeycomb angle 150 < < 120, the constitutive coefficients related to the x 1 direction increase in a linear fashion while those related to the x 2 direction decrease nearly at the same rate. The constitutive coefficient for the x 2 direction approaches near zero for
74 Chapter 2. Homogenization of Cellular Core 2.5 Other Homogenization Techniques Other homogenization techniques that accounted for all elastic constants of the hexagonal honeycomb were developed prior to that of Hohe and Becker are those presented by Nast [50] and Shi and Tong [52]. Nast [50] followed the same path as Gibson and Ashby [48, 49] for the calculation of the out-of-plane modulus. For the in-plane moduli, Nast used simple plate mechanics applied to the unit cell along with the assumption that the straight cell walls remain un-deformed under in-plane loading. For the transverse shear moduli, Nast assumed the cell walls to behave as thick beams. The unit cell assumed by Nast and its dimensions and coordinate system are shown in Figure 2-9. The formulas developed by Nast for the calculation of the mechanical properties of the continuum equivalent to the hexagonal honeycomb are shown in Eq. (2.10). x 1 a, 2t a, t x 2 d a, t Figure 2-9: Hexagonal honeycomb unit cell (Nast [50]) 53
75 Chapter 2. Homogenization of Cellular Core E E E G G G a V f a E c 24 a 3 t (sin 1) 2 cos 1 cos cos t cos Ec (1 sin ) a sin (1 ) 3 t (1 sin ) Ec 2 cos (6.25 6sin ) (1 ) 2t Gc a cos (1 sin ) 10t G 3 c 9 a cos (1 sin ) t cos a sin c 2 2 t (1 sin ) cos 1 cos cos 3 8 c 2 (1 ) c c c Ec 2 (1 ) c c 2 (1 ) c Eq. (2.10) Shi and Tong [52] presented a full model for the constitutive behavior of honeycomb structure using a two scale method. The hexagonal honeycomb unit cell chosen by Shi and Tong is shown in Figure
76 Chapter 2. Homogenization of Cellular Core y 0.5 l, t 0.5 l, t 0.5 l, t l, 2t 0.5 l, t x Figure 2-10: Shi and Tong [52] unit cell for hexagonal honeycomb The out of plane modulus formula presented by Shi and Tong was the same one chosen by Gibson and Ashby [48, 49] and presented by Eq. (2.3). The in-plane moduli for the traditional hexagonal honeycomb in which = 60 was derived using the two scale method and found to be equivalent. The in-plane Poisson's ratios ( xy and yx ) were found to be 1 while zx = zy = 0. All formulas derived by Shi and Tong for the hexagonal honeycomb with the unit cell shown in Figure 2-10 are shown in Eq. (2.11). 55
77 Chapter 2. Homogenization of Cellular Core E E G G G x z xy xy zy zx zy E V f y yx zx 3 E c t l t G 2 l t Gc 3 l t l c E E c c Eq. (2.11) As always, the main objective of the homogenization techniques presented by researchers is to present formulas for easy calculation of the mechanical properties of the continuum equivalent to the cellular structure and hence make the design of sandwich panels easier and cost effective by reducing the number of coupon tests to be performed. Employing these formulas in the analysis of sandwich panels and comparing the results to those of measured data or those from highly detailed finite element models of the sandwich panels represents the appropriate test for the derived formulas, however, such a test has not been performed for any of the homogenization techniques found in literature. 56
78 Chapter 3 3. Heavy Square Shape Core for Marine Applications 3.1 Introduction As the use of the cellular cores is expanding to various industries, the research continues to find the cell shape with properties that meet the performance requirements. A new technique for manufacturing sandwich panels with square core was developed by the Naval Research Laboratory (NRL). The technique leads to manufacturing the sandwich panel with the square core as one component without the use of adhesive to bond the core to the facesheets.
79 Chapter 3. Heavy Square Shape Core for Marine Application The mechanical properties of the continuum equivalent to the square core and the validation of these properties were investigated in detail. First, the homogenization technique developed by Hohe and Becker [55 57] is used to calculate the constitutive behavior of the square core under investigation; the constitutive behavior is then calculated using detailed finite element modeling of the unit cell of the square core. The results from the homogenization technique are then compared to those from the unit cell detailed finite element model. The validity of the properties obtained is then investigated. A detailed finite element model of the sandwich panel with the square core that was modeled in detail was generated and analyzed to an out-of-plane pressure loading while subjected to simply supported boundary conditions. The displacement field of the detailed sandwich panel is used as a reference to evaluate the accuracy of the other simplified models. On the other hand, the constitutive behavior determined for the square core is used to analyze the response of a sandwich panel when subjected to the same loading and boundary condition while using an in-house code. The in-house code analyzed the problem using the Classical Lamination Theory (CLT), First Order Shear Deformation Theory (FSDT) and a Higher Order Shear Deformation Theory (HSDT). Additionally, a simple shell finite element model was created for the sandwich panel while using the homogenized core properties. The displacement field from the FSDT, HSDT and the simplified finite element model are then compared to the reference displacement field obtained from the detailed finite element model. 58

80 Chapter 3. Heavy Square Shape Core for Marine Application 3.2 Heavy Square Core for Marine Application The problem to be treated in this chapter is the assessment of the square shape for marine applications. The core to be studied in this part of the study is manufactured with the facesheets using a manufacturing process that leads to one sandwich structure with the facesheets and the core without the use of an adhesive. The Square core cell walls are all of the same thickness and length. A schematic of the sandwich panel to be studied in this chapter is shown in Figure 3-1. Figure 3-1: Sandwich panel with square shape core The study starts with the assessment of the constitutive behavior of the continuum equivalent to the square shape core using Hohe and Becker s [55 57] strain energy based homogenization technique. The assessment of 59
81 Chapter 3. Heavy Square Shape Core for Marine Application the constitutive behavior of the square core will then be performed by applying the flexibility approach to a detailed finite element model of the square core unit cell. The constitutive behavior obtained for the continuum equivalent to the square core will then be used in an in-house code to analyze a sandwich panel with the square core implementing the CLT, FSDT and HSDT. Additionally, the constitutive behavior will be used in a simplified finite element model of the sandwich panel using shell elements. All panels will be analyzed for the case of a uniform pressure applied at the bottom facesheet while all edges being simply. The displacement field of the sandwich panel will be recovered and compared to that obtained from a highly detailed finite element model of the sandwich panel in which the square core and the facesheets are all modeled individually. The work presented herein provides an initial assessment of the accuracy of the strain energy based homogenization approach as applied to heavy square shape core. Additionally, the variation of the constitutive behavior of the continuum equivalent to the square core with the relative density of the core is revealed and formulae for a direct calculation of the square core equivalent continuum constitutive behavior are presented. 3.3 Plate Theories Formulation The HSDT theory being applied in the analysis of sandwich panels with square core herein is adopted from the work performed by Ganapathi et al. [87 88]. The displacement field in the most general case takes the form shown in Eq. (3.1). 60
82 Chapter 3. Heavy Square Shape Core for Marine Application 61 ), ( ), ( ), ( ),, ( ), ( ), ( ), ( ), ( ), ( ),, ( ), ( ), ( ), ( ), ( ), ( ),, ( y x z y x z w y x w z y x w y x S y x z y x z y x z y x v z y x v y x S y x z y x z y x z y x u z y x u o y k y y y o x k x x x o Eq. (3.1) where: x and y are the in-plane coordinates of the laminate, z is the coordinate through the thickness of the laminate, u 0, v 0 and w 0 are the displacements of a generic point on the midplane, x, and y are the rotations of the midplane normal about the y and x axes respectively, w 1,, x, y, x, and y are the higher order terms in the Taylor series expansion used only for application of the HSDT, x, y are the generalized variables associated with the zigzag function S k. And the zigzag function is defined by S k = 2 (-1) k z k /h k, where z k is the local transverse coordinate with its origin at the center of the k th layer and h k is the corresponding layer thickness.
83 Chapter 3. Heavy Square Shape Core for Marine Application In the CLT [89], the normal to the midplane before deformations is assumed to remain straight and normal to the midplane after deformation. This assumption leads to the following: x y w x w y w1 0 x y x y x y Eq. (3.2) In the FSDT [89], it is assumed that the normal to the midplane before deformation remains straight but not necessarily normal to the midplane after deformation. This assumption leads to the following: w x y x y 1 x y x y x y 0 Eq. (3.3) In the HSDT [88], the in-plane displacements u and v are assumed to have a cubic distribution and therefore, Eq. (3.1) represents the displacement field. In these equations, the functions w 1,, x, y, x, and y are higher order terms in the Taylor series expansion. The in-house code, which solves the plate models by applying CLPT, FSDT and HSDT, implements an eight-node serendipity quadrilateral plate 62
84 Chapter 3. Heavy Square Shape Core for Marine Application element for all the FEM analysis. The number of the degrees of freedom per node used in the CLPT and FSDT element was five while in the HSDT element, the number of degrees of freedom per node was thirteen. Table 3-1 lists the degrees of freedom for each of these elements. THEORY CLT FSDT HSDT Table 3-1: Degrees of freedom per node DEGREES OF FREEDOM u o, v o, w o, x, y u o, v o, w o, x, y u o, v o, w o, x, y, w 1,, x, y, x, y, x, y 3.4 Square Core Model for the Strain Energy Homogenization Process The homogenization procedure using strain energy equivalence approach developed by Hohe and Becker [55 57] is adopted to derive the constitutive behavior of the continuum equivalent to the square core under investigation. The approach is based on the fundamental concept that for any volume element containing cellular material, there is an equivalent homogeneous continuum element that has the same strain energy per unit surface area as the cellular structure provided that both volume elements are subject to the same loading and boundary conditions. 63
85 Chapter 3. Heavy Square Shape Core for Marine Application a a Figure 3-2: Representative volume element of the square core Figure 3-2 shows the selected volume element representing the square core. The representative volume element of the square core contains 4 cell walls. The displacement field for each of the cell walls is assumed to be uniform in the direction normal to the plane of Figure 3-2. A Timoshenko beam displacement field is assumed for the cell wall edges shown in Figure 3-2. Figure 3-3 shows the details of breaking up the element into cell walls and the displacement field in the 2D plane of the square core. The strain field in each cell wall is calculated using the appropriate strain-displacement relations. The stress field is then calculated from the strain field by means of Hooke s law in conjunction with the plane stress assumption in the cell walls. The total strain energy of each cell wall is then calculated as the volume integration of the strain energy density. The coefficients of the stiffness matrix C ijkl are then calculated by differentiating the sum of the total strain energy of all the cell walls in the volume element using Eq. (3.4). 64
86 Chapter 3. Heavy Square Shape Core for Marine Application C ijkl 2 W ij kl Eq. (3.4) Where W is the sum of the total strain energy of all the cell walls in the volume element. v(4)2 v(4) v(1)1 v(1)2 v(5)1 v(5)2 v(5)2 v(5)2 v(5)1 v(5)1 v(5)2 v(5)1 v(3)2 v(3)1 2 v(2)1 v(2)2 Figure 3-3: Beam representation of the square core cell walls 3.5 Detailed Finite Element Models For the purpose of verifying the results, detailed finite element models are created using ABAQUS. The results from the detailed finite element models are used as the reference set of results. First a detailed finite element model of the square core unit cell is created. This model was built in order to calculate the constitutive behavior of the continuum equivalent to the square core. The flexibility approach is applied to the unit cell detailed finite element model and the constitutive behavior was calculated. The results 65

87 Chapter 3. Heavy Square Shape Core for Marine Application from the unit cell finite element model are used as a reference for verifying the results obtained from the application of the strain energy based homogenization approach. Figure 3-4 shows the detailed finite element model created for the square core unit cell. Figure 3-4: Square core unit cell detailed finite element model created using ABAQUS The second detailed finite element model created in ABAQUS was a highly detailed model of the sandwich panel with the square core. In this model, the core is explicitly modeled using shell elements. Figure 3-5 shows the detailed model with the facesheets hidden to show the highly detailed modeling of the core. The ABAQUS 2D shell elements used in this detailed model are of type S4R5. 66
 For complicated systems that contain tens or hundreds of")

88 Chapter 3. Heavy Square Shape Core for Marine Application Figure 3-5: Detailed model of sandwich panel with square core (Facesheets removed for clarity) For complicated systems that contain tens or hundreds of sandwich panels with cellular core, modeling the sandwich panels and the cellular core in detail will become very expensive. This is due to the time needed in order to create these models in addition to the significant increase in computation time. In order to decrease the cost associated with the analysis of complicated systems, the Equivalent Single Layer Approach (ESLA) is typically followed to model the complicated systems. The ESLA is simply modeling the entire sandwich panel using shell elements with laminate properties in which the facesheets will be presented as two layers separated by one homogenous layer representing the cellular core. In addition to the detailed finite element models created for the unit cell of the square core and the sandwich panel with the square core, a simplified finite element model was created for the sandwich panel using the ESLA. In this approach, the sandwich panel is modeled using shell elements of the type S4R5 in which a laminate property is used representing the facesheets and core layers. This model was created in order to assess the accuracy of this modeling technique using ABAQUS. 67
89 Chapter 3. Heavy Square Shape Core for Marine Application 3.6 Sandwich Panel and Core Properties Geometric Properties The sandwich panel analyzed has equivalent dimensions in the in-plane x and y directions with L = 7.87 (200 mm) length and width. The overall thickness of the sandwich panel is 0.39 (10 mm). Each of the facesheets has a thickness of (2 mm) while the core thickness is (8 mm). The square core cell dimensions are (6 mm 6 mm). The cell wall thickness is modeled to the desired relative density. For the analysis of the unit cell equivalent continuum constitutive behavior as well as the analysis of the sandwich panel performed using the in-house code, the relative density of the core was 20% leading to cell wall thickness of (0.8 mm). All geometric parameters are schematically shown in Fig 3-6. For the purpose of assessing the ESLA in ABAQUS, two additional core relative densities were studied. The additional core relative densities were 10% and 15% leading to cell wall thickness of (0.15 mm) and (0.225 mm). 8 mm. 2 mm. 0.8 mm. Core 8 mm. 2 mm. Square Honeycomb Figure 3-6: Geometric Properties of Sandwich Panel with Square Core 68
90 Chapter 3. Heavy Square Shape Core for Marine Application Materials, Loads and Boundary Conditions Both facesheets and the core are made of Aluminum with Young s modulus of 10 6 psi (69 GPa) and Poisson s ratio of The analysis was performed for all sandwich panels while subjected to uniform pressure of 145 psi (1 MPa) applied to the bottom side of the sandwich panel and simply supported boundary condition applied to all four edges. The formulation of the simply supported boundary condition is shown in x L / 2, y L / 2, v 0, u 0, w0, 0 w0, 0 y x Eq. (3.5) 3.7 Results Continuum Properties The constitutive behavior of the continuum equivalent to the square core was obtained by applying the flexibility approach to the unit cell detailed finite element model and by applying the strain energy based homogenization technique presented earlier by Hohe and Becker [55 57] and summarized for the square core in Section 3.4. The results from both methods for the square core with relative density of 20% are listed in Table 3-2. The results in Table 3-2 show that the strain energy based homogenization approach provides a very good approximation for the constitutive behavior of the continuum equivalent to the square core under investigation. 69
91 Chapter 3. Heavy Square Shape Core for Marine Application Table 3-2: Constitutive behavior of continuum equivalent square core C ijkl Flexibility Strain energy Error approach (ksi) approach (ksi) C % C % C % C % C % C % C % C % C % Studying the constitutive behavior of the square core shows that the properties reflect the behavior of a transversely isotropic material. This is well reflected in the equivalence between C 1111 and C 2222 and the equivalence between C 1313 and C Another important observation on the constitutive behavior is C 1122 being equivalent to zero. This finding leads to the conclusion that the in-plane Poisson s ratio 12 is equivalent to zero. In an effort to ease the finding of the properties of the continuum equivalent to the square core, the coefficients C ijkl were calculated for the range of relative density between 10 50%. The values for each of the C ijkl normalized by Young s modulus of the core material E c were plotted vs. the relative density, the plots shows linear variation for all C ijkl except for C Fig. 3-7 through Fig. 3-9 shows these plots while Eq. (3.6) represents the corresponding formulae to obtain the coefficients C ijkl. 70
92 Chapter 3. Heavy Square Shape Core for Marine Application C E iiii c C E C E 3333 c 1133 c C E 1313 c C E 1212 c 0.533, i 1, C E 2233 c C E 2323 c r r r r r Eq. (3.6) Where r is the relative density of the core C1111, C2222 C C ijkl / E c r Figure 3-7: C 1111, C 2222, C 3333 variation with the core relative density 71
93 Chapter 3. Heavy Square Shape Core for Marine Application C1133, C2233 C1313, C C ijkl / E c r Figure 3-8: C 1133, C 2233, C 1313, C 2323 variation with the core relative density C C ijkl / E c r Figure 3-9: C 1212 variation with the core relative density 72
94 Chapter 3. Heavy Square Shape Core for Marine Application Sandwich Panel Results The sandwich structure with square honeycomb core was studied. The panel dimensions are with the thickness of face sheets taken to be each and the core thickness is The panel is subject to an out of plane pressure of 145 psi and simply supported boundary conditions at all 4 sides. The properties of the continuum equivalent to the square core obtained using the strain energy based homogenization approach were incorporated into an in-house code that solves sandwich panel problems using the finite element approach applied to the different plate theories, CLPT, FSDT and HSDT. The results for the displacement field of the sandwich panel are then obtained. A detailed finite element model for the sandwich panel was also created using ABAQUS, the dimensions, loads and boundary conditions are same as those used in the aforementioned finite element analysis. In this model, the cell walls of the square honeycomb were modeled using shell elements. The shell elements used in the ABAQUS model were element of type S4R5. The displacement field obtained from this model was then used as a bench mark to the displacement obtained from the in-house code. This comparison shows that the HSDT is in error of 7.6% with respect to the ABAQUS results while FSDT is in error of 15% and CLPT is in error of 15.5% with respect to the ABAQUS detailed model. The transverse displacement results from the detailed ABAQUS model are used as a benchmark for the validity of the ESL models and are shown in Fig


95 Chapter 3. Heavy Square Shape Core for Marine Application Figure 3-10: ABAQUS Results for Transverse Displacement of the Detailed Model An ESLA model of the sandwich panel with continuum layer for the square core employing the properties of the square core obtained using the strain energy approach was created in ABAQUS in order to evaluate the ESLA approach in the analysis of this problem. The displacement field obtained from this model was then compared to the displacement field obtained from the ABAQUS detailed model and the comparison shows that the ESL model results are in error of 6.1% with respect to the ABAQUS detailed model. Table 3-3 lists the values of the transverse displacement at the center point of the sandwich panel for all analysis techniques studied. ABAQUS Detailed model S4R5 Table 3-3: Results for sandwich panel analyses ABAQUS ESLA Model S4R5 Equivalent Plate Theory CLPT FSDT HSDT
96 Chapter 3. Heavy Square Shape Core for Marine Application ESLA Assessment In order to understand the effect of reducing the model down to the Equivalent Single Layer Approach (ESLA) on the displacement results of the sandwich panel subjected to uniform pressure and simply supported edges, another comparison was carried out between the displacement field obtained using the ESLA model and that obtained using the highly detailed finite element model for core relative densities 10%, 15%, 20% at (0.5 L, 0.5 L) and at (0.25 L, 0.25 L). The results for this study are listed in Table 3-4 and show that the error decreases with the decrease in the relative density. Table 3-4: Results for ESLA model vs. detailed 3D model r 10% 15% 20% Location 3D Model 2D Model (ESLA) Error (0.5L,0.5L) % (0.25L, 0.25L) % (0.5L,0.5L) % (0.25L, 0.25L) % (0.5L,0.5L) % (0.25L, 0.25L) % 3.7 Concluding Remarks To investigate the accuracy of the strain energy based homogenization approach followed to obtain the properties of the continuum equivalent to the square core, a detailed ABAQUS model was created for the unit cell of the square core. The properties were then obtained using the flexibility approach applied to the representative unit cell finite element model. The results show a very good agreement between the strain energy based 75
97 Chapter 3. Heavy Square Shape Core for Marine Application homogenization approach and the flexibility approach applied to the finite element model of the unit cell of the square honeycomb. Results of the properties also showed that the square core behaves identical to a transversely isotropic material and all stiffness coefficients vary linearly with the relative density except for the in-plane shear coefficient. Additionally, the results led to the conclusion that square shape core have a zero in-plane Poisson s ratio. To ease the calculation of the constitutive behavior of the continuum equivalent to the square core, formulae were derived based on the constitutive behavior variation with the core relative density for relative density in the range 10 50%. The static analysis of sandwich panels with isotropic facesheets and square core was studied. The properties of the continuum equivalent to the square core were obtained using a strain energy based homogenization approach. These properties were then incorporated into an in-house code that solves sandwich panel problems using the finite element method in conjunction with the different plate theories CLPT, FSDT and HSDT to obtain the displacement field for sandwich plates. For verification of the results, a highly detailed ABAQUS model was created for the sandwich panel with square core. In this model, the square cell walls were modeled using shell elements. In both cases, the sandwich panel considered was , subject to an out of plane uniform pressure applied to the bottom surface and simply supported boundary conditions at all four sides of the panel. The comparison between the results for the transverse 76
98 Chapter 3. Heavy Square Shape Core for Marine Application displacement at the center point of the sandwich panel shows that HSDT results are in error of 7.6% compared to the ABAQUS results while CLPT is in error of 15.5% and FSDT is in error of 15%. An ESLA model of the sandwich panel with continuum core possessing the properties of the square core obtained using the strain energy based homogenization approach was created in ABAQUS in order to verify the validity of using ESLA approach in the analysis of this type of sandwich panels. The ESLA sandwich panel model has the same dimensions and subject to the same loading and boundary condition was analyzed and the displacement field was obtained. Comparison between the displacement results from the ESLA model and the highly detailed model showed that the ESLA model is in error of 6.1% with respect to the detailed model. A further investigation of the accuracy of the ESLA model compared to the highly detailed model was carried out by comparing the displacement field obtained using both approaches for core relative densities of 10%, 15% and 20%. The results show that the error decreases with a decrease in the core relative density. 77
99 Chapter 4 4. Light Cellular Cores for Space Applications 4.1 Introduction Honeycomb panels have been a primary structural component in most applications in space exploration since the 1960 s and continue to be as such due to their high stiffness to weight ratio. However, researchers are still searching for the appropriate method to calculate the properties of a continuum that could be considered equivalent to the honeycomb core in order to reduce the analysis cost while maintaining the desired level of accuracy. Furthermore, changes in the cell size, core density and core height remain to be the primary variables affecting the properties of the equivalent
100 Chapter 4. Light Cellular Cores for Space Applications continuum. With different geometric parameters leading to many different commercial honeycomb cores, the problem becomes even more difficult. As the availability of many commercial honeycomb cores help optimize the structure for stiffness and mass requirements, analyzing a complicated structure composed of many honeycomb panels containing different honeycomb cores becomes a very costly task unless a good approximation of the mechanical properties of the continuum equivalent to the honeycomb core is available. Such a good approximation has been the focus of many researchers in the past as was laid out in the Section 1.4 of Chapter 1. While finding an appropriate method to determine the mechanical properties of the continuum equivalent to the honeycomb core is a challenging problem, the search for alternate geometries to the honeycomb shape is also ongoing to find the cellular core with the highest stiffness to weight ratio. Of the different cell shapes being considered, the ones looking promising to provide competitive properties to those of the traditional honeycomb (hexagonal shape) core are the square and triangular shapes. In this part of the research, analysis of the mechanical properties of the continuum equivalent to the hexagonal, square and triangular type structures (Figure 4-1) is performed. The aim of this part of the study is to develop formulas to calculate the mechanical properties of the cellular cores of any cell size between 0.125" and 0.375" for core densities ranging between 1.0 pcf and 8.1 pcf. A full list of the cell sizes and core densities analyzed is provided in Table 4-1. Next, a stiffness comparison between the three core shapes for the same core density and cell size is developed. The equivalent 79
101 Chapter 4. Light Cellular Cores for Space Applications mechanical properties of the core structures is calculated employing detailed finite element models of representative unit cells and applying the displacement approach. Triangular Core Hexagonal Core Square Core Figure 4-1: Core shapes under investigation Table 4-1: List of cellular core cell sizes and densities analyzed Cell Size w [inch] Core Densities [pcf] 1/8 3.1, 4.5, 6.1, 8.1 5/32 2.6, 3.8, 5.3, 6.9 3/16 2.0, 3.1, 4.4, 5.7 1/4 1.6, 2.3, 3.4, 4.3, 5.2 3/8 1.0, 1.6, 2.3, 3.0 The verification of the mechanical properties calculated using unit cell detailed finite element models is then performed via the analysis of sandwich panels with the cellular cores. This is done by incorporating the mechanical properties of the continuum equivalent to the cellular cores of different sizes and core densities into finite element models using two different techniques: a) NASTRAN PCOMP (laminate) elements with the core modeled using MAT8 material card, and b) NASTRAN shell elements 80
102 Chapter 4. Light Cellular Cores for Space Applications for the facesheet and solid CHEXA elements for the core with the core modeled using MAT9 material card. The analysis results of these models are then compared to those of highly detailed finite element models of the sandwich panels with the cellular cores finely modeled. This study provides an accuracy assessment of the mechanical properties calculated from the unit cell finite element models. When reviewing analytical models in the literature, it is found that one of the main assumptions made by researchers is that the panel size is much greater than the cell size. This assumption is tested herein by performing error analysis aiming to understand the effect of panel size to cell size ratio on the accuracy of representing the core as a continuum. Additionally, the effect of facesheet thickness to core thickness ratio on the accuracy of representing the core as a continuum is investigated. 4.2 Unit Cell Detailed Finite Element Models Detailed finite element models were created for representative unit cells for the three core shapes, hexagonal, square and triangular. The unit cells were chosen to include at least one full cell of the cellular structure in addition to half-length cell walls, in the case of hexagonal and square cores, to ensure that repetitive construction of the unit cell would lead to the cellular structure to be analyzed. The chosen unit cells for the three core shapes are shown in Figure


103 Chapter 4. Light Cellular Cores for Space Applications Triangular Core Hexagonal Core Square Core Figure 4-2: Representative unit cells The detailed finite element models were created for all cell sizes and core densities listed in Table 4-1. Cell Size = 1/8 inch Cell Size = 5/32 inch Cell Size = 3/16 inch Cell Size = 1/4 inch Cell Size = 3/8 inch Figure 4-3: Unit cell models for hexagonal core Cell Size = 1/8 inch Cell Size = 5/32 inch Cell Size = 3/16 inch Cell Size = 1/4 inch Cell Size = 3/8 inch Figure 4-4: Unit cell models for square core 82


104 Chapter 4. Light Cellular Cores for Space Applications Cell Size = 1/8 inch Cell Size = 5/32 inch Cell Size = 3/16 inch Cell Size = 1/4 inch Cell Size = 3/8 inch Figure 4-5: Unit cell models for triangular core All finite element models were created for core height of 0.5 and are shown in Figure 4-3 for hexagonal core, Figure 4-4 for square core and Figure 4-5 for triangular core. The finite element models shown in the figures are for lowest core density of the respective cell size per Table 4-1. Finite element models for all other core densities are created based on these models by changing the cell wall thickness to achieve the desired core density. 83
105 Chapter 4. Light Cellular Cores for Space Applications Hexagonal Core w 120 Square Core w Triangular Core w Figure 4-6: Corrugated sheets leading to core shapes in the current study In the finite element models of the hexagonal and square representative unit cells, the thickness of the half-length cell walls is twice that of the remaining cell walls of the unit cell. This is due to the corrugated sheet based technology (Figure 4-6) used to manufacture these types of cellular cores. For the full cellular structure of these cores, all cell walls in the direction parallel to x direction (Figure 4-7) have twice the thickness than that of the remaining cell walls. However, for the unit cells, the cell walls parallel to x direction, except for the half cell walls, do not have twice the thickness since the repetition of the unit cell to form the full cellular 84
106 Chapter 4. Light Cellular Cores for Space Applications structure would then result in the double thickness. Figure 4-7 shows the unit cell coordinate system and geometry for all three core shapes. For the triangular core, no cell walls would be of double the thickness (Figure 4-6) as a result of implementing the corrugated sheet technology in manufacturing this core. L L L l, t l, t l/2, 2t a 0 y x w l, t l/2, 2t b l/2, 2t l/2, t l/2, t w l, t l/2, t l/2, t l/2, 2t w l/2, t/2 l/2, t/2 60 l, t l/2, t/2 l/2, t/2 Figure 4-7: Unit cell coordinate system and cell wall thickness distribution The cellular cores are assumed to be made of Aluminum The dimensions of the unit cell wall lengths and thicknesses for the different cell sizes and core densities listed in Table 4-1 and studied here are listed in Table 4-2 for the hexagonal core, Table 4-3 for the square core, and Table 4-4 for the triangular core. For each cell size/ core density/ cell wall thickness, a unit cell finite element model was generated in order to assess the mechanical properties of the continuum equivalent to the particular unit cell. This led to a total of 21 finite element models for each core shape. Table 4-2: Geometric dimensions for hexagonal core unit cell Cell Size Core Density Wall Length Wall Thickness 'w'[inch] '' [pcf] 'l' [inch] 't' [inch] 1/8 5/
107 Chapter 4. Light Cellular Cores for Space Applications 3/16 1/4 3/ Table 4-3: Geometric dimensions for square core unit cell Cell Size Core Density Wall Length Wall Thickness 'w'[inch] '' [pcf] 'l' [inch] 't' [inch] 1/8 5/32 3/16 1/4 3/
108 Chapter 4. Light Cellular Cores for Space Applications Table 4-4: Geometric dimensions for triangular core unit cell Cell Size Core Density Wall Length Wall Thickness 'w'[inch] '' [pcf] 'l' [inch] 't' [inch] 1/8 5/32 3/16 1/4 3/ Sandwich Panel Finite Element Models The same verification technique used in Chapter 3 for the heavy square core will be used here again for the verification of the mechanical properties of the continuum equivalent to the cellular cores being studied. Detailed finite element models of sandwich panels with the cellular core were created. There are five main configurations of the sandwich panel for each core shape. Each configuration covers a cell size of those listed in Table

109 Chapter 4. Light Cellular Cores for Space Applications Twenty one finite element models are then created for each core shape to cover all core densities listed in Table 4-1. For each cell size, the different sandwich panel finite element models for different core densities are based on the main configuration for the cell size while applying the appropriate cell wall thickness as those given in Table 4-2, Table 4-3, and Table 4-4 for the hexagonal core, the square core, and triangular core respectively. Figure 4-8: Detailed finite element model of sandwich panel with hexagonal core Figure 4-9: Detailed finite element model of sandwich panel with square core 88
110 Chapter 4. Light Cellular Cores for Space Applications Figure 4-10: Detailed finite element model of sandwich panel with triangular core The panels analyzed were approximately size. The detailed models of sandwich panels maintained either a full or half-cell at all edges. The exact sizes of the panels are listed in Table 4-5. All sandwich panels have Aluminum 5056 facesheets of thickness and Aluminum 5052 core of 0.5 height (sandwich panel thickness). The detailed finite element models for sandwich panels with the hexagonal, square and triangular cores are shown in Figure 4-8, Figure 4-9, and Figure 4-10 respectively. The finite element models shown are for the sandwich panels with 1/8 cell size cellular core. Table 4-5: Exact panel sizes for sandwich panels analyzed (X,Y) Cell Size 'w' Hexagonal Square Triangular 1/ , , , / , , , / , , , / , , , / , , ,
111 Chapter 4. Light Cellular Cores for Space Applications The number of elements and nodes in each of the finite element models of the main five configurations are listed in Table 4-6 for the hexagonal core sandwich panels, Table 4-7 for the square core sandwich panels, and Table 4-8 for the triangular core sandwich panels. Table 4-6: Number of elements and nodes for detailed models with hexagonal core Core Cell Size 1/8 5/32 3/16 1/4 3/8 No. of Elements 203, ,094 90,582 49,818 55,712 No. of Nodes 140,594 88,786 62,922 34,770 43,730 Table 4-7: Number of elements and nodes for detailed models with square core Core Cell Size 1/8 5/32 3/16 1/4 3/8 No. of Elements 205, ,456 91,908 51,440 16,952 No. of Nodes 148,842 95,522 66,926 37,622 12,346 Table 4-8: Number of elements and nodes for detailed models with triangular core Core Cell Size 1/8 5/32 3/16 1/4 3/8 No. of Elements 386, , ,008 95,680 90,396 No. of Nodes 224, ,714 94,674 56,022 67,658 In the detailed finite element models of the sandwich panels, the mesh density used six elements through the core thickness. A mesh convergence study was performed for the hexagonal core showed this mesh density to be a converged mesh density. The mesh convergence study was performed for two (2CE), four (4CE), and six (6CE) elements through the core thickness (Figure 4-11). 90


112 Chapter 4. Light Cellular Cores for Space Applications 6CE FEM 4CE FEM 2CE FEM Figure 4-11: Finite element models for mesh convergence study The mesh convergence study showed that the results for the models with four elements through the core thickness and those for the models with six elements through the core thickness are identical. All detailed models used six elements though the core thickness. Table 4-9: Finite element models and results for mesh convergence study models Mesh Convergence Models 2CE 4CE 6CE No. of Elements 64, , ,322 No. of Nodes 97, , ,594 Center Panel Displacement In addition to the detailed finite element models created for the sandwich panels, two sandwich panel finite element models with continuum core were created and used as main configurations within which the properties of the core are changed to represent the different core shape, cell size and core density. The mechanical properties of the continuum equivalent to the cellular core are modeled using two different techniques leading to two configurations: a) NASTRAN PCOMP (laminate) elements in combination with the material card MAT8 representing the core, and b) NASTRAN 91

113 Chapter 4. Light Cellular Cores for Space Applications CHEXA solid elements for the core, in combination with the material card MAT9, while shell elements are used to model the facesheets. The two main configuration finite element models in which the core is modeled as a continuum are shown in Figure Figure 4-12: Sandwich panel finite element models with core modeled as a continuum 4.4 Results Continuum Properties The detailed finite element models of the unit cells were analyzed using the displacement approach in order to arrive at the mechanical properties of the continuum equivalent to the cellular cores. The displacement approach was applied in each direction independently. Symmetry boundary conditions were applied in order to account for neighboring cells effect. The results for the mechanical properties of the continuum equivalent to the three core shapes were normalized by the core material modulus (E c ) and comparison between the three core shapes was performed for each mechanical property and each cell size. 92
114 Chapter 4. Light Cellular Cores for Space Applications The results, in accordance with the unit cell coordinate system shown in Figure 4-7, for the mechanical properties of the continuum equivalent to the hexagonal, square and triangular cellular cores are shown in Figure 4-13 through Figure 4-18 for cellular cores with cell size of 1/8, Figure 4-19 through Figure 4-24 for cellular cores with cell size of 5/32, Figure 4-25 through Figure 4-30 for cellular cores with cell size of 3/16, Figure 4-31 through Figure 4-36 for cellular cores with cell size of 1/4, and Figure 4-37 through Figure 4-42 for cellular cores with cell size of 3/ Hexagonal Square Triangular 1/8 Cell E x / E c E x / E c Core Density [PCF] Figure 4-13: Variation of E x with core density for 1/8 cell size 93
115 Chapter 4. Light Cellular Cores for Space Applications E y / E c /8 Cell E y / E c Hexagonal Square Triangular Core Density [PCF] Figure 4-14: Variation of E y with core density for 1/8 cell size /8 Cell E z / E c Hexagonal Square Triangular E z / E c Core Density [PCF] Figure 4-15: Variation of E z with core density for 1/8 cell size 94
116 Chapter 4. Light Cellular Cores for Space Applications G yz / E c Hexagonal Square Triangular 1/8 Cell G yz / E c Core Density [PCF] Figure 4-16: Variation of G yz with core density for 1/8 cell size G xz / E c Hexagonal Square Triangular 1/8 Cell G xz / E c Core Density [PCF] Figure 4-17: Variation of G xz with core density for 1/8 cell size 95
117 Chapter 4. Light Cellular Cores for Space Applications G xy / E c Hexagonal Square Triangular 1/8 Cell G xy / E c Core Density [PCF] Figure 4-18: Variation of G xy with core density for 1/8 cell size Hexagonal Square Triangular 5/32 Cell E x / E c E x /E c Core Density [PCF] Figure 4-19: Variation of E x with core density for 5/32 cell size 96
118 Chapter 4. Light Cellular Cores for Space Applications Hexagonal Square Triangular 5/32 Cell E y / E c E y /E c Core Density [PCF] Figure 4-20: Variation of E y with core density for 5/32 cell size Hexagonal Square Triangular 5/32 Cell E z / E c E z /E c Core Density [PCF] Figure 4-21: Variation of E z with core density for 5/32 cell size 97
119 Chapter 4. Light Cellular Cores for Space Applications Hexagonal Square Triangular 5/32 Cell G yz / E c G yz /E c Core Density [PCF] Figure 4-22: Variation of G yz with core density for 5/32 cell size Hexagonal Square Triangular 5/32 Cell G xz / E c G xz /E c Core Density [PCF] Figure 4-23: Variation of G xz with core density for 5/32 cell size 98
120 Chapter 4. Light Cellular Cores for Space Applications /32 Cell G xy / E c Hexagonal Square Triangular G xy /E c Core Density [PCF] Figure 4-24: Variation of G xy with core density for 5/32 cell size Hexagonal Square Triangular 3/16 Cell E x / E c E x /E c Core Density [PCF] Figure 4-25: Variation of E x with core density for 3/16 cell size 99
121 Chapter 4. Light Cellular Cores for Space Applications Hexagonal Square Triangular 3/16 Cell E y / E c E y /E c Core Density [PCF] Figure 4-26: Variation of E y with core density for 3/16 cell size E z /E c Hexagonal Square Triangular 3/16 Cell E z / E c Core Density [PCF] Figure 4-27: Variation of E z with core density for 3/16 cell size 100
122 Chapter 4. Light Cellular Cores for Space Applications Hexagonal Square Triangular 3/16 Cell G yz / E c G yz /E c Core Density [PCF] Figure 4-28: Variation of G yz with core density for 3/16 cell size G xz /E c Hexagonal Square Triangular 3/16 Cell G xz / E c Core Density [PCF] Figure 4-29: Variation of G xz with core density for 3/16 cell size 101
123 Chapter 4. Light Cellular Cores for Space Applications /16 Cell G xy / E c Hexagonal Square Triangular G xy /E c Core Density [PCF] Figure 4-30: Variation of G xy with core density for 3/16 cell size /4 Cell E x / E c Hexagonal Square Triangular E x /E c Core Density [PCF] Figure 4-31: Variation of E x with core density for 1/4 cell size 102
124 Chapter 4. Light Cellular Cores for Space Applications Hexagonal Square Triangular 1/4 Cell E y / E c E y /E c Core Density [PCF] Figure 4-32: Variation of E y with core density for 1/4 cell size Hexagonal Square Triangular 1/4 Cell E z / E c E z /E c Core Density [PCF] Figure 4-33: Variation of E z with core density for 1/4 cell size 103
125 Chapter 4. Light Cellular Cores for Space Applications Hexagonal Square Triangular 1/4 Cell G yz / E c G yz /E c Core Density [PCF] Figure 4-34: Variation of G yz with core density for 1/4 cell size G xz /E c /4 Cell G xz / E c Hexagonal Square Triangular Core Density [PCF] Figure 4-35: Variation of G xz with core density for 1/4 cell size 104
126 Chapter 4. Light Cellular Cores for Space Applications /4 Cell G xy / E c Hexagonal Square Triangular G xy /E c Core Density [PCF] Figure 4-36: Variation of G xy with core density for 1/4 cell size E x /E c Hexagonal Square Triangular 3/8 Cell E x / E c Core Density [PCF] Figure 4-37: Variation of E x with core density for 3/8 cell size 105
127 Chapter 4. Light Cellular Cores for Space Applications E y /E c Hexagonal Square Triangular 3/8 Cell E y / E c Core Density [PCF] Figure 4-38: Variation of E y with core density for 3/8 cell size E z /E c Hexagonal Square Triangular 3/8 Cell E z / E c Core Density [PCF] Figure 4-39: Variation of E z with core density for 3/8 cell size 106
128 Chapter 4. Light Cellular Cores for Space Applications Hexagonal Square Triangular 3/8 Cell G yz / E c G yz /E c Core Density [PCF] Figure 4-40: Variation of G yz with core density for 3/8 cell size 0.02 Hexagonal Square Triangular 3/8 Cell G xz / E c G xz /E c Core Density [PCF] Figure 4-41: Variation of G xz with core density for 3/8 cell size 107
129 Chapter 4. Light Cellular Cores for Space Applications /8 Cell G xy / E c Hexagonal Square Triangular G xy /E c Core Density [PCF] Figure 4-42: Variation of G xy with core density for 3/8 cell size The results show that the mechanical properties of the continuum equivalent to the cellular core vary linearly with the core density for all moduli except for the in-plane (x-y plane) shear modulus. The core in-plane, panel-wise, equivalent shear modulus variation is non-linear and increases in a rapidly, however, the value of the core in-plane shear modulus G xy is very small compared to all other moduli for the light cellular cores studied. The core in-plane shear modulus is at least an order of magnitude lower than the transverse shear moduli and two orders of magnitude lower than Young s moduli. This leads to the conclusion that assuming the core equivalent G xy in-plane shear modulus have no effect is a safe assumption for all three core shapes. However, this assumption is valid only for light cellular cores since 108
130 Chapter 4. Light Cellular Cores for Space Applications the increase in the in-plane shear modulus is non-linear with the increase in core density. Another important conclusion is that the triangular core mechanical properties show higher stiffness than the hexagonal core for all in-plane and transverse shear moduli except for G xz modulus for cell sizes up to 3/16 where the hexagonal core modulus is higher by 3%-7.5%. For the larger cell sizes 1/4 and 3/8, the triangular core transverse shear modulus G xz is higher than that of the hexagonal core by 2% and 12% respectively. Furthermore, the transverse shear modulus G yz of the triangular core is consistently 30% higher than that of the hexagonal core for all cell sizes and core densities. For the case of in-plane Young s modulus E x, the triangular core is 65%- 70% stiffer than the hexagonal core while that for the in-plane Young s modulus E y, the triangular core is 45%-50% stiffer than the hexagonal core. The equivalent mechanical properties of the square core reflect the behavior of a transversely isotropic material which is consistent with the results obtained for the heavy square core in Chapter 3. Additionally, compared to the hexagonal core, the square core possess higher in-plane Young s moduli E x and E y but lower transverse shear moduli G yz and G xz. It is also noteworthy that the out-of-plane modulus E z is the same for the three core shapes. This confirms the assumption initially offered by Gibson and Ashby [48, 49] and adopted by many researchers that the out-of-plane modulus is simply the volume fraction multiplied by the core material modulus. 109
131 Chapter 4. Light Cellular Cores for Space Applications Based on the results shown in Figure 4-13 through Figure 4-42, formulas were derived to calculate the mechanical properties of the continuum equivalent to the cellular core normalized by the modulus of the core material as a function of the core density. Eq. (4.1) represents the linear formulas to calculate the mechanical properties of the cellular core shapes studied for the cell sizes and core densities listed in Table 4-1. The linear formula s factors A, B, C and D are listed in Table 4-10 and Table 4-11 for each cell size and core shape. E G i, i x, y, z E iz, i x, y E c c ( A B) ( C D) Eq. (4.1) For all moduli, the linear equation was a best fit with a less than 1.0% error. As stated previously, the x-y shear modulus is at least an order of magnitude lower than the x-z and y-z shear moduli and hence can safely be assumed to have no impact on the behavior of the core for the low density cores considered. Cell Size 1/8 5/32 3/16 1/4 Table 4-10: Factors A & B for Eq. (4.1) Core E x / E c E y / E c E z / E c Shape A B A B A B Hexagonal Square Triangular Hexagonal Square Triangular Hexagonal Square Triangular Hexagonal Square
132 Chapter 4. Light Cellular Cores for Space Applications 3/8 Triangular Hexagonal Square Triangular Cell Size 1/8 5/32 3/16 1/4 3/8 Table 4-11: Factors C & D for Eq. (4.1) Core G yz / E c G xz / E c Shape C D C D Hexagonal Square Triangular Hexagonal Square Triangular Hexagonal Square Triangular Hexagonal Square Triangular Hexagonal Square Triangular Note that the constants B and D in Eq. (4.1) are meaningless if the core density is zero as the entire equation would be of no use in that case. The Poisson s ratio, for the three core shapes, were also calculated using the detailed core finite element models and was found to be constant for all cell sizes and core densities of each of the core shapes. These Poisson s ratio values are listed in Table It is important to note that the triangular core behaves as an Auxetic material, i.e., material with negative Poisson s ratio. Auxetic materials are known to offer certain advantages such as increased shear stiffness, increased plane strain fracture toughness, and increased indentation resistance. Auxetic materials are widely used in biomedical applications as well as personal protection clothing such as helmets, body armor and sports clothing. 111
133 Chapter 4. Light Cellular Cores for Space Applications Effect of Cell Size Table 4-12: Poisson s Ratios Poisson s Ratio Hexagonal Square Triangular xy xz yz As seen in Eq. (4.1) along with the factors listed in Table 4-10 and Table 4-11, the equations factors differ depending on the cell size. The variation of the mechanical properties with respect to cell size was obtained for a fixed core density of 3.1 pcf and is shown in Figure 4-43 for hexagonal core shape, Figure 4-44 for square core shape, and Figure 4-45 for triangular core shape. The hexagonal, square and triangular core mechanical properties suffer a linear reduction in the mechanical properties with the increase in cell size. The percentage reduction in the moduli per 0.1" increase in cell size is listed in Table 4-13 for hexagonal core shape, Table 4-14 for square core shape, and Table 4-15 for triangular core shape. From the results, it is concluded that smaller the cell size, the better the mechanical properties for the same core density, and hence the same weight. The loss in the Young s moduli for all three core shapes is very similar and ranges between 1.6%-1.8% per 0.1 increase in cell size. For the transverse shear modulus G yz, the loss per 0.1 increase in cell size is very similar for triangular and hexagonal cores and ranges between 8.2%-8.7% but is significantly higher for the square core and exceeds 17%. For the transverse shear modulus G xz, the loss per 0.1 increase in cell size is the 112
134 Moldulus [ksi] Chapter 4. Light Cellular Cores for Space Applications lowest for the triangular core and is 15.4%. For the square core, the shear modulus G xz drops by 17.9% per 0.1 increase in cell size while the drop is the highest for the hexagonal core and is 19.6% per 0.1 increase in cell size. Table 4-13: Percentage drop in hexagonal core modulus per 0.1 increase in cell size E x E y E z G yz G xz -1.6% -1.8% -2.5% -8.2% -19.6% Table 4-14: Percentage drop in square core modulus per 0.1 increase in cell size E x E y E z G yz G xz -1.6% -1.6% -2.5% -17.9% -17.9% Table 4-15: Percentage drop in triangular core modulus per 0.1 increase in cell size E x E y E z G yz G xz -1.6% -1.8% -2.5% -8.7% -15.4% Hexagonal -Variation with Cell Size Ex Ey Ez Gyz Gxz Cell Size [in] Figure 4-43: Variation of mechanical properties with cell size, hexagonal core 113
135 Moldulus [ksi] Chapter 4. Light Cellular Cores for Space Applications Moldulus [ksi] Square Variation with Cell Size Ex Ey Ez Gyz Gxz Cell Size [in] Figure 4-44: Variation of mechanical properties with cell size, square core Triangular Variation with Cell Size Ex Ey Ez Gyz Gxz Cell Size [in] Figure 4-45: Variation of mechanical properties with cell size, triangular core 114
136 Chapter 4. Light Cellular Cores for Space Applications Mechanical Properties Accuracy Assessment The accuracy of the mechanical behavior of the continuum equivalent to the cellular cores obtained using the unit cell finite element models is assessed. Detailed finite element models (Figure 4-8, Figure 4-9, and Figure 4-10) were created for approximately 10" 10" sandwich panels with isotropic face sheet made of Aluminum The core thickness for all sandwich panels is 0.5" while the face sheet thickness for all sandwich panels was chosen to be 0.010". The sandwich panels with the three core types were then analyzed to clamped boundary condition (Eq. 4.2) and uniform pressure applied to the bottom x X y Y / 2, / 2, v 0, w0, 0 u 0, w0, 0 x y Eq. (4.2) where X and Y are the dimensions of the sandwich panel per Table 4-5, u, v, and w are the linear displacements in the X, Y, and Z directions respectively, and x, and y are the rotational displacements about the X, and Y axes The assessment of the equivalent continuum properties calculated from the representative unit cell finite element models was performed employing, a) NASTRAN PCOMP (laminate) elements in combination with the material card MAT8 representing the core, and b) NASTRAN CHEXA solid elements for the core in combination with material card MAT9 and 115
137 Chapter 4. Light Cellular Cores for Space Applications shell elements for the facesheets. The finite element models shown in Figure 4-12 were then applied to a clamped plate (Eq. 4.2) subjected to a uniform pressure applied to the bottom face sheet. The center-of-panel displacement results from the plate models with equivalent continuum properties are then compared to the center-of-panel displacement results from the highly detailed sandwich panel finite element models in order to assess the accuracy of the equivalent properties obtained from the unit cell models in predicting the sandwich panel performance. The comparison of the results is shown in Table 4-16, Table 4-16 and Table The results shown in Table 4-16, Table 4-16 and Table 4-16 show that the mechanical properties obtained from the unit cell finite element models provide good representation for the cellular core. The results from the continuum models with PCOMP elements consistently show error within 5% except for cell size 3/8 while models with CHEXA elements show error within 10% except for the cell size 3/8. An important note is that panel size to cell size ratio is typically assumed to be very high (Y /w >> 1) when developing analytical models for the cellular core properties. The higher error associated with the largest cell size points to the importance of understanding the effect of panel size to cell size ratio on the error. The next section will study the geometric parameter impact on the error. Cell Size Table 4-16: Displacement results comparison for hexagonal core Core Density Plate Center Displacement [inch] Detailed PCOMP CHEXA PCOMP to Detailed CHEXA to Detailed 116
138 Chapter 4. Light Cellular Cores for Space Applications [inch] [pcf] Error Error 1/8 5/32 3/16 1/4 3/ % 5.4% % 5.4% % 6.4% % 6.9% % 6.0% % 6.1% % 6.4% % 6.6% % 7.2% % 6.6% % 6.7% % 6.6% % 10.8% % 8.8% % 7.2% % 6.9% % 6.1% % 24.9% % 18.2% % 13.9% % 11.9% Cell Size [inch] 1/8 5/32 3/16 Table 4-17: Displacement results comparison for square core Core Density [pcf] Plate Center Displacement [inch] PCOMP to Detailed Ratio CHEXA to Detailed Ratio Detailed PCOMP CHEXA % 3.8% % 2.5% % 1.6% % 1.3% % 6.4% % 4.6% % 3.6% % 3.0% % 8.2% % 5.6% % 4.4% % 3.5% 117
139 Chapter 4. Light Cellular Cores for Space Applications 1/4 3/8 Cell Size [inch] 1/8 5/32 3/16 1/4 3/ % 10.3% % 7.6% % 5.4% % 4.4% % 3.2% % 20.6% % 14.6% % 11.0% % 9.1% Table 4-18: Displacement results comparison for triangular core Core Density [pcf] Plate Center Displacement [inch] PCOMP to Detailed Error CHEXA to Detailed Error Detailed PCOMP CHEXA % 4.1% % 5.0% % 6.3% % 7.7% % 5.8% % 6.3% % 7.0% % 8.4% % 6.5% % 6.5% % 6.9% % 7.8% % 7.8% % 6.9% % 6.5% % 6.7% % 6.9% % 15.0% % 11.2% % 9.5% % 8.5% 118
140 Chapter 4. Light Cellular Cores for Space Applications Assessment of Geometric Parameter Effect: Error Analysis An additional study was performed to understand the effect of the panel size to cell size ratio (Y /w) as well as the facesheet thickness to core thickness ratio (t f /t c ) on the error level. In order to perform this study, additional highly detailed finite element models and sandwich panel models with continuum core were created for larger size panels and additional models were also created with different facesheets thicknesses while maintaining the core thickness at 0.5. This study was performed for all core densities of the cell size 3/8 for the three core shapes. The larger panel sizes are listed in Table The additional facesheet thicknesses considered to analyze the effect of facesheet thickness to core thickness ratio are 0.012, 0.014, and Table 4-19: Larger panel sizes analyzed Cell Size 'w' Hexagonal Square Triangular 3/ / / The error analysis study performed to understand the effect of panel size to cell size ratio (Y /w) as well as the facesheet thickness to core thickness ratio (t f /t c ) on the error level shows significant impact of the panel size to cell size ratio but low impact of the facesheet thickness to core thickness ratio on the error. For the largest size panels studied (~25 25 ), the error is within 5% for both modeling techniques, PCOMP and CHEXA, of the core. The study shows that a minimum panel size to cell size ratio of 60 will provide results with error within 5% for both modeling techniques. 119
141 Chapter 4. Light Cellular Cores for Space Applications The results of the error analysis surface plots for the effect of both panel size to cell size ratio and panel facesheet thickness to core thickness ratio are shown in Figure 4-46 through Figure 4-53 for the hexagonal core, Figure 4-54 through Figure 4-61 for the square core, and Figure 4-62 through Figure 4-69 for the triangular core. As can be seen in the figures, the facesheet thickness to core thickness ratio affects the error by < 1.0% for each increase in the ratio while the panel size to cell size ratio has a much greater impact pcf Hexagonal Core - PCOMP 25%-30% 20%-25% 15%-20% 10%-15% 5%-10% 0%-5% Y/w t f / t c % 25% 20% 15% 10% 5% 0% Figure 4-46: Error variation with Y/w and t f /t c hexagonal PCOMP 1.0 pcf 120

142 Chapter 4. Light Cellular Cores for Space Applications % 30% 25% 20% 15% 0% 5% 10% Figure 4-47: Error variation with Y/w and t f /t c hexagonal CHEXA 1.0 pcf pcf Hexagonal Core - CHEXA 30%-35% 25%-30% 20%-25% 15%-20% 10%-15% 5%-10% 0%-5% Y/w t f / t c 1.6 pcf Hexagonal Core - PCOMP 15%-20% Y/w %-15% 5%-10% 0%-5% t f / t c % 15% 10% Figure 4-48: Error variation with Y/w and t f /t c hexagonal PCOMP 1.6 pcf 5% 0% 121
143 Chapter 4. Light Cellular Cores for Space Applications pcf Hexagonal Core - CHEXA 25%-30% 20%-25% 15%-20% 10%-15% 5%-10% 0%-5% Y/w t f / t c % 25% 20% 15% 10% 5% 0% Figure 4-49: Error variation with Y/w and t f /t c hexagonal CHEXA 1.6 pcf 2.3 pcf Hexagonal Core - PCOMP 10%-15% 5%-10% 0%-5% -5%-0% 15% 10% 27 0% -5% Y/w t f / t c Figure 4-50: Error variation with Y/w and t f /t c hexagonal PCOMP 2.3 pcf 5% 122
144 Chapter 4. Light Cellular Cores for Space Applications pcf Hexagonal Core - CHEXA Y/w %-20% 10%-15% 5%-10% 20% 0%-5% 15% 10% 5% 0% t f / t c Figure 4-51: Error variation with Y/w and t f /t c hexagonal CHEXA 2.3 pcf pcf Hexagonal Core - PCOMP Y/w %-15% 5%-10% 0%-5% 15% -5%-0% 10% 5% 0% -5% t f / t c Figure 4-52: Error variation with Y/w and t f /t c hexagonal PCOMP 3.0 pcf 123
145 Chapter 4. Light Cellular Cores for Space Applications Figure 4-53: Error variation with Y/w and t f /t c hexagonal CHEXA 3.0 pcf pcf Hexagonal Core - CHEXA Y/w Y/w %-20% 10%-15% 5%-10% 0%-5% t f / t c 1.0 pcf Square Core - PCOMP %-25% 15%-20% 10%-15% 5%-10% 0%-5% t f / t c % 15% 10% Figure 4-54: Error variation with Y/w and t f /t c square PCOMP 1.0 pcf 5% 0% 25% 20% 15% 10% 5% 0% 124
146 Chapter 4. Light Cellular Cores for Space Applications % 25% 20% 15% 10% 5% 0% Figure 4-55: Error variation with Y/w and t f /t c square CHEXA 1.0 pcf Y/w Y/w 1.0 pcf Square Core - CHEXA %-30% 20%-25% 15%-20% 10%-15% 5%-10% 0%-5% t f / t c 1.6 pcf Square Core - PCOMP 15%-20% 10%-15% 5%-10% 0%-5% -5%-0% t f / t c % 15% 10% 5% 0% -5% Figure 4-56: Error variation with Y/w and t f /t c square PCOMP 1.6 pcf 125
147 Chapter 4. Light Cellular Cores for Space Applications % 20% 15% 10% 5% 0% Figure 4-57: Error variation with Y/w and t f /t c square CHEXA 1.6 pcf Y/w Y/w 1.6 pcf Square Core - CHEXA %-25% 15%-20% 10%-15% 5%-10% 0%-5% t f / t c 2.3 pcf Square Core - PCOMP 10%-15% %-10% 0%-5% -5%-0% t f / t c % 10% -5% Figure 4-58: Error variation with Y/w and t f /t c square PCOMP 2.3 pcf 5% 0% 126
148 Chapter 4. Light Cellular Cores for Space Applications Y/w 2.3 pcf Square Core - CHEXA 15%-20% %-15% 5%-10% 0%-5% t f / t c % 15% 10% Figure 4-59: Error variation with Y/w and t f /t c square CHEXA 2.3 pcf 3.0 pcf Square Core - PCOMP 5%-10% 5% 0% 0%-5% -5%-0% 10% 5% Y/w % -5% t f / t c Figure 4-60: Error variation with Y/w and t f /t c square PCOMP 3.0 pcf 127
149 Chapter 4. Light Cellular Cores for Space Applications 3.0 pcf Square Core - CHEXA 10%-15% 5%-10% 0%-5% 15% 10% Y/w t f / t c Figure 4-61: Error variation with Y/w and t f /t c square CHEXA 3.0 pcf pcf Triangular Core - PCOMP Y/w %-20% 10%-15% 5%-10% 0%-5% t f / t c Figure 4-62: Error variation with Y/w and t f /t c triangular PCOMP 1.0 pcf 5% 0% 20% 15% 10% 5% 0% 128
150 Chapter 4. Light Cellular Cores for Space Applications % 20% 15% 10% 5% 0% Figure 4-63: Error variation with Y/w and t f /t c triangular CHEXA 1.0 pcf pcf Triangular Core - CHEXA 20%-25% 15%-20% 10%-15% 5%-10% 0%-5% Y/w t f / t c 1.6 pcf Triangular Core - PCOMP 10%-15% Y/w %-10% 0%-5% -5%-0% t f / t c % 10% -5% Figure 4-64: Error variation with Y/w and t f /t c triangular PCOMP 1.6 pcf 5% 0% 129
151 Chapter 4. Light Cellular Cores for Space Applications pcf Triangular Core - CHEXA 15%-20% Y/w %-15% 5%-10% 0%-5% t f / t c % 15% 10% Figure 4-65: Error variation with Y/w and t f /t c triangular CHEXA 1.6 pcf 2.3 pcf Triangular Core - PCOMP 5%-10% 5% 0% 0%-5% -5%-0% 10% Y/w % 0% -5% t f / t c Figure 4-66: Error variation with Y/w and t f /t c triangular PCOMP 2.3 pcf 130
152 Chapter 4. Light Cellular Cores for Space Applications 2.3 pcf Triangular Core - CHEXA 10%-15% 5%-10% 0%-5% 15% 10% Y/w % 0% t f / t c Figure 4-67: Error variation with Y/w and t f /t c triangular CHEXA 2.3 pcf 3.0 pcf Triangular Core - PCOMP 0%-5% -5%-0% 5% Y/w % -5% t f / t c Figure 4-68: Error variation with Y/w and t f /t c triangular PCOMP 3.0 pcf 131
153 Chapter 4. Light Cellular Cores for Space Applications 3.0 pcf Triangular Core - CHEXA 5%-10% 0%-5% 10% Y/w % 0% t f / t c Figure 4-69: Error variation with Y/w and t f /t c triangular CHEXA 3.0 pcf 4.5 Concluding Remarks The mechanical properties of hexagonal, square and triangular cellular cores are calculated by applying a displacement based approach to detailed finite element models of representative unit cells. The mechanical properties calculation was performed for five cell sizes and twenty one core densities for each of the three core shapes for a total of 315 cases. Careful study of the calculated properties leads to the following conclusions: The panel-wise in-plane shear modulus value is too small compared to all other moduli and therefore has no impact on the overall stiffness of the sandwich panel 132
154 Chapter 4. Light Cellular Cores for Space Applications The mechanical properties, with the exception of panel-wise in-plane shear modulus, vary linearly with the core relative density Both the triangular and square cellular cores possess higher panel-wise in-plane moduli than the hexagonal core with the triangular core having higher moduli than the square core Compared to the hexagonal core, the triangular core in-plane modulus E x is 65%-70% higher while the in-plane modulus E y is 45%-50% higher The triangular core possesses the highest transverse shear modulus G yz and is 30% higher than that of the hexagonal core. For the transverse shear G xz, the hexagonal core is the highest for cell sizes up to 3/16 and is 3%-7.5% higher than the triangular core. For 1/4 and 3/8 cell sizes, the triangular core transverse shear G xz is the highest and is higher than the hexagonal core by 2% and 12% for the two cell sizes respectively The triangular core behaves as an auxetic material system which known to offer certain advantages such as increased shear stiffness, increased plane strain fracture toughness, and increased indentation resistance. Auxetic materials are widely used in biomedical applications as well as protective clothing. Triangular core presents an excellent addition to the family of auxetic material systems. Both the hexagonal and triangular core shapes have similar capability to maintain properties as the cell size grows for all moduli except for the transverse shear G xz where the hexagonal core suffers 4.2% higher loss per 0.1 increase in cell size than that for the triangular core. The loss in capability for the square core is similar to that of the hexagonal and 133
155 Chapter 4. Light Cellular Cores for Space Applications triangular core for the elastic moduli but is higher for the transverse shear moduli Assessment of the mechanical properties obtained by applying the displacement approach to unit cell finite element models show that these mechanical properties provide good representation for the cellular core properties considering that a minimum panel size to cell size ratio of 60 is required to maintain error within 5% for both modeling techniques considered in the study. 134
156 Chapter 5 5. Homogenization Model 5.1 Introduction Homogenization of cellular cores has represented the main challenge in the path of simplifying the representation of the cellular core in order to reduce the cost of the analysis to a reasonable level. The quality of the homogenization model significantly affects the ability of the model to provide accurate representation of the cellular core which results in limitations that may be imposed on the use of the model. Variety of homogenization models exist in literature that deal with the prediction of the mechanical properties of the continuum equivalent to the cellular core. Due to the different results that may be obtained from the
157 Chapter 5. Homogenization Model different models, an assessment of the models extensively used by other researchers was necessary in order to understand the quality level of these models. This task is very important as it leads to defining the best model(s) existing in literature and the quality of that model(s). Since industry is constantly looking for better performance cellular cores and core shapes, the need for a high accuracy model is evident as creating a detailed finite element model for each new shape can become expensive and time consuming in the case of studying multiple different shapes. Most existing homogenization techniques are focused on the traditional hexagonal shape honeycomb. Compared to each other, the models created by the different researchers provide significantly different results for the elastic constants of the homogenized honeycomb. This is due to different assumptions, approximations and methodologies followed by the different researchers. Some researchers [34 40] focused on the in-plane (X and Y directions shown for sandwich panel in Figure 5-1) properties while others [41 47] assumed the in-plane properties to be of low importance and focused on the out-of-plane (z direction shown for sandwich panel in Figure 5-1) properties. A homogenization model that focused on either the in-plane or out-of-plane properties are called herein partial models. Homogenization models that consider all elastic constants [49, 52, 55-57] are called herein complete model. Of the homogenization models found in the literature, the model developed by Balawi and Abot [36, 37], Meraghni et. al. [45], Gibson and Ashby [49], Shi and Tong [52], and Hohe and Becker [55 57] are the most 136
158 Chapter 5. Homogenization Model commonly used. These models are chosen for quality assessment in this work. Figure 5-1: Sandwich panel coordinate system In this chapter, the literature models extensively used by other researchers will be assessed for their quality of predicting the properties of the continuum equivalent to the honeycomb core. This assessment is performed in an effort to define the best model in predicting the cellular core equivalent properties. 5.2 Partial Homogenization Models Partial homogenization models that will be assessed for quality in this work are those developed by Balawi and Abot [36, 37] and Meraghni et. al. [45]. 137
159 Chapter 5. Homogenization Model Balawi and Abot [36, 37] developed a homogenization model for the inplane properties of the equivalent continuum. After comparing test data to the model developed by Masters and Evans [51] which was based on Gibson and Ashby model [49], Balawi and Abot presented a homogenization model that considers the curvature of the cell walls at their intersection. The model then assumes that loading in either of the in-plane directions is supported by the angled cell walls while the straight cell walls remain straight. Applying unit stress in the two in-plane directions, one at a time, and using simple mechanics, the displacement of the unit cell was calculated due to bending, shear and axial deformation of the angled cell walls. The strains were then derived and the effective modulus was calculated from the stress and strain. The resulting in-plane moduli provided but Balawi and Abot matched exactly those provided earlier by Masters and Evans [51]. Since both solutions provide identical results, the simpler closed form solution provided by Masters and Evans are provided in Eq. (5.1). Ex E E E eff c eff y c t 3 l 2 3 t 1 l c 2 1 t l 5 c 3 t l 3 3 Eq. (5.1) Meraghni et. al. [45] assumed the in-plane properties to be of negligible value and provided a homogenization approach to derive closed form solution for the transverse properties of the continuum equivalent to the honeycomb cellular core. The homogenization technique presented by 138
160 Chapter 5. Homogenization Model Meraghni considered the unit cell of hexagonal honeycomb as a two plies laminate and applied the classical lamination theory to the two ply laminate to obtain the equivalent transverse properties. The closed form of the equivalent properties developed by Meraghni are shown in Eq. (5.2) with = 120. E z t Ec (1 2cos( )) 2l sin( )(cos( ) 1) G yz t Gc ( t 2l sin( )) 2l ( t l sin( ))(cos( ) 1) Eq. (5.2) G xz t Gc (1 2cos( )) 2l sin( )(cos( ) 1) 5.3 Full Homogenization Models Full homogenization models to be assessed in this work are the Gibson and Ashby model [49], Shi and Tong [52] and Hohe and Becker model [55-57]. Gibson and Ashby [49] presented closed linear formulas for the calculation of equivalent honeycomb properties to describe all states of stress except for the transverse shear stiffness. The in-plane properties were calculated on the basis of representing the cell walls as beams and assuming that only the angled beams carry the in-plane loading. The in-plane Poisson s ratios were calculated from the formulas to be unity. The out-of- 139
161 Chapter 5. Homogenization Model plane modulus was calculated based on the relative density of the material of the cell walls as a function of the core material modulus. Gibson and Ashby concluded that the calculation of the transverse shear properties for exact values is only possible with numerical solutions. Gibson and Ashby then presented formulas for upper and lower bounds of the transverse shear moduli using the theorems of minimum potential energy and that of minimum complimentary energy. The homogenization provided an upper and lower bounds for each of the transverse shear moduli. For G yz, the upper and lower bounds were equivalent and therefore yielded a closed form for an exact solution. The closed form solutions provided by Gibson and Ashby are shown in Eq. (5.3). E E x c t l 3 1sin 3 cos E E y c t l 3 cos 2 1sin sin E E z c V V cellwalls cell Eq. (5.3) G G yz c cos t 1sin l 1sin t 3cos l G G xz c sin t 2 1 sin cos l where V cellwalls is the volume of the cell walls within the unit cell 140
162 Chapter 5. Homogenization Model V cell is the volume occupied by the unit cell = 30 A brief introduction was given in Sections for the Hohe and Becker and the Shi and Tong homogenization techniques. It is important to note that the Shi and Tong homogenization model is specific to the hexagonal honeycomb shape while the Hohe and Becker homogenization technique is generalized for any shape and possess the capability to address curved cell walls. We will investigate the accuracy of the different techniques highlighted in order to better understand where each of these techniques stand relative to the detailed finite element analysis results of the unit cell. 5.4 Assessment of Literature Homogenization Models In order to understand the capability of each of the homogenization models highlighted in sections 5.2 and 5.3, an accuracy assessment is performed by developing the hexagonal honeycomb properties for the cell sizes and core densities under investigation in this work and listed in Table 4-1. The results of this assessment are shown in Figure 5-2 through Figure 5-6 for E x, Figure 5-7 through Figure 5-11 for E y, Figure 5-12 through Figure 5-16 for E z, Figure 5-17 through Figure 5-21 for G xz, and Figure 5-22 through Figure 5-26 for G yz. The assessment results show that all models except the Shi and Tong model [52] fail to provide proper in-plane moduli even those models that 141
163 Chapter 5. Homogenization Model were aiming only the in-plane properties. The out-of-plane Young s modulus E z is well predicted by all models that followed the Gibson and Ashby [49] model. Meraghni s model [45] which aimed to only derive outof-plane properties failed to provide a reasonable prediction for the out-ofplane modulus. For the transverse shear modulus G xz, the lower bound from the Gibson and Ashby model [49] provides the best results with error ranging -17% - +15% for cell sizes up to 1/4. For 3/8 cell sizes, the error grows > 60%. Meraghni s model shows results with error < 20% for cell sizes up to 5/32 while significantly higher errors for larger cell sizes. Hohe and Becker model [55 57] and the Shi and Tong model [52] provide almost identical results with error > 25% for all cell sizes. For the G yz transverse shear modulus, the models developed by Gibson and Ashby, Hohe and Becker and Shi and Tong provide almost identical results. The best prediction is provided by the three models with error < 20% for cell sizes up to 3/16. The error for the two largest cell sizes (1/4 and 3/8 ) is 25% and 40%. Meraghni s model results has > 25% for all cell sizes. 142
164 Chapter 5. Homogenization Model E x / E c /8 Cell Size, E x / E c FEM Hohe & Becker Shi & Tong Gibson & Ashby Balawi Core Density [pcf] Figure 5-2: Homogenization models assessment, 1/8 Cell, E x /E c E x / E c /32 Cell Size, E x / E c FEM Hohe & Becker Shi & Tong Gibson & Ashby Balawi Core Density [pcf] Figure 5-3: Homogenization models assessment, 5/32 Cell, E x /E c 143
165 Chapter 5. Homogenization Model E x / E c /16 Cell Size, E x / E c FEM Hohe & Becker Shi & Tong Gibson & Ashby Balawi Core Density [pcf] Figure 5-4: Homogenization models assessment, 3/16 Cell, E x /E c E x / E c /4 Cell Size, E x / E c FEM Hohe & Becker Shi & Tong Gibson & Ashby Balawi Core Density [pcf] Figure 5-5: Homogenization models assessment, 1/4 Cell, E x /E c 144
166 Chapter 5. Homogenization Model E x / E c /8 Cell Size, E x / E c FEM Hohe & Becker Shi & Tong Gibson & Ashby Balawi Core Density [pcf] Figure 5-6: Homogenization models assessment, 3/8 Cell, E x /E c E y / E c /8 Cell Size, E y / E c FEM Hohe & Becker Shi & Tong Gibson & Ashby Balawi Core Density [pcf] Figure 5-7: Homogenization models assessment, 1/8 Cell, E y /E c 145
167 Chapter 5. Homogenization Model E y / E c /32 Cell Size, E y / E c FEM Hohe & Becker Shi & Tong Gibson & Ashby Balawi Core Density [pcf] Figure 5-8: Homogenization models assessment, 5/32 Cell, E y /E c E y / E c /16 Cell Size, E y / E c FEM Hohe & Becker Shi & Tong Gibson & Ashby Balawi Core Density [pcf] Figure 5-9: Homogenization models assessment, 3/16 Cell, E y /E c 146
168 Chapter 5. Homogenization Model E y / E c /4 Cell Size, E y / E c FEM Hohe & Becker Shi & Tong Gibson & Ashby Balawi Core Density [pcf] Figure 5-10: Homogenization models assessment, 1/4 Cell, E y /E c E y / E c /8 Cell Size, E y / E c FEM Hohe & Becker Shi & Tong Gibson & Ashby Balawi Core Density [pcf] Figure 5-11: Homogenization models assessment, 3/8 Cell, E y /E c 147
169 Chapter 5. Homogenization Model E z / E c /8 Cell Size, E z / E c FEM Hohe & Becker Shi & Tong Gibson & Ashby Meraghni Core Density [pcf] Figure 5-12: Homogenization models assessment, 1/8 Cell, E z /E c E z / E c /32 Cell Size, E z / E c FEM Hohe & Becker Shi & Tong Gibson & Ashby Meraghni Core Density [pcf] Figure 5-13: Homogenization models assessment, 5/32 Cell, E z /E c 148
170 Chapter 5. Homogenization Model E z / E c /16 Cell Size, E z / E c FEM Hohe & Becker Shi & Tong Gibson & Ashby Meraghni Core Density [pcf] Figure 5-14: Homogenization models assessment, 3/16 Cell, E z /E c E z / E c /4 Cell Size, E z / E c FEM Hohe & Becker Shi & Tong Gibson & Ashby Meraghni Core Density [pcf] Figure 5-15: Homogenization models assessment, 1/4 Cell, E z /E c 149
171 Chapter 5. Homogenization Model E z / E c /8 Cell Size, E z / E c FEM Hohe & Becker Shi & Tong Gibson & Ashby Meraghni Core Density [pcf] Figure 5-16: Homogenization models assessment, 3/8 Cell, E z /E c G xz / E c /8 Cell Size, G xz / E c FEM Hohe & Becker Shi & Tong Gibson & Ashby LB Gibson & Ashby UB Meraghni Core Density [pcf] Figure 5-17: Homogenization models assessment, 1/8 Cell, G xz /E c 150
172 Chapter 5. Homogenization Model G xz / E c /32 Cell Size, G xz / E c FEM Hohe & Becker Shi & Tong Gibson & Ashby LB Gibson & Ashby UB Meraghni Core Density [pcf] Figure 5-18: Homogenization models assessment, 5/32 Cell, G xz /E c G xz / E c /16 Cell Size, G xz / E c FEM Hohe & Becker Shi & Tong Gibson & Ashby LB Gibson & Ashby UB Meraghni Core Density [pcf] Figure 5-19: Homogenization models assessment, 3/16 Cell, G xz /E c 151
173 Chapter 5. Homogenization Model G xz / E c /4 Cell Size, G xz / E c FEM Hohe & Becker Shi & Tong Gibson & Ashby LB Gibson & Ashby UB Meraghni Core Density [pcf] Figure 5-20: Homogenization models assessment, 1/4 Cell, G xz /E c G xz / E c /8 Cell Size, G xz / E c FEM Hohe & Becker Shi & Tong Gibson & Ashby LB Gibson & Ashby UB Meraghni Core Density [pcf] Figure 5-21: Homogenization models assessment, 3/8 Cell, G xz /E c 152
174 Chapter 5. Homogenization Model G yz / E c /8 Cell Size, G yz / E c FEM Hohe & Becker Shi & Tong Gibson & Ashby Meraghni Core Density [pcf] Figure 5-22: Homogenization models assessment, 1/8 Cell, G yz /E c G yz / E c /32 Cell Size, G yz / E c FEM Hohe & Becker Shi & Tong Gibson & Ashby Meraghni Core Density [pcf] Figure 5-23: Homogenization models assessment, 5/32 Cell, G yz /E c 153
175 Chapter 5. Homogenization Model G yz / E c /16 Cell Size, G yz / E c FEM Hohe & Becker Shi & Tong Gibson & Ashby Meraghni Core Density [pcf] Figure 5-24: Homogenization models assessment, 3/16 Cell, G yz /E c G yz / E c /4 Cell Size, G yz / E c FEM Hohe & Becker Shi & Tong Gibson & Ashby Meraghni Core Density [pcf] Figure 5-25: Homogenization models assessment, 1/4 Cell, G yz /E c 154
176 Chapter 5. Homogenization Model G yz / E c /8 Cell Size, G yz / E c FEM Hohe & Becker Shi & Tong Gibson & Ashby Meraghni Core Density [pcf] Figure 5-26: Homogenization models assessment, 3/8 Cell, G yz /E c 155
177 Chapter 6 6. Elastic-Plastic Buckling of Cellular Core due to Transverse Compression 6.1 Introduction Honeycomb panels represent a significant portion of aerospace structure due to the high stiffness to weight ratio. During the manufacturing and assembly of the aerospace product, honeycomb panels are handled through many processes. These processes start with the operations performed on each honeycomb panel to apply panel specific features and to incorporate panel specific joints that will later be used for component mounting such as inserts or joints for a panel to panel interface. The next process is to mount components to the panels and/or assemble the panels together to reach the
178 Chapter 6. Elastic-Plastic Buckling of Cellular Core due to Transverse Compression final desired component. The assembled product is then subjected to static and/or dynamic tests to verify the capability and workmanship of the structure. Manufacturing defects, which occur often in cellular cores of sandwich structures, lead to buckled cells in the core and thus to degraded constitutive core properties. These defects in the core cells may occur due to unintentional impact of tool(s) onto the panel during manufacturing and/or handling processes or due to a defect in the manufactured core itself. The degraded constitutive properties of the core lead to local degraded stiffness of the sandwich panel, which in turn may impact the capability of nearby inserts (Figure 6-1) that are often used for component mounting to the panel or nearby joints used for joining the sandwich panels together. Core fill Insert Face-sheets Cellular Core Figure 6-1: Schematic of sandwich panel with an insert (cross section) The aim of this study is to: a) Understand the effect of core density on the critical buckling load/buckling capability of the unit cell for each of the three core shapes: hexagonal, square and triangular, b) Understand the effect of core height (core thickness within the sandwich panel) on the critical buckling load/buckling capability of the unit cell for each of the three core shapes, and c) Investigate the degradation in the mechanical properties of the 157
179 Chapter 6. Elastic-Plastic Buckling of Cellular Core due to Transverse Compression continuum equivalent to the cellular core due to permanent deformation resulting from transverse compression. Highly detailed finite element models for the five cell sizes and twenty one core densities (Table 4-1) were created for each of the cellular core shapes under investigation in this work: hexagonal, square and triangular. The critical buckling load is calculated for all twenty one core densities/five cell sizes under consideration for the hexagonal, square and triangular cellular cores. Additionally, the critical buckling load was calculated for four core heights from 0.25" to 1.00" core height with 0.25" increments to study the effect of the core height on the critical buckling load of the unit cell. The degradation of mechanical properties of the continuum equivalent to the hexagonal, square and triangular cellular cores was studied for 1/8 and 3.1 pcf core density at different levels of buckling/permanent deformation of the unit cell of the cellular core resulting from transverse compression. This cell size and core density was chosen since it is the most commonly used in aerospace products. The same core shapes shown in Figure 4-1, at the cell sizes and core densities listed in Table 4-1 are studied in this chapter. Detailed analysis of the mechanical behavior of the continuum equivalent to the hexagonal, square and triangular type structures (Figure 4-1) made of corrugated sheets at different levels of buckled unit cell will be presented. The study begins with linear buckling analysis to calculate the critical buckling load for the unit cell for each of the five cell sizes/ twenty one core densities under 158
180 Chapter 6. Elastic-Plastic Buckling of Cellular Core due to Transverse Compression investigation (Table 4-1) for all three cellular core shapes. This is performed in order to understand the effect of the cell size and core density on the critical buckling load of the unit cell. Next, understanding the effect of core height on the critical buckling load of the unit cell was studied by varying the core height starting with 0.25" and increasing the core height by 0.25" increments up to 1.00" core height. Elastic-plastic buckling analysis is then performed using ABAQUS for the 1/8 cell size with 3.1 pcf core density for the three core shapes. For numerical post buckling analysis, the Riks method is used. 6.2 Highly Detailed Finite Element Models Highly detailed finite element models of representative unit cells were created for each cell size, core density, and core height in order to calculate the critical buckling load. Figure 6-2 shows the detailed finite element models created for the hexagonal core shape with 0.5 core height, Figure 6-3 shows the detailed finite element models created for the square core shape with 0.5 core height while Figure 6-4 shows the detailed finite element models created for the triangular core shape with 0.5 core height. 159


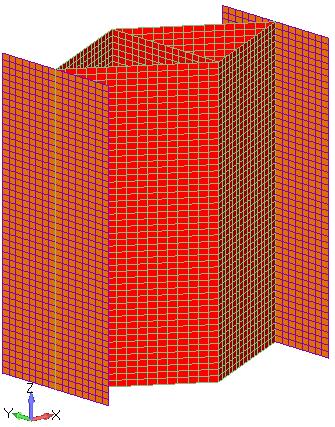
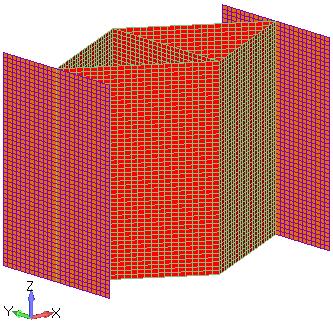
181 Chapter 6. Elastic-Plastic Buckling of Cellular Core due to Transverse Compression 1/8 Cell Size 5/32 Cell Size 3/16 Cell Size 1/4 Cell Size 3/8 Cell Size Figure 6-2: Hexagonal representative unit cell FEMs (0.50" Core Height) 1/8 Cell Size 5/32 Cell Size 3/16 Cell Size 1/4 Cell Size 3/8 Cell Size Figure 6-3: Square representative unit cell FEMs (0.50" Core Height) 1/8 Cell Size 5/32 Cell Size 3/16 Cell Size 1/4 Cell Size 3/8 Cell Size Figure 6-4: Triangular representative unit cell FEMs (0.50" Core Height) All detailed finite element models for all core heights, cell sizes and core densities have the same mesh density shown in Figure 6-2, Figure 6-3, and 160
182 Chapter 6. Elastic-Plastic Buckling of Cellular Core due to Transverse Compression Figure 6-4. The double wall thickness for the hexagonal and square core in the x direction (Figure 6-5) is modeled with a monolithic thickness of 2t neglecting the bonding of the two cell walls. As can be seen in the finite element models, small fillets at the corners where the cell walls intersect are not taken into account. The cellular cores unit cell is modeled using ABAQUS S4 shell elements. L L L l, t l, t l/2, 2t a 0 y x w l, t l/2, 2t b l/2, 2t l/2, t l/2, t w l, t l/2, t l/2, t l/2, 2t w l/2, t/2 l/2, t/2 60 l, t l/2, t/2 l/2, t/2 Figure 6-5: Coordinate system for representative unit cells 6.3 Linear Buckling Analysis Linear buckling analysis for all core cell sizes and densities listed in Table 4-1 for the three core shapes and all core heights was performed. The results are shown in Figure 6-6 through Figure These results show that the buckling load increases rapidly with the increase in core density for all core shapes. The result also show that the hexagonal shape cellular core has the highest critical buckling load/ squared inch followed by the square shape cellular core while the triangular shape cellular core has the lowest critical buckling load per square inch. 161
183 Critical Buckling Load [lbf/ in 2 ] Critical Buckling Load [lbf/ in 2 ] Chapter 6. Elastic-Plastic Buckling of Cellular Core due to Transverse Compression /8 Cell Size Hexagonal Square Triangular Core Density [pcf] Figure 6-6: 1/4 core height, 1/8 cell size, critical buckling load comparison /32 Cell Size Hexagonal Square Triangular Core Density [pcf] Figure 6-7: 1/4 core height, 5/32 cell size, critical buckling load comparison 162
184 Critical Buckling Load [lbf/ in 2 ] Critical Buckling Load [lbf/ in 2 ] Chapter 6. Elastic-Plastic Buckling of Cellular Core due to Transverse Compression 900 3/16 Cell Size Hexagonal Square Triangular Core Density [pcf] Figure 6-8: 1/4 core height, 3/16 cell size, critical buckling load comparison 800 1/4 Cell Size Hexagonal Square Triangular Core Density [pcf] Figure 6-9: 1/4 core height, 1/4 cell size, critical buckling load comparison 163
185 Critical Buckling Load [lbf/ in 2 ] Critical Buckling Load [lbf/ in 2 ] Chapter 6. Elastic-Plastic Buckling of Cellular Core due to Transverse Compression 160 3/8 Cell Size Hexagonal Square Triangular Core Density [pcf] Figure 6-10: 1/4 core height, 3/8 cell size, critical buckling load comparison /8" Cell Size Hexagonal Square Triangular Core Density [pcf] Figure 6-11: 1/2 core height, 1/8 cell size, critical buckling load comparison 164
186 Critical Buckling Load [lbf/ in 2 ] Critical Buckling Load [lbf/ in 2 ] Chapter 6. Elastic-Plastic Buckling of Cellular Core due to Transverse Compression /32" Cell Size Hexagonal Square Triangular Core Density [pcf] Figure 6-12: 1/2 core height, 5/32 cell size, critical buckling load comparison 800 3/16" Cell Size Hexagonal Square Triangular Core Density [pcf] Figure 6-13: 1/2 core height, 3/16 cell size, critical buckling load comparison 165
187 Critical Buckling Load [lbf/ in 2 ] Critical Buckling Load [lbf/ in 2 ] Chapter 6. Elastic-Plastic Buckling of Cellular Core due to Transverse Compression 700 1/4" Cell Size Hexagonal Square Triangular Core Density [pcf] Figure 6-14: 1/2 core height, 1/4 cell size, critical buckling load comparison 140 3/8" Cell Size Hexagonal Square Triangular Core Density [pcf] Figure 6-15: 1/2 core height, 3/8 cell size, critical buckling load comparison 166
188 Critical Buckling Load [lbf/ in 2 ] Chapter 6. Elastic-Plastic Buckling of Cellular Core due to Transverse Compression /8" Cell Size Critical Buckling Load [lbf/ in 2 ] Hexagonal Square Triangular Core Density [pcf] Figure 6-16: 3/4 core height, 1/8 cell size, critical buckling load comparison /32" Cell Size Hexagonal Square Triangular Core Density [pcf] Figure 6-17: 3/4 core height, 5/32 cell size, critical buckling load comparison 167
189 Critical Buckling Load [lbf/ in 2 ] Chapter 6. Elastic-Plastic Buckling of Cellular Core due to Transverse Compression 800 3/16" Cell Size Critical Buckling Load [lbf/ in 2 ] Hexagonal Square Triangular Core Density [pcf] Figure 6-18: 3/4 core height, 3/16 cell size, critical buckling load comparison 700 1/4" Cell Size Hexagonal Square Triangular Core Density [pcf] Figure 6-19: 3/4 core height, 1/4 cell size, critical buckling load comparison 168
190 Critical Buckling Load [lbf/ in 2 ] Chapter 6. Elastic-Plastic Buckling of Cellular Core due to Transverse Compression 140 3/8" Cell Size Critical Buckling Load [lbf/ in 2 ] Hexagonal Square Triangular Core Density [pcf] Figure 6-20: 3/4 core height, 3/8 cell size, critical buckling load comparison /8" Cell Size Hexagonal Square Triangular Core Density [pcf] Figure 6-21: 1 core height, 1/8 cell size, critical buckling load comparison 169
191 Critical Buckling Load [lbf/ in 2 ] Chapter 6. Elastic-Plastic Buckling of Cellular Core due to Transverse Compression /32" Cell Size Critical Buckling Load [lbf/ in 2 ] Hexagonal Square Triangular Core Density [pcf] Figure 6-22: 1 core height, 5/32 cell size, critical buckling load comparison 800 3/16" Cell Size Hexagonal Square Triangular Core Density [pcf] Figure 6-23: 1 core height, 3/16 cell size, critical buckling load comparison 170
192 Critical Buckling Load [lbf/ in 2 ] Critical Buckling Load [lbf/ in 2 ] Chapter 6. Elastic-Plastic Buckling of Cellular Core due to Transverse Compression 600 1/4" Cell Size Hexagonal Square Triangular Core Density [pcf] Figure 6-24: 1 core height, 1/4 cell size, critical buckling load comparison 120 3/8" Cell Size Hexagonal Square Triangular Core Density [pcf] Figure 6-25: 1 core height, 3/8 cell size, critical buckling load comparison 171


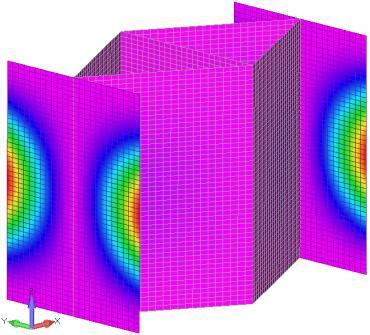
193 Chapter 6. Elastic-Plastic Buckling of Cellular Core due to Transverse Compression 1/8 Cell Size 5/32 Cell Size 3/16 Cell Size 1/4 Cell Size 3/8 Cell Size 3.1 pcf 2.6 pcf 2.0 pcf 1.6 pcf 1.0 pcf Figure 6-26: Buckling modes shapes for the hexagonal core, 0.5 core height 1/8 Cell Size 5/32 Cell Size 3/16 Cell Size 1/4 Cell Size 3/8 Cell Size 3.1 pcf 2.6 pcf 2.0 pcf 1.6 pcf 1.0 pcf Figure 6-27: Buckling modes shapes for the square core, 0.5 core height 1/8 Cell Size 5/32 Cell Size 3/16 Cell Size 1/4 Cell Size 3/8 Cell Size Figure 6-28: Buckling modes shapes for the triangular core, 0.5 core height 172


194 Chapter 6. Elastic-Plastic Buckling of Cellular Core due to Transverse Compression The buckling mode shapes for the three core shapes for all cell sizes, one core density and 1/2" core height are shown in Figure 6-26, Figure 6-27, and Figure The mode shapes for other core heights, cell sizes and core densities are very similar to those shown in Figure 6-26, Figure 6-27, and Figure 6-28 except for the 1 core height hexagonal core of 8.1 pcf core density for the 1/8 cell size where the entire unit cell buckling mode shape is similar to a beam buckling mode shape (Figure 6-29). For all other cell sizes and core shapes, as shown in Figure 6-26, Figure 6-27, and Figure 6-28, the buckling mode shapes show individual cell walls buckling modes for all three core shapes. 1/4 1/2 3/4 1 Figure 6-29: Buckling mode shape variation for 1/8 cell size hexagonal core The variation in the critical buckling load (P cr ) as the core height increase was also calculated for each of the three cellular core shapes. As 173
195 Chapter 6. Elastic-Plastic Buckling of Cellular Core due to Transverse Compression can be seen in the results (Figure 6-30, Figure 6-31, and Figure 6-32), the cellular core, regardless of its shape, suffers a significant loss in the buckling capability as the core height increases from 1/4" to 1/2". The loss in the buckling capability when the core height increases from 1/2" to 3/4" is not as severe while there is a much less loss in the buckling capability as the core height increase from 3/4" to 1". From the results, it can also be concluded that the hexagonal shape core better maintains its buckling capability as the core height increases when compared to the square and triangular core shapes. Additionally, the results show that the loss in the buckling capability for the 1/4" and 3/8" cell sizes are much higher than that for the smaller cell sizes 1/8" 3/16". P cr / P cr(0.25") Hexagonal Core Core Height [inch] 3.1 pcf 1/8" Cell Size 4.5 pcf 1/8" Cell Size 6.1 pcf 1/8" Cell Size 8.1 pcf 1/8" Cell Size 2.6 pcf 5/32" Cell Size 3.8 pcf 5/32" Cell Size 5.3 pcf 5/32" Cell Size 6.9 pcf 5/32" Cell Size 2 pcf 3/16" Cell Size 3.1 pcf 3/16" Cell Size 4.4 pcf 3/16" Cell Size 5.7 pcf 3/16" Cell Size 1.6 pcf 1/4" Cell Size 2.3 pcf 1/4" Cell Size 3.4 pcf 1/4" Cell Size 4.3 pcf 1/4" Cell Size 5.2 pcf 1/4" Cell Size 1 pcf 3/8" Cell Size 1.6 pcf 3/8" Cell Size 2.3 pcf 3/8" Cell Size 3 pcf 3/8" Cell Size Figure 6-30: Hexagonal Core, Loss in Buckling Capability as Core Height Increase 174
196 Chapter 6. Elastic-Plastic Buckling of Cellular Core due to Transverse Compression P cr / P cr(0.25") Figure 6-31: Square Core, Loss in Buckling Capability as Core Height Increase P cr / P cr(0.25") Square Core Core Height [inch] Triangular Core Core Height [inch] 3.1 pcf 1/8" Cell Size 4.5 pcf 1/8" Cell Size 6.1 pcf 1/8" Cell Size 8.1 pcf 1/8" Cell Size 2.6 pcf 5/32" Cell Size 3.8 pcf 5/32" Cell Size 5.3 pcf 5/32" Cell Size 6.9 pcf 5/32" Cell Size 2 pcf 3/16" Cell Size 3.1 pcf 3/16" Cell Size 4.4 pcf 3/16" Cell Size 5.7 pcf 3/16" Cell Size 1.6 pcf 1/4" Cell Size 2.3 pcf 1/4" Cell Size 3.4 pcf 1/4" Cell Size 4.3 pcf 1/4" Cell Size 5.2 pcf 1/4" Cell Size 1 pcf 3/8" Cell Size 1.6 pcf 3/8" Cell Size 2.3 pcf 3/8" Cell Size 3 pcf 3/8" Cell Size 3.1 pcf 1/8" Cell Size 4.5 pcf 1/8" Cell Size 6.1 pcf 1/8" Cell Size 8.1 pcf 1/8" Cell Size 2.6 pcf 5/32" Cell Size 3.8 pcf 5/32" Cell Size 5.3 pcf 5/32" Cell Size 6.9 pcf 5/32" Cell Size 2 pcf 3/16" Cell Size 3.1 pcf 3/16" Cell Size 4.4 pcf 3/16" Cell Size 5.7 pcf 3/16" Cell Size 1.6 pcf 1/4" Cell Size 2.3 pcf 1/4" Cell Size 3.4 pcf 1/4" Cell Size 4.3 pcf 1/4" Cell Size 5.2 pcf 1/4" Cell Size 1 pcf 3/8" Cell Size 1.6 pcf 3/8" Cell Size 2.3 pcf 3/8" Cell Size 3 pcf 3/8" Cell Size Figure 6-32: Triangular Core, Loss in Buckling Capability as Core Height Increase 175
197 Chapter 6. Elastic-Plastic Buckling of Cellular Core due to Transverse Compression 6.4 Nonlinear Buckling Analysis Nonlinear buckling analysis for the 1/8 cell size of 3.1 pcf core density was performed for all three core shapes. For the nonlinear buckling analysis, mode shapes from the linear buckling analysis were implemented as imperfections. The deformation of the unit cell was captured at different stages of the buckling of the unit cell. The cellular cores unit cell was modeled using ABAQUS S4 shell elements. The bottom edges of the unit cells are assumed to be fixed while the nodes at the top edges can only translate in the z direction. The cell is loaded incrementally by prescribing the predicted critical buckling load derived from the linear buckling analysis as the initial z load applied at the top edges. At the conclusion of the nonlinear buckling, i.e., at the completion of the first folding formation, the applied load was reversed until the normal stresses reverted to zero. The material considered for the cellular cores is Al-5052 with a Young s modulus of 10,000 ksi and stress limit for plastic yielding of 39 ksi. The different stages at which the deformation was captured for the nonlinear buckling of the hexagonal core are shown in Figure 6-33 while the Z displacement vs. loading is shown in Figure The load displacement curve shown in Figure 6-34 is very similar to that presented by Asprone et al. [80] for the Nomex paper honeycomb. The same steps were followed for both the triangular and square unit cell of 1/8 cell size of 3.1 pcf core density. Figure 6-35 shows the nonlinear 176
198 Chapter 6. Elastic-Plastic Buckling of Cellular Core due to Transverse Compression buckling stages of the triangular core while the Z displacement vs. loading is shown in Figure Figure 6-37 shows the nonlinear buckling stages for the square cell and Figure 6-38 shows the Z displacement vs. load for the square cell. Figure 6-33: Nonlinear buckling for hexagonal core 177
![Force [lbf] Chapter 6. Elastic-Plastic Buckling of Cellular Core due to Transverse Compression 10 Load vs. Z Displacement 8 6 4 2 0 0 0.005 0.01 0.015 0.02 0.](/docs-images/86/94090989/images/199-0.jpg "025 Z Displacement [inch] Figure 6-34: Load vs. Z displacement variation for 1/8 cell 3.")
199 Force [lbf] Chapter 6. Elastic-Plastic Buckling of Cellular Core due to Transverse Compression 10 Load vs. Z Displacement Z Displacement [inch] Figure 6-34: Load vs. Z displacement variation for 1/8 cell 3.1 pcf hexagonal core Figure 6-35: Nonlinear buckling for triangular core 178
200 Force [lbf] Chapter 6. Elastic-Plastic Buckling of Cellular Core due to Transverse Compression 5 Load vs. Z Displacement Z Displacement [inch] Figure 6-36: Load vs. Z displacement variation for 1/8 cell 3.1 pcf triangular core Figure 6-37: Nonlinear buckling for square core 179
201 Force [lbf] Chapter 6. Elastic-Plastic Buckling of Cellular Core due to Transverse Compression 3 Load vs. Z Displacement Z Displacement [inch] Figure 6-38: Load vs. Z displacement variation for 1/8 cell 3.1 pcf square core 6.5 Degradation in Mechanical Properties At the conclusion of the nonlinear buckling of the unit cell where the first folding formation is complete, the applied load was reversed until the normal stresses reverted to zero. The deformations of the unit cell were captured at selected stages of the nonlinear buckling; these deformations were applied for each of the selected stages separately to the unit cell model. The displacement approach was used to calculate the mechanical properties of the continuum equivalent to the deformed unit cell for each of the stages captured. This assessment was used to calculate the degradation in the mechanical properties of the continuum equivalent to the cellular core at the 180
202 Chapter 6. Elastic-Plastic Buckling of Cellular Core due to Transverse Compression different stages of buckling due to transverse compression. Figure 6-39 shows the detailed steps of the process followed. The modulus calculated at different stages of the buckling of the unit cell were normalized by those calculated for the unit cell before buckling started. The degradation in each of the moduli is then calculated from the ratio of moduli at the fully buckled unit cell to that of the healthy unit cell. 1. Perform Linear Buckling Analysis and recover mode shapes and displacements 2. Perform nonlinear buckling analysis: a) Critical buckling load from linear buckling analysis is initial load b) Mode shapes from linear buckling analysis applied as Imperfections c) Displacement field recovered at all stages of nonlinear buckling 3. Nonlinear buckling complete: a) Reverse load until normal stresses are reverted to zero 5. The displacement method is applied to the different deformed cell models to calculate the equivalent continuum properties 6. The ratio R B is calculated from the moduli of the fully buckled core E Fully Buckled Core and the moduli of the healthy core E Healthy Core 7. The degradation in each of the moduli is calculated as 1 - R B 4. Displacement field recovered at stages of nonlinear buckling analysis applied to undeformed cell model and a deformed model for each stage is created Figure 6-39: Process followed to calculate the degradation in the properties The results for the hexagonal core 1/8 cell size and 3.1 pcf core density is shown in Figure The results for the triangular core are shown in Figure 6-41 while the results for the square core are shown in Figure For all three core shapes, the out-of-plane modulus E z drops by 80%. 181
203 Chapter 6. Elastic-Plastic Buckling of Cellular Core due to Transverse Compression Modulus /Modulus (1 P cr ) Modulus / Modulus (1 P cr ) Mechanical Properties Degradation Hexagonal Core Z Displacement [inch] Ez Figure 6-40: Degradation in E z of hexagonal core Mechanical Properties Degradation Triangular Core 0.6 Ez Z Displacement [inch] Figure 6-41: Degradation in E z of triangular core 182
204 Chapter 6. Elastic-Plastic Buckling of Cellular Core due to Transverse Compression The variation shows that the majority of the degradation in the mechanical properties occurs during the formation of the first folding itself. Once the first folding takes place, the variation/drop in the constitutive properties slows down and stabilizes after crushing occurs. Modulus /Modulus (1 P cr ) Mechanical Properties Degradation Square Core 'Z' Displacement [inch] Figure 6-42: Degradation in E z of square core Ez 6.6 Unit Cell Modeling The unit cell finite element models created for the nonlinear buckling analysis employed 2D shell elements for the unit cell. In order to verify the validity of this modeling approach, 3D elements model was created for the hexagonal core unit cell and nonlinear buckling analysis was performed. The deformed shape results for the nonlinear buckling analysis for the two modeling approaches are shown in Figure The load vs. Z 183
![Force [lbf] Chapter 6.](/docs-images/86/94090989/images/205-0.jpg "Elastic-Plastic Buckling of Cellular Core due to Transverse Compression displacement curve comparison")
 12 Load vs. Z Displacement 10 8 6 2D Elements 3D Elements 4 2 0 0 0.005 0.01 0.015 0.02 0.")
205 Force [lbf] Chapter 6. Elastic-Plastic Buckling of Cellular Core due to Transverse Compression displacement curve comparison between the two modeling approaches is shown in Figure Figure 6-43: Deformed Shape Comparison (2D vs. 3D elements) 12 Load vs. Z Displacement D Elements 3D Elements Z Displacement [inch] Figure 6-44: Load vs. Z Displacement Comparison (2D vs. 3D elements) 184
Computational Analysis for Composites
 Computational Analysis for Composites Professor Johann Sienz and Dr. Tony Murmu Swansea University July, 011 The topics covered include: OUTLINE Overview of composites and their applications Micromechanics
Dynamic Response Of Laminated Composite Shells Subjected To Impulsive Loads
 IOSR Journal of Mechanical and Civil Engineering (IOSR-JMCE) e-issn: 2278-1684,p-ISSN: 2320-334X, Volume 14, Issue 3 Ver. I (May. - June. 2017), PP 108-123 www.iosrjournals.org Dynamic Response Of Laminated
INTERNATIONAL JOURNAL OF APPLIED ENGINEERING RESEARCH, DINDIGUL Volume 2, No 1, 2011
 Interlaminar failure analysis of FRP cross ply laminate with elliptical cutout Venkateswara Rao.S 1, Sd. Abdul Kalam 1, Srilakshmi.S 1, Bala Krishna Murthy.V 2 1 Mechanical Engineering Department, P. V.
INTRODUCTION TO THE EXPLICIT FINITE ELEMENT METHOD FOR NONLINEAR TRANSIENT DYNAMICS
 INTRODUCTION TO THE EXPLICIT FINITE ELEMENT METHOD FOR NONLINEAR TRANSIENT DYNAMICS SHEN R. WU and LEI GU WILEY A JOHN WILEY & SONS, INC., PUBLICATION ! PREFACE xv PARTI FUNDAMENTALS 1 1 INTRODUCTION 3
Generic Strategies to Implement Material Grading in Finite Element Methods for Isotropic and Anisotropic Materials
 University of Nebraska - Lincoln DigitalCommons@University of Nebraska - Lincoln Engineering Mechanics Dissertations & Theses Mechanical & Materials Engineering, Department of Winter 12-9-2011 Generic
Size Effects In the Crushing of Honeycomb Structures
 45th AIAA/ASME/ASCE/AHS/ASC Structures, Structural Dynamics & Materials Conference 19-22 April 2004, Palm Springs, California AIAA 2004-1640 Size Effects In the Crushing of Honeycomb Structures Erik C.
A HIGHER-ORDER BEAM THEORY FOR COMPOSITE BOX BEAMS
 A HIGHER-ORDER BEAM THEORY FOR COMPOSITE BOX BEAMS A. Kroker, W. Becker TU Darmstadt, Department of Mechanical Engineering, Chair of Structural Mechanics Hochschulstr. 1, D-64289 Darmstadt, Germany kroker@mechanik.tu-darmstadt.de,
Composite Sandwich Structures with Honeycomb Core subjected to Impact
 Clemson University TigerPrints All Theses Theses 12-212 Composite Sandwich Structures with Honeycomb Core subjected to Impact Lei He Clemson University, he6@clemson.edu Follow this and additional works
Mechanics of Irregular Honeycomb Structures
 Mechanics of Irregular Honeycomb Structures S. Adhikari 1, T. Mukhopadhyay 1 Chair of Aerospace Engineering, College of Engineering, Swansea University, Singleton Park, Swansea SA2 8PP, UK Sixth International
Lecture 4 Honeycombs Notes, 3.054
 Honeycombs-In-plane behavior Lecture 4 Honeycombs Notes, 3.054 Prismatic cells Polymer, metal, ceramic honeycombs widely available Used for sandwich structure cores, energy absorption, carriers for catalysts
International Journal for Ignited Minds (IJIMIINDS) Design and Analysis of Effect of Core Thickness in UAV Wing
 Design and Analysis of Effect of Core Thickness in UAV Wing") International Journal for Ignited Minds (IJIMIINDS) Design and Analysis of Effect of Core Thickness in UAV Wing Puttappa H R 1, Ravi Prakash M 2 & Madhusudhan Reddy 3 1 P G Scholar, Dept of Mechanical
International Journal for Ignited Minds (IJIMIINDS) Design and Analysis of Effect of Core Thickness in UAV Wing Puttappa H R 1, Ravi Prakash M 2 & Madhusudhan Reddy 3 1 P G Scholar, Dept of Mechanical
The numerical simulation research of an Ultra-Light Photovoltaic Cell multilayer composite structure
 5th International Conference on Civil, Architectural and Hydraulic Engineering (ICCAHE 2016) The numerical simulation research of an Ultra-Light Photovoltaic Cell multilayer composite structure Kangwen
Homework No. 1 MAE/CE 459/559 John A. Gilbert, Ph.D. Fall 2004
 Homework No. 1 MAE/CE 459/559 John A. Gilbert, Ph.D. 1. A beam is loaded as shown. The dimensions of the cross section appear in the insert. the figure. Draw a complete free body diagram showing an equivalent
SANDWICH COMPOSITE BEAMS for STRUCTURAL APPLICATIONS
 SANDWICH COMPOSITE BEAMS for STRUCTURAL APPLICATIONS de Aguiar, José M., josemaguiar@gmail.com Faculdade de Tecnologia de São Paulo, FATEC-SP Centro Estadual de Educação Tecnológica Paula Souza. CEETEPS
Open Access Prediction on Deflection of V-core Sandwich Panels in Weak Direction
 Send Orders for Reprints to reprints@benthamscience.net The Open Ocean Engineering Journal, 2013, 6, Suppl-1, M5) 73-81 73 Open Access Prediction on Deflection of V-core Sandwich Panels in Weak Direction
Table of Contents. Preface...xvii. Part 1. Level
 Preface...xvii Part 1. Level 1... 1 Chapter 1. The Basics of Linear Elastic Behavior... 3 1.1. Cohesion forces... 4 1.2. The notion of stress... 6 1.2.1. Definition... 6 1.2.2. Graphical representation...
VIBRATION AND ACOUSTIC PROPERTIES OF HONEYCOMB SANDWICH STRUCTURES SUBJECT TO VARIABLE INCIDENT PLANE-WAVE ANGLE PRESSURE LOADS
 Clemson University TigerPrints All Theses Theses 5-2013 VIBRATION AND ACOUSTIC PROPERTIES OF HONEYCOMB SANDWICH STRUCTURES SUBJECT TO VARIABLE INCIDENT PLANE-WAVE ANGLE PRESSURE LOADS Jiaxue Yan Clemson
FINITE ELEMENT ANALYSIS OF COMPOSITE MATERIALS
 FINITE ELEMENT ANALYSIS OF COMPOSITE MATERIALS Ever J. Barbero Department of Mechanical and Aerospace Engineering West Virginia University USA CRC Press Taylor &.Francis Group Boca Raton London New York
Accepted Manuscript. R.C. Batra, J. Xiao S (12) Reference: COST Composite Structures. To appear in:
 Reference: COST Composite Structures. To appear in:") Accepted Manuscript Finite deformations of curved laminated St. Venant-Kirchhoff beam using layerwise third order shear and normal deformable beam theory (TSNDT) R.C. Batra, J. Xiao PII: S0263-8223(12)00486-2
Accepted Manuscript Finite deformations of curved laminated St. Venant-Kirchhoff beam using layerwise third order shear and normal deformable beam theory (TSNDT) R.C. Batra, J. Xiao PII: S0263-8223(12)00486-2
Stress-strain response and fracture behaviour of plain weave ceramic matrix composites under uni-axial tension, compression or shear
 Xi an 2-25 th August 217 Stress-strain response and fracture behaviour of plain weave ceramic matrix composites under uni-axial tension compression or shear Heyin Qi 1 Mingming Chen 2 Yonghong Duan 3 Daxu
BIAXIAL STRENGTH INVESTIGATION OF CFRP COMPOSITE LAMINATES BY USING CRUCIFORM SPECIMENS
 BIAXIAL STRENGTH INVESTIGATION OF CFRP COMPOSITE LAMINATES BY USING CRUCIFORM SPECIMENS H. Kumazawa and T. Takatoya Airframes and Structures Group, Japan Aerospace Exploration Agency 6-13-1, Ohsawa, Mitaka,
VIBRATION AND DAMPING ANALYSIS OF FIBER REINFORCED COMPOSITE MATERIAL CONICAL SHELLS
 VIBRATION AND DAMPING ANALYSIS OF FIBER REINFORCED COMPOSITE MATERIAL CONICAL SHELLS Mechanical Engineering Department, Indian Institute of Technology, New Delhi 110 016, India (Received 22 January 1992,
International Journal of Advanced Engineering Technology E-ISSN
 Research Article INTEGRATED FORCE METHOD FOR FIBER REINFORCED COMPOSITE PLATE BENDING PROBLEMS Doiphode G. S., Patodi S. C.* Address for Correspondence Assistant Professor, Applied Mechanics Department,
GLOBAL AND LOCAL LINEAR BUCKLING BEHAVIOR OF A CHIRAL CELLULAR STRUCTURE
 GLOBAL AND LOCAL LINEAR BUCKLING BEHAVIOR OF A CHIRAL CELLULAR STRUCTURE Alessandro Spadoni, Massimo Ruzzene School of Aerospace Engineering Georgia Institute of Technology Atlanta, GA 30332 Fabrizio Scarpa
Lecture #10: Anisotropic plasticity Crashworthiness Basics of shell elements
 Lecture #10: 151-0735: Dynamic behavior of materials and structures Anisotropic plasticity Crashworthiness Basics of shell elements by Dirk Mohr ETH Zurich, Department of Mechanical and Process Engineering,
Mechanical Properties of Materials
 Mechanical Properties of Materials Strains Material Model Stresses Learning objectives Understand the qualitative and quantitative description of mechanical properties of materials. Learn the logic of
Esben Byskov. Elementary Continuum. Mechanics for Everyone. With Applications to Structural Mechanics. Springer
 Esben Byskov Elementary Continuum Mechanics for Everyone With Applications to Structural Mechanics Springer Contents Preface v Contents ix Introduction What Is Continuum Mechanics? "I Need Continuum Mechanics
KINK BAND FORMATION OF FIBER REINFORCED POLYMER (FRP)
") KINK BAND FORMATION OF FIBER REINFORCED POLYMER (FRP) 1 University of Science & Technology Beijing, China, niukm@ustb.edu.cn 2 Tsinghua University, Department of Engineering Mechanics, Beijing, China,
KINK BAND FORMATION OF FIBER REINFORCED POLYMER (FRP) 1 University of Science & Technology Beijing, China, niukm@ustb.edu.cn 2 Tsinghua University, Department of Engineering Mechanics, Beijing, China,
FINITE ELEMENT ANALYSIS OF EFFECTIVE MECHANICAL PROPERTIES, VIBRATION AND ACOUSTIC PERFORMANCE OF AUXETIC CHIRAL CORE SANDWICH STRUCTURES
 Clemson University TigerPrints All Theses Theses 8-2013 FINITE ELEMENT ANALYSIS OF EFFECTIVE MECHANICAL PROPERTIES, VIBRATION AND ACOUSTIC PERFORMANCE OF AUXETIC CHIRAL CORE SANDWICH STRUCTURES Hrishikesh
Macroscopic Elastic Constitutive Relationship of Cast-in-Place Hollow-Core Slabs
 Macroscopic Elastic Constitutive Relationship of Cast-in-Place Hollow-Core Slabs Jing-Zhong Xie 1 Abstract: The macroscopic Poisson ratio and elastic moduli of the cast-in-place hollow-core slab are researched
Optimization for heat and sound insulation of honeycomb sandwich panel in thermal environments
 Optimization for heat and sound insulation of honeycomb sandwich panel in thermal environments Jinlong Yuan 1, Haibo Chen 2, Qiang Zhong 3, Kongjuan Li 4 Department of Modern mechanics, University of Science
Dynamic analysis of Composite Micro Air Vehicles
 Dynamic analysis of Composite Micro Air Vehicles Shishir Kr. Sahu Professor and Head, Civil Engineering, National Institute of Technology, Rourkela, India E-mail: sksahu@nitrkl.ac.in ABSTRACT The present
EXPERIMENTAL AND NUMERICAL STUDY OF OBLIQUE IMPACT ON HELICOPTER BLADES INFLUENCE OF THE CURVATURE
 EXPERIMENTAL AND NUMERICAL STUDY OF OBLIQUE IMPACT ON HELICOPTER BLADES INFLUENCE OF THE CURVATURE F. Pascal a, P. Navarro a*, S. Marguet a, J.F. Ferrero a, J. Aubry b, S. Lemaire b a Université de Toulouse,
XI. NANOMECHANICS OF GRAPHENE
 XI. NANOMECHANICS OF GRAPHENE Carbon is an element of extraordinary properties. The carbon-carbon bond possesses large magnitude cohesive strength through its covalent bonds. Elemental carbon appears in
FLEXIBILITY METHOD FOR INDETERMINATE FRAMES
 UNIT - I FLEXIBILITY METHOD FOR INDETERMINATE FRAMES 1. What is meant by indeterminate structures? Structures that do not satisfy the conditions of equilibrium are called indeterminate structure. These
ME Final Exam. PROBLEM NO. 4 Part A (2 points max.) M (x) y. z (neutral axis) beam cross-sec+on. 20 kip ft. 0.2 ft. 10 ft. 0.1 ft.
 M (x) y. z (neutral axis) beam cross-sec+on. 20 kip ft. 0.2 ft. 10 ft. 0.1 ft.") ME 323 - Final Exam Name December 15, 2015 Instructor (circle) PROEM NO. 4 Part A (2 points max.) Krousgrill 11:30AM-12:20PM Ghosh 2:30-3:20PM Gonzalez 12:30-1:20PM Zhao 4:30-5:20PM M (x) y 20 kip ft 0.2
ME 323 - Final Exam Name December 15, 2015 Instructor (circle) PROEM NO. 4 Part A (2 points max.) Krousgrill 11:30AM-12:20PM Ghosh 2:30-3:20PM Gonzalez 12:30-1:20PM Zhao 4:30-5:20PM M (x) y 20 kip ft 0.2
ENGN 2340 Final Project Report. Optimization of Mechanical Isotropy of Soft Network Material
 ENGN 2340 Final Project Report Optimization of Mechanical Isotropy of Soft Network Material Enrui Zhang 12/15/2017 1. Introduction of the Problem This project deals with the stress-strain response of a
Name :. Roll No. :... Invigilator s Signature :.. CS/B.TECH (CE-NEW)/SEM-3/CE-301/ SOLID MECHANICS
/SEM-3/CE-301/ SOLID MECHANICS") Name :. Roll No. :..... Invigilator s Signature :.. 2011 SOLID MECHANICS Time Allotted : 3 Hours Full Marks : 70 The figures in the margin indicate full marks. Candidates are required to give their answers
Name :. Roll No. :..... Invigilator s Signature :.. 2011 SOLID MECHANICS Time Allotted : 3 Hours Full Marks : 70 The figures in the margin indicate full marks. Candidates are required to give their answers
SIZE EFFECTS IN THE COMPRESSIVE CRUSHING OF HONEYCOMBS
 43rd AIAA/ASME/ASCE/AHS/ASC Structures, Structural Dynamics, and Materials Con 22-25 April 2002, Denver, Colorado SIZE EFFECTS IN THE COMPRESSIVE CRUSHING OF HONEYCOMBS Erik C. Mellquistand Anthony M.
BUCKLING COEFFICIENTS FOR SIMPLY SUPPORTED, FLAT, RECTANGULAR SANDWICH PANELS UNDER BIAXIAL COMPRESSION
 U. S. FOREST SERVICE RESEARCH PAPER FPL 135 APRIL 1970 BUCKLING COEFFICIENTS FOR SIMPLY SUPPORTED, FLAT, RECTANGULAR SANDWICH PANELS UNDER BIAXIAL COMPRESSION FOREST PRODUCTS LABORATORY, FOREST SERVICE
Influence of residual stresses in the structural behavior of. tubular columns and arches. Nuno Rocha Cima Gomes
 October 2014 Influence of residual stresses in the structural behavior of Abstract tubular columns and arches Nuno Rocha Cima Gomes Instituto Superior Técnico, Universidade de Lisboa, Portugal Contact:
FLEXURAL RESPONSE OF FIBER RENFORCED PLASTIC DECKS USING HIGHER-ORDER SHEAR DEFORMABLE PLATE THEORY
 Asia-Pacific Conference on FRP in Structures (APFIS 2007) S.T. Smith (ed) 2007 International Institute for FRP in Construction FLEXURAL RESPONSE OF FIBER RENFORCED PLASTIC DECKS USING HIGHER-ORDER SHEAR
Nomenclature. Length of the panel between the supports. Width of the panel between the supports/ width of the beam
 omenclature a b c f h Length of the panel between the supports Width of the panel between the supports/ width of the beam Sandwich beam/ panel core thickness Thickness of the panel face sheet Sandwich
Indentation Energy in Bending of Sandwich Beams with Composite Laminated Faces and Foam Core
 Indentation Energy in Bending of Sandwich Beams with Composite Laminated Faces and Foam Core M. SADIGHI, H. POURIAYEVALI, and M. SAADATI Dept. of Mechanical Engineering, Amirkabir University of Tech, Tehran,
ISSN: ISO 9001:2008 Certified International Journal of Engineering Science and Innovative Technology (IJESIT) Volume 2, Issue 4, July 2013
 Volume 2, Issue 4, July 2013") Delamination Studies in Fibre-Reinforced Polymer Composites K.Kantha Rao, Dr P. Shailesh, K. Vijay Kumar 1 Associate Professor, Narasimha Reddy Engineering College Hyderabad. 2 Professor, St. Peter s Engineering
Delamination Studies in Fibre-Reinforced Polymer Composites K.Kantha Rao, Dr P. Shailesh, K. Vijay Kumar 1 Associate Professor, Narasimha Reddy Engineering College Hyderabad. 2 Professor, St. Peter s Engineering
Static & Dynamic. Analysis of Structures. Edward L.Wilson. University of California, Berkeley. Fourth Edition. Professor Emeritus of Civil Engineering
 Static & Dynamic Analysis of Structures A Physical Approach With Emphasis on Earthquake Engineering Edward LWilson Professor Emeritus of Civil Engineering University of California, Berkeley Fourth Edition
EXPERIMENTAL AND FINITE ELEMENT ANALYSIS OF MULTILAYERED HONEYCOMB COMPOSITE MATERIAL SUBJECT TO STATIC LOADING
 U.P.B. Sci. Bull., Series B, Vol. 79, Iss. 3, 2017 ISSN 1454-2331 EXPERIMENTAL AND FINITE ELEMENT ANALYSIS OF MULTILAYERED HONEYCOMB COMPOSITE MATERIAL SUBJECT TO STATIC LOADING Cormos RAUL 1, Horia-Alexandru
Experimental Study and Numerical Simulation on Steel Plate Girders With Deep Section
 6 th International Conference on Advances in Experimental Structural Engineering 11 th International Workshop on Advanced Smart Materials and Smart Structures Technology August 1-2, 2015, University of
DRAPING SIMULATION. Recent achievements and future trends. Dr. Sylvain Bel LGCIE University Lyon 1
 DRAPING SIMULATION Recent achievements and future trends 1 Dr. Sylvain Bel LGCIE University Lyon 1 2 DRAPING SIMULATION Why? How? What? DRAPING SIMULATION WHY? Clamps Punch Fabric Die 1 2 Resin 3 4 Fig.
Chapter 3. Load and Stress Analysis
 Chapter 3 Load and Stress Analysis 2 Shear Force and Bending Moments in Beams Internal shear force V & bending moment M must ensure equilibrium Fig. 3 2 Sign Conventions for Bending and Shear Fig. 3 3
Multi Disciplinary Delamination Studies In Frp Composites Using 3d Finite Element Analysis Mohan Rentala
 Multi Disciplinary Delamination Studies In Frp Composites Using 3d Finite Element Analysis Mohan Rentala Abstract: FRP laminated composites have been extensively used in Aerospace and allied industries
STRESS STRAIN AND DEFORMATION OF SOLIDS, STATES OF STRESS
 1 UNIT I STRESS STRAIN AND DEFORMATION OF SOLIDS, STATES OF STRESS 1. Define: Stress When an external force acts on a body, it undergoes deformation. At the same time the body resists deformation. The
A Suggested Analytical Solution for Vibration of Honeycombs Sandwich Combined Plate Structure
 International Journal of Mechanical & Mechatronics Engineering IJMME-IJENS Vol:16 No:04 9 A Suggested Analytical Solution for Vibration of Honeycombs Sandwich Combined Plate Structure Muhsin J. Jweeg College
Comparison of Ply-wise Stress-Strain results for graphite/epoxy laminated plate subjected to in-plane normal loads using CLT and ANSYS ACP PrepPost
 Comparison of Ply-wise Stress-Strain results for graphite/epoxy laminated plate subjected to in-plane normal loads using CLT and ANSYS ACP PrepPost 1 Mihir A. Mehta, 2 Satyen D. Ramani 1 PG Student, Department
TESTING AND ANALYSIS OF COMPOSITE SANDWICH BEAMS
 TESTING AND ANALYSIS OF COMPOSITE SANDWICH BEAMS I. M. Daniel, J. L. Abot, and K. A. Wang Walter P. Murphy Professor, Departments of Civil and Mechanical Engineering, Robert R. McCormick School of Engineering
Open-hole compressive strength prediction of CFRP composite laminates
 Open-hole compressive strength prediction of CFRP composite laminates O. İnal 1, A. Ataş 2,* 1 Department of Mechanical Engineering, Balikesir University, Balikesir, 10145, Turkey, inal@balikesir.edu.tr
Mechanical Behavior of Circular Composite Springs with Extended Flat Contact Surfaces
 Mechanical Behavior of Circular Composite Springs with Extended Flat Contact Surfaces Ping-Cheung Tse epartment of Mechanical Engineering, The Hong Kong Polytechnic University, Hunghom, Kowloon, Hong Kong
Modelling the nonlinear shear stress-strain response of glass fibrereinforced composites. Part II: Model development and finite element simulations
 Modelling the nonlinear shear stress-strain response of glass fibrereinforced composites. Part II: Model development and finite element simulations W. Van Paepegem *, I. De Baere and J. Degrieck Ghent
Constitutive model for quasi-static deformation of metallic sandwich cores
 INTERNATIONAL JOURNAL FOR NUMERICAL METHODS IN ENGINEERING Int. J. Numer. Meth. Engng 2004; 61:2205 2238 Published online 18 October 2004 in Wiley InterScience (www.interscience.wiley.com). DOI: 10.1002/nme.1142
DYNAMIC MODELING OF SPOT WELDS USING THIN LAYER INTERFACE THEORY
 Hamid Ahmadian: 1 DYNAMIC MODELING OF SPOT WELDS USING THIN LAYER INTERFACE THEORY H. Ahmadian 1, H. Jalali 1, JE Mottershead 2, MI Friswell 3 1 Iran University of Science and Technology, Faculty of Mechanical
ELASTICITY AND FRACTURE MECHANICS. Vijay G. Ukadgaonker
 THEORY OF ELASTICITY AND FRACTURE MECHANICS y x Vijay G. Ukadgaonker Theory of Elasticity and Fracture Mechanics VIJAY G. UKADGAONKER Former Professor Indian Institute of Technology Bombay Delhi-110092
Members Subjected to Torsional Loads
 Members Subjected to Torsional Loads Torsion of circular shafts Definition of Torsion: Consider a shaft rigidly clamped at one end and twisted at the other end by a torque T = F.d applied in a plane perpendicular
The Finite Element Method for Solid and Structural Mechanics
 The Finite Element Method for Solid and Structural Mechanics Sixth edition O.C. Zienkiewicz, CBE, FRS UNESCO Professor of Numerical Methods in Engineering International Centre for Numerical Methods in
University of Sheffield The development of finite elements for 3D structural analysis in fire
 The development of finite elements for 3D structural analysis in fire Chaoming Yu, I. W. Burgess, Z. Huang, R. J. Plank Department of Civil and Structural Engineering StiFF 05/09/2006 3D composite structures
Lecture 16-17, Sandwich Panel Notes, 3.054
 Sandwich Panels Two stiff strong skins separated by a lightweight core Separation of skins by core increases moment of inertia, with little increase in weight Efficient for resisting bending and buckling
Optimum Height of Plate Stiffener under Pressure Effect
 The st Regional Conference of Eng. Sci. NUCEJ Spatial ISSUE vol., No.3, 8 pp 459-468 Optimum Height of Plate Stiffener under Pressure Effect Mazin Victor Yousif M.Sc Production Engineering University of
MECHANICS OF MATERIALS
 Third E CHAPTER 2 Stress MECHANICS OF MATERIALS Ferdinand P. Beer E. Russell Johnston, Jr. John T. DeWolf Lecture Notes: J. Walt Oler Texas Tech University and Strain Axial Loading Contents Stress & Strain:
Tuesday, February 11, Chapter 3. Load and Stress Analysis. Dr. Mohammad Suliman Abuhaiba, PE
 1 Chapter 3 Load and Stress Analysis 2 Chapter Outline Equilibrium & Free-Body Diagrams Shear Force and Bending Moments in Beams Singularity Functions Stress Cartesian Stress Components Mohr s Circle for
Failure analysis of serial pinned joints in composite materials
 Indian Journal of Engineering & Materials Sciences Vol. 18, April 2011, pp. 102-110 Failure analysis of serial pinned joints in composite materials Alaattin Aktaş* Department of Mechanical Engineering,
Modeling the elastic properties of paper honeycomb panels using the finite element method
 Proceedings of the XXVI th International Conference Research for Furniture Industry Modeling the elastic properties of paper honeycomb panels using the finite element method Viktor UTASSY, Levente DÉNES
ANALYTICAL SOLUTIONS USING HIGH ORDER COMPOSITE LAMINATE THEORY FOR HONEYCOMB SANDWICH PLATES WITH VISCOELASTIC FREQUENCY DEPENDENT DAMPING
 Clemson University TigerPrints All Theses Theses 8-11 ANALYTICAL SOLUTIONS USING HIGH ORDER COMPOSITE LAMINATE THEORY FOR HONEYCOMB SANDWICH PLATES WITH VISCOELASTIC FREQUENCY DEPENDENT DAMPING Nan Shan
A Study on the Tube of Integral Propeller Shaft for the Rear-wheel Drive Automobile Using Carbon Composite Fiber
 A Study on the Tube of Integral Propeller Shaft for the Rear-wheel Drive Automobile Using Carbon Composite Fiber Kibong Han Mechatronics Department, Jungwon University, 85 Munmu-ro, Goesan-gun, South Korea.
CHAPTER 14 BUCKLING ANALYSIS OF 1D AND 2D STRUCTURES
 CHAPTER 14 BUCKLING ANALYSIS OF 1D AND 2D STRUCTURES 14.1 GENERAL REMARKS In structures where dominant loading is usually static, the most common cause of the collapse is a buckling failure. Buckling may
Class XI Physics Syllabus One Paper Three Hours Max Marks: 70
 Class XI Physics Syllabus 2013 One Paper Three Hours Max Marks: 70 Class XI Weightage Unit I Physical World & Measurement 03 Unit II Kinematics 10 Unit III Laws of Motion 10 Unit IV Work, Energy & Power
GATE SOLUTIONS E N G I N E E R I N G
 GATE SOLUTIONS C I V I L E N G I N E E R I N G From (1987-018) Office : F-16, (Lower Basement), Katwaria Sarai, New Delhi-110016 Phone : 011-65064 Mobile : 81309090, 9711853908 E-mail: info@iesmasterpublications.com,
FREE VIBRATION ANALYSIS OF THIN CYLINDRICAL SHELLS SUBJECTED TO INTERNAL PRESSURE AND FINITE ELEMENT ANALYSIS
 FREE VIBRATION ANALYSIS OF THIN CYLINDRICAL SHELLS SUBJECTED TO INTERNAL PRESSURE AND FINITE ELEMENT ANALYSIS J. Kandasamy 1, M. Madhavi 2, N. Haritha 3 1 Corresponding author Department of Mechanical
Calibration and Experimental Validation of LS-DYNA Composite Material Models by Multi Objective Optimization Techniques
 9 th International LS-DYNA Users Conference Optimization Calibration and Experimental Validation of LS-DYNA Composite Material Models by Multi Objective Optimization Techniques Stefano Magistrali*, Marco
Module-6: Laminated Composites-II. Learning Unit-1: M6.1. M 6.1 Structural Mechanics of Laminates
 Module-6: Laminated Composites-II Learning Unit-1: M6.1 M 6.1 Structural Mechanics of Laminates Classical Lamination Theory: Laminate Stiffness Matrix To this point in the development of classical lamination
International Journal of Innovative Research in Science, Engineering and Technology Vol. 2, Issue 7, July 2013
 ANALYSIS AND MITIGATION OF STRESS CONCENTRATION FACTOR OF A RECTANGULAR ISOTROPIC AND ORTHOTROPIC PLATE WITH CENTRAL CIRCULAR HOLE SUBJECTED TO INPLANE STATIC LOADING BY DESIGN OPTIMIZATION Shubhrata Nagpal
MEG 741 Energy and Variational Methods in Mechanics I
 MEG 741 Energy and Variational Methods in Mechanics I Brendan J. O Toole, Ph.D. Associate Professor of Mechanical Engineering Howard R. Hughes College of Engineering University of Nevada Las Vegas TBE
Using MATLAB and. Abaqus. Finite Element Analysis. Introduction to. Amar Khennane. Taylor & Francis Croup. Taylor & Francis Croup,
 Introduction to Finite Element Analysis Using MATLAB and Abaqus Amar Khennane Taylor & Francis Croup Boca Raton London New York CRC Press is an imprint of the Taylor & Francis Croup, an informa business
Capability Assessment of Finite Element Software in Predicting the Last Ply Failure of Composite Laminates
 Available online at www.sciencedirect.com Procedia Engineering 41 (2012 ) 1647 1653 International Symposium on Robotics and Intelligent Sensors 2012 (IRIS 2012) Capability Assessment of Finite Element
QUESTION BANK SEMESTER: III SUBJECT NAME: MECHANICS OF SOLIDS
 QUESTION BANK SEMESTER: III SUBJECT NAME: MECHANICS OF SOLIDS UNIT 1- STRESS AND STRAIN PART A (2 Marks) 1. Define longitudinal strain and lateral strain. 2. State Hooke s law. 3. Define modular ratio,
EDEM DISCRETIZATION (Phase II) Normal Direction Structure Idealization Tangential Direction Pore spring Contact spring SPRING TYPES Inner edge Inner d
 Normal Direction Structure Idealization Tangential Direction Pore spring Contact spring SPRING TYPES Inner edge Inner d") Institute of Industrial Science, University of Tokyo Bulletin of ERS, No. 48 (5) A TWO-PHASE SIMPLIFIED COLLAPSE ANALYSIS OF RC BUILDINGS PHASE : SPRING NETWORK PHASE Shanthanu RAJASEKHARAN, Muneyoshi
Institute of Industrial Science, University of Tokyo Bulletin of ERS, No. 48 (5) A TWO-PHASE SIMPLIFIED COLLAPSE ANALYSIS OF RC BUILDINGS PHASE : SPRING NETWORK PHASE Shanthanu RAJASEKHARAN, Muneyoshi
Finite Element Analysis of Buckling of Corrugated Fiberboard
 Send Orders for Reprints to reprints@benthamscience.ae The Open Mechanical Engineering Journal, 2014, 8, 257-263 257 Finite Element Analysis of Buckling of Corrugated Fiberboard Yali Ma *,1, Zhen Gong
Chapter 2: Rigid Bar Supported by Two Buckled Struts under Axial, Harmonic, Displacement Excitation..14
 Table of Contents Chapter 1: Research Objectives and Literature Review..1 1.1 Introduction...1 1.2 Literature Review......3 1.2.1 Describing Vibration......3 1.2.2 Vibration Isolation.....6 1.2.2.1 Overview.
Prediction of Elastic Constants on 3D Four-directional Braided
 Prediction of Elastic Constants on 3D Four-directional Braided Composites Prediction of Elastic Constants on 3D Four-directional Braided Composites Liang Dao Zhou 1,2,* and Zhuo Zhuang 1 1 School of Aerospace,
NON-LINEAR BEHAVIOUR OF FOAM CORED CURVED SANDWICH PANELS SUBJECTED TO THERMO- MECHANICAL LOADING
 Included in ONR sessions organized by Yapa D.S. Rajapakse NON-LINEAR BEHAVIOUR OF FOAM CORED CURVED SANDWICH PANELS SUBJECTED TO THERMO- MECHANICAL LOADING O. T. Thomsen 1) and Y. Frostig 2) 1) Department
MODELLING OF THE BEHAVIOUR OF ARAMID FOLDED CORES UP TO GLOBAL CRUSHING
 MODELLING OF THE BEHAVIOUR OF ARAMID FOLDED CORES UP TO GLOBAL CRUSHING E. Baranger, C. Cluzel, P.-A. Guidault, O. Allix LMT-Cachan (ENS Cachan/CNRS/UPMC/PRES UniverSud Paris) 61 av. du Président Wilson,
FOLDING AND DEPLOYMENT OF ULTRA-THIN COMPOSITE STRUCTURES
 FOLDING AND DEPLOYMENT OF ULTRA-THIN COMPOSITE STRUCTURES H.M.Y.C. Mallikarachchi (1), S. Pellegrino (2) (1) University of Cambridge Department of Engineering, Trumpington Street, Cambridge CB2 1PZ, U.K.
DYNAMIC RESPONSE OF SYNTACTIC FOAM CORE SANDWICH USING A MULTIPLE SCALES BASED ASYMPTOTIC METHOD
 ECCM6-6 TH EUROPEAN CONFERENCE ON COMPOSITE MATERIALS, Seville, Spain, -6 June 4 DYNAMIC RESPONSE OF SYNTACTIC FOAM CORE SANDWICH USING A MULTIPLE SCALES BASED ASYMPTOTIC METHOD K. V. Nagendra Gopal a*,
QUESTION BANK Composite Materials
 QUESTION BANK Composite Materials 1. Define composite material. 2. What is the need for composite material? 3. Mention important characterits of composite material 4. Give examples for fiber material 5.
MECHANICS OF MATERIALS
 Third CHTR Stress MCHNICS OF MTRIS Ferdinand. Beer. Russell Johnston, Jr. John T. DeWolf ecture Notes: J. Walt Oler Texas Tech University and Strain xial oading Contents Stress & Strain: xial oading Normal
Gerald Allen Cohen, 83, passed away Oct. 1, 2014, at his home in Laguna Beach.
 Dr Gerald Allen Cohen (1931-2014) Ring-stiffened shallow conical shell designed with the use of FASOR for NASA s Viking project in the 1970s. (from NASA TN D-7853, 1975, by Walter L. Heard, Jr., Melvin
Estimation of the Residual Stiffness of Fire-Damaged Concrete Members
 Copyright 2011 Tech Science Press CMC, vol.22, no.3, pp.261-273, 2011 Estimation of the Residual Stiffness of Fire-Damaged Concrete Members J.M. Zhu 1, X.C. Wang 1, D. Wei 2, Y.H. Liu 2 and B.Y. Xu 2 Abstract:
NUMERICAL ANALYSIS OF SANDWICH PANELS SUBJECTED TO POINT LOADS
 ECCOMAS Congress 216 VII European Congress on Computational Methods in Applied Sciences and Engineering M. Papadrakakis, V. Papadopoulos, G. Stefanou, V. Plevris (eds.) Crete Island, Greece, 5 1 June 216
Numerical simulation of the coil spring and investigation the impact of tension and compression to the spring natural frequencies
 Numerical simulation of the coil spring and investigation the impact of tension and compression to the spring natural frequencies F. D. Sorokin 1, Zhou Su 2 Bauman Moscow State Technical University, Moscow,
Exercise: concepts from chapter 8
 Reading: Fundamentals of Structural Geology, Ch 8 1) The following exercises explore elementary concepts associated with a linear elastic material that is isotropic and homogeneous with respect to elastic
SEMM Mechanics PhD Preliminary Exam Spring Consider a two-dimensional rigid motion, whose displacement field is given by
 SEMM Mechanics PhD Preliminary Exam Spring 2014 1. Consider a two-dimensional rigid motion, whose displacement field is given by u(x) = [cos(β)x 1 + sin(β)x 2 X 1 ]e 1 + [ sin(β)x 1 + cos(β)x 2 X 2 ]e
COMPRESSIVE BEHAVIOR OF IMPACT DAMAGED COMPOSITE LAMINATES
 16 TH INTERNATIONAL CONFERENCE ON COMPOSITE MATERIALS COMPRESSIVE BEHAVIOR OF IMPACT DAMAGED COMPOSITE LAMINATES Hiroshi Suemasu*, Wataru Sasaki**, Yuuichiro Aoki***, Takashi Ishikawa**** *Department of