The Further Mathematics Support Programme
|
|
|
- Tamsyn Hoover
- 5 years ago
- Views:
Transcription
1
2 The Further Mathematics Support Programme Our aim is to increase the uptake of AS and A level Further Mathematics to ensure that more students reach their potential in mathematics. The FMSP works closely with school/college maths departments to provide professional development opportunities for teachers and maths promotion events for students. To find out more please visit
3 A level Mathematics: what s new in Statistics
4 Outline of meeting 1600 Introduction what s new Significance and hypothesis testing with the binomial distribution 1645 Tea 1705 Normal distribution and hypothesis testing 1740 Large data sets, sampling and accredited questions 1800 Close
5 Introduction Aims: To meet the major new topics at AS and A level Mathematics To understand how teaching may need to change to met the change in examining ethos To try some activities which can be used in the classroom

6
7 The Joy of Stats - Hans Rosling How could this video change the way people look at statistics? this is part of an hour long program available on YouTube; other presentations are on TED worth a look!
8 BIG data
9 Content - General The new content is designed to build on the new GCSE content Content is 100% specified for Mathematics and 50% specified for Further Mathematics Mechanics and Statistics element is prescribed at both AS and full A level
10 What s new? Large data sets Hypothesis testing at AS for all awarding bodies A new ethos around what statistics means at A level Calculations Use of technology Interpretation No tables use calculators instead

11 Statistics Content
12 Statistics Content

13 Statistics Content
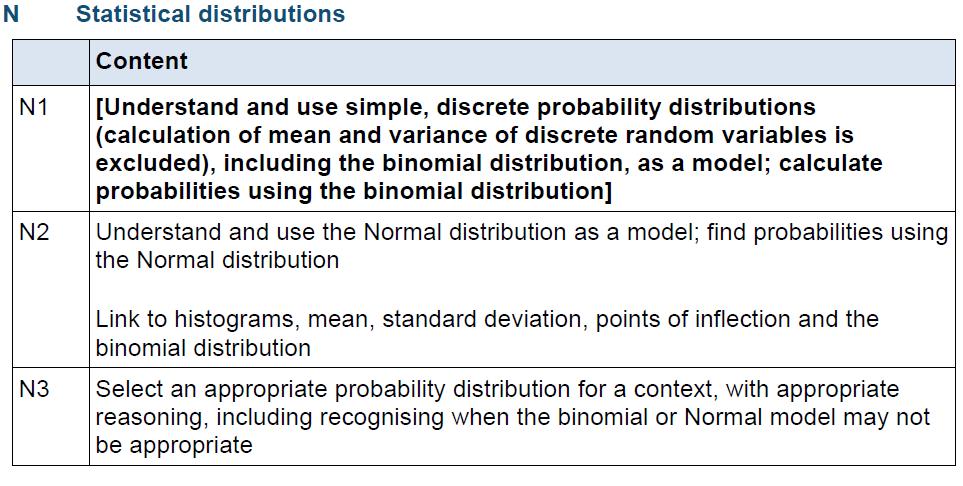
14 Statistics Content

15 Statistics Content
16 Comparison with S1 content S1 topics (current specifications) Edexcel AQA OCR MEI Representation of Data in graphical form Averages and Spread; Outliers and Skewness The laws of Probability; conditional probability Discrete Random Variables The Binomial Distribution Correlation and Regression * The Normal Distribution Sample means; Central Limit theorem Hypothesis testing for the Binomial Distribution
17 Comparison with S1 content Statistics topics in new AS level Edexcel AQA OCR MEI Representation of Data in graphical form S1 S1 S1 S1 Averages and Spread; outliers and Skewness S1 S1 S1 S1 Probability; independence of events S1 S1 S1 S1 Correlation and Regression S1 S1 S1 S1 Discrete Random Variables S1 S1 S1 S1 The Binomial Distribution S2 S1 S1 S1 Hypothesis testing for the Binomial Distribution S2 S2 S2 S1 Methods of sampling S3 S2 S2 S2 Using large data sets; cleaning data
18 Comparison with S1 content Additional Statistics topics in full A level Edexcel AQA OCR MEI Conditional probability; Venn diagrams S1 S1 S1 S1 Probability models for data The Normal Distribution S1 S1 S2 S2 Hypothesis test for the mean of a Normal Distribution S3 S2 S2 S2 Hypothesis tests for correlation coefficient S3 S3 S2 S2
19 A level Mathematics: significance
20 Aims: Appreciate that statistics is not always right or wrong Decide whether a result is statistically significant appreciate how differences in inference can occur

21 Significance The mean time without the catalyst was 28.1 s. The mean time with the catalyst was 27.3 s. So I conclude that the catalyst speeds up the reaction.

22 Catalyst data Scenario A Times without catalyst Mean = 28.1 s Scenario B Times without catalyst Mean = 28.1 s Times with catalyst Mean = 27.3 s Times with catalyst Mean = 27.3 s


23 Being certain In maths you can be sure that some things are always true; you can prove them. If you add two odd numbers you always get an even number. In statistics you cannot be so certain. You collect evidence from a sample, and you come to a conclusion about the population. There is good evidence to suggest that the catalyst speeds up the reaction. There is not enough evidence to suggest that coffee affects coordination.
24 Experimenter bias
25 A level Mathematics: hypothesis testing with the binomial distribution
26 Aims: Calculate binomial distributions Use the binomial distribution as a model Set up a hypothesis test using the binomial distribution Solve problems that relate to the binomial distribution
27 Copyright 2008 AQA and its licensors. All rights reserved. Quiz 1 1. How long did the hundred years war last? A. 92 years B. 100 years C. 108 years D. 116 years 2. Which country makes Panama hats? A. Costa Rica B. Ecuador C. Nicaragua D. Panama 3. From which animal do we get catgut? A. Cats B. Horses C. Sheep D. Sheep and Horses 4. In which month do Russians celebrate the October Revolution? A. September B. October C. November D. December 5. What is a camel's hair brush made of? A. Camel hair B. Dog hair C. Monkey fur D. Squirrel fur Version 1.0
28 Copyright 2008 AQA and its licensors. All rights reserved. Quiz 1 contd. 6. What animal are the Canary Islands in the Pacific named after? A. Canaries B. Dogs C. Cats D. Parrots 7. What was King George VI's first name? A. Albert B. Edward C. George D. Philip 8. What colour is a purple finch? A. Crimson B. Green C. Purple D. Yellow 9. Where are Chinese gooseberries from? A. Australia B. China C. India D. New Zealand 10. What is the colour of the black box in a commercial aeroplane? A. Black B. Brown C. Grey D. Orange Version 1.0
29 Copyright 2008 AQA and its licensors. All rights reserved. Quiz 2 Write down the answers to the following multiple choice Quiz 2 1. A. B. C. D. 2. A. B. C. D. 3. A. B. C. D. 4. A. B. C. D. 5. A. B. C. D. 6. A. B. C. D. 7. A. B. C. D. 8. A. B. C. D. 9. A. B. C. D. 10. A. B. C. D. Version 1.0
30 Copyright 2008 AQA and its licensors. All rights reserved. Quiz answers same for both quizzes Correct answers are: 1. D 2. B 3. D 4. C 5. D 6. B 7. A 8. A 9. D 10. D Count the number of correct answers, r. What do you think the two distributions will look like? Why? Version 1.0
31 Guessing or not? How many questions does someone have to get correct before we can conclude that they are not guessing? Somebody gets 5 questions correct. What evidence do we have to suggest that they are not just guessing? We can use a hypothesis test to make a decision
32 What is a hypothesis test? Let s assume they are guessing. Then we have a probability to work with: P(correct) = ¼ We find the probability of getting 5 questions correct or an even better result. And then decide whether our assumption was reasonable or not.
33 What is a hypothesis test? Start with a null hypothesis: EITHER Use this to calculate the probability of observed data (or more extreme values). This is called the p-value. Reject the null hypothesis if it is very unlikely. OR Find the values which would be very unlikely if the null hypothesis were true. This is called the critical region.
34 What is meant by very unlikely? The measure of very unlikely needs to be chosen before carrying out the hypothesis test. This is to prevent biased decisions. The significance level tells us what we mean by very unlikely it is often 5% but other values (e.g. 1%) are used.
35 Calculating the probability Now we have to work out the probability of getting 5 or more questions correct. You could use this context to introduce the Binomial Distribution to your students, probably immediately after teaching them about Binomial Expansions in Pure, and returning to the hypothesis once they have got to grips with the probabilty.
36 Aside Very quickly, some ideas for introducing the Binomial Distribution, for those who haven t taught it before
37
38
39
40 Binomial probabilities Number of successes Number of failures P(X = r) = n C r x p r x q n r Number of routes through the tree diagram Probability of success Probability of failure
41 What is the question? Here is a probability. Write a question to which this is the answer.
42 5 C 3 x x C 4 x x C 2 x x C 5 x x C 2 x x 0.2 3
43 5 C 0 x C 1 x 0.1 x C 5 x C 4 x x C 6 x C 5 x x C 4 x x C 0 x C 1 x 0.9 x C 2 x x C 8 x C 7 x x 0.6
44 Language Issues Matching Activity Scenario: The probability of winning a game is always 0.6, and there are 8 games left to play. Match any statements that describe the same situation
45 10 questions P(10 correct) = P(9 correct) = P(8 correct) = P(7 correct) = P(6 correct) = P(5 correct) = P(4 correct) = P(3 correct) = P(2 correct) = P(1 correct) = P(0 correct) = How many questions does someone have to get correct before we decide they are not guessing?
46 Using a graphical calculator Using a graphical calculator, work out the probability of getting each possible score from a quiz with 10 questions
47 Using a calculator (a) Probabilities of type P(X = x): Bpd eg B( 15, 0.2) P( X = 3)
48 10 questions P(10 correct) = P(9 correct) = P(8 correct) = P(7 correct) = P(6 correct) = P(5 correct) = P(4 correct) = P(3 correct) = P(2 correct) = P(1 correct) = P(0 correct) = How many questions does someone have to get correct before we decide they are not guessing?
: Bcd eg B( 15, 0.2) P( X 3)")
49 Cumulative probabilities (b) Probabilities of type P(X x): Bcd eg B( 15, 0.2) P( X 3)
50 10 questions P(10 correct) = P(9 or more correct) = P(8 or more correct) = P(7 or morecorrect) = P(6 or more correct) = P(5 or more correct) = P(4 or more correct) = P(3 or more correct) = P(2 or more correct) = P(1 or more correct) = P(0 or more correct) = 1
51 Formalising the hypothesis test Define p State the null hypothesis and alternative hypothesis Describe the distribution if the null hypothesis is true Decide if it is a one-tailed (only large or only small values matter) or twotailed test (both large and small values matter) Find the cumulative probability of the observed value of X and the values more extreme or find the critical region Compare the probability and significance level Decide whether to accept or reject the null hypothesis State the decision in a way that relates to the original situation
52 Say what p stands for State the null hypothesis; (they are guessing) p is the probability of getting a question correct H 0 : p = 0.25 as there are four different options State the alternative hypothesis (they know the answer) Decide what the distribution seen in the sample would be if the null hypothesis is true H 1 : p > 0.25 X~B(10,0.25) where X is the number of questions answered correctly Decide whether large or small values of X (or both) would lead to rejection of null hypothesis Large values of X would lead to rejection of H 0 Find the critical region for a 5% significance level P X 5 = P X 6 = Compare observed value with the critical region Decide whether to accept or reject the null hypo State the decision in a way that relates to the original situation Critical regions is X 6 5 is not in the critical region X= 5 is not in tail of distribution so there is NO EVIDENCE TO REJECT at 5% significance level There is insufficient evidence to suggest this person is not just guessing answers.
53 Say what p stands for State the null hypothesis; (they are guessing) p is the probability of getting a question correct H 0 : p = 0.25 as there are four different options State the alternative hypothesis (they know the answer) Decide what the distribution seen in the sample would be if the null hypothesis is true H 1 : p > 0.25 X~B(10,0.25) where X is the number of questions answered correctly Decide whether large or small values of X (or both) would lead to rejection of null hypothesis Large values of X would lead to rejection of H 0 Find the critical region for a 5% significance level P X 5 = P X 6 = Compare observed value with the critical region Decide whether to accept or reject the null hypo State the decision in a way that relates to the original situation Critical regions is X 6 5 is not in the critical region X= 5 is not in tail of distribution so there is NO EVIDENCE TO REJECT at 5% significance level There is insufficient evidence to suggest this person is not just guessing answers.
54 Other practical hypothesis tests you could try Real-life situations will always be more motivating Collecting data is time-consuming but enables fruitful discussion about sampling, bias etc.
55 The Taste Test Striders think their crisps taste better than supermarket brands. They ve done research that says that 7 out of 10 people prefer Striders crisps. They use this in their advertising. Staylily supermarket think they re wrong. They want to challenge the advertisement. Staylily think that fewer than 7 out of 10 people prefer Striders crisps.
56 Telepathy Set up an experiment to test if pairs of students can communicate which playing card they are looking at.
57 Use other subject areas Get students to make and test hypotheses relating to the other subjects that they study (Biology, Psychology, Geography ).
58 Two tailed tests using critical regions
59 Two tailed tests using critical regions As we are asked about a change of proportion, both larger and smaller numbers of seeds would matter so it is a two-tailed test
60 Critical Regions We can work out a critical region X ~ B(40, 0.65)
61 Critical Regions We can work out a critical region X ~ B(40, 0.65) As it is a two-tailed test at 5% significance, we need 2.5% at either end of the scale
62 Critical Regions X ~ B(40, 0.65) 2.5% at either end of the scale P X 19 = P X 20 =
63 Critical Regions X ~ B(40, 0.65) 2.5% at either end of the scale P X 19 = P X 20 = P X 32 = P X 33 =
64 Critical Regions Calculating the critical region So we reject H 0 if: X 19 or X 33 This is the critical region. P X 19 = P X 20 = P X 32 = P X 33 =
65 Critical Regions Calculating the critical region So we reject H 0 if: X 19 or X 33 This is the critical region. P X 19 = P X 20 = P X 32 = P X 33 = As 19 seeds germinated, we reject H 0 and say that there is evidence at the 5% level for a change in the proportion of seeds germinating


66 Tea!
67 A level Mathematics: The Normal distribution
68 Aims Use the Normal distribution as a model Solve problems that relate to the Normal distribution
69 Practical Approaches Ideally you want a sample of least 100 data items: Primary Data Leaf Width and Length Heights of people ( determine gender/age etc) Weights of a particular denomination of coins Secondary Data Take a random sample from a large data set use census at school data look at heights, weights

70 68% of the data lies within one standard deviation of the mean 95% of the data lies within two standard deviations of the mean 99.7% of the data lie within three standard deviations of the mean Modelling In theory the curve extends infinitely in both directions, but the chance of finding data items outside the 3 standard deviation mark is very small.
71 Using GeoGebra
72 Working out Probabilities What is the probability that a student scores more than 70% in Maths? What is the probability of a student scoring less than 50% in Maths?
,")


 Menu Select a suitable")
73 Use of calculator from 2017 Probabilities of types P(X x), P(X < x), P(X > x) and P(X x) can be found directly from the calculator Example1 (Casio CLASSWIZ Texas also offering one ) X~ N(135, 225) Find P(X 127) or P(X < 127) Menu Select a suitable Lower value enter info
74 Cost? TS.html

75 Using CG20 full graphics F5 DIST F1 Norm F2 Ncd Select a suitable Lower value enter info

76 Drawing
77 Example 2 X ~ Normal mean 135 st deviation 15 P(X 118) or P(X >118) Press Press 7 Press 2 Select a suitable Upper value enter info Enter data then =
 or P(X")
78 Using CX20 full graphics X ~ Normal mean 135 st deviation 15 P(X 118) or P(X >118)

79 Example 3 X ~ Normal mean 135 st deviation 15 P( 119 < X < 128)

80 Using CX20 full graphics
81 Working out Probabilities What is the probability that a student scores more than 70% in Maths?
82 Working out Probabilities What is the probability that a student scores more than 70% in Maths? Maths Scores: M ~N(65, 8 2 )
83 Working out Probabilities What is the probability that a student scores more than 70% in Maths? Maths Scores: M ~N(65, 8 2 )
84 Working out Probabilities What is the probability that a student scores more than 70% in Maths? Maths Scores: M ~N(65, 8 2 ) Z = = = 0.625
 Maths Scores: M ~N(65, 8 2 ) 70 65 Z = = 5 8 8 = 0.625 So we need P(Z >0.")
85 Working out Probabilities What is the probability that a student scores more than 70% in Maths? P(X >70) Maths Scores: M ~N(65, 8 2 ) Z = = = So we need P(Z >0.625) where Z ~N(0, 1 2 )
 where Z ~N(0, 1 2 ) We can use a calculator directly to calculate this once we have the Z value.")
86 Working out Probabilities P(X >70) Maths Scores: M ~N(65, 8 2 ) Z = = = So we need P(Z >0.625) where Z ~N(0, 1 2 ) We can use a calculator directly to calculate this once we have the Z value. 2 Z N(0,1 ) is programmed into the calculator
87 Have the calculator in Run mode. Press the OPT key
88 P is P(Z<z) R is P(Z>z) Q is P( Z is between 0 and z)

89 We can also graph this directly Menu Run Shift Menu F2 EXIT Input/output change to Linear, then EXIT
90

91 To get to the following screen: Then press EXE
92 Question What is the probability of a student scoring less than 50% in Maths? P(X <50)
93 Question What is the probability of a student scoring less than 50% in Maths? P(X <50)
94 Question What is the probability of a student scoring less than 50% in Maths? Z = = 15 8 = 1.875
95 Question What is the probability of a student scoring less than 50% in Maths? Z = = 15 8 = Using a calculator: P(Z < ) = or P(X <50) = directly
96 Question What is the probability of a student scoring less than 50% in Maths? Z = = 15 8 = Using tables - have to use the symmetry of the curve and calculate Φ(1.875) = P(Z < ) = Hence P(Z < ) = Awkward so use calculator
97 Question What is the probability of a student scoring between 45% and 55% in Maths? Z 1 = = 10 8 = 1.25 Z 2 = Use the calculator to calculate directly P(-2.5 < Z < -1.25) = P(Z < -1.25) P(Z < -2.5) =
98 Hypothesis testing with normal distribution


99 Illustration of distribution of MEANS found from SAMPLES taken from a big POPULATION X i Population with mean μ and variance σ² Xi X i X i X i X i X i ) X i μ

100 Population Parent population: Normal Distribution
101 Distribution of sample means, size 9 Distribution of sample means

102 Distribution of sample means Distribution of sample means, size 16
103 Why is the Normal Distribution so important? Common occurrence in nature, science and manufacturing processes Often can assume that the distribution is approximately normal e.g. IQ scores Central Limit Theorem says that if we take samples of sufficiently large size the means of these samples are normally distributed, regardless of the original distribution. Because of this the normal distribution underpins all statistical inferences about means and proportions.
104 Hypothesis Testing Normal Distribution A machine is designed to make paper clips with mean mass 4.00 g and standard deviation 0.08 g. Masses of paperclips are normally distributed. A quality control officer weighs a random sample of 25 paper clips and finds that the mean mass: X = 4.04 g. Let X represent the mass of a paperclip. Let m represent the population mean mass of paper clips and s represent the standard deviation of the masses of paper clips. Then X is a normal variable with distribution: X ~ N(m, s 2 ) Assuming that s is unchanged at 0.08 g, then X ~ N(m, ) What about m? Is it still 4.00 g or is there sufficient evidence to suggest that it has increased?
105 Hypothesis Testing Normal Distribution Firstly formalise the question by setting up two hypotheses : Null hypothesis H 0 : m = 4.00 (no change in population mean m) Alternative hypothesis H 1 : m > 4.00 (population mean m has increased) x The sample mean,, that the quality control officer calculates, becomes the test statistic. P( X 4.04) Assuming that H 0 is true, calculate and compare it with the chosen significance level, say 1% or P( X 4.04) 0.01 P( X 4.04) 0.01 If then reject H 0 in favour of H 1. If then do not reject H 0 in favour of H 1.
106 In order to do the calculations we must use the distribution of X From before we know that if X N ms 2 (, ) Then 2 s X N( m, ) n where n is the sample size So we use: X N(4.04, ) 25
107 Hypothesis Testing Normal Distribution Firstly formalise the question by setting up two hypotheses : Null hypothesis H 0 : m = 4.00 (no change in population mean m) Alternative hypothesis H 1 : m > 4.00 (population mean m has increased) x The sample mean,, that the quality control officer calculates, becomes the test statistic. P( X 4.04) Assuming that H 0 is true, calculate and compare it with the chosen significance level, say 1% or P( X 4.04) 0.01 P( X 4.04) 0.01 If then reject H 0 in favour of H 1. If then do not reject H 0 in favour of H 1.
108 Assuming that H 0 is true, X ~ N(4.00, ): P( X 4.04) P( Z ) Can use calculator P( Z 2.5) 1 P( Z 2.5) = = P( X 4.04) Since = < 0.01, we reject H 0 in favour of H 1 at the 1% significance level The result is significant there is sufficient evidence to suggest that the population mean mass of paper clips has increased. x 4 x 4.04 z 0 z 2.5

109 Hypothesis Testing Normal Distribution alternative approach We use information about probabilities associated with certain values of Z. These are called CRITICAL VALUES

110 Hypothesis Testing Normal Distribution x alternative approach z Find the critical z-value corresponding to a 1% significance level and compare with calculated z-value, the test statistic. Since 2.5 > 2.326, we reject H 0 in favour of H 1 at the 1% significance level. The result is significant there is sufficient evidence to suggest that the there is sufficient evidence to suggest that the population mean mass of paper clips has increased.. Φ(2.326) = 0.99 C.V. = Critical region test statistic = 2.5
111 Summary: The five steps for the hypothesis test Let X represent the mass of a paperclip, masses such that X ~ N(μ, ): (1) Establish null and alternative hypotheses: H 0 : μ = 4.00 H 1 : μ > 4.00 (one-tail test) (2) Significance level, significance level = 1% = 0.01 (3) Find measures: sample mean = 4.04 x m sample size, n = 25 z s 0.08 (4) Conduct test: n 25 Critical value = Φ -1 (99%) = 2.326, and 2.5 > or p value is < 0.01 (5) Interpret result in terms of the original context: Since 2.5 > 2.326, or since < 0.01, reject H 0. There is sufficient evidence to suggest that the population mean of paperclips has increased. 2.5
112 Hypothesis Testing for μ: X ~ N(μ, σ 2 ) two tail test (1) Establish null and alternative hypotheses: H 0 : μ = μ 0 H 1 : μ μ 0 (2) Decide on the significance level: sig α% (3) Collect data and find measures from random sample size n, taken from population; Calculate: x m0 z (4) Conduct test: n Compare z with critical value [ Φ -1 ([100 ½α]%) ] (5) Interpret result in terms of the original claim: or p value with α% (on graphics calc) If z > critical value [Φ -1 ([100 ½α]%) ] or p < ½α% then reject H 0 and write conclusion in context of problem. s
113 Some practical suggestions for Hypothesis tests in the classroom Number of Skittles in a bag does the average number match the manufacturer s claims?
114 Some practical suggestions for Hypothesis tests in the classroom Reaction Times does the time taken to catch a reaction ruler with the non-dominant hand differ from that of the dominant hand? ex%20handout%20by%20virginia%20johnson.pdf
115 Some practical suggestions for Hypothesis tests in the classroom Newspaper articles does an article come from a newspaper, by comparing sentence length?
116 Problems to be aware of We don t often know the population variance, so will have to estimate it from the s 2 sample We may not know the population mean, so will have to calculate it first (or at least get some estimate of it) This means that our methods are not strictly accurate.
117 A level Mathematics: sampling
118 Aims: Understand why samples would be carried out Know some sampling methods Understand the limitations of sampling
119 Sampling content Understand and use sampling techniques, including simple random sampling and opportunity sampling Select or critique sampling techniques in the context of solving a statistical problem, including understanding that different samples can lead to different conclusions about the population
120 Why sample? Before computers did calculations, it was more sensible to take a sample to find a summary statistic Now spreadsheet software can calculate most summary statistics why sample? It is important to know if the summary statistic is representative of the whole data set Which average wage would be the best to calculate for company where twenty employees are on minimum wage and the one director earns 500,000?
121 Is it representative? In the last example the most representative average was the median however, it is not always that obvious, nor are the differences always that clear If you take repeated samples and calculate the same statistic for each sample, if the data set is uniform then the statistic will remain reasonably constant (not exactly the same) If in repeated samples the statistic changes dramatically, then the data set has some non-uniform information and the summary statistics for the whole date set should only be used with care.
122 A level Mathematics: large data sets
123 Aims: Understand why Large Data Sets (LDS) have been introduced at A level Explore some activities using LDS Consider ways to use LDS in the classroom as a teaching tool
124 Large Data Sets What are they? Why are they important? What issues do they create?
125 Large Data Sets What are they? Why are they important? What issues do thy create? How do we deal with these?
126 Thinking about Data Using the data provided, how could students analyse it? What questions could students be asked to answer?
127 What techniques at AS could we use? Sampling Histograms Scatter graphs and correlation (not causation) Measures of central tendency and spread (standard deviation) Select and critique different presentation techniques Probability: exclusive and independent events
128 Analysing data Question: Are fewer babies being born? Rationale: Lots of people I know only have one child. Use the diagrams and calculations provided to answer the question: Are fewer babies being born?
129 Types of Questions Short with brief interpretation Deep interpretation of the data, using given graphs and summaries Selection from given graphs and summary data Modelling with trend lines for bivariate data Modelling with distributions and hypothesis testing Describing a situation where data needed to be collected and how it might be done
130 Data Sets draft specifications Body Format Description of data Comment Lifetime AQA PDF gives links to 40+ datasheets on gov.uk site Family Food datasets Most have no categorical fields Until further notice Edexcel 2 sets of 5 spreadsheets Met Office weather for 5 different stations over 2 different time periods No categorical fields and nothing to explain the data Until further notice MEI Single sheet spreadsheet 2012 Olympics Medals and demographic data by country 2 categorical fields New data set for each cohort OCR Spreadsheet with 4 sheets Methods of Travel by Local Authority 2 categorical fields Until further notice
131 AQA Data Set Table 2.4 UK eating out purchased quantities of food and drink Number of households in sample Number of persons in sample Eating Out Purchases Alcoholic drinks average across whole population ml average excluding under 14's ml Soft drinks inc. milk drinks ml Other food products (c) Beverages ml
132 AQA Data Set Table 2.4 UK eating out purchased quantities of food and drink Number of households in sample Number of persons in sample Eating Out Purchases Alcoholic drinks average across whole population ml average excluding under 14's ml Soft drinks inc. milk drinks ml Other food products (c) Beverages ml Is this right?
133 AQA Data Set Table 2.4 UK eating out purchased quantities of food and drink Number of households in sample Number of persons in sample Eating Out Purchases Alcoholic drinks I wonder which is correct? average across whole population ml average excluding under 14's ml Soft drinks inc. milk drinks ml Other food products (c) Beverages ml Is this right?
134 AQA Data Set
135 Starting with a diagram
136 Edexcel Data Set Maximum Temperatures in July, drawn with GeoGebra
137 MEI Dataset: Correlation
138 More support
139 AS vs GCSE Students find this transition difficult, many techniques are shared, but critical are: Use of appropriate calculations and comparisons
140 AS vs GCSE Students find this transition difficult, many techniques are shared, but critical are: Use of appropriate calculations and comparisons Depth of answer
141 AS vs GCSE Students find this transition difficult, many techniques are shared, but critical are: Use of appropriate calculations and comparisons Depth of answer dealing with analysis in CONTEXT examining the SIGNIFICANCE
142 A real accredited sample paper!
143 A real accredited sample paper!
144 A real accredited sample paper!
145

146
147
148
149
150
151
152
153
154

155
156
157
158
159
160
161 A level Mathematics: support and next steps
162 Support We will be running subject knowledge courses: Extended PD courses (TS, TM, TAM, TFM) Face to face days Online courses See
163 Next Steps: What information was new? What implications are there for your students? What implications are there for your colleagues? What support will you need? Where can you get this support?
164 The Further Mathematics Support Programme Our aim is to increase the uptake of AS and A level Further Mathematics to ensure that more students reach their potential in mathematics. The FMSP works closely with school/college maths departments to provide professional development opportunities for teachers and maths promotion events for students. To find out more please visit
Curriculum update. A level Mathematics and Further Mathematics from September 2017
 Curriculum update A level Mathematics and Further Mathematics from September 2017 General points All A levels will be linear from September 2017 AS can be co-taught with A level, but will have a separate
Teaching S1/S2 statistics using graphing technology
 Teaching S1/S2 statistics using graphing technology CALCULATOR HINTS FOR S1 & 2 STATISTICS - STAT MENU (2) on Casio. It is advised that mean and standard deviation are obtained directly from a calculator.
Teaching Statistics in the new A level using graphing technology. Cath Moore
 Teaching Statistics in the new A level using graphing technology Cath Moore cath.moore@mei.org.uk Overarching themes and use of technology Paragraph 8 of the Content Document states that 8.The use of technology,
THE SAMPLING DISTRIBUTION OF THE MEAN
 THE SAMPLING DISTRIBUTION OF THE MEAN COGS 14B JANUARY 26, 2017 TODAY Sampling Distributions Sampling Distribution of the Mean Central Limit Theorem INFERENTIAL STATISTICS Inferential statistics: allows
LC OL - Statistics. Types of Data
 LC OL - Statistics Types of Data Question 1 Characterise each of the following variables as numerical or categorical. In each case, list any three possible values for the variable. (i) Eye colours in a
CONTINUOUS RANDOM VARIABLES
 the Further Mathematics network www.fmnetwork.org.uk V 07 REVISION SHEET STATISTICS (AQA) CONTINUOUS RANDOM VARIABLES The main ideas are: Properties of Continuous Random Variables Mean, Median and Mode
Final Exam - Solutions
 Ecn 102 - Analysis of Economic Data University of California - Davis March 17, 2010 Instructor: John Parman Final Exam - Solutions You have until 12:30pm to complete this exam. Please remember to put your
Bag RED ORANGE GREEN YELLOW PURPLE Candies per Bag
 Skittles Project For this project our entire class when out and bought a standard 2.17 ounce bag of skittles. Before we ate them, we recorded all of our data, the amount of skittles in our bag and the
Background to Statistics
 FACT SHEET Background to Statistics Introduction Statistics include a broad range of methods for manipulating, presenting and interpreting data. Professional scientists of all kinds need to be proficient
MEI STRUCTURED MATHEMATICS STATISTICS 2, S2. Practice Paper S2-B
 MEI Mathematics in Education and Industry MEI STRUCTURED MATHEMATICS STATISTICS, S Practice Paper S-B Additional materials: Answer booklet/paper Graph paper MEI Examination formulae and tables (MF) TIME
CHAPTER 1. Introduction
 CHAPTER 1 Introduction Engineers and scientists are constantly exposed to collections of facts, or data. The discipline of statistics provides methods for organizing and summarizing data, and for drawing
Quiz 2 covered materials in Chapter 5 Chapter 6 Chapter 7. Normal Probability Distribution. Continuous Probability. distribution 11/9/2010.
 Quiz covered materials in Chapter 5 Chapter 6 Chapter 7 Normal Probability Distribution Chapter 6 Continuous Probability Distribution Normal Distribution Normal Distribution is symmetrical and bell shaped,
Statistics 1. Edexcel Notes S1. Mathematical Model. A mathematical model is a simplification of a real world problem.
 Statistics 1 Mathematical Model A mathematical model is a simplification of a real world problem. 1. A real world problem is observed. 2. A mathematical model is thought up. 3. The model is used to make
STATISTICS 1 REVISION NOTES
 STATISTICS 1 REVISION NOTES Statistical Model Representing and summarising Sample Data Key words: Quantitative Data This is data in NUMERICAL FORM such as shoe size, height etc. Qualitative Data This is
appstats8.notebook October 11, 2016
 Chapter 8 Linear Regression Objective: Students will construct and analyze a linear model for a given set of data. Fat Versus Protein: An Example pg 168 The following is a scatterplot of total fat versus
Talking feet: Scatterplots and lines of best fit
 Talking feet: Scatterplots and lines of best fit Student worksheet What does your foot say about your height? Can you predict people s height by how long their feet are? If a Grade 10 student s foot is
Midterm 2 - Solutions
 Ecn 102 - Analysis of Economic Data University of California - Davis February 24, 2010 Instructor: John Parman Midterm 2 - Solutions You have until 10:20am to complete this exam. Please remember to put
y n 1 ( x i x )( y y i n 1 i y 2
( y y i n 1 i y 2") STP3 Brief Class Notes Instructor: Ela Jackiewicz Chapter Regression and Correlation In this chapter we will explore the relationship between two quantitative variables, X an Y. We will consider n ordered
STP3 Brief Class Notes Instructor: Ela Jackiewicz Chapter Regression and Correlation In this chapter we will explore the relationship between two quantitative variables, X an Y. We will consider n ordered
EDEXCEL S2 PAPERS MARK SCHEMES AVAILABLE AT:
 EDEXCEL S2 PAPERS 2009-2007. MARK SCHEMES AVAILABLE AT: http://www.physicsandmathstutor.com/a-level-maths-papers/s2-edexcel/ JUNE 2009 1. A bag contains a large number of counters of which 15% are coloured
Midterm 2 - Solutions
 Ecn 102 - Analysis of Economic Data University of California - Davis February 23, 2010 Instructor: John Parman Midterm 2 - Solutions You have until 10:20am to complete this exam. Please remember to put
(ii) at least once? Given that two red balls are obtained, find the conditional probability that a 1 or 6 was rolled on the die.
 at least once? Given that two red balls are obtained, find the conditional probability that a 1 or 6 was rolled on the die.") Probability Practice 2 (Discrete & Continuous Distributions) 1. A box contains 35 red discs and 5 black discs. A disc is selected at random and its colour noted. The disc is then replaced in the box. (a)
Probability Practice 2 (Discrete & Continuous Distributions) 1. A box contains 35 red discs and 5 black discs. A disc is selected at random and its colour noted. The disc is then replaced in the box. (a)
Probability Distributions
 Probability Distributions Probability This is not a math class, or an applied math class, or a statistics class; but it is a computer science course! Still, probability, which is a math-y concept underlies
A collection of 9-1 Maths GCSE Sample and Specimen questions from AQA, OCR, Pearson-Edexcel and WJEC Eduqas. Name: Total Marks:
 Scatter Graphs A collection of 9-1 Maths GCSE Sample and Specimen questions from AQA, OCR, Pearson-Edexcel and WJEC Eduqas. Name: Total Marks: 1. The graph shows the number of ice creams sold in a shop
Estadística I Exercises Chapter 4 Academic year 2015/16
 Estadística I Exercises Chapter 4 Academic year 2015/16 1. An urn contains 15 balls numbered from 2 to 16. One ball is drawn at random and its number is reported. (a) Define the following events by listing
PhysicsAndMathsTutor.com
 1. An effect of a certain disease is that a small number of the red blood cells are deformed. Emily has this disease and the deformed blood cells occur randomly at a rate of 2.5 per ml of her blood. Following
AP Final Review II Exploring Data (20% 30%)
") AP Final Review II Exploring Data (20% 30%) Quantitative vs Categorical Variables Quantitative variables are numerical values for which arithmetic operations such as means make sense. It is usually a measure
AP Final Review II Exploring Data (20% 30%) Quantitative vs Categorical Variables Quantitative variables are numerical values for which arithmetic operations such as means make sense. It is usually a measure
Review of Statistics 101
 Review of Statistics 101 We review some important themes from the course 1. Introduction Statistics- Set of methods for collecting/analyzing data (the art and science of learning from data). Provides methods
Final Exam STAT On a Pareto chart, the frequency should be represented on the A) X-axis B) regression C) Y-axis D) none of the above
 X-axis B) regression C) Y-axis D) none of the above") King Abdul Aziz University Faculty of Sciences Statistics Department Final Exam STAT 0 First Term 49-430 A 40 Name No ID: Section: You have 40 questions in 9 pages. You have 90 minutes to solve the exam.
King Abdul Aziz University Faculty of Sciences Statistics Department Final Exam STAT 0 First Term 49-430 A 40 Name No ID: Section: You have 40 questions in 9 pages. You have 90 minutes to solve the exam.
EXAMINATIONS OF THE ROYAL STATISTICAL SOCIETY (formerly the Examinations of the Institute of Statisticians) HIGHER CERTIFICATE IN STATISTICS, 1996
 HIGHER CERTIFICATE IN STATISTICS, 1996") EXAMINATIONS OF THE ROAL STATISTICAL SOCIET (formerly the Examinations of the Institute of Statisticians) HIGHER CERTIFICATE IN STATISTICS, 996 Paper I : Statistical Theory Time Allowed: Three Hours Candidates
EXAMINATIONS OF THE ROAL STATISTICAL SOCIET (formerly the Examinations of the Institute of Statisticians) HIGHER CERTIFICATE IN STATISTICS, 996 Paper I : Statistical Theory Time Allowed: Three Hours Candidates
Data 1 Assessment Calculator allowed for all questions
 Foundation Higher Data Assessment Calculator allowed for all questions MATHSWATCH All questions Time for the test: 45 minutes Name: Grade Title of clip Marks Score Percentage Clip 84 D Data collection
Chapter 2: Tools for Exploring Univariate Data
 Stats 11 (Fall 2004) Lecture Note Introduction to Statistical Methods for Business and Economics Instructor: Hongquan Xu Chapter 2: Tools for Exploring Univariate Data Section 2.1: Introduction What is
Chapter 6: SAMPLING DISTRIBUTIONS
 Chapter 6: SAMPLING DISTRIBUTIONS Read Section 1.5 Graphical methods may not always be sufficient for describing data. Numerical measures can be created for both populations and samples. Definition A numerical
DE CHAZAL DU MEE BUSINESS SCHOOL AUGUST 2003 MOCK EXAMINATIONS IOP 201-Q (INDUSTRIAL PSYCHOLOGICAL RESEARCH)
") DE CHAZAL DU MEE BUSINESS SCHOOL AUGUST 003 MOCK EXAMINATIONS IOP 01-Q (INDUSTRIAL PSYCHOLOGICAL RESEARCH) Time: hours READ THE INSTRUCTIONS BELOW VERY CAREFULLY. Do not open this question paper until
DE CHAZAL DU MEE BUSINESS SCHOOL AUGUST 003 MOCK EXAMINATIONS IOP 01-Q (INDUSTRIAL PSYCHOLOGICAL RESEARCH) Time: hours READ THE INSTRUCTIONS BELOW VERY CAREFULLY. Do not open this question paper until
IB Math Standard Level Probability Practice 2 Probability Practice 2 (Discrete& Continuous Distributions)
") IB Math Standard Level Probability Practice Probability Practice (Discrete& Continuous Distributions). A box contains 5 red discs and 5 black discs. A disc is selected at random and its colour noted. The
IB Math Standard Level Probability Practice Probability Practice (Discrete& Continuous Distributions). A box contains 5 red discs and 5 black discs. A disc is selected at random and its colour noted. The
Psych 10 / Stats 60, Practice Problem Set 5 (Week 5 Material) Part 1: Power (and building blocks of power)
 Part 1: Power (and building blocks of power)") Psych 10 / Stats 60, Practice Problem Set 5 (Week 5 Material) Part 1: Power (and building blocks of power) 1. A researcher plans to do a two-tailed hypothesis test with a sample of n = 100 people and a
Psych 10 / Stats 60, Practice Problem Set 5 (Week 5 Material) Part 1: Power (and building blocks of power) 1. A researcher plans to do a two-tailed hypothesis test with a sample of n = 100 people and a
Statistical Inference, Populations and Samples
 Chapter 3 Statistical Inference, Populations and Samples Contents 3.1 Introduction................................... 2 3.2 What is statistical inference?.......................... 2 3.2.1 Examples of
Dover- Sherborn High School Mathematics Curriculum Probability and Statistics
 Mathematics Curriculum A. DESCRIPTION This is a full year courses designed to introduce students to the basic elements of statistics and probability. Emphasis is placed on understanding terminology and
Sampling Distributions: Central Limit Theorem
 Review for Exam 2 Sampling Distributions: Central Limit Theorem Conceptually, we can break up the theorem into three parts: 1. The mean (µ M ) of a population of sample means (M) is equal to the mean (µ)
Math 221, REVIEW, Instructor: Susan Sun Nunamaker
 Math 221, REVIEW, Instructor: Susan Sun Nunamaker Good Luck & Contact me through through e-mail if you have any questions. 1. Bar graphs can only be vertical. a. true b. false 2.
Class 26: review for final exam 18.05, Spring 2014
 Probability Class 26: review for final eam 8.05, Spring 204 Counting Sets Inclusion-eclusion principle Rule of product (multiplication rule) Permutation and combinations Basics Outcome, sample space, event
MATH STUDENT BOOK. 12th Grade Unit 9
 MATH STUDENT BOOK 12th Grade Unit 9 Unit 9 COUNTING PRINCIPLES MATH 1209 COUNTING PRINCIPLES INTRODUCTION 1. PROBABILITY DEFINITIONS, SAMPLE SPACES, AND PROBABILITY ADDITION OF PROBABILITIES 11 MULTIPLICATION
Probability Distributions
 CONDENSED LESSON 13.1 Probability Distributions In this lesson, you Sketch the graph of the probability distribution for a continuous random variable Find probabilities by finding or approximating areas
The Chi-Square Distributions
 MATH 183 The Chi-Square Distributions Dr. Neal, WKU The chi-square distributions can be used in statistics to analyze the standard deviation σ of a normally distributed measurement and to test the goodness
Exam III #1 Solutions
 Department of Mathematics University of Notre Dame Math 10120 Finite Math Fall 2017 Name: Instructors: Basit & Migliore Exam III #1 Solutions November 14, 2017 This exam is in two parts on 11 pages and
crashmaths Schemes of Work New A Level Maths (2017)
") crashmaths Schemes of Work New A Level Maths (2017) This scheme of work is for a class: with one teacher with 5 contact hours each week sitting the AS exams Textbook references are for our Pure/Applied
crashmaths Schemes of Work New A Level Maths (2017) This scheme of work is for a class: with one teacher with 5 contact hours each week sitting the AS exams Textbook references are for our Pure/Applied
Inference for Proportions, Variance and Standard Deviation
 Inference for Proportions, Variance and Standard Deviation Sections 7.10 & 7.6 Cathy Poliak, Ph.D. cathy@math.uh.edu Office Fleming 11c Department of Mathematics University of Houston Lecture 12 Cathy
PS2.1 & 2.2: Linear Correlations PS2: Bivariate Statistics
 PS2.1 & 2.2: Linear Correlations PS2: Bivariate Statistics LT1: Basics of Correlation LT2: Measuring Correlation and Line of best fit by eye Univariate (one variable) Displays Frequency tables Bar graphs
A-level MATHEMATICS. Paper 3. Exam Date Morning Time allowed: 2 hours SPECIMEN MATERIAL
 SPECIMEN MATERIAL Please write clearly, in block capitals. Centre number Candidate number Surname Forename(s) Candidate signature A-level MATHEMATICS Paper 3 Exam Date Morning Time allowed: 2 hours Materials
solve them completely showing your steps along the way
 Dear IB Math Studies SL Year 2 Students, We have covered chapter 1 (number and algebra 1), chapter 2 (descriptive statistics), chapter 5 (statistical applications), chapter 7 (number and algebra 2), chapter
Simple Practical Mechanics. Lesley Swarbrick FMSP associate
 Simple Practical Mechanics Lesley Swarbrick FMSP associate Practical Approaches to Mechanics Mechanics is Applied Mathematics Mechanics Experiments No Special Equipment Kinematics Resultant force: what
550 = cleaners. Label the managers 1 55 and the cleaners Use random numbers to select 5 managers and 45 cleaners.
 Review Exercise 1 1 a A census observes every member of a population. A disadvantage of a census is it would be time-consuming to get opinions from all the employees. OR It would be difficult/time-consuming
The Empirical Rule, z-scores, and the Rare Event Approach
 Overview The Empirical Rule, z-scores, and the Rare Event Approach Look at Chebyshev s Rule and the Empirical Rule Explore some applications of the Empirical Rule How to calculate and use z-scores Introducing
Chapter 8. Linear Regression. Copyright 2010 Pearson Education, Inc.
 Chapter 8 Linear Regression Copyright 2010 Pearson Education, Inc. Fat Versus Protein: An Example The following is a scatterplot of total fat versus protein for 30 items on the Burger King menu: Copyright
Lecture 1 : Basic Statistical Measures
 Lecture 1 : Basic Statistical Measures Jonathan Marchini October 11, 2004 In this lecture we will learn about different types of data encountered in practice different ways of plotting data to explore
Chapter 2 Descriptive Statistics
 Chapter 2 Descriptive Statistics The Mean "When she told me I was average, she was just being mean". The mean is probably the most often used parameter or statistic used to describe the central tendency
The normal distribution Mixed exercise 3
 The normal distribution Mixed exercise 3 ~ N(78, 4 ) a Using the normal CD function, P( 85).459....4 (4 d.p.) b Using the normal CD function, P( 8).6946... The probability that three men, selected at random,
Topic 5: Probability. 5.4 Combined Events and Conditional Probability Paper 1
 Topic 5: Probability Standard Level 5.4 Combined Events and Conditional Probability Paper 1 1. In a group of 16 students, 12 take art and 8 take music. One student takes neither art nor music. The Venn
S2 QUESTIONS TAKEN FROM JANUARY 2006, JANUARY 2007, JANUARY 2008, JANUARY 2009
 S2 QUESTIONS TAKEN FROM JANUARY 2006, JANUARY 2007, JANUARY 2008, JANUARY 2009 SECTION 1 The binomial and Poisson distributions. Students will be expected to use these distributions to model a real-world
20 Hypothesis Testing, Part I
 20 Hypothesis Testing, Part I Bob has told Alice that the average hourly rate for a lawyer in Virginia is $200 with a standard deviation of $50, but Alice wants to test this claim. If Bob is right, she
Chapter 23. Inferences About Means. Monday, May 6, 13. Copyright 2009 Pearson Education, Inc.
 Chapter 23 Inferences About Means Sampling Distributions of Means Now that we know how to create confidence intervals and test hypotheses about proportions, we do the same for means. Just as we did before,
Chapter # classifications of unlikely, likely, or very likely to describe possible buying of a product?
 A. Attribute data B. Numerical data C. Quantitative data D. Sample data E. Qualitative data F. Statistic G. Parameter Chapter #1 Match the following descriptions with the best term or classification given
Last few slides from last time
 Last few slides from last time Example 3: What is the probability that p will fall in a certain range, given p? Flip a coin 50 times. If the coin is fair (p=0.5), what is the probability of getting an
Sampling Distributions
 Sampling Distributions Sampling Distribution of the Mean & Hypothesis Testing Remember sampling? Sampling Part 1 of definition Selecting a subset of the population to create a sample Generally random sampling
Chapter 2 Class Notes
 Chapter 2 Class Notes Probability can be thought of in many ways, for example as a relative frequency of a long series of trials (e.g. flips of a coin or die) Another approach is to let an expert (such
Describing distributions with numbers
 Describing distributions with numbers A large number or numerical methods are available for describing quantitative data sets. Most of these methods measure one of two data characteristics: The central
TEACHER NOTES FOR ADVANCED MATHEMATICS 1 FOR AS AND A LEVEL
 April 2017 TEACHER NOTES FOR ADVANCED MATHEMATICS 1 FOR AS AND A LEVEL This book is designed both as a complete AS Mathematics course, and as the first year of the full A level Mathematics. The content
Statistics Boot Camp. Dr. Stephanie Lane Institute for Defense Analyses DATAWorks 2018
 Statistics Boot Camp Dr. Stephanie Lane Institute for Defense Analyses DATAWorks 2018 March 21, 2018 Outline of boot camp Summarizing and simplifying data Point and interval estimation Foundations of statistical
AQA Statistics 1. Probability. Section 1: Introducing Probability. Notation
 Notes and Examples AQA Statistics 1 Probability Section 1: Introducing Probability These notes contain subsections on Notation The complement of an event Probability of either one event or another Notation
8.1 Frequency Distribution, Frequency Polygon, Histogram page 326
 page 35 8 Statistics are around us both seen and in ways that affect our lives without us knowing it. We have seen data organized into charts in magazines, books and newspapers. That s descriptive statistics!
Samples and Populations Confidence Intervals Hypotheses One-sided vs. two-sided Statistical Significance Error Types. Statistiek I.
 Statistiek I Sampling John Nerbonne CLCG, Rijksuniversiteit Groningen http://www.let.rug.nl/nerbonne/teach/statistiek-i/ John Nerbonne 1/41 Overview 1 Samples and Populations 2 Confidence Intervals 3 Hypotheses
Stat 2300 International, Fall 2006 Sample Midterm. Friday, October 20, Your Name: A Number:
 Stat 2300 International, Fall 2006 Sample Midterm Friday, October 20, 2006 Your Name: A Number: The Midterm consists of 35 questions: 20 multiple-choice questions (with exactly 1 correct answer) and 15
41.2. Tests Concerning a Single Sample. Introduction. Prerequisites. Learning Outcomes
 Tests Concerning a Single Sample 41.2 Introduction This Section introduces you to the basic ideas of hypothesis testing in a non-mathematical way by using a problem solving approach to highlight the concepts
Mock Exam - 2 hours - use of basic (non-programmable) calculator is allowed - all exercises carry the same marks - exam is strictly individual
 calculator is allowed - all exercises carry the same marks - exam is strictly individual") Mock Exam - 2 hours - use of basic (non-programmable) calculator is allowed - all exercises carry the same marks - exam is strictly individual Question 1. Suppose you want to estimate the percentage of
Mock Exam - 2 hours - use of basic (non-programmable) calculator is allowed - all exercises carry the same marks - exam is strictly individual Question 1. Suppose you want to estimate the percentage of
Time: 1 hour 30 minutes
 Paper Reference(s) 6684/01 Edexcel GCE Statistics S2 Gold Level G3 Time: 1 hour 30 minutes Materials required for examination papers Mathematical Formulae (Green) Items included with question Nil Candidates
ANOVA - analysis of variance - used to compare the means of several populations.
 12.1 One-Way Analysis of Variance ANOVA - analysis of variance - used to compare the means of several populations. Assumptions for One-Way ANOVA: 1. Independent samples are taken using a randomized design.
 Mark Scheme 4766 June 2005 Statistics (4766) Qn Answer Mk Comment (i) Mean = 657/20 = 32.85 cao 2 (i) 657 2 Variance = (22839 - ) = 66.3 9 20 Standard deviation = 8.3 32.85 + 2(8.3) = 49. none of the 3
1 Correlation and Inference from Regression
 1 Correlation and Inference from Regression Reading: Kennedy (1998) A Guide to Econometrics, Chapters 4 and 6 Maddala, G.S. (1992) Introduction to Econometrics p. 170-177 Moore and McCabe, chapter 12 is
********************************************************************************************************
 QUESTION # 1 1. Let the random variable X represent the number of telephone lines in use by the technical support center of a software manufacturer at noon each day. The probability distribution of X is
TOPIC: Descriptive Statistics Single Variable
 TOPIC: Descriptive Statistics Single Variable I. Numerical data summary measurements A. Measures of Location. Measures of central tendency Mean; Median; Mode. Quantiles - measures of noncentral tendency
Chapter 26: Comparing Counts (Chi Square)
") Chapter 6: Comparing Counts (Chi Square) We ve seen that you can turn a qualitative variable into a quantitative one (by counting the number of successes and failures), but that s a compromise it forces
Chapter 6: Comparing Counts (Chi Square) We ve seen that you can turn a qualitative variable into a quantitative one (by counting the number of successes and failures), but that s a compromise it forces
COSC 341 Human Computer Interaction. Dr. Bowen Hui University of British Columbia Okanagan
 COSC 341 Human Computer Interaction Dr. Bowen Hui University of British Columbia Okanagan 1 Last Class Introduced hypothesis testing Core logic behind it Determining results significance in scenario when:
psychological statistics
 psychological statistics B Sc. Counselling Psychology 011 Admission onwards III SEMESTER COMPLEMENTARY COURSE UNIVERSITY OF CALICUT SCHOOL OF DISTANCE EDUCATION CALICUT UNIVERSITY.P.O., MALAPPURAM, KERALA,
The Chi-Square Distributions
 MATH 03 The Chi-Square Distributions Dr. Neal, Spring 009 The chi-square distributions can be used in statistics to analyze the standard deviation of a normally distributed measurement and to test the
1. Create a scatterplot of this data. 2. Find the correlation coefficient.
 How Fast Foods Compare Company Entree Total Calories Fat (grams) McDonald s Big Mac 540 29 Filet o Fish 380 18 Burger King Whopper 670 40 Big Fish Sandwich 640 32 Wendy s Single Burger 470 21 1. Create
CS 361: Probability & Statistics
 February 19, 2018 CS 361: Probability & Statistics Random variables Markov s inequality This theorem says that for any random variable X and any value a, we have A random variable is unlikely to have an
Salt Lake Community College MATH 1040 Final Exam Fall Semester 2011 Form E
 Salt Lake Community College MATH 1040 Final Exam Fall Semester 011 Form E Name Instructor Time Limit: 10 minutes Any hand-held calculator may be used. Computers, cell phones, or other communication devices
t-test for b Copyright 2000 Tom Malloy. All rights reserved. Regression
 t-test for b Copyright 2000 Tom Malloy. All rights reserved. Regression Recall, back some time ago, we used a descriptive statistic which allowed us to draw the best fit line through a scatter plot. We
Part Possible Score Base 5 5 MC Total 50
 Stat 220 Final Exam December 16, 2004 Schafer NAME: ANDREW ID: Read This First: You have three hours to work on the exam. The other questions require you to work out answers to the questions; be sure to
Unit 4 Probability. Dr Mahmoud Alhussami
 Unit 4 Probability Dr Mahmoud Alhussami Probability Probability theory developed from the study of games of chance like dice and cards. A process like flipping a coin, rolling a die or drawing a card from
Homework Exercises. 1. You want to conduct a test of significance for p the population proportion.
 Homework Exercises 1. You want to conduct a test of significance for p the population proportion. The test you will run is H 0 : p = 0.4 Ha: p > 0.4, n = 80. you decide that the critical value will be
Upon completion of this chapter, you should be able to:
 1 Chaptter 7:: CORRELATIION Upon completion of this chapter, you should be able to: Explain the concept of relationship between variables Discuss the use of the statistical tests to determine correlation
Unit 1: Statistics. Mrs. Valentine Math III
 Unit 1: Statistics Mrs. Valentine Math III 1.1 Analyzing Data Statistics Study, analysis, and interpretation of data Find measure of central tendency Mean average of the data Median Odd # data pts: middle
Performance of fourth-grade students on an agility test
 Starter Ch. 5 2005 #1a CW Ch. 4: Regression L1 L2 87 88 84 86 83 73 81 67 78 83 65 80 50 78 78? 93? 86? Create a scatterplot Find the equation of the regression line Predict the scores Chapter 5: Understanding
Data 1 Assessment Calculator allowed for all questions
 Foundation Higher Data Assessment Calculator allowed for all questions MATHSWATCH All questions Time for the test: 4 minutes Name: MATHSWATCH ANSWERS Grade Title of clip Marks Score Percentage Clip 84
Paper Reference(s) 6683 Edexcel GCE Statistics S1 Advanced/Advanced Subsidiary Thursday 5 June 2003 Morning Time: 1 hour 30 minutes
 6683 Edexcel GCE Statistics S1 Advanced/Advanced Subsidiary Thursday 5 June 2003 Morning Time: 1 hour 30 minutes") Paper Reference(s) 6683 Edexcel GCE Statistics S1 Advanced/Advanced Subsidiary Thursday 5 June 2003 Morning Time: 1 hour 30 minutes Materials required for examination Answer Book (AB16) Graph Paper (ASG2)
Paper Reference(s) 6683 Edexcel GCE Statistics S1 Advanced/Advanced Subsidiary Thursday 5 June 2003 Morning Time: 1 hour 30 minutes Materials required for examination Answer Book (AB16) Graph Paper (ASG2)
Algebra 2/Trig: Chapter 15 Statistics In this unit, we will
 Algebra 2/Trig: Chapter 15 Statistics In this unit, we will Find sums expressed in summation notation Determine measures of central tendency Use a normal distribution curve to determine theoretical percentages
Math 10 - Compilation of Sample Exam Questions + Answers
 Math 10 - Compilation of Sample Exam Questions + Sample Exam Question 1 We have a population of size N. Let p be the independent probability of a person in the population developing a disease. Answer the
Chapter 7. Inference for Distributions. Introduction to the Practice of STATISTICS SEVENTH. Moore / McCabe / Craig. Lecture Presentation Slides
 Chapter 7 Inference for Distributions Introduction to the Practice of STATISTICS SEVENTH EDITION Moore / McCabe / Craig Lecture Presentation Slides Chapter 7 Inference for Distributions 7.1 Inference for
Ordinary Least Squares Regression Explained: Vartanian
 Ordinary Least Squares Regression Explained: Vartanian When to Use Ordinary Least Squares Regression Analysis A. Variable types. When you have an interval/ratio scale dependent variable.. When your independent
3 PROBABILITY TOPICS
 Chapter 3 Probability Topics 135 3 PROBABILITY TOPICS Figure 3.1 Meteor showers are rare, but the probability of them occurring can be calculated. (credit: Navicore/flickr) Introduction It is often necessary