Structural Reliability
|
|
|
- Rose May
- 5 years ago
- Views:
Transcription
1 Structural Reliability Thuong Van DANG May 28, / 41

2 2 / 41
3 Introduction to Structural Reliability Concept of Limit State and Reliability Review of Probability Theory First Order Second Moment Method (FOSM) First Order Reliability Method (FORM) Second Order Reliability Method (SORM) Monte Carlo Method 3 / 41
4 Introduction to Structural Reliability Civil engineering facilities such as bridges, buildings, power plants, dams and offshore platforms are all intended to contribute to the benefit and quality of life. Therefore when it is important that the benefit of the facility can be identified considering all phases of the life of the facility, i.e. including design, manufacturing, construction, operation and eventually decommissioning. For many years it has been assumed in design of structural systems that all loads and strengths are deterministic. The strength of an element was determined in such a way that it exceeded the load with a certain margin. The ratio between the strength and the load was denoted the safety factor. This number was considered as a measure of the reliability of the structure. 4 / 41
5 Introduction to Structural Reliability In codes of practice for structural systems values for loads, strengths and safety factors are prescribed. However, uncertainties in the loads, strengths and in the modeling of the systems require that methods based on probabilistic techniques in a number of situations have to be used. A structure is usually required to have a satisfactory performance in the expected lifetime, i.e. it is required that it does not collapse or becomes unsafe and that it fulfills certain functional requirements. Generally structural systems have a rather small probability that they do not function as intended. 5 / 41
6 Introduction to Structural Reliability The study of structural reliability is concerned with the calculation and prediction of the probability of limit state violation for an engineered structural system at any stage during its life. The objective of any structural design is to ensure safety and economy of the structure operating under a given environment. Capacity (C) > Demand (D) So long this condition is satisfied, the safety of the structure is ensured for the intended purpose for which the structure is built. Besides this, designers also ensure that there is an optimal use of the materials which, in turn, ensures economy. 6 / 41

7 Capacity i.e. C = X 1 X 2 X 3 X p and 'q' may be associated with Demand D = X p+1 X p+2 X p+3 X p+q leading to p + q = n. If the variables are deterministic, the design may be iteratively carried out to reach an optimal value of them which, in turn, will ensure all three fundamental requirements stated earlier. The problem becomes more complex when the design variables are random in nature i.e. only defined by their pdf. Let us consider only two random variables i.e. C and D which are independent. Figure shows the limit state that divides the design space into safe and unsafe regions. Concept of Limit State and Reliability Limit state equation can be represented in the form: g(x) = Capacity - Demand = C - D = 0 x 2 Unsafe g(x) < 0 Safe g(x) > 0 x 1 g(x) = 0 Figure Limit State showing safe and unsafe regions Figure: Limit State showing safe and unsafe regions From this Figure one can conclude that there may be infinite combinations of C and D that falls on the limit state i.e. satisfy the design. So, unlike deterministic design, it is rather tough job for the designer to choose the optimal value. An intuitive solution to this problem is to select the point that has least probability of failure. This gives rise to an important question, how to assess the point on the limit state in the first place? To answer this question let us consider Figure that shows the pdf of these random variables. It is important to note that the limit state does not define a unique failure function, i.e. the limit state can be described by a number f of equivalent failure C(c) functions. In structural reliability, the limit f D(d) state function usually results from a mechanical analysis of the structure. D C 7 / 41
8 Concept of Limit State and Reliability Reliability The reliability of an engineering design is the probability that it response certain demands under conditions for a specified period of time. Reliability often mentions as the ability of a component or system to function at a specified moment or interval of time. There are some definitions of reliability in national and international documents. In ISO 2394, reliability is the ability of a structure to comply with given requirements under specified conditions during the intended life for which it was designed. While Eurocode provides a description: reliability is the ability of a structure or a structural member to fulfill the specified requirements, including the design working life, for which it has been designed and it is usually expressed in probabilistic terms. 8 / 41
9 Uncertainty Reliability Safety Risk 9 / 41
10 Levels of Reliability Methods Generally, methods to measure the reliability of a structure can be divided into four groups: Level I methods: The uncertain parameters are modeled by one characteristic value. For example in codes based on the partial safety factor concept (load and resistance factor formats). Level II methods: The uncertain parameters are modeled by the mean values and the standard deviations, and by the correlation coefficients between the stochastic variables. The stochastic variables are implicitly assumed to be normally distributed. The reliability index method is an example of a level II method. 10 / 41
11 Levels of Reliability Methods Level III methods: The uncertain quantities are modeled by their joint distribution functions. The probability of failure is estimated as a measure of the reliability. Level IV methods: In these methods, the consequences (cost) of failure are also taken into account and the risk (consequence multiplied by the probability of failure) is used as a measure of the reliability. In this way, different designs can be compared on an economic basis taking into account uncertainty, costs and benefits. 11 / 41
12 Review of Probability Theory Events and basis probability rules An event E is defined as a subset of the sample space (all possible outcomes of a random quantity) Ω. The failure event E of e.g. a structural element can be modeled by E = R S where R is the strength and S is the load. The probability of failure is the probability: P f = P(E ) = P(R S). Axioms of probability: Axiom 1: for any event E : Axiom 2: for the sample space 0 P(E) 1 (1) P(Ω) = 1 (2) Axiom 3: for mutually exclusive events E 1, E 2,..., E m : ( m ) m P E i = P(E i ) (3) i=1 i=1 12 / 41
13 Review of Probability Theory The conditional probability of an event E 1 given another event E 2 is defined by: P(E 1 E 2 ) = P(E 1 E 2 ) P(E 2 ) if E 1 and E 2 are statistically independent: (4) P(E 1 E 2 ) = P(E 1 )P(E 2 ) (5) Bayes theorem: P(E i A) = P(A E i)p(e i ) P(A) where A is an event. = P(A E i)p(e i ) m P(A E i )P(E i ) j=1 (6) 13 / 41
14 Review of Probability Theory Continuous stochastic variables Consider a continuous stochastic variable X. The distribution function of X is denoted F X (x) and gives the probability F X (x) = P(X x). The probability density function f X (x) is defined by: f X (x) = d dx F x(x) (7) The expected value is defined by: (8) µ = (xf X (x)dx (9) The variance σ 2 is defined by: σ 2 = (x µ) 2 f X (x)dx (10) where σ is the standard deviation. 14 / 41
15 Review of Probability Theory Normal distribution The normal distribution often occurs in practical applications because the sum of a large number of statistically independent random variables converges to a normal (known as central limit theorem). The normal distribution can be used to represent material properties, fatigue uncertainty. It is also used in stress-strength interference models in reliability studies. The cumulative distribution function of a normal random variable X with the mean µ X and standard deviation σ X is given by the exponential expression: F X (x) = Φ( x µ σ ) = x 1 exp [ 1 σ X 2π 2 (x µ X ) 2 ]dx σ X (12) where Φ(u) is is the standardized distribution function for a Normal distributed stochastic variable with expected value µ = 0 and standard deviation σ = / 41

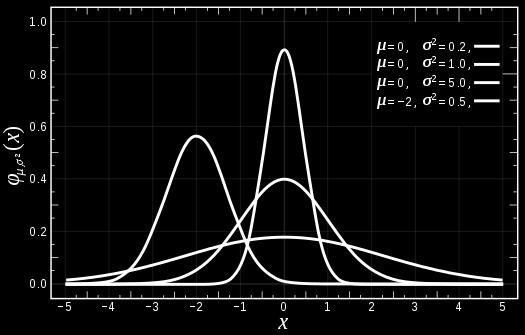
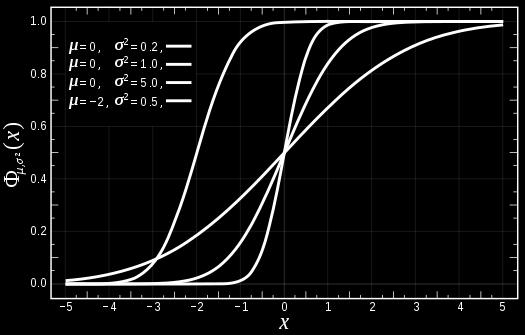
16 Review of Probability Theory 16 / 41
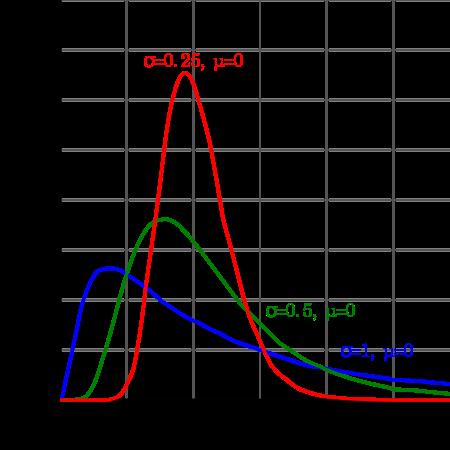
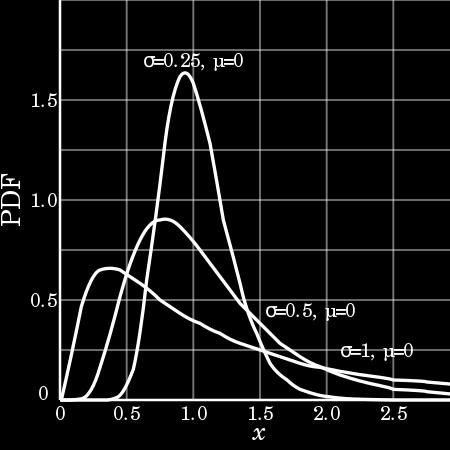
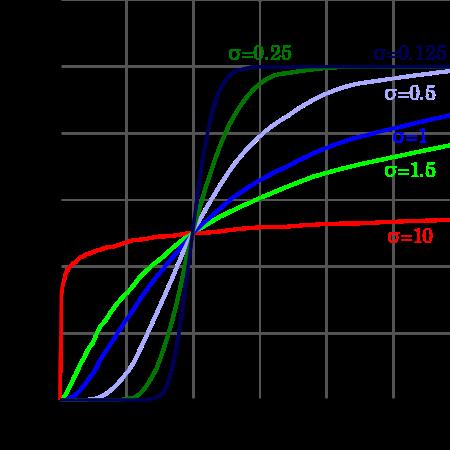
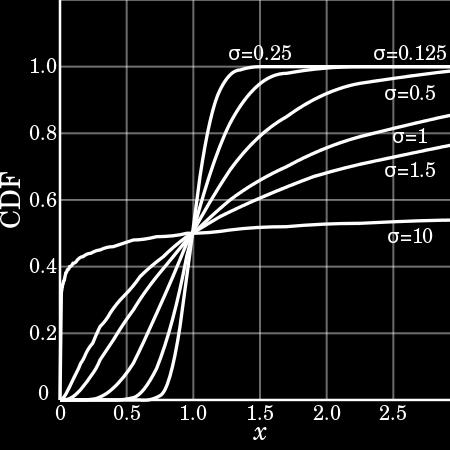
17 Review of Probability Theory Lognormal distribution The cumulative distribution function for a stochastic variable with expected value µ X and standard deviation σ X is denoted LN(µ X, σ X ), and is defined by: F X (x) = Φ( lnx µ lnx X ) = σ X 1 exp [ 1 σ X 2π 2 (lnx µ X ) 2 ]dx σ X (13) where: σ X = ln( σ 2 µ + 1) and µ X = lnµ 1 2 σ2 X is the standard deviation and expected value for the Normal distributed stochastic variable: Y = lnx 17 / 41
18 Review of Probability Theory Exponential distribution The exponential distribution is most widely used distribution in reliability and risk assessment. It is the only distribution having constant hazard rate and is used to model useful life of many engineering systems. The exponential distribution is closely related to the Poisson distribution which is discrete. If the number of failure per unit time is Poisson distribution then the time between failures follows the exponential distribution. The cumulative distribution function is given by: F (x, λ) = { 1 e λx x 0 0 x < 0 (14) where λ > 0 is inverse scale 18 / 41
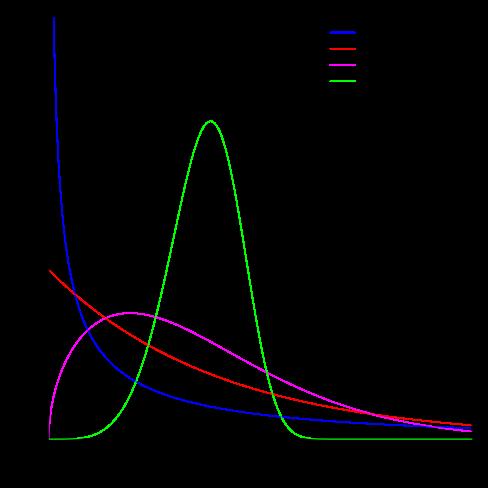
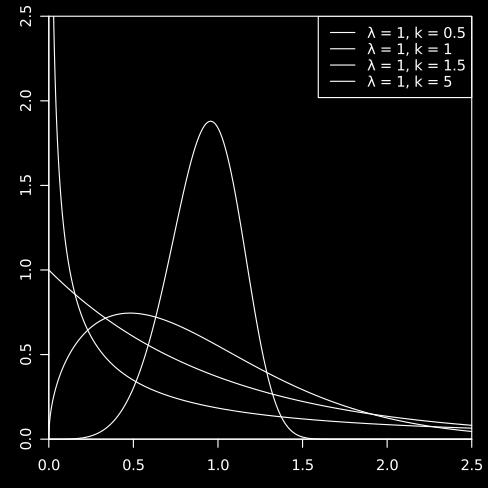
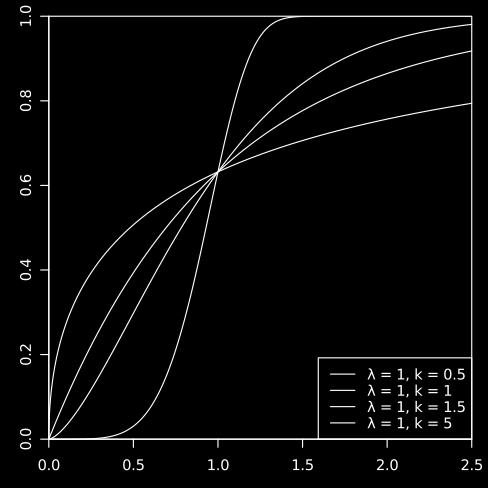
19 Review of Probability Theory Weibull distribution The Weibull distribution is a continuous probability distribution. It is named after Swedish mathematician Waloddi Weibull, who described it in detail in 1951, although it was first identified by Frchet (1927) and first applied by Rosin & Rammler (1933) to describe a particle size distribution. The cumulative distribution function is given by: F (x, k, λ) = { 1 e ( x λ )k x 0 0 x < 0 (15) where λɛ(0, + ) and kɛ(0, + ) are scale and shape parameter. 19 / 41
20 Review of Probability Theory 20 / 41
21 Review of Probability Theory Conditional distributions The conditional distribution function for X 1 given X 2 is defined by: f X1 X 2 (x 1 x 2 ) = f X 1,X 2 (x 1, x 2 ) f X2 (x 2 ) X 1 and X 2 are statistically independent if f X1 X 2 (x 1 x 2 ) = f X1 (x 1 ) implying that: (16) f X1 X 2 (x 1 x 2 ) = f X1 (x 1 )f X2 (x 2 ) (17) Covariance and correlation The covariance between X 1 and X 2 is defined by: It is seen that Cov[X 1, X 2 ] = E[(X 1 µ 1 )(X 2 µ 2 )] (18) Cov[X 1, X 1 ] = Var[X 1 ] = σ 2 1 (19) 21 / 41
22 Review of Probability Theory Covariance and correlation The correlation coefficient between X 1 and X 2 is defined by: ρ X1,X 2 = Cov[X 1, X 2 ] σ 1, σ 2 (20) If ρ X1,X 2 = 0 then X 1 and X 2 is uncorrelated, but not necessarily statistically independent. For a stochastic vector X = (X 1, X 2,..., X n ) the covariance-matrix is defined by: Var[X 1, X 1 ] Cov[X 1, X 2 ] Cov[X 1, X n ] Cov[X 1, X 2 ] Var[X 2, X 2 ] Cov[X 2, X n ] C = (21) Cov[X 1, X n ] Cov[X 2, X n ] Var[X n, X n ] 22 / 41
23 First Order Second Moment Method (FOSM) The First Order Second Moment FOSM method is based on a first order Taylors approximation of the performance function. It uses only second moment statistics (means and covariances) of the random variables. Consider a case where C and D are normally distributed variables and they are statistically independent. µ C and µ D are mean and σ C and σ D are standard deviations of C and D respectively. Then mean of g(x) is: µ g = µ C µ D (22) and standard deviation of g(x) is: σ g = µ 2 C + µ2 D (23) 23 / 41
24 First Order Second Moment Method (FOSM) So that failure probability is: p f = P(g(X ) < 0) = Φ 0 (µ C µ D ) µ 2 C + µ2 D = Φ ( µ ) g σ g (24) where β is measure of the reliability for the limit state g(x). It was proposed by Cornell and hence, is termed as Cornell s Reliability Index: β = µ g σ g (25) Consider a case of generalized performance function of many random variables: X 1, X 2,..., X n 24 / 41
25 First Order Second Moment Method (FOSM) Expanding this performance function about the mean gives: LSF = g(x 1, X 2,..., X n ) n n i=1 j=1 n i=1 g X i (X i µ Xi ) +... (26) 2 g X i X j (X i µ Xi )(X j µ Xj ) +... (27) where the derivatives are evaluated at the mean values. Considering first two terms in the Taylor s series expression and taking expectation on both sides one can prove that : Var(g) = σ 2 g = µ g = E[g(X )] = g(µ 1, µ 2,..., µ n ) (28) n n ( ) ( ) g g Cov(X i, X j ) X i X j (29) i=1 j=1 where Cov(X i, X j ) is the covariance of X i and X j. 25 / 41
26 First Order Reliability Method (FORM) Reliability index In 1974 Hasofer & Lind proposed a definition of the reliability index which is invariant Visual with respect to the mathematical formulation of the safety margin. Figure: An example transformation to standard normal space Reliability index β is defined as the smallest distance from the origin O(0,0) in the U-space to the failure surface g(u) = / 41
27 First Order Reliability Method (FORM) The reliability index is thus determined by the optimization problem: β = }{{} min n Ui 2 (30) g(u)=0 i=1 Reliability index is also known as an equivalent value to the probability of failure, formally defined as a negative value of a standardized normal variable corresponding to the probability of failure P f : β = Φ 1 U (P f ) (31) where Φ 1 U (P f ) denotes the inverse standardized normal distribution function For independent variables of any distribution, the principle of the transformation into standard normal space consists of writing the equality of the distribution functions: Φ(u) = F X (x) u = Φ(u) 1 (F X (x)) (32) 27 / 41
28 First Order Reliability Method (FORM) Probability of failure The probability of failure is an important term in the theory of structural reliability. It is assumed that X is the vector of random variables that influence a system s load (L) and resistance (R), the limit state function is formulated in terms of these basic variables and given as: g(x ) = g(x 1, X 2,..., X n ) = L R (33) In the general sense, the probability of failure based on the given limit state for a time-invariant reliability problem is: P f = P[g(X ) 0] = f x (x)dx (34) g(x ) 0 Where f x (x) and P f are the joint probability density function of X. 28 / 41

29 10 0 Probability of failure Reliability index / 41
30 First Order Reliability Method (FORM) The FORM (First Order Reliability Method) is one of the basic and very efficient reliability methods. The FORM method is used as a fundamental procedure by a number of software products for the reliability analysis of structures and systems. It is also mentioned in EN 1990 [1] that the design values are based on the FORM reliability method. The procedure of applying the algorithm by Rackwitz and Fiessler algorithm for reliability calculation can be listed as follows: Step 1: Write the limit state function g(x)= 0 in terms of the basic variables. Transform the limit state function g(x) into standard normal space g(u). Step 2: Assume initial value of design point U 0 (mean value). Step 3: Calculate gradient vector g u (35) 30 / 41
31 First Order Reliability Method (FORM) Step 4: Calculate an improved guess of the Reliability Index β α = g(u) g(u) (36) and then iterated point u i+1 is obtained: u i+1 = (uα T )α + g(u) g(u) α (37) Step 5: Calculate the corresponding reliability index: β i+1 = (u i+1 ) T u i+1 (38) Step 6: If convergence in β: β i+1 β i 10 3, then stop, else i=i+1 and go to step 2 31 / 41
32 First Order Reliability Method (FORM) Example: Suppose that the performance function of a problem is defined by: g(x) = X1X where X1 follows a normal distribution with mean µ X 1 = 33.2 and standard deviation σ X 1 = 2.1. X2 follows a normal distribution with mean µ X 2 = 50 and standard deviation σ X 2 = 2.6. Using FORM, find reliability index and probability of failure? 32 / 41
33 Second Order Reliability Method (SORM) In reality, the limit states are highly non-linear in standard normal space and hence a first order approximation may contribute significant error in reliability index evaluation. Thus, a better approximation by second order terms is required for a highly non-linear limit state. The procedure to apply the algorithm of Breitung Step 1: Initial orthogonal matrix T0 is evaluated from the direction cosines, evaluated as explained in FORM under Rackwitz and Fiessler algorithm: T 0 = α 1 α 2... α n (39) where α 1, α 2,..., α n are the direction cosines of the unit gradient vector at the Most Probable failure Point (MPP). 33 / 41
34 Second Order Reliability Method (SORM) Step 2: Consider a matrix T0 = [t 01, t 02,..., t 0n ] t is modified using Gram-Schmidt orthogonal procedure as: n t i t0k t t k = t 0k t i ti t t i (40) i=k+1 where t k is row vectors of modified orthogonal matrix T = [t 1, t 2,..., t n ] t and k ranges from n, n-1, n-2,...,2,1. The rotation matrix in produced by normalizing these vectors to unit. Step 3: An orthogonal transformation of random variables X into Y is evaluated using orthogonal matrix T (also known as rotation matrix) Y = TX. Again using orthogonal matrix T, another matrix A is evaluated as: A = [a ij ] = (THT t ) ij G i, j = 1, 2,..., n 1 (41) where G is the length of the gradient vector and H represents a double derivative matrix of the limit state in 34 / 41
35 Second Order Reliability Method (SORM) standard normal space at the design point. H = 2 g u 1 u g u g u1 2 2 g u 2 u 1 2 g u 2 n (42) Step 4: the last row and last column in the A matrix and last row in the Y matrix are eliminated to consider a factor that last variable y n coincides with β computed in FORM. y n = β y t Ay (43) Now, the size of coefficient matrix A is reduced to (n-1)x(n-1) and main curvatures κ i are given by computing eigen values of matrix A. 35 / 41
36 * ' Hessian matrix Hu ( ), and U = { U, U,, Un } Second Order Reliability Method (SORM) When β is large enough, an asymptotic solution of the probability of failure can be then derived as Step 5: compute the failure probability P f using Breitung equation: p n 1 1/2 = Pg { ( X ) < 0} =Φ ( β) ( 1+ βκi) (7.40) f n 1 P f = φ( β) (1 + βκ i ) 1/2 g U at the (44) in which κi denotes the i-th main curvature of the performance function ( ) MPP. Since the approximation of the performance i=1function in SORM is better than that in FORM (see Fig. 7.14), SORM is generally more accurate than FORM. However, since SORM requires the second order derivative, it is not as efficient as FORM when the derivatives are evaluated numerically. If we use the number of performance function evaluations to measure the efficiency, SORM needs more function evaluations than FORM. where κ i is the main curvatures of the limit state surface at design point. i = 1 U2 SORM g>0 β MPP u* g = 0 g<0 o U1 FORM Figure 7.14 Comparison of FORM and SORM Figure: Comparison of FORM and SORM 36 / 41
37 Monte Carlo Method Monte Carlo simulation is a statistical analysis tool and widely used in both non-engineering fields and engineering fields. Monte Carlo is also suitable for solving complex engineering problems because it can deal with a large number of random variables, various distribution types, and highly non-linear engineering models. Different from a physical experiment, Monte Carlo simulation performs random sampling and conducts a large number of experiments on the computer. Three steps are required in the simulation process: Step 1: Sampling on input random variables (Generating samples of random variables). The purpose of sampling on the input random variables X= (X 1, X 2,..., X n ) is to generate samples that represent distributions of the input variable from their cdfs F xi (x i )(i = 1, 2,..., n). 37 / 41
38 Monte Carlo Method The samples of the random variables will then be used as inputs to the simulation experiments. Step 2: Numerical experimentation Suppose that N samples of each random variable are generated, then all the samples of random variables constitute N sets of inputs, x i = (x i1, x i2,..., x in ), i = 1, 2,..., N to the model Y=g(X). Solving the problem N times yields N sample points of the output Y: y i = g(x i ), i = 1, 2,..., N (45) Step 3: Extraction of probabilistic information of output variables After N samples of output Y have been obtained, statistical analysis can be carried out to estimate the characteristics of the output Y, such as the mean, variance, reliability, the probability of failure, pdf and cdf. 38 / 41
39 Monte Carlo Method - The mean: µ = Y = 1 N N y i (46) i=1 - The variance: σ 2 Y = 1 N 1 - The probability of failure: N (y i Y ) 2 (47) i=1 P f = 1 N N i=1 I [g(x i )] = N f N (48) where N f is the number of samples that have the performance function less than or equal to zero 39 / 41
40 Monte Carlo Method Step 4: Error analysis The commonly used confidence level is 95% under which the error is approximately given by: ε% 200 (1 P f NP f (49) where P f is the true value of the probability of failure and N is required sample number to obtain certain P f with a predefined error. 40 / 41
41 Crack depth (mm) Year 41 / 41
Reliability Analysis Methods
 Reliability Analysis Methods Emilio Bastidas-Arteaga, Abdel-Hamid Soubra To cite this version: Emilio Bastidas-Arteaga, Abdel-Hamid Soubra. Reliability Analysis Methods. Michael A. Hicks; Cristina Jommi.
However, reliability analysis is not limited to calculation of the probability of failure.
 Probabilistic Analysis probabilistic analysis methods, including the first and second-order reliability methods, Monte Carlo simulation, Importance sampling, Latin Hypercube sampling, and stochastic expansions
component risk analysis
 273: Urban Systems Modeling Lec. 3 component risk analysis instructor: Matteo Pozzi 273: Urban Systems Modeling Lec. 3 component reliability outline risk analysis for components uncertain demand and uncertain
Reliability analysis of geotechnical risks
 Reliability analysis of geotechnical risks Lazhar Belabed*, Hacene Benyaghla* * Department of Civil Engineering and Hydraulics, University of Guelma, Algeria Abstract The evaluation of safety or reliability
A Probability Primer. A random walk down a probabilistic path leading to some stochastic thoughts on chance events and uncertain outcomes.
 A Probability Primer A random walk down a probabilistic path leading to some stochastic thoughts on chance events and uncertain outcomes. Are you holding all the cards?? Random Events A random event, E,
Sensitivity and Reliability Analysis of Nonlinear Frame Structures
 Sensitivity and Reliability Analysis of Nonlinear Frame Structures Michael H. Scott Associate Professor School of Civil and Construction Engineering Applied Mathematics and Computation Seminar April 8,
Northwestern University Department of Electrical Engineering and Computer Science
 Northwestern University Department of Electrical Engineering and Computer Science EECS 454: Modeling and Analysis of Communication Networks Spring 2008 Probability Review As discussed in Lecture 1, probability
Guideline for Offshore Structural Reliability Analysis - General 3. RELIABILITY ANALYSIS 38
 FEBRUARY 20, 1995 3. RELIABILITY ANALYSIS 38 3.1 General 38 3.1.1 Variables 38 3.1.2 Events 39 3.1.3 Event Probability 41 3.1.4 The Reliability Index 41 3.1.5 The Design Point 42 3.1.6 Transformation of
Summary of basic probability theory Math 218, Mathematical Statistics D Joyce, Spring 2016
 8. For any two events E and F, P (E) = P (E F ) + P (E F c ). Summary of basic probability theory Math 218, Mathematical Statistics D Joyce, Spring 2016 Sample space. A sample space consists of a underlying
4. Distributions of Functions of Random Variables
 4. Distributions of Functions of Random Variables Setup: Consider as given the joint distribution of X 1,..., X n (i.e. consider as given f X1,...,X n and F X1,...,X n ) Consider k functions g 1 : R n
Created by Erik Kostandyan, v4 January 15, 2017
 MATLAB Functions for the First, Second and Inverse First Order Reliability Methods Copyrighted by Erik Kostandyan, Contact: erik.kostandyan.reliability@gmail.com Contents Description... References:...
Lecture 2: Repetition of probability theory and statistics
 Algorithms for Uncertainty Quantification SS8, IN2345 Tobias Neckel Scientific Computing in Computer Science TUM Lecture 2: Repetition of probability theory and statistics Concept of Building Block: Prerequisites:
Algorithms for Uncertainty Quantification
 Algorithms for Uncertainty Quantification Tobias Neckel, Ionuț-Gabriel Farcaș Lehrstuhl Informatik V Summer Semester 2017 Lecture 2: Repetition of probability theory and statistics Example: coin flip Example
System Simulation Part II: Mathematical and Statistical Models Chapter 5: Statistical Models
 System Simulation Part II: Mathematical and Statistical Models Chapter 5: Statistical Models Fatih Cavdur fatihcavdur@uludag.edu.tr March 20, 2012 Introduction Introduction The world of the model-builder
Module 8. Lecture 5: Reliability analysis
 Lecture 5: Reliability analysis Reliability It is defined as the probability of non-failure, p s, at which the resistance of the system exceeds the load; where P() denotes the probability. The failure
Probability of Failure for Concrete Gravity Dams for Sliding Failure
 i Probability of Failure for Concrete Gravity Dams for Sliding Failure Proposal to solution for the eleventh ICOLD Benchmark workshop ALI IQBAL Master of Science Thesis Stockholm, Sweden 2012 Probability
Preliminary statistics
 1 Preliminary statistics The solution of a geophysical inverse problem can be obtained by a combination of information from observed data, the theoretical relation between data and earth parameters (models),
Basics of Uncertainty Analysis
 Basics of Uncertainty Analysis Chapter Six Basics of Uncertainty Analysis 6.1 Introduction As shown in Fig. 6.1, analysis models are used to predict the performances or behaviors of a product under design.
SUMMARY OF PROBABILITY CONCEPTS SO FAR (SUPPLEMENT FOR MA416)
") SUMMARY OF PROBABILITY CONCEPTS SO FAR (SUPPLEMENT FOR MA416) D. ARAPURA This is a summary of the essential material covered so far. The final will be cumulative. I ve also included some review problems
SUMMARY OF PROBABILITY CONCEPTS SO FAR (SUPPLEMENT FOR MA416) D. ARAPURA This is a summary of the essential material covered so far. The final will be cumulative. I ve also included some review problems
Research Collection. Basics of structural reliability and links with structural design codes FBH Herbsttagung November 22nd, 2013.
 Research Collection Presentation Basics of structural reliability and links with structural design codes FBH Herbsttagung November 22nd, 2013 Author(s): Sudret, Bruno Publication Date: 2013 Permanent Link:
P (x). all other X j =x j. If X is a continuous random vector (see p.172), then the marginal distributions of X i are: f(x)dx 1 dx n
. all other X j =x j. If X is a continuous random vector (see p.172), then the marginal distributions of X i are: f(x)dx 1 dx n") JOINT DENSITIES - RANDOM VECTORS - REVIEW Joint densities describe probability distributions of a random vector X: an n-dimensional vector of random variables, ie, X = (X 1,, X n ), where all X is are
JOINT DENSITIES - RANDOM VECTORS - REVIEW Joint densities describe probability distributions of a random vector X: an n-dimensional vector of random variables, ie, X = (X 1,, X n ), where all X is are
Quick Tour of Basic Probability Theory and Linear Algebra
 Quick Tour of and Linear Algebra Quick Tour of and Linear Algebra CS224w: Social and Information Network Analysis Fall 2011 Quick Tour of and Linear Algebra Quick Tour of and Linear Algebra Outline Definitions
1 Random Variable: Topics
 Note: Handouts DO NOT replace the book. In most cases, they only provide a guideline on topics and an intuitive feel. 1 Random Variable: Topics Chap 2, 2.1-2.4 and Chap 3, 3.1-3.3 What is a random variable?
A Simple Third-Moment Method for Structural Reliability
 A Simple Third-Moment Method for Structural Reliability Yan-Gang Zhao* 1, Zhao-Hui Lu 2 and Tetsuro Ono 3 1 Associate Professor, Nagoya Institute of Technology, Japan 2 Graduate Student, Nagoya Institute
Methods of Reliability Analysis in the context of RDO. Lectures. Christian Bucher
 Lectures Methods of Reliability Analysis in the context of RDO Christian Bucher presented at the Weimar Optimization and Stochastic Days 2011 Source: www.dynardo.de/en/library Methods of Reliability Analysis
Probability Review. Yutian Li. January 18, Stanford University. Yutian Li (Stanford University) Probability Review January 18, / 27
 Probability Review January 18, / 27") Probability Review Yutian Li Stanford University January 18, 2018 Yutian Li (Stanford University) Probability Review January 18, 2018 1 / 27 Outline 1 Elements of probability 2 Random variables 3 Multiple
Probability Review Yutian Li Stanford University January 18, 2018 Yutian Li (Stanford University) Probability Review January 18, 2018 1 / 27 Outline 1 Elements of probability 2 Random variables 3 Multiple
Probability and Distributions
 Probability and Distributions What is a statistical model? A statistical model is a set of assumptions by which the hypothetical population distribution of data is inferred. It is typically postulated
LIST OF FORMULAS FOR STK1100 AND STK1110
 LIST OF FORMULAS FOR STK1100 AND STK1110 (Version of 11. November 2015) 1. Probability Let A, B, A 1, A 2,..., B 1, B 2,... be events, that is, subsets of a sample space Ω. a) Axioms: A probability function
Today: Fundamentals of Monte Carlo
 Today: Fundamentals of Monte Carlo What is Monte Carlo? Named at Los Alamos in 1940 s after the casino. Any method which uses (pseudo)random numbers as an essential part of the algorithm. Stochastic -
Review: mostly probability and some statistics
 Review: mostly probability and some statistics C2 1 Content robability (should know already) Axioms and properties Conditional probability and independence Law of Total probability and Bayes theorem Random
Review of Probability Theory
 Review of Probability Theory Arian Maleki and Tom Do Stanford University Probability theory is the study of uncertainty Through this class, we will be relying on concepts from probability theory for deriving
Uncertainty Quantification in Remaining Useful Life Prediction using First-Order Reliability Methods
 ACCEPTED FOR PUBLICATION IN IEEE TRANSACTIONS ON RELIABILITY 1 Uncertainty Quantification in Remaining Useful Life Prediction using First-Order Reliability Methods Shankar Sankararaman*, Member, IEEE,
CHAPTER 3 ANALYSIS OF RELIABILITY AND PROBABILITY MEASURES
 27 CHAPTER 3 ANALYSIS OF RELIABILITY AND PROBABILITY MEASURES 3.1 INTRODUCTION The express purpose of this research is to assimilate reliability and its associated probabilistic variables into the Unit
Today: Fundamentals of Monte Carlo
 Today: Fundamentals of Monte Carlo What is Monte Carlo? Named at Los Alamos in 940 s after the casino. Any method which uses (pseudo)random numbers as an essential part of the algorithm. Stochastic - not
Lecture 11. Probability Theory: an Overveiw
 Math 408 - Mathematical Statistics Lecture 11. Probability Theory: an Overveiw February 11, 2013 Konstantin Zuev (USC) Math 408, Lecture 11 February 11, 2013 1 / 24 The starting point in developing the
Part IA Probability. Definitions. Based on lectures by R. Weber Notes taken by Dexter Chua. Lent 2015
 Part IA Probability Definitions Based on lectures by R. Weber Notes taken by Dexter Chua Lent 2015 These notes are not endorsed by the lecturers, and I have modified them (often significantly) after lectures.
Formulas for probability theory and linear models SF2941
 Formulas for probability theory and linear models SF2941 These pages + Appendix 2 of Gut) are permitted as assistance at the exam. 11 maj 2008 Selected formulae of probability Bivariate probability Transforms
Random Variables. Random variables. A numerically valued map X of an outcome ω from a sample space Ω to the real line R
 In probabilistic models, a random variable is a variable whose possible values are numerical outcomes of a random phenomenon. As a function or a map, it maps from an element (or an outcome) of a sample
MA/ST 810 Mathematical-Statistical Modeling and Analysis of Complex Systems
 MA/ST 810 Mathematical-Statistical Modeling and Analysis of Complex Systems Review of Basic Probability The fundamentals, random variables, probability distributions Probability mass/density functions
Preliminary Statistics Lecture 2: Probability Theory (Outline) prelimsoas.webs.com
 prelimsoas.webs.com") 1 School of Oriental and African Studies September 2015 Department of Economics Preliminary Statistics Lecture 2: Probability Theory (Outline) prelimsoas.webs.com Gujarati D. Basic Econometrics, Appendix
1 School of Oriental and African Studies September 2015 Department of Economics Preliminary Statistics Lecture 2: Probability Theory (Outline) prelimsoas.webs.com Gujarati D. Basic Econometrics, Appendix
Introduction to Engineering Reliability
 Introduction to Engineering Reliability Robert C. Patev North Atlantic Division Regional Technical Specialist (978) 318-8394 Topics Reliability Basic Principles of Reliability Analysis Non-Probabilistic
EE4601 Communication Systems
 EE4601 Communication Systems Week 2 Review of Probability, Important Distributions 0 c 2011, Georgia Institute of Technology (lect2 1) Conditional Probability Consider a sample space that consists of two
THIRD-MOMENT STANDARDIZATION FOR STRUCTURAL RELIABILITY ANALYSIS
 THIRD-MOMENT STANDARDIZATION FOR STRUCTURAL RELIABILITY ANALYSIS By Yan-Gang Zhao and Tetsuro Ono ABSTRACT: First- and second-order reliability methods are generally considered to be among the most useful
Why study probability? Set theory. ECE 6010 Lecture 1 Introduction; Review of Random Variables
 ECE 6010 Lecture 1 Introduction; Review of Random Variables Readings from G&S: Chapter 1. Section 2.1, Section 2.3, Section 2.4, Section 3.1, Section 3.2, Section 3.5, Section 4.1, Section 4.2, Section
Multivariate Distribution Models
 Multivariate Distribution Models Model Description While the probability distribution for an individual random variable is called marginal, the probability distribution for multiple random variables is
MODIFIED MONTE CARLO WITH IMPORTANCE SAMPLING METHOD
 MODIFIED MONTE CARLO WITH IMPORTANCE SAMPLING METHOD Monte Carlo simulation methods apply a random sampling and modifications can be made of this method is by using variance reduction techniques (VRT).
Safety Envelope for Load Tolerance and Its Application to Fatigue Reliability Design
 Safety Envelope for Load Tolerance and Its Application to Fatigue Reliability Design Haoyu Wang * and Nam H. Kim University of Florida, Gainesville, FL 32611 Yoon-Jun Kim Caterpillar Inc., Peoria, IL 61656
Perhaps the simplest way of modeling two (discrete) random variables is by means of a joint PMF, defined as follows.
 random variables is by means of a joint PMF, defined as follows.") Chapter 5 Two Random Variables In a practical engineering problem, there is almost always causal relationship between different events. Some relationships are determined by physical laws, e.g., voltage
Chapter 5 Two Random Variables In a practical engineering problem, there is almost always causal relationship between different events. Some relationships are determined by physical laws, e.g., voltage
Lecture Notes 1 Probability and Random Variables. Conditional Probability and Independence. Functions of a Random Variable
 Lecture Notes 1 Probability and Random Variables Probability Spaces Conditional Probability and Independence Random Variables Functions of a Random Variable Generation of a Random Variable Jointly Distributed
Slides 8: Statistical Models in Simulation
 Slides 8: Statistical Models in Simulation Purpose and Overview The world the model-builder sees is probabilistic rather than deterministic: Some statistical model might well describe the variations. An
Lecture 10. Failure Probabilities and Safety Indexes
 Lecture 10. Failure Probabilities and Safety Indexes Igor Rychlik Chalmers Department of Mathematical Sciences Probability, Statistics and Risk, MVE300 Chalmers May 2013 Safety analysis - General setup:
EFFICIENT SHAPE OPTIMIZATION USING POLYNOMIAL CHAOS EXPANSION AND LOCAL SENSITIVITIES
 9 th ASCE Specialty Conference on Probabilistic Mechanics and Structural Reliability EFFICIENT SHAPE OPTIMIZATION USING POLYNOMIAL CHAOS EXPANSION AND LOCAL SENSITIVITIES Nam H. Kim and Haoyu Wang University
STAT2201. Analysis of Engineering & Scientific Data. Unit 3
 STAT2201 Analysis of Engineering & Scientific Data Unit 3 Slava Vaisman The University of Queensland School of Mathematics and Physics What we learned in Unit 2 (1) We defined a sample space of a random
A probabilistic method to predict fatigue crack initiation
 International Journal of Fracture (2006) 137:9 17 DOI 10.1007/s10704-005-3074-0 Springer 2006 A probabilistic method to predict fatigue crack initiation SALIL. S. KULKARNI, L. SUN, B. MORAN, S. KRISHNASWAMY
2 (Statistics) Random variables
 Random variables") 2 (Statistics) Random variables References: DeGroot and Schervish, chapters 3, 4 and 5; Stirzaker, chapters 4, 5 and 6 We will now study the main tools use for modeling experiments with unknown outcomes
2 (Statistics) Random variables References: DeGroot and Schervish, chapters 3, 4 and 5; Stirzaker, chapters 4, 5 and 6 We will now study the main tools use for modeling experiments with unknown outcomes
EC212: Introduction to Econometrics Review Materials (Wooldridge, Appendix)
") 1 EC212: Introduction to Econometrics Review Materials (Wooldridge, Appendix) Taisuke Otsu London School of Economics Summer 2018 A.1. Summation operator (Wooldridge, App. A.1) 2 3 Summation operator For
1 EC212: Introduction to Econometrics Review Materials (Wooldridge, Appendix) Taisuke Otsu London School of Economics Summer 2018 A.1. Summation operator (Wooldridge, App. A.1) 2 3 Summation operator For
1: PROBABILITY REVIEW
 1: PROBABILITY REVIEW Marek Rutkowski School of Mathematics and Statistics University of Sydney Semester 2, 2016 M. Rutkowski (USydney) Slides 1: Probability Review 1 / 56 Outline We will review the following
Lecture 1: August 28
 36-705: Intermediate Statistics Fall 2017 Lecturer: Siva Balakrishnan Lecture 1: August 28 Our broad goal for the first few lectures is to try to understand the behaviour of sums of independent random
Chapter 5. Chapter 5 sections
 1 / 43 sections Discrete univariate distributions: 5.2 Bernoulli and Binomial distributions Just skim 5.3 Hypergeometric distributions 5.4 Poisson distributions Just skim 5.5 Negative Binomial distributions
Class 8 Review Problems solutions, 18.05, Spring 2014
 Class 8 Review Problems solutions, 8.5, Spring 4 Counting and Probability. (a) Create an arrangement in stages and count the number of possibilities at each stage: ( ) Stage : Choose three of the slots
Probabilistic Aspects of Fatigue
 Probabilistic Aspects of Fatigue Introduction Professor Darrell F. Socie Department of Mechanical and Industrial Engineering 003-005 Darrell Socie, All Rights Reserved Contact Information Darrell Socie
Probability Review. Gonzalo Mateos
 Probability Review Gonzalo Mateos Dept. of ECE and Goergen Institute for Data Science University of Rochester gmateosb@ece.rochester.edu http://www.ece.rochester.edu/~gmateosb/ September 11, 2018 Introduction
Reduction of Random Variables in Structural Reliability Analysis
 Reduction of Random Variables in Structural Reliability Analysis S. Adhikari and R. S. Langley Department of Engineering University of Cambridge Trumpington Street Cambridge CB2 1PZ (U.K.) February 21,
3. Probability and Statistics
 FE661 - Statistical Methods for Financial Engineering 3. Probability and Statistics Jitkomut Songsiri definitions, probability measures conditional expectations correlation and covariance some important
Data Modeling & Analysis Techniques. Probability & Statistics. Manfred Huber
 Data Modeling & Analysis Techniques Probability & Statistics Manfred Huber 2017 1 Probability and Statistics Probability and statistics are often used interchangeably but are different, related fields
Random Variables. Cumulative Distribution Function (CDF) Amappingthattransformstheeventstotherealline.
 Amappingthattransformstheeventstotherealline.") Random Variables Amappingthattransformstheeventstotherealline. Example 1. Toss a fair coin. Define a random variable X where X is 1 if head appears and X is if tail appears. P (X =)=1/2 P (X =1)=1/2 Example
Random Variables Amappingthattransformstheeventstotherealline. Example 1. Toss a fair coin. Define a random variable X where X is 1 if head appears and X is if tail appears. P (X =)=1/2 P (X =1)=1/2 Example
Multivariate Random Variable
 Multivariate Random Variable Author: Author: Andrés Hincapié and Linyi Cao This Version: August 7, 2016 Multivariate Random Variable 3 Now we consider models with more than one r.v. These are called multivariate
Math Review Sheet, Fall 2008
 1 Descriptive Statistics Math 3070-5 Review Sheet, Fall 2008 First we need to know about the relationship among Population Samples Objects The distribution of the population can be given in one of the
Lecture Notes 1 Probability and Random Variables. Conditional Probability and Independence. Functions of a Random Variable
 Lecture Notes 1 Probability and Random Variables Probability Spaces Conditional Probability and Independence Random Variables Functions of a Random Variable Generation of a Random Variable Jointly Distributed
Stochastic optimization - how to improve computational efficiency?
 Stochastic optimization - how to improve computational efficiency? Christian Bucher Center of Mechanics and Structural Dynamics Vienna University of Technology & DYNARDO GmbH, Vienna Presentation at Czech
Continuous Random Variables
 1 / 24 Continuous Random Variables Saravanan Vijayakumaran sarva@ee.iitb.ac.in Department of Electrical Engineering Indian Institute of Technology Bombay February 27, 2013 2 / 24 Continuous Random Variables
Approximate methods for calculating probability of failure
 Approximate methods for calculating probability of failure Working with normal distributions is appealing First-order second-moment method (FOSM) Most probable point First order reliability method (FORM)
Random Variables and Their Distributions
 Chapter 3 Random Variables and Their Distributions A random variable (r.v.) is a function that assigns one and only one numerical value to each simple event in an experiment. We will denote r.vs by capital
A general procedure for rst/second-order reliability method (FORM/SORM)
") Structural Safety 21 (1999) 95±112 www.elsevier.nl/locate/strusafe A general procedure for rst/second-order reliability method (FORM/SORM) Yan-Gang Zhao*, Tetsuro Ono Department of Architecture, Nagoya
Structural Safety 21 (1999) 95±112 www.elsevier.nl/locate/strusafe A general procedure for rst/second-order reliability method (FORM/SORM) Yan-Gang Zhao*, Tetsuro Ono Department of Architecture, Nagoya
Chapter 5 continued. Chapter 5 sections
 Chapter 5 sections Discrete univariate distributions: 5.2 Bernoulli and Binomial distributions Just skim 5.3 Hypergeometric distributions 5.4 Poisson distributions Just skim 5.5 Negative Binomial distributions
E X A M. Probability Theory and Stochastic Processes Date: December 13, 2016 Duration: 4 hours. Number of pages incl.
 E X A M Course code: Course name: Number of pages incl. front page: 6 MA430-G Probability Theory and Stochastic Processes Date: December 13, 2016 Duration: 4 hours Resources allowed: Notes: Pocket calculator,
L2: Review of probability and statistics
 Probability L2: Review of probability and statistics Definition of probability Axioms and properties Conditional probability Bayes theorem Random variables Definition of a random variable Cumulative distribution
Probability Theory and Statistics. Peter Jochumzen
 Probability Theory and Statistics Peter Jochumzen April 18, 2016 Contents 1 Probability Theory And Statistics 3 1.1 Experiment, Outcome and Event................................ 3 1.2 Probability............................................
1 Presessional Probability
 1 Presessional Probability Probability theory is essential for the development of mathematical models in finance, because of the randomness nature of price fluctuations in the markets. This presessional
Stochastic Renewal Processes in Structural Reliability Analysis:
 Stochastic Renewal Processes in Structural Reliability Analysis: An Overview of Models and Applications Professor and Industrial Research Chair Department of Civil and Environmental Engineering University
Estimation of Quantiles
 9 Estimation of Quantiles The notion of quantiles was introduced in Section 3.2: recall that a quantile x α for an r.v. X is a constant such that P(X x α )=1 α. (9.1) In this chapter we examine quantiles
Analysis of Engineering and Scientific Data. Semester
 Analysis of Engineering and Scientific Data Semester 1 2019 Sabrina Streipert s.streipert@uq.edu.au Example: Draw a random number from the interval of real numbers [1, 3]. Let X represent the number. Each
Fundamental Tools - Probability Theory II
 Fundamental Tools - Probability Theory II MSc Financial Mathematics The University of Warwick September 29, 2015 MSc Financial Mathematics Fundamental Tools - Probability Theory II 1 / 22 Measurable random
2 Continuous Random Variables and their Distributions
 Name: Discussion-5 1 Introduction - Continuous random variables have a range in the form of Interval on the real number line. Union of non-overlapping intervals on real line. - We also know that for any
RELIABILITY ASSESSMENT OF EXISTING STRUCTURES
 1. Introduction RELIABILITY ASSESSMENT OF EXISTING STRUCTURES EN Eurocodes, presently being implemented into the system of national standards nearly in the whole Europe, are particularly intended for the
Deep Learning for Computer Vision
 Deep Learning for Computer Vision Lecture 3: Probability, Bayes Theorem, and Bayes Classification Peter Belhumeur Computer Science Columbia University Probability Should you play this game? Game: A fair
Lecture 2: Review of Probability
 Lecture 2: Review of Probability Zheng Tian Contents 1 Random Variables and Probability Distributions 2 1.1 Defining probabilities and random variables..................... 2 1.2 Probability distributions................................
Reliability Analysis of a Tunnel Design with RELY
 Reliability Analysis of a Tunnel Design with RELY W.Betz, I. Papaioannou, M. Eckl, H. Heidkamp, D.Straub Reliability-based structural design Eurocode 0 partial safety factors probabilistic techniques decrease
1 Exercises for lecture 1
 1 Exercises for lecture 1 Exercise 1 a) Show that if F is symmetric with respect to µ, and E( X )
STAT Chapter 5 Continuous Distributions
 STAT 270 - Chapter 5 Continuous Distributions June 27, 2012 Shirin Golchi () STAT270 June 27, 2012 1 / 59 Continuous rv s Definition: X is a continuous rv if it takes values in an interval, i.e., range
1.1 Review of Probability Theory
 1.1 Review of Probability Theory Angela Peace Biomathemtics II MATH 5355 Spring 2017 Lecture notes follow: Allen, Linda JS. An introduction to stochastic processes with applications to biology. CRC Press,
Probability theory. References:
 Reasoning Under Uncertainty References: Probability theory Mathematical methods in artificial intelligence, Bender, Chapter 7. Expert systems: Principles and programming, g, Giarratano and Riley, pag.
IE 230 Probability & Statistics in Engineering I. Closed book and notes. 60 minutes.
 Closed book and notes. 60 minutes. A summary table of some univariate continuous distributions is provided. Four Pages. In this version of the Key, I try to be more complete than necessary to receive full
Basics of Stochastic Modeling: Part II
 Basics of Stochastic Modeling: Part II Continuous Random Variables 1 Sandip Chakraborty Department of Computer Science and Engineering, INDIAN INSTITUTE OF TECHNOLOGY KHARAGPUR August 10, 2016 1 Reference
Introduction to Statistical Inference Self-study
 Introduction to Statistical Inference Self-study Contents Definition, sample space The fundamental object in probability is a nonempty sample space Ω. An event is a subset A Ω. Definition, σ-algebra A
Review of Basic Probability Theory
 Review of Basic Probability Theory James H. Steiger Department of Psychology and Human Development Vanderbilt University James H. Steiger (Vanderbilt University) 1 / 35 Review of Basic Probability Theory
Discrete Random Variables
 CPSC 53 Systems Modeling and Simulation Discrete Random Variables Dr. Anirban Mahanti Department of Computer Science University of Calgary mahanti@cpsc.ucalgary.ca Random Variables A random variable is
Random Variables. Saravanan Vijayakumaran Department of Electrical Engineering Indian Institute of Technology Bombay
 1 / 13 Random Variables Saravanan Vijayakumaran sarva@ee.iitb.ac.in Department of Electrical Engineering Indian Institute of Technology Bombay August 8, 2013 2 / 13 Random Variable Definition A real-valued
Continuous Distributions
 Continuous Distributions 1.8-1.9: Continuous Random Variables 1.10.1: Uniform Distribution (Continuous) 1.10.4-5 Exponential and Gamma Distributions: Distance between crossovers Prof. Tesler Math 283 Fall
Probability Models. 4. What is the definition of the expectation of a discrete random variable?
 1 Probability Models The list of questions below is provided in order to help you to prepare for the test and exam. It reflects only the theoretical part of the course. You should expect the questions