Traffic safety research: a challenge for extreme value statistics
|
|
|
- Dustin Heath
- 5 years ago
- Views:
Transcription

1 Traffic safety research: a challenge for extreme value statistics VTTI Driving Transportation with Technology Jenny Jonasson, Astra-Zeneca, Gothenburg Holger Rootzén, Mathematical Sciences, Chalmers
2 Traffic accidents 1.3 miljon deaths/year worldwide, million severely injured Large economic losses Less than 1 death/day in Sweden now. Down from 3 deaths/day a few decades ago at a time with much less traffic First simple measures: seatbelts, helmets, follow traffic rules, drunk driving laws,, then more sophisticated ones: rebuild roads, better tires, improve driver education, airbags,, then next level of sophistication: more driver training and retraining, ABS, ESP,, and??
3 New and exciting area for statistics Selection bias/errors Risk estimation Active safety systems for next generation cars. Important for competition with other car makers and for safety (?) Driver training, traffic laws,

4 VTTI Driving Transportation with Technology
 > try to use nearcrashes (761) to learn about crash")
5 100-car study 100 cars, appr 250 drivers, appr 1 year Five video cameras, radar sensors; front, rear (for all 100 cars) and each side (for 20 cars), vision-based lane tracker, glare detectors, GPS, accelerometer Still not enough crashes (82) > try to use nearcrashes (761) to learn about crash behavior
6 Crash Any contact with an object, either moving or fixed, at any speed in which kinetic energy is measurably transferred or dissipated, and includes other vehicles, roadside barriers, objects on or off of the roadway, pedestrians, cyclists, animals. Near-crash Any circumstance requiring a rapid, evasive maneuver by the subject vehicle, or any other vehicle, pedestrian, cyclist, or animal to avoid a crash. A rapid, evasive maneuver is defined as a steering, braking, accelerating, or any combination of control inputs that approaches the limits of the vehicle capabilities. As a guide: Subject vehicle braking >0.5 g or steering input that results in a lateral acceleration >0.4 g to avoid a crash constitutes a rapid maneuver. Selection: trigger as above and then manual selection and annotation

7
8 How can information from near-crashes be used to prevent real crashes? 1 Do near-crashes resemble real crashes? Are more extreme near-crashes more like real crashes? 2 Is it possible to find driver behavior or traffic situations which is different in near-crashes than in normal driving? Are these differences even more extreme in real crashes?
9 Statistical methods used so far: Odds ratios and logistic regression: Completly dominant but can t easily extrapolate from less severe events to more severe ones, can t easily judge extent of selection bias. Regression: Is relative risk the same for crashes and for nearcrashes? Extreme Value Statistics (almost new): Can near-crashes predict the frequency of real crashes? Do covariates behave in same way for crashes and near-crashes? Requires a continuous crash proximity or crash severity measure. Underlying philosophy: a traffic accident is a rare and extreme event.
10 Crash proximity measure Measure of how close the near-crash is to a real crash Examples: TTEC = Time To edge Crossing, Gap = time between first car leaves conflict area and second car enters conflict area, Time-to-collision (TTC), Here, TTC, the time it takes for the cars to collide when continuing with the same speeds useful for rear-ending TTC s v v 1 2 v 1 v 2 instrumented car s lead car
11 Examples of TTC computed from radar signals Possible to extract min TTC Not possible to extract min TTC
12 100-car data, risk of rear-ending, TTC 384 near-crashes, 29 with good enough radar signals, 14 crashes. qq-plot of -TTC Crash TTC < 0 Block maxima 95% confidence interval for expected number of crashes is (0.07, 0,09) (Fitted GEV conditional on TTC > 0, profile likelihood intervals) Observed number of crashes = 14 Doesn t match!
 near-crashes, max speed (km/h) All but two of the real rear-ending crashes were in")
13 Selection bias! fitted density near-crashes crashes, max speed (km/h) near-crashes, max speed (km/h) All but two of the real rear-ending crashes were in start-stop traffic while all the near-crashes with usable TTC were in higher speed situations So maybe still: yes to question 1 (?)
14 Continuous variables that could influence crash risk: 2 Speed absolute value of yaw angle distance to right and left lane markings time the driver looks off-road during last 2 s or 3 s, total length of glances off-road longer than 1.5 s during last 15 s variance of lateral acceleration variance of longitudinal acceleration.. Length of overlapping glance off road Do any of these become more and more extreme as TTC gets smaller and smaller?
15 2 Fitte logistic bivariate extreme value distribution to min/max of each of these variables and TTC for near-crashes, (0, 1] dependence parameter, 1 is independence and 0 is complete dependence max(eye off road in 3 s window) max (speed) max (variance longitudinal acc) min (dist left markings) max (dist right markings) α=1.00 α=1.00 α=1.00 α=1.00 α=0.93 Fitting was not possible for the other variables, however no indication of dependence, except for the last one
16 max -TTC max speed α = 1 length overlapping glance (12 with overlapping glance, 13 without overlapping glance, 4 vithout video)
17 Right now: Left and right censoring of baselines Models for nonsymmetric dependence Mix Block Maxima and PoT
18 Stable mixture models for Block Maxima Gumbel distribution positive stable distribution Gumbel distribution! X 1 = G 1 + ¾ 1 log(s) X 2 = G 2 + ¾ 2 log(s) bivariate logistic distribution with Gumbel marginals symmetric if same marginals
19 Stable mixture models for Block Maxima X 1 = G 1 + ¾ 1 log(s + a 1;1 S 1;1 ) X 2 = G 2 + ¾ 2 log(s) (2, 1) stable mixture distribution with Gumbel marginals (not symmetric) X 1 = G 1 + ¾ 1 log(s) X 2 = G 2 + ¾ 2 log(s + a 2;1 S 2;1 ) (1, 2) stable mixture distribution with Gumbel marginals X 1 = G 1 + ¾ 1 log(s + a 1;1 S 1;1 ) X 2 = G 2 + ¾ 2 log(s + a 2;1 S 2;1 ) (2, 2) stable mixture distribution with Gumbel marginals And so on
20 UMTRI (Gordon et al (2010)) do near-crashes give similar risk estimates as crashes? Seemingly Unrelated Regression yes to question 1 (?) EVS: TTEC road departure road way departure crash 2.3 mile segment of US-23 with117 traversals by 43 different drivers in instrumented cars. EV distribution fit to minimum TTEC values for the 117 traversals predicts 12 road departures/year On the average there were 1.8 road way departure crashes/year yes to question 1 (?)
21
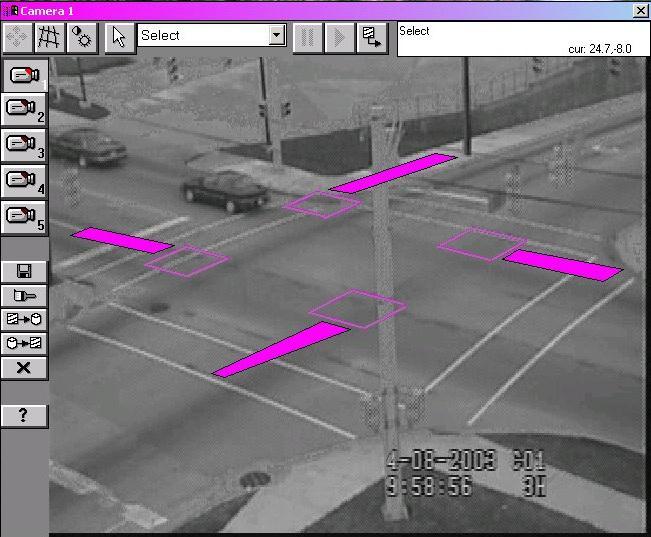
22 Daytime right-angle collisions Slide from presentation by P. Tarko, Purdue university: Risk four-year evaluation actual counts of daytime for right-angle intersections collisions model-based estimates of crash frequency four year actual counts of daytime right angle collisions Notes: (1) Model-based crash frequency estimate of site is excluded from this plot. The value of the estimate is 387. (2) Error bars represent 95% Poisson confidence intervals based on the observed counts. EVS estimate of crash frequency from gap measurements -- 8-hour observations of crossing gaps. Signalized intersections in the Lafayette area. Summer Error bars show 95% Poisson confidence intervals based on observed counts 20 yes to question 1 (??) 10 0 site site site site site site site site site site site site 97920
 -5-4 -3-2 -1 0 1 Precipitating Event e.g. braking lead vehicle")
23 Example Victor & Dozza (2012) Eyes Off Road Over Time (100ms bins) (Crashes & Near Crashes) Precipitating Event e.g. braking lead vehicle
24 Odds Ratio Inattention & Risk example Victor and Dozza, Risk Inattention SHRP2 3,5 3 2,5 2 1,5 1 0,5 Total Glance Time case control (Klauer 2006) Total Glance Time case crossover (Liang et al 2011) Total Glance Time case control (present paper) Last Single Glance (present paper) Glance History (previous glances) (present paper) LG5s glances at t=5s (present paper) 0 Less than 0.5s s s s More than 2.0s The overlapping glance gives the highest OR-s
 Last Single Glance (present paper) Glance History (previous glances) (present paper) LG5s glances at t=5s (present paper) 0 Less than 0.5s 0.5-1.0 s 1.")
25 Odds Ratio Example Victor & Dozza (2011) 4 3,5 3 2,5 2 1,5 1 0,5 (Crashes and Near Crashes) Off Road Total Glance Time case control (Klauer 2006) Total Glance Time case crossover (Liang et al 2011) Total Glance Time case control (present paper) Last Single Glance (present paper) Glance History (previous glances) (present paper) LG5s glances at t=5s (present paper) 0 Less than 0.5s s s s More than 2.0s
26 One conclusion different kinds of nearcrashes and crashes; naturalistics studies; vehicles; drivers, all lead to different kinds of Selection bias Crash proximity measures Driver behavior and covariates All require separate careful analysis No omnibus answer to is there selection bias in choice of near-crashes
27 The future Use near-crashes to investigate how (and if) attention measures and other driving and traffic characteristics influence crash risk highdimensional variable seclection new research questions Develop statistical predictors of crash risk optimal choice of predictors new research questions Investigate the relation of risk estimates obtained in different in naturalistic driving studies (Semifot, 100-car, SHRP 2, ) Study the normal driving near-crash/crash relation in naturalistic driving experiments More and better data crucial

28 SHRP cars 3 years Much better instrumentation (?) Started a year ago

29 M. Barnes*, A. Blankespoor, D. Blower, T. Gordon, P. Green, L. Kostyniuk, D. LeBlanc, S. Bogard., B. R. Cannon, and S.B. McLaughlin (2010). Development of Analysis Methods Using Recent Data: A Multivariate Analysis of Crash and Naturalistic Event Data in Relation to Highway Factors Using the GIS Framework. Final Report SHRP S01, University of Michigan Transportation Research Institute Dozza, M. and Trent, V. (2012). Inattention risk function (lead vehicle crashes). A SHRP2 S08 analysis report.) P. Tarko, and P. Songchitruksa (2006). Estimating frequency of chrashes as extreme traffic events. Report, Purdue University J. Jonasson and H. Rootzén (2012). Internal validation of near-crashes in naturalistic driving studies: a continuous and multivariate approach. K.-F. Wu and P.P. Jovanis. Crashes and crash-surrogate events: Exploratory modeling with naturalistic driving data. Accident Analysis and Prevention, 45: , 2012.
Freeway rear-end collision risk for Italian freeways. An extreme value theory approach
 XXII SIDT National Scientific Seminar Politecnico di Bari 14 15 SETTEMBRE 2017 Freeway rear-end collision risk for Italian freeways. An extreme value theory approach Gregorio Gecchele Federico Orsini University
Multiple Changepoint Detection on speed profile in work zones using SHRP 2 Naturalistic Driving Study Data
 Multiple Changepoint Detection on speed profile in work zones using SHRP 2 Naturalistic Driving Study Data Hossein Naraghi 2017 Mid-Continent TRS Background Presence of road constructions and maintenance
Warning Timing, Driver Distraction, and Driver Response to Imminent Rear-End Collisions
 AEBS/LDWS-06-08 Warning Timing, Driver Distraction, and Driver Response to Imminent Rear-End Collisions review of some research literature referred to in the ITS guidelines for high-priority warnings 1
Recognizing safety-critical events from naturalistic driving data
 Recognizing safety-critical events from naturalistic driving data Master s Thesis in the Master s programme of Automotive Engineering NIEVES PAÑEDA GONZÁLEZ Department of Applied Mechanics Division of
We provide two sections from the book (in preparation) Intelligent and Autonomous Road Vehicles, by Ozguner, Acarman and Redmill.
 Intelligent and Autonomous Road Vehicles, by Ozguner, Acarman and Redmill.") We provide two sections from the book (in preparation) Intelligent and Autonomous Road Vehicles, by Ozguner, Acarman and Redmill. 2.3.2. Steering control using point mass model: Open loop commands We consider
We provide two sections from the book (in preparation) Intelligent and Autonomous Road Vehicles, by Ozguner, Acarman and Redmill. 2.3.2. Steering control using point mass model: Open loop commands We consider
Indirect Clinical Evidence of Driver Inattention as a Cause of Crashes
 University of Iowa Iowa Research Online Driving Assessment Conference 2007 Driving Assessment Conference Jul 10th, 12:00 AM Indirect Clinical Evidence of Driver Inattention as a Cause of Crashes Gary A.
THE POTENTIAL OF APPLYING MACHINE LEARNING FOR PREDICTING CUT-IN BEHAVIOUR OF SURROUNDING TRAFFIC FOR TRUCK-PLATOONING SAFETY
 THE POTENTIAL OF APPLYING MACHINE LEARNING FOR PREDICTING CUT-IN BEHAVIOUR OF SURROUNDING TRAFFIC FOR TRUCK-PLATOONING SAFETY Irene Cara Jan-Pieter Paardekooper TNO Helmond The Netherlands Paper Number
Using High-Resolution Detector and Signal Data to Support Crash Identification and Reconstruction. Indrajit Chatterjee Gary Davis May, 2011
 Using High-Resolution Detector and Signal Data to Support Crash Identification and Reconstruction Indrajit Chatterjee Gary Davis May, 2011 Introduction Road accidents are complex phenomenon. Causal factors
CHALLENGE #1: ROAD CONDITIONS
 CHALLENGE #1: ROAD CONDITIONS Your forward collision warning system may struggle on wet or icy roads because it is not able to adjust for road conditions. Wet or slick roads may increase your stopping
Understand FORWARD COLLISION WARNING WHAT IS IT? HOW DOES IT WORK? HOW TO USE IT?
 Understand WHAT IS IT? Forward collision warning systems warn you of an impending collision by detecting stopped or slowly moved vehicles ahead of your vehicle. Forward collision warning use radar, lasers,
Document downloaded from: This paper must be cited as:
 Document downloaded from: http://hdl.handle.net// This paper must be cited as: Llorca Garcia, C.; Moreno Chou, AT.; García García, A.; Pérez Zuriaga, AM. (). Daytime and Nighttime Passing Maneuvers on
Effect of Driving Environment on Drivers Eye Movements: Re-Analyzing Previously Collected Eye-tracker Data
 Paper No.: 10-1363 Effect of Driving Environment on Drivers Eye Movements: Re-Analyzing Previously Collected Eye-tracker Data *Corresponding author by Mr. Myunghoon Ko Zachry Department of Civil Engineering
Vehicle Motion Equations:
 1 Vehicle Motion Equations: v = at + v (2.2.4) x x = v2 2 v 2a (2.2.6) v 2 = v 2 + 2a(x x ) (2.2.6) x = 1 2 at2 + v t + x (2.2.7) D b = x cos α (2.2.10) x = vt D b = v 2 v 2 2g(f G) (2.2.14) e + f s =
Perth County Road Fatal Head-on Collision - A Common and Dangerous Issue
 Perth County Road Fatal Head-on Collision - A Common and Dangerous Issue Posting Date: 25-Aug-2016 Figure 1: View looking east long "Speeders Alley" - a more appropriate name for the long, straight and
To convert a speed to a velocity. V = Velocity in feet per seconds (ft/sec) S = Speed in miles per hour (mph) = Mathematical Constant
 S = Speed in miles per hour (mph) = Mathematical Constant") To convert a speed to a velocity V S ( 1.466) V Velocity in feet per seconds (ft/sec) S Speed in miles per hour (mph) 1.466 Mathematical Constant Example Your driver just had a rear-end accident and says
To convert a speed to a velocity V S ( 1.466) V Velocity in feet per seconds (ft/sec) S Speed in miles per hour (mph) 1.466 Mathematical Constant Example Your driver just had a rear-end accident and says
CHAPTER 3. CAPACITY OF SIGNALIZED INTERSECTIONS
 CHAPTER 3. CAPACITY OF SIGNALIZED INTERSECTIONS 1. Overview In this chapter we explore the models on which the HCM capacity analysis method for signalized intersections are based. While the method has
Paper ID TP0832. Operational Safety for Autonomous Vehicles
 12 th ITS European Congress, Strasbourg, France, 19-22 June 2017 Paper ID TP0832 Operational Safety for Autonomous Vehicles Sven Maerivoet 1* and Lars Akkermans 2 1. Transport & Mobility Leuven, Belgium,
DAYLIGHT, TWILIGHT, AND NIGHT VARIATION IN ROAD ENVIRONMENT-RELATED FREEWAY TRAFFIC CRASHES IN KOREA
 DAYLIGHT, TWILIGHT, AND NIGHT VARIATION IN ROAD ENVIRONMENT-RELATED FREEWAY TRAFFIC CRASHES IN KOREA Sungmin Hong, Ph.D. Korea Transportation Safety Authority 17, Hyeoksin 6-ro, Gimcheon-si, Gyeongsangbuk-do,
ESTIMATION OF MODIFIED TIME TO COLLISION AS SURROGATE FOR MID-BLOCK CRASHES UNDER MIXED TRAFFIC CONDITIONS
 ESTIMATION OF MODIFIED TIME TO COLLISION AS SURROGATE FOR MID-BLOCK CRASHES UNDER MIXED TRAFFIC CONDITIONS 0 Anna Charly Doctoral Student Department of Civil Engineering Indian Institute of Technology
SPH3U: Introducing The BIG Five Equations of Constant Acceleration
 SPH3U: Introducing The BIG Five Equations of Constant Acceleration A: Displacement for Constant Velocity and Constant Acceleration Constant Velocity: Alice drives her car at a velocity of 20 m/s [W] for
Q1. (a) The diagram shows a car being driven at 14 rn/s. The driver has forgotten to clear a thick layer of snow from the roof.
 The diagram shows a car being driven at 14 rn/s. The driver has forgotten to clear a thick layer of snow from the roof.") Q1. (a) The diagram shows a car being driven at 14 rn/s. The driver has forgotten to clear a thick layer of snow from the roof. Which of the following has the smallest momentum? Draw a circle around your
Q1. (a) The diagram shows a car being driven at 14 rn/s. The driver has forgotten to clear a thick layer of snow from the roof. Which of the following has the smallest momentum? Draw a circle around your
Revision checklist. Step Learning outcome Had a look Nearly there Nailed it!
 Motion and Forces a Resultant forces Step Learning outcome Had a look Nearly there Nailed it Explain the difference between scalar and vector quantities. Use arrows to represent the direction and magnitude
New Achievement in the Prediction of Highway Accidents
 Article New Achievement in the Prediction of Highway Accidents Gholamali Shafabakhsh a, * and Yousef Sajed b Faculty of Civil Engineering, Semnan University, University Sq., P.O. Box 35196-45399, Semnan,
RISK FACTORS FOR FATAL GENERAL AVIATION ACCIDENTS IN DEGRADED VISUAL CONDITIONS
 RISK FACTORS FOR FATAL GENERAL AVIATION ACCIDENTS IN DEGRADED VISUAL CONDITIONS Jana M. Price Loren S. Groff National Transportation Safety Board Washington, D.C. The prevalence of weather-related general
Identify the letter of the choice that best completes the statement or answers the question.
 Chapter 12 - Practice Questions Multiple Choice Identify the letter of the choice that best completes the statement or answers the question. 1) Never remove a radiator cap on a hot engine because a. the
Factors Affecting the Severity of Injuries Sustained in Collisions with Roadside Objects
 Factors Affecting the Severity of Injuries Sustained in Collisions with Roadside Objects Presenter: Ashirwad Barnwal Adviser: Dr. Peter T. Savolainen Source: clipartbest.com 1 Overview Background Research
Drivers Lane-Keeping Ability in Heavy Rain
 Drivers Lane-Keeping Ability in Heavy Rain Preliminary Investigation Using SHRP 2 Naturalistic Driving Study Data Ali Ghasemzadeh and Mohamed M. Ahmed There is a lack of studies that have examined the
FORMULATION OF DRIVER JUDGMENT PROCESS AROUND CURVES FOR DEVIATED STATE DETECTION. Tokyo, Japan
 FORMULATION OF DRIVER JUDGMENT PROCESS AROUND CURVES FOR DEVIATED STATE DETECTION Motoki Shino 1, Hiroshi Yoshitake 1, Machiko Hiramatsu 2, Takashi Sunda 2 & Minoru Kamata 1 1 The University of Tokyo 2
Chalmers Publication Library
 Chalmers Publication Library Probabilistic Threat Assessment and Driver Modeling in Collision Avoidance Systems This document has been downloaded from Chalmers Publication Library (CPL). It is the author
arxiv: v3 [cs.sy] 30 Jan 2017
![arxiv: v3 [cs.sy] 30 Jan 2017](/thumbs/90/101409787.jpg "arxiv: v3 [cs.sy] 30 Jan 2017") Evaluation of Automated Vehicles in the Frontal Cut-in Scenario - an Enhanced Approach using Piecewise Mixture Models Zhiyuan Huang 1, Ding Zhao 2, Henry Lam 1, David J. LeBlanc 2 and Huei Peng 3 arxiv:1610.09450v3
Evaluation of Automated Vehicles in the Frontal Cut-in Scenario - an Enhanced Approach using Piecewise Mixture Models Zhiyuan Huang 1, Ding Zhao 2, Henry Lam 1, David J. LeBlanc 2 and Huei Peng 3 arxiv:1610.09450v3
Modeling: Start to Finish
 A model for Vehicular Stopping Distance 64 Modeling: Start to Finish Example. Vehicular Stopping Distance Background: In driver s training, you learn a rule for how far behind other cars you are supposed
Transport. Pupil Booklet
 Duncanrig Secondary School East Kilbride S3 Physics Elective Transport Pupil Booklet Name: Class: Aspects of the following outcomes in bold are covered by this topic of work. SCN 4-07a I can use appropriate
Driving in Rural Areas. 82 percent of a miles of roadways are rural roads.
 Driving in Rural Areas 82 percent of a miles of roadways are rural roads. Different types of Roadways Rural roads are constructed of many different types of materials. Some are paved Others are not. Different
Choosing a Safe Vehicle Challenge: Analysis: Measuring Speed Challenge: Analysis: Reflection:
 Activity 73: Choosing a Safe Vehicle Challenge: Which vehicle do you think is safer? 1. Compare the features you listed in the data evidence section to the features listed on the worksheet. a. How are
MACRO-LEVEL ANALYSIS OF THE IMPACTS OF URBAN FACTORS ON TAFFIC CRASHES: A CASE STUDY OF CENTRAL OHIO
 Paper presented at the 52nd Annual Meeting of the Western Regional Science Association, Santa Barbara, February 24-27, 2013. MACRO-LEVEL ANALYSIS OF THE IMPACTS OF URBAN FACTORS ON TAFFIC CRASHES: A CASE
TRB Paper Examining Methods for Estimating Crash Counts According to Their Collision Type
 TRB Paper 10-2572 Examining Methods for Estimating Crash Counts According to Their Collision Type Srinivas Reddy Geedipally 1 Engineering Research Associate Texas Transportation Institute Texas A&M University
A Study on Performance Analysis of V2V Communication Based AEB System Considering Road Friction at Slopes
 , pp. 71-80 http://dx.doi.org/10.14257/ijfgcn.2016.9.11.07 A Study on Performance Analysis of V2V Communication Based AEB System Considering Road Friction at Slopes Sangduck Jeon 1, Jungeun Lee 1 and Byeongwoo
AKTIVE SICHERHEIT 4.0. Prof. K. Kompass, Dr. S. Nitsche April 2017
 AKTIVE SICHERHEIT 4.0 Prof. K. Kompass, Dr. S. Nitsche April 2017 L e v e l of p e r f o r m a n c e ASSISTED AND AUTOMATED DRIVING HIGHER LEVELS OF AUTOMATION ACTIVE SAFETY L e v e l of a u t o m a t
1 INTRODUCTION 2 PROBLEM DEFINITION
 Autonomous cruise control with cut-in target vehicle detection Ashwin Carvalho, Alek Williams, Stéphanie Lefèvre & Francesco Borrelli Department of Mechanical Engineering University of California Berkeley,
Predicting Lane Position for Roadway Departure Prevention
 Predicting Lane Position for Roadway Departure Prevention Parag H. Batavia Dean A. Pomerleau Charles E. Thorpe {parag pomerlea cet@ri.cmu.edu} Carnegie Mellon University - Robotics Institute Smith Hall
Xiaoguang Wang, Assistant Professor, Department of Geography, Central Michigan University Chao Liu,
 Xiaoguang Wang, Email: wang9x@cmich.edu Assistant Professor, Department of Geography, Central Michigan University Chao Liu, Email: cliu8@umd.edu Research Associate, National Center for Smart Growth, Research
The Effect of Sun Glare on Traffic Accidents in Chiba Prefecture, Japan
 Asian Transport Studies, Volume 3, Issue 2 (2014), 205 219. 2014 ATS All rights reserved The Effect of Sun Glare on Traffic Accidents in Chiba Prefecture, Japan Kenji HAGITA a*, Kenji MORI b a Traffic
Transportation and Road Weather
 Portland State University PDXScholar TREC Friday Seminar Series Transportation Research and Education Center (TREC) 4-18-2014 Transportation and Road Weather Rhonda Young University of Wyoming Let us know
Heterogeneity and Causality: Unit Heterogeneity and Design Sensitivity in Observational Studies. Paul R. Rosenbaum, University of Pennsylvania
 Heterogeneity and Causality: Unit Heterogeneity and Design Sensitivity in Observational Studies Paul R. Rosenbaum, University of Pennsylvania References [1] Rosenbaum, P. R. (2005) Heterogeneity and causality:
BAD WEATHER DOESN T CAUSE ACCIDENTS
 March 15, 1997 It is with mixed feelings of humor and dismay that persons in the field of traffic safety read frequent headlines in the newspapers--even the largest dailies--blaming the weather for automobile
05724 BUTLER TWP PD /04/ :31 Sun 39:54: :11: F F T 1
 ue 7035 2 ru 0572 BUTLER TWP PD 0 57 Butler 06/0/207 6:3 Sun 39:5:53.69 08::56.6 39.996 8.99069 N DIXIE DR 6.70 N VANCO LA 03 T 0 2 2 Unit # was traveling southbound on North Dixie Drive and when at Vanco
Collision warning system based on probability density functions van den Broek, T.H.A.; Ploeg, J.
 Collision warning system based on probability density functions van den Broek, T.H.A.; Ploeg, J. Published in: Proceedings of the 7th International Workshop on Intelligent Transportation WIT 2010, 23-24
2. Experiment Description
 Acta Polytechnica CTU Proceedings 12:74 78, 2017 Czech Technical University in Prague, 2017 doi:10.14311/app.2017.12.0074 available online at http://ojs.cvut.cz/ojs/index.php/app CORRELATION ANALYSIS OF
MARITIME TRANSPORTATION RESEARCH AND EDUCATION CENTER TIER 1 UNIVERSITY TRANSPORTATION CENTER U.S. DEPARTMENT OF TRANSPORTATION
 MARITIME TRANSPORTATION RESEARCH AND EDUCATION CENTER TIER 1 UNIVERSITY TRANSPORTATION CENTER U.S. DEPARTMENT OF TRANSPORTATION Identifying High-Risk Roadways for Infrastructure Investment Using Naturalistic
Hypothesis Testing. Week 04. Presented by : W. Rofianto
 Hypothesis Testing Week 04 Presented by : W. Rofianto Tests about a Population Mean: σ unknown Test Statistic t x 0 s / n This test statistic has a t distribution with n - 1 degrees of freedom. Example:
Development of an Errorable Car-Following Driver Model
 S. Yang and H. Peng, Development of an Errorable Car-Following Driver Model, Vehicle System Dynamics, Volume 48, Issue 6, October 9, pp.751-773. Development of an Errorable Car-Following Driver Model HSIN
EXAMINATION OF THE SAFETY IMPACTS OF VARYING FOG DENSITIES: A CASE STUDY OF I-77 IN VIRGINIA
 0 0 0 EXAMINATION OF THE SAFETY IMPACTS OF VARYING FOG DENSITIES: A CASE STUDY OF I- IN VIRGINIA Katie McCann Graduate Research Assistant University of Virginia 0 Edgemont Road Charlottesville, VA 0 --
Laws of accident causation. Rune Elvik, Institute of Transport Economics
 Laws of accident causation Rune Elvik, Institute of Transport Economics Multiple theories of accident causation 1. Accidents as random events 2. Accident proneness theory 3. Causal theory (in-depth approach)
NCHRP Inclusion Process and Literature Review Procedure for Part D
 NCHRP 17-7 Inclusion Process and Literature Review Procedure for Part D Geni Bahar, P. Eng. Margaret Parkhill, P. Eng. Errol Tan, P. Eng. Chris Philp, P. Eng. Nesta Morris, M.Sc. (Econ) Sasha Naylor, EIT
Unobserved Heterogeneity and the Statistical Analysis of Highway Accident Data. Fred Mannering University of South Florida
 Unobserved Heterogeneity and the Statistical Analysis of Highway Accident Data Fred Mannering University of South Florida Highway Accidents Cost the lives of 1.25 million people per year Leading cause
Chapter 5 Traffic Flow Characteristics
 Chapter 5 Traffic Flow Characteristics 1 Contents 2 Introduction The Nature of Traffic Flow Approaches to Understanding Traffic Flow Parameters Connected with Traffic Flow Categories of Traffic Flow The
FIRST MIDTERM - REVIEW PROBLEMS
 Physics 10 Spring 009 George Williams FIRST MIDTERM - REVIEW PROBLEMS A data sheet is provided at the end. Problems labeled [Ch. 4] are relevant to the second midterm. 1. Convert 747 m to feet. Convert
MARITIME TRANSPORTATION RESEARCH AND EDUCATION CENTER TIER 1 UNIVERSITY TRANSPORTATION CENTER U.S. DEPARTMENT OF TRANSPORTATION
 MARITIME TRANSPORTATION RESEARCH AND EDUCATION CENTER TIER 1 UNIVERSITY TRANSPORTATION CENTER U.S. DEPARTMENT OF TRANSPORTATION Statistical Analysis of Vehicle Crashes in Mississippi Based on Crash Data
Local Calibration Factors for Implementing the Highway Safety Manual in Maine
 Local Calibration Factors for Implementing the Highway Safety Manual in Maine 2017 Northeast Transportation Safety Conference Cromwell, Connecticut October 24-25, 2017 MAINE Darryl Belz, P.E. Maine Department
Confirmatory and Exploratory Data Analyses Using PROC GENMOD: Factors Associated with Red Light Running Crashes
 Confirmatory and Exploratory Data Analyses Using PROC GENMOD: Factors Associated with Red Light Running Crashes Li wan Chen, LENDIS Corporation, McLean, VA Forrest Council, Highway Safety Research Center,
Traffic Modelling for Moving-Block Train Control System
 Commun. Theor. Phys. (Beijing, China) 47 (2007) pp. 601 606 c International Academic Publishers Vol. 47, No. 4, April 15, 2007 Traffic Modelling for Moving-Block Train Control System TANG Tao and LI Ke-Ping
Checklist: Deposing the Driver in an Auto Accident
 Checklist: Deposing the Driver in an Auto Accident 1. PERSONAL BACKGROUND All names ever used Present and past residences for 10 years If the deponent has rented a residence, get the name and address of
White Paper Luminance & Illuminance. Brief explanation of photometry for the application of tunnel lighting control
 White Paper Luminance & Illuminance Brief explanation of photometry for the application of tunnel lighting control 1 General This document gives a brief explanation of photometry, the basics of tunnel
Data-Driven Probabilistic Modeling and Verification of Human Driver Behavior
 Formal Verification and Modeling in Human-Machine Systems: Papers from the AAAI Spring Symposium Data-Driven Probabilistic Modeling and Verification of Human Driver Behavior D. Sadigh, K. Driggs-Campbell,
2.1 KINEMATICS HW/Study Packet
 2.1 KINEMATICS HW/Study Packet Required: READ Hamper pp 17-28 READ Tsokos, pp 38-62 SL/HL Supplemental: Cutnell and Johnson, pp 28-52 Giancoli, pp 19-38 ü ü ü ü ü REMEMBER TO. Work through all of the example
suppressing traffic flow instabilities
 suppressing traffic flow instabilities S S VF VC VL D D Berthold K.P. Horn Traffic flow instabilities waste energy: At high densities traffic flow becomes unstable Traffic acts as if it was a dilatant
Overtaking & Receding Vehicle Detection for Driver Assistance and Naturalistic Driving Studies
 Overtaking & Receding Vehicle Detection for Driver Assistance and Naturalistic Driving Studies Ravi Kumar Satzoda and Mohan M. Trivedi Abstract Although on-road vehicle detection is a wellresearched area,
Evaluating Hydroplaning Potential of Rutted Highway Pavements
 Evaluating Hydroplaning Potential of Rutted Highway Pavements Longjia CHU a, Tien F. FWA b, Ghim P. ONG c a Department of Civil & Environmental Engineering, National University of Singapore, 119260, Singapore;
YOUR VEHICLE WINDOWS
 REDUCED VISIBILITY WHENEVER VISIBILITY IS REDUCED DRIVERS NEED MORE TIME TO USE THE IPDE PROCESS. YOU CAN MAINTAIN A SAFE INTENDED PATH OF TRAVEL BY: SLOWING DOWN TO GIVE YOURSELF MORE TIME SCANNING IN
A NOVEL METHOD TO EVALUATE THE SAFETY OF HIGHLY AUTOMATED VEHICLES. Joshua L. Every Transportation Research Center Inc. United States of America
 A NOVEL METHOD TO EVALUATE THE SAFETY OF HIGHLY AUTOMATED VEHICLES Joshua L. Every Transportation Research Center Inc. United States of America Frank Barickman John Martin National Highway Traffic Safety
Experiments of Earthquake Early Warning to Expressway Drivers using Plural Driving Simulators
 nd International Conference on Urban Disaster Reduction November ~9, Experiments of Earthquake Early Warning to Expressway Drivers using Plural Driving Simulators Fumio Yamazaki 1*, Yoshihisa Maruyama
From Test Collisions to Stiffness Coefficients
 From Test Collisions to Stiffness Coefficients Jon Neades. AiTS, South Cerney, Glos. Abstract The use of computer programs to estimate the changes in velocity (Delta-V) suffered by a vehicle in a collision
Time Space Diagrams for Thirteen Shock Waves
 Time Space Diagrams for Thirteen Shock Waves Benjamin Coifman Institute of Transportation Studies 19 McLaughlin Hall University of California Berkeley, CA 9472 zephyr@eecs.berkeley.edu http://www.cs.berkeley.edu/~zephyr
Traffic and Road Monitoring and Management System for Smart City Environment
 Traffic and Road Monitoring and Management System for Smart City Environment Cyrel Ontimare Manlises Mapua Institute of Technology Manila, Philippines IoT on Traffic Law Enforcement to Vehicles with the
(a) (i) The toy has a mass of 0.15 kg and moves forward with a velocity of 0.08 m/s. How is the momentum of the toy calculated?
 (i) The toy has a mass of 0.15 kg and moves forward with a velocity of 0.08 m/s. How is the momentum of the toy calculated?") MOMENTUM Q1. The diagram shows an air-driven toy. When the electric motor is switched on the fan rotates. The fan pushes air backwards making the toy move forwards. The toy has a mass of 0.15 kg and moves
MOMENTUM Q1. The diagram shows an air-driven toy. When the electric motor is switched on the fan rotates. The fan pushes air backwards making the toy move forwards. The toy has a mass of 0.15 kg and moves
Egg Crash! Designing a Collision Safety Device
 TEACHER LESSON Key question(s) How do people survive major collisions? How does physics explain the effectiveness of seat belts and airbags? Crash Course Definitions impulse: product of force and time
Marginal versus conditional effects: does it make a difference? Mireille Schnitzer, PhD Université de Montréal
 Marginal versus conditional effects: does it make a difference? Mireille Schnitzer, PhD Université de Montréal Overview In observational and experimental studies, the goal may be to estimate the effect
Lecture-19: Modeling Count Data II
 Lecture-19: Modeling Count Data II 1 In Today s Class Recap of Count data models Truncated count data models Zero-inflated models Panel count data models R-implementation 2 Count Data In many a phenomena
Simulation study of traffic accidents in bidirectional traffic models
 arxiv:0905.4252v1 [physics.soc-ph] 26 May 2009 Simulation study of traffic accidents in bidirectional traffic models Najem Moussa Département de Mathématique et Informatique, Faculté des Sciences, B.P.
QUASI-ANALYTIC ACCELERATION INJURY RISK FUNCTIONS: APPLICATION TO CAR OCCUPANT RISK IN FRONTAL COLLISIONS
 QUASI-ANALYTIC ACCELERATION INJURY RISK FUNCTIONS: APPLICATION TO CAR OCCUPANT RISK IN FRONTAL COLLISIONS Denis Wood 1, Ciaran Simms 2, Colin Glynn 3, Anders Kullgren 4 and Anders Ydenius 4 1. Denis Wood
Annual Collision Report
 2016 Annual Collision Report Contents The Annual Collision Report is a summary of statistics associated with traffic collisions that occurred in the City of Winnipeg. This information is provided by Manitoba
An Introduction to the Safety Force Field
 An Introduction to the Safety Force Field David Nistér, Hon-Leung Lee, Julia Ng, Yizhou Wang MAR19 An Introduction to the Safety Force Field David Nistér, Hon-Leung Lee, Julia Ng, Yizhou Wang NVIDIA This
A Cellular Automaton Model for Heterogeneous and Incosistent Driver Behavior in Urban Traffic
 Commun. Theor. Phys. 58 (202) 744 748 Vol. 58, No. 5, November 5, 202 A Cellular Automaton Model for Heterogeneous and Incosistent Driver Behavior in Urban Traffic LIU Ming-Zhe ( ), ZHAO Shi-Bo ( ô ),,
Large Scale Automated Analysis of Vehicle Interactions and Collisions
 Large Scale Automated Analysis of Vehicle Interactions and Collisions N. Saunier, Ph.D. (corresponding author) Assistant Professor, Department of Civil, Geological and Mining Engineering École Polytechnique
A New Paradigm for Rear-end Crash Prevention Driving Performance
 Copyright 2001 Society of Automotive Engineers, Inc. A New Paradigm for Rear-end Crash Prevention Driving Performance August L. Burgett and Robert J. Miller, Jr. National Highway Traffic
Q1. (a) The diagram shows an athlete at the start of a race. The race is along a straight track.
 The diagram shows an athlete at the start of a race. The race is along a straight track.") Q1. (a) The diagram shows an athlete at the start of a race. The race is along a straight track. In the first 2 seconds, the athlete accelerates constantly and reaches a speed of 9 m/s. (i) Use the equation
Q1. (a) The diagram shows an athlete at the start of a race. The race is along a straight track. In the first 2 seconds, the athlete accelerates constantly and reaches a speed of 9 m/s. (i) Use the equation
Research Article Headway Distributions Based on Empirical Erlang and Pearson Type III Time Methods Compared
 Research Journal of Applied Sciences, Engineering and Technology 7(21): 4410-4414, 2014 DOI:10.19026/rjaset.7.817 ISSN: 2040-7459; e-issn: 2040-7467 2014 Maxwell Scientific Publication Corp. Submitted:
EVALUATION OF SAFETY PERFORMANCES ON FREEWAY DIVERGE AREA AND FREEWAY EXIT RAMPS. Transportation Seminar February 16 th, 2009
 EVALUATION OF SAFETY PERFORMANCES ON FREEWAY DIVERGE AREA AND FREEWAY EXIT RAMPS Transportation Seminar February 16 th, 2009 By: Hongyun Chen Graduate Research Assistant 1 Outline Introduction Problem
Advanced Adaptive Cruise Control Based on Collision Risk Assessment
 Advanced Adaptive Cruise Control Based on Collision Risk Assessment Hanwool Woo 1, Yonghoon Ji 2, Yusuke Tamura 1, Yasuhide Kuroda 3, Takashi Sugano 4, Yasunori Yamamoto 4, Atsushi Yamashita 1, and Hajime
MODELING OF 85 TH PERCENTILE SPEED FOR RURAL HIGHWAYS FOR ENHANCED TRAFFIC SAFETY ANNUAL REPORT FOR FY 2009 (ODOT SPR ITEM No.
 MODELING OF 85 TH PERCENTILE SPEED FOR RURAL HIGHWAYS FOR ENHANCED TRAFFIC SAFETY ANNUAL REPORT FOR FY 2009 (ODOT SPR ITEM No. 2211) Submitted to: Ginger McGovern, P.E. Planning and Research Division Engineer
Name Period Date. Record all givens, draw a picture, arrow all vectors, write the formula, substitute and solve. units
 Example Problems 5.2 Friction E1. A monkey is dragging a box full of books from his office to his car. The combined weight of the box and books is 134 N. If the coefficient of static friction between the
DEVELOPMENT OF CRASH PREDICTION MODEL USING MULTIPLE REGRESSION ANALYSIS Harshit Gupta 1, Dr. Siddhartha Rokade 2 1
 DEVELOPMENT OF CRASH PREDICTION MODEL USING MULTIPLE REGRESSION ANALYSIS Harshit Gupta 1, Dr. Siddhartha Rokade 2 1 PG Student, 2 Assistant Professor, Department of Civil Engineering, Maulana Azad National
Road Vehicle Dynamics
 Road Vehicle Dynamics Table of Contents: Foreword Preface Chapter 1 Introduction 1.1 General 1.2 Vehicle System Classification 1.3 Dynamic System 1.4 Classification of Dynamic System Models 1.5 Constraints,
Draft 01PC-73 Sensor fusion for accurate computation of yaw rate and absolute velocity
 Draft PC-73 Sensor fusion for accurate computation of yaw rate and absolute velocity Fredrik Gustafsson Department of Electrical Engineering, Linköping University, Sweden Stefan Ahlqvist, Urban Forssell,
Geospatial Big Data Analytics for Road Network Safety Management
 Proceedings of the 2018 World Transport Convention Beijing, China, June 18-21, 2018 Geospatial Big Data Analytics for Road Network Safety Management ABSTRACT Wei Liu GHD Level 1, 103 Tristram Street, Hamilton,
A Proposed Driver Assistance System in Adverse Weather Conditions
 1 A Proposed Driver Assistance System in Adverse Weather Conditions National Rural ITS Conference Student Paper Competition Second runner-up Ismail Zohdy Ph.D. Student, Department of Civil & Environmental
Show all workings for questions that involve multiple choice.
 Assignment 2 Unit 2 Newton s Laws (Outcomes 325-5, 325-8) Name: Multiple Choice: Show all workings for questions that involve multiple choice. 1 Which choice represents a NON-INERTIAL frame of reference?
Traffic Flow. June 30, David Bosworth
 Traffic Flow June 30, 2009 By David Bosworth Abstract: In the following, I will try to eplain the method of characteristics, which is involved in solving many aspects of traffic flow, but not for traffic
ENHANCING ROAD SAFETY MANAGEMENT WITH GIS MAPPING AND GEOSPATIAL DATABASE
 Abstract ENHANCING ROAD SAFETY MANAGEMENT WITH GIS MAPPING AND GEOSPATIAL DATABASE Dr Wei Liu GHD Reliable and accurate data are needed in each stage of road safety management in order to correctly identify
1.0 INTRODUCTION AND SUMMARY...
 TABLE OF CONTENTS 1.0 INTRODUCTION AND SUMMARY... 1 1.1 Purpose and Study Objective... 1 1.2 Executive Summary... 1 2.0 ROADWAY CONDITIONS... 5 2.1 Granville Parkway (South Intersection)... 8 2.2 Tuscany