Using High-Resolution Detector and Signal Data to Support Crash Identification and Reconstruction. Indrajit Chatterjee Gary Davis May, 2011
|
|
|
- Robert Lyons
- 5 years ago
- Views:
Transcription
1 Using High-Resolution Detector and Signal Data to Support Crash Identification and Reconstruction Indrajit Chatterjee Gary Davis May, 2011
2 Introduction Road accidents are complex phenomenon. Causal factors such as excessive speed, successive braking of vehicles, signal violation, inadequate gap acceptance. 2 Causality via Measurability. Can the existing traffic performance measure system help us to learn about driver behaviors involved in an event?
3 More Data, Precise the Estimate 3 Classical skid mark problem in crash reconstruction. Assumption: Prior knowledge about! (say, uniform). Measurement: skid mark, d with some measurement error (say, normal error). Using Bayesian approach, posterior distribution of pre-skid speed. Now, assume we have some occupancy data from near-by detector.
4 Posterior Speed Distribution 4
5 High-Resolution Data Evaluate arterial performance measures such as travel time, queue length estimation and travel delay. 5 SMART-SIGNAL is one such integrated event based data collection and storage system (Dr. Henry Liu, UMN). Collects including every vehicle actuation over detectors located near intersections and every signal phase change. - individual vehicle arrival and departure time and signal phase change.
6 Sample SMART Signal data 6 Detector Actuation start occ (secs) Phase Signal start status dur (secs) 26 10:30: :30: G :30: :31: Y :30: :32: G :30: :33: Y :30: :33: G :30: :35: Y :31: :36: G :31: :37: Y :31: :38: G :31: :39: Y 5.485

7 Case Study of Signal Violation 7
8 Source of data Identification Methodology 8 - Preliminary Crash Report. (crash occurred around 16:07) - Detector and signal data from SMART-SIGNAL system. ( for a time window bracketing the crash occurrence) Segregate the detector actuation events (i.e. occupancy time) based on whether the corresponding signal phase was red or green. - Occupancy plots corresponding to separate green and red phases for detectors 4 and 3( EB TH 55, 400 feet u/s)
9 Signal Layout 9 Note: Figure created by Dr. Liu, and his students
10 Occupancy pattern for detector 4 (red phase) 10
11 Occupancy data for detector 4 during red phase 11
12 Post-Incident occupancy pattern at detector 4 during green phase 12
13 Post-Incident occupancy pattern at detector 3 green phase 13
14 Parameter Change Technique Page(1954) introduced CUSUM statistic to detect change in the mean value. CUSUM is based on prior knowledge of the expected measure of a process. 14 Suppose a sequence, {t 1,t 2,.t n }, such that
15 CUSUM Example A sequence of two Gaussian/Normal processes 15
16 CUSUM statistic for occupancy at detector 3 16 **A change in the occupancy trend after 16:06: is identified.

17 Identification of Unit 2 (SB on Winnetka Ave) Crash report indicated that unit 2 was a 2002 Buick LeSabre & 8 d = feet
18 Unit 2 identification A very high occupancy time for detector 8 was recorded at 16:06: Based on CUSUM statistics we have a bound for time of crash 16:06: and 16:06: Unit 2 was then identified as the most probable vehicle recorded at detector 7 or 8 with an estimated speed, based on the occupancy time, to arrive at the collision point within the bound. (Unit 2 was the vehicle recorded at detector 7 at 16:06: with occupancy time of secs.)
19 Crash Reconstruction 19 Baker s(1990) notion of causal factors circumstances contributing to a result without which the result could not have occurred. Given the initial speed estimates and locations (both space and time) from detector data, what could be learned about the behavior of the drivers involved in the crash. Trajectories of the two approaching vehicles (assuming constant speed) were modeled by numerically solving a system of difference equations.
20 20 Separation Distance Based on Initial Speed Estimates Unit 2 Unit 1 Note: Given the initial speed estimates, Unit 1 would have arrived earlier than Unit 2 at the potential conflict point.
21 Traditional accident reconstruction Accident reconstruction involves estimation of the speed of the vehicles at the point of collision from post collision information. 21 Given such post collision information, it is possible to estimate driver behaviors contributing to the crash. In the absence of such detailed information a plausible hypothetical post collision scenario was added for illustration.
22 Post-collision scenario 22 5 to 20 feet Approximately 60 feet
23 Applying impulse-momentum principle, collision set was established as 23 where, d crit (14.7 feet) is the crash closeness threshold. Simulation model 3 parameter model is selected. (a) Unit 2 acceleration (acc2 in feet/sec 2 ) (b) Unit 1 deceleration (dcc1 in feet/sec 2 ) (c) For unit 1, driver perception-reaction time (rt in secs) Monte Carlo Simulation
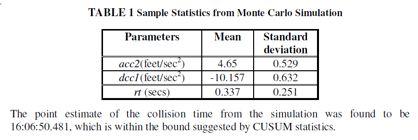
24 24
25 Conclusion 25 Demonstrate SMART-signal data along with crash report can be used to learn about an event. Parameter change (CUSUM) used to identify the crash based on occupancy measurements, however, this methodology may not yield good results for all cases, particularly for less severe incidents. If specific details regarding post-collision status of the vehicles,( e.g. in case of fatal crashes) are available successful reconstruction of the event is possible.
26 THANK YOU! 26
Indirect Clinical Evidence of Driver Inattention as a Cause of Crashes
 University of Iowa Iowa Research Online Driving Assessment Conference 2007 Driving Assessment Conference Jul 10th, 12:00 AM Indirect Clinical Evidence of Driver Inattention as a Cause of Crashes Gary A.
Revision checklist. Step Learning outcome Had a look Nearly there Nailed it!
 Motion and Forces a Resultant forces Step Learning outcome Had a look Nearly there Nailed it Explain the difference between scalar and vector quantities. Use arrows to represent the direction and magnitude
CHAPTER 3. CAPACITY OF SIGNALIZED INTERSECTIONS
 CHAPTER 3. CAPACITY OF SIGNALIZED INTERSECTIONS 1. Overview In this chapter we explore the models on which the HCM capacity analysis method for signalized intersections are based. While the method has
To convert a speed to a velocity. V = Velocity in feet per seconds (ft/sec) S = Speed in miles per hour (mph) = Mathematical Constant
 S = Speed in miles per hour (mph) = Mathematical Constant") To convert a speed to a velocity V S ( 1.466) V Velocity in feet per seconds (ft/sec) S Speed in miles per hour (mph) 1.466 Mathematical Constant Example Your driver just had a rear-end accident and says
To convert a speed to a velocity V S ( 1.466) V Velocity in feet per seconds (ft/sec) S Speed in miles per hour (mph) 1.466 Mathematical Constant Example Your driver just had a rear-end accident and says
FIRST MIDTERM - REVIEW PROBLEMS
 Physics 10 Spring 009 George Williams FIRST MIDTERM - REVIEW PROBLEMS A data sheet is provided at the end. Problems labeled [Ch. 4] are relevant to the second midterm. 1. Convert 747 m to feet. Convert
Overcoming the Limitations of Conservation of Linear Momentum by Including External Impulse
 Overcoming the Limitations of Conservation of Linear Momentum by Including External Impulse March 12, 2008 The University of Tulsa MEPS Lunch Meeting 1 / 40 Motivation The University of Tulsa MEPS Lunch
Signalized Intersection Delay Models
 Signalized Intersection Delay Models Lecture Notes in Transportation Systems Engineering Prof. Tom V. Mathew Contents 1 Introduction 1 2 Types of delay 2 2.1 Stopped Time Delay................................
Roundabout Level of Service
 Roundabout Level of Service Rahmi Akçelik Director Akcelik & Associates Pty Ltd email: rahmi.akcelik@sidrasolutions.com web: www.sidrasolutions.com 8 January 2009 Contents 1. Introduction... 1 2. Fundamental
Overview. NASA Distance-Rate-Time Math In Air Traffic Control. World s Largest D-R-T Problem. Challenges of Air Traffic Control
 National Aeronautics and Space Administration NASA Distance-Rate-Time Math In Air Traffic Control Grades 5-9 Welcome Overview Introduction to Standards- Based Physical Experiment Six Math Methods Online
Table of Contents Introduction... 4 Study Area... 5
 Table of Contents Introduction... 4 Study Area... 5 Streets and s... 5 Traffic Volumes... 8 Recent and Anticipated Development... 10 Crash Analysis... 10 Projected Traffic Volumes... 11 Trip Generation...
Chapter 5 Traffic Flow Characteristics
 Chapter 5 Traffic Flow Characteristics 1 Contents 2 Introduction The Nature of Traffic Flow Approaches to Understanding Traffic Flow Parameters Connected with Traffic Flow Categories of Traffic Flow The
CE351 Transportation Systems: Planning and Design
 CE351 Transportation Systems: Planning and Design TOPIC: Level of Service (LOS) at Traffic Signals 1 Course Outline Introduction to Transportation Highway Users and their Performance Geometric Design Pavement
Warning Timing, Driver Distraction, and Driver Response to Imminent Rear-End Collisions
 AEBS/LDWS-06-08 Warning Timing, Driver Distraction, and Driver Response to Imminent Rear-End Collisions review of some research literature referred to in the ITS guidelines for high-priority warnings 1
Statistical Model Checking Applied on Perception and Decision-making Systems for Autonomous Driving
 Statistical Model Checking Applied on Perception and Decision-making Systems for Autonomous Driving J. Quilbeuf 1 M. Barbier 2,3 L. Rummelhard 3 C. Laugier 2 A. Legay 1 T. Genevois 2 J. Ibañez-Guzmán 3
MnDOT Method for Calculating Measures of Effectiveness (MOE) From CORSIM Model Output
 From CORSIM Model Output") MnDOT Method for Calculating Measures of Effectiveness (MOE) From CORSIM Model Output Rev. April 29, 2005 MnDOT Method for Calculating Measures of Effectiveness (MOE) From CORSIM Model Output Table of
MnDOT Method for Calculating Measures of Effectiveness (MOE) From CORSIM Model Output Rev. April 29, 2005 MnDOT Method for Calculating Measures of Effectiveness (MOE) From CORSIM Model Output Table of
A Case Control Study of Speed and Crash Risk. Technical Report 2
 A Case Control Study of Speed and Crash Risk Technical Report 2 Bayesian Reconstruction of Traffic Accidents and the Causal Effect of Speed in Intersection and Pedestrian Accidents Final Report Prepared
Worksheet 1: One-Dimensional Kinematics
 Worksheet 1: One-Dimensional Kinematics Objectives Relate,, and in examples of motion along one dimension. Visualize motion using graphs of,, and vs.. Solve numeric problems involving constant and constant.
2.1 Traffic Stream Characteristics. Time Space Diagram and Measurement Procedures Variables of Interest
 2.1 Traffic Stream Characteristics Time Space Diagram and Measurement Procedures Variables of Interest Traffic Stream Models 2.1 Traffic Stream Characteristics Time Space Diagram Speed =100km/h = 27.78
Signalized Intersection Delay Models
 Chapter 35 Signalized Intersection Delay Models 35.1 Introduction Signalized intersections are the important points or nodes within a system of highways and streets. To describe some measure of effectiveness
FORENSIC SURVEYING FORENSIC SURVEYING Part 2
 FORENSIC SURVEYING FORENSIC SURVEYING Part 2 BERNARD M. TELATOVICH, P.E., ESQ. PART 2 BERNARD M. TELATOVICH, P.E., ESQ. CONSULTING SERVICES & INVESTIGATIONS, LLC New York January 2017 What is Evidence?
Traffic safety research: a challenge for extreme value statistics
 Traffic safety research: a challenge for extreme value statistics VTTI Driving Transportation with Technology Jenny Jonasson, Astra-Zeneca, Gothenburg Holger Rootzén, Mathematical Sciences, Chalmers http://www.math.chalmers.se/~rootzen/
Real-time, Adaptive Prediction of Incident Delay for Advanced Traffic Management Systems
 Real-time, Adaptive Prediction of Incident Delay for Advanced Traffic Management Systems Liping Fu and Bruce Hellinga Department of Civil Engineering, University of Waterloo, Waterloo, Canada Phone: 59
05724 BUTLER TWP PD /04/ :31 Sun 39:54: :11: F F T 1
 ue 7035 2 ru 0572 BUTLER TWP PD 0 57 Butler 06/0/207 6:3 Sun 39:5:53.69 08::56.6 39.996 8.99069 N DIXIE DR 6.70 N VANCO LA 03 T 0 2 2 Unit # was traveling southbound on North Dixie Drive and when at Vanco
Modeling: Start to Finish
 A model for Vehicular Stopping Distance 64 Modeling: Start to Finish Example. Vehicular Stopping Distance Background: In driver s training, you learn a rule for how far behind other cars you are supposed
Signalized Intersection Delay Models
 hapter 56 Signalized Intersection Delay Models 56.1 Introduction Signalized intersections are the important points or nodes within a system of highways and streets. To describe some measure of effectiveness
WEBER ROAD RESIDENTIAL DEVELOPMENT Single Family Residential Project
 WEBER ROAD RESIDENTIAL DEVELOPMENT Single Family Residential Project WEBER ROAD RESIDENTIAL DEVELOPMENT TRAFFIC IMPACT STUDY TABLE OF CONTENTS 1.0 Executive Summary Page 2.0 Introduction 2.1 DEVELOPMENT
Perth County Road Fatal Head-on Collision - A Common and Dangerous Issue
 Perth County Road Fatal Head-on Collision - A Common and Dangerous Issue Posting Date: 25-Aug-2016 Figure 1: View looking east long "Speeders Alley" - a more appropriate name for the long, straight and
Signalized Intersections
 Signalized Intersections Kelly Pitera October 23, 2009 Topics to be Covered Introduction/Definitions D/D/1 Queueing Phasing and Timing Plan Level of Service (LOS) Signal Optimization Conflicting Operational
Cumulative Count Curve and Queueing Analysis
 Introduction Traffic flow theory (TFT) Zhengbing He, Ph.D., http://zhengbing.weebly.com School of traffic and transportation, Beijing Jiaotong University September 27, 2015 Introduction Outline 1 Introduction
Traffic Modelling for Moving-Block Train Control System
 Commun. Theor. Phys. (Beijing, China) 47 (2007) pp. 601 606 c International Academic Publishers Vol. 47, No. 4, April 15, 2007 Traffic Modelling for Moving-Block Train Control System TANG Tao and LI Ke-Ping
FORCE AND MOTION SEPUP UNIT OVERVIEW
 FORCE AND MOTION SEPUP UNIT OVERVIEW Listed below is a summary of the activities in this unit. Note that the total teaching time is listed as 26-32 periods of approximately 50 minutes (approximately 5-6
ESTIMATION OF MODIFIED TIME TO COLLISION AS SURROGATE FOR MID-BLOCK CRASHES UNDER MIXED TRAFFIC CONDITIONS
 ESTIMATION OF MODIFIED TIME TO COLLISION AS SURROGATE FOR MID-BLOCK CRASHES UNDER MIXED TRAFFIC CONDITIONS 0 Anna Charly Doctoral Student Department of Civil Engineering Indian Institute of Technology
Egg Crash! Designing a Collision Safety Device
 TEACHER LESSON Key question(s) How do people survive major collisions? How does physics explain the effectiveness of seat belts and airbags? Crash Course Definitions impulse: product of force and time
A Study of Red Light Cameras in Kansas City, MO
 A Study of Red Light s in Kansas City, MO Prepared by the Special Operations Division Executive Summary This paper will analyze the crash data for the 29 red light cameras located in 17 intersections in
Created by T. Madas CALCULUS KINEMATICS. Created by T. Madas
 CALCULUS KINEMATICS CALCULUS KINEMATICS IN SCALAR FORM Question (**) A particle P is moving on the x axis and its acceleration a ms, t seconds after a given instant, is given by a = 6t 8, t 0. The particle
A Proposed Driver Assistance System in Adverse Weather Conditions
 1 A Proposed Driver Assistance System in Adverse Weather Conditions National Rural ITS Conference Student Paper Competition Second runner-up Ismail Zohdy Ph.D. Student, Department of Civil & Environmental
Vehicle Motion Equations:
 1 Vehicle Motion Equations: v = at + v (2.2.4) x x = v2 2 v 2a (2.2.6) v 2 = v 2 + 2a(x x ) (2.2.6) x = 1 2 at2 + v t + x (2.2.7) D b = x cos α (2.2.10) x = vt D b = v 2 v 2 2g(f G) (2.2.14) e + f s =
1.225 Transportation Flow Systems Quiz (December 17, 2001; Duration: 3 hours)
") 1.225 Transportation Flow Systems Quiz (December 17, 2001; Duration: 3 hours) Student Name: Alias: Instructions: 1. This exam is open-book 2. No cooperation is permitted 3. Please write down your name
1.225 Transportation Flow Systems Quiz (December 17, 2001; Duration: 3 hours) Student Name: Alias: Instructions: 1. This exam is open-book 2. No cooperation is permitted 3. Please write down your name
Freeway rear-end collision risk for Italian freeways. An extreme value theory approach
 XXII SIDT National Scientific Seminar Politecnico di Bari 14 15 SETTEMBRE 2017 Freeway rear-end collision risk for Italian freeways. An extreme value theory approach Gregorio Gecchele Federico Orsini University
an expression, in terms of t, for the distance of the particle from O at time [3]
![an expression, in terms of t, for the distance of the particle from O at time [3]](/thumbs/88/114967411.jpg "an expression, in terms of t, for the distance of the particle from O at time [3]") HORIZON EDUCATION SINGAPORE Additional Mathematics Practice Questions: Kinematics Set 1 1 A particle moves in a straight line so that t seconds after passing through O, its velocity v cm s -1, is given
HORIZON EDUCATION SINGAPORE Additional Mathematics Practice Questions: Kinematics Set 1 1 A particle moves in a straight line so that t seconds after passing through O, its velocity v cm s -1, is given
University of Central Florida, USA
 Dr. Mohamed Abdel-Aty, PE Trustee Chair Pegasus Professor and Chair Department of Civil, Environmental & Construction Engineering University of Central Florida, USA Editor-in-Chief, Accident Analysis &
Choosing a Safe Vehicle Challenge: Analysis: Measuring Speed Challenge: Analysis: Reflection:
 Activity 73: Choosing a Safe Vehicle Challenge: Which vehicle do you think is safer? 1. Compare the features you listed in the data evidence section to the features listed on the worksheet. a. How are
Traffic Progression Models
 Traffic Progression Models Lecture Notes in Transportation Systems Engineering Prof. Tom V. Mathew Contents 1 Introduction 1 2 Characterizing Platoon 2 2.1 Variables describing platoon............................
Impact of Day-to-Day Variability of Peak Hour Volumes on Signalized Intersection Performance
 Impact of Day-to-Day Variability of Peak Hour Volumes on Signalized Intersection Performance Bruce Hellinga, PhD, PEng Associate Professor (Corresponding Author) Department of Civil and Environmental Engineering,
SCIENCE 20 UNIT B: CHANGES IN MOTION CHAPTER AND UNIT REVIEW QUESTIONS
 SCIENCE 20 UNIT B: CHANGES IN MOTION CHAPTER AND UNIT REVIEW QUESTIONS Science 20 Unit B: Changes in Motion Chapter and Unit Review Questions This document is intended for You may find the following Internet
Factors Affecting the Severity of Injuries Sustained in Collisions with Roadside Objects
 Factors Affecting the Severity of Injuries Sustained in Collisions with Roadside Objects Presenter: Ashirwad Barnwal Adviser: Dr. Peter T. Savolainen Source: clipartbest.com 1 Overview Background Research
Our next test will be on Monday, April 6!
 Physics 2211 BCD Test form Name Spring 2015 Test 3 Recitation Section (see back of test): 1) Print your name, test form number (above), and nine-digit student number in the section of the answer card labeled
Improving Safety Features during a Head on Collision inside a Car Cabin
 Improving Safety Features during a Head on Collision inside a Car Cabin Harinarayan Vishwakarma Abstract The core theme of this research is directed towards the idea of providing more safety features inside
D sn 1 (Total 1 mark) Q3. A ball of mass 2.0 kg, initially at rest, is acted on by a force F which varies with time t as shown by the graph.
 Q3. A ball of mass 2.0 kg, initially at rest, is acted on by a force F which varies with time t as shown by the graph.") Drayton Manor High School Momentum, Impulse, Force-time Graphs Old Exam Questions Q1. Which one of the following is a possible unit of impulse? A Ns 1 B kg ms 1 C kg ms 2 D sn 1 (Total 1 mark) Q2. Which
Drayton Manor High School Momentum, Impulse, Force-time Graphs Old Exam Questions Q1. Which one of the following is a possible unit of impulse? A Ns 1 B kg ms 1 C kg ms 2 D sn 1 (Total 1 mark) Q2. Which
Report of a Complaint Handling Review in relation to Police Scotland
 Report of a Complaint Handling Review in relation to Police Scotland independent and effective investigations and reviews independent and effective investigations and reviews Index 1. Role of the PIRC
Available online Journal of Scientific and Engineering Research, 2017, 4(4): Research Article
: Research Article") Available online www.jsaer.com, 2017, 4(4):137-142 Research Article ISSN: 2394-2630 CODEN(USA): JSERBR A Qualitative Examination of the Composition of the Cooperative Vehicles Çağlar Koşun 1, Çağatay Kök
Available online www.jsaer.com, 2017, 4(4):137-142 Research Article ISSN: 2394-2630 CODEN(USA): JSERBR A Qualitative Examination of the Composition of the Cooperative Vehicles Çağlar Koşun 1, Çağatay Kök
VIRGINIA S I-77 VARIABLE SPEED LIMIT SYSTEM FOR LOW VISIBILITY CONDITIONS
 VIRGINIA S I-77 VARIABLE SPEED LIMIT SYSTEM FOR LOW VISIBILITY CONDITIONS Christopher D. McDonald, PE, PTOE Regional Operations Director, Southwest Region NRITS and ITS Arizona Annual Conference October
MODELING OF 85 TH PERCENTILE SPEED FOR RURAL HIGHWAYS FOR ENHANCED TRAFFIC SAFETY ANNUAL REPORT FOR FY 2009 (ODOT SPR ITEM No.
 MODELING OF 85 TH PERCENTILE SPEED FOR RURAL HIGHWAYS FOR ENHANCED TRAFFIC SAFETY ANNUAL REPORT FOR FY 2009 (ODOT SPR ITEM No. 2211) Submitted to: Ginger McGovern, P.E. Planning and Research Division Engineer
Simulation study of traffic accidents in bidirectional traffic models
 arxiv:0905.4252v1 [physics.soc-ph] 26 May 2009 Simulation study of traffic accidents in bidirectional traffic models Najem Moussa Département de Mathématique et Informatique, Faculté des Sciences, B.P.
11.3 Solving Radical Equations
 Name Class Date 11.3 Solving Radical Equations Essential Question: How can you solve equations involving square roots and cube roots? Explore Investigating Solutions of Square Root Equations Resource Locker
Derivation of the Yellow Change Interval Formula
 Derivation of the Yellow Change Interval Formula Brian Ceccarelli, PE; Joseph Shovlin, PhD The yellow change interval formula traffic engineers use to set yellow light durations originated from a paper
CHAPTER 2. CAPACITY OF TWO-WAY STOP-CONTROLLED INTERSECTIONS
 CHAPTER 2. CAPACITY OF TWO-WAY STOP-CONTROLLED INTERSECTIONS 1. Overview In this chapter we will explore the models on which the HCM capacity analysis method for two-way stop-controlled (TWSC) intersections
Checklist: Deposing the Driver in an Auto Accident
 Checklist: Deposing the Driver in an Auto Accident 1. PERSONAL BACKGROUND All names ever used Present and past residences for 10 years If the deponent has rented a residence, get the name and address of
Skid testing with confidence
 Skid testing with confidence Jon Neades AiTS, Unit A5 Lakeside Business Park, South Cerney, Glos. GL7 5XL Impact Spring 013 Vol. 1 No. 1 pp 4-8 Abstract Determining a suitable coefficient of friction is
Connected Vehicle Technology Affected Safety Surrogate Measurement Hao Liu 1, Heng Wei 2, Ting Zuo 3, Y. Jeffrey Yang 4
 1 Connected Vehicle Technology Affected Safety Surrogate Measurement Hao Liu 1, Heng Wei 2, Ting Zuo 3, Y. Jeffrey Yang 4 Ph.D., Postdoctoral Research Fellow, PATH Program, The University of California
Derivation of the Yellow Change Interval Formula
 Derivation of the Yellow Change Interval Formula Brian Ceccarelli, Joseph Shovlin The yellow change interval formula traffic engineers use to set yellow light durations originated from a paper written
Poisson Point Processes
 Poisson Point Processes Tuesday, April 22, 2014 2:00 PM Homework 4 posted; due Wednesday, May 7. We'll begin with Poisson point processes in one dimension which actually are an example of both a Poisson
CHAPTER 5 DELAY ESTIMATION FOR OVERSATURATED SIGNALIZED APPROACHES
 CHAPTER 5 DELAY ESTIMATION FOR OVERSATURATED SIGNALIZED APPROACHES Delay is an important measure of effectiveness in traffic studies, as it presents the direct cost of fuel consumption and indirect cost
TRAFFIC IMPACT STUDY. Platte Canyon Villas Arapahoe County, Colorado (Arapahoe County Case Number: Z16-001) For
 For") TRAFFIC IMPACT STUDY For Platte Canyon Villas Arapahoe County, Colorado (Arapahoe County Case Number: Z16-001) February 2015 Revised: August 2015 April 2016 July 2016 September 2016 Prepared for: KB Home
TRAFFIC IMPACT STUDY For Platte Canyon Villas Arapahoe County, Colorado (Arapahoe County Case Number: Z16-001) February 2015 Revised: August 2015 April 2016 July 2016 September 2016 Prepared for: KB Home
m/s m/s m/s m/s
 P and J review Name 10-FEB-03 1. The diagram shows two carts on a horizontal, frictionless surface being pushed apart when a compressed spring attached to one of the carts is released. Cart A has a mass
SPH3U: Introducing The BIG Five Equations of Constant Acceleration
 SPH3U: Introducing The BIG Five Equations of Constant Acceleration A: Displacement for Constant Velocity and Constant Acceleration Constant Velocity: Alice drives her car at a velocity of 20 m/s [W] for
A first car following model
 A first car following model CE 391F March 21, 2013 ANNOUNCEMENTS Homework 3 to be posted this weekend Course project abstracts due Tuesday Announcements REVIEW Driver characteristics... Reaction time and
EGG CRASH! DESIGNING A COLLISION SAFETY DEVICE
 T E AC H E R L E S S O N EGG CRASH! DESIGNING A COLLISION SAFETY DEVICE DEFINITIONS momentum: the inertia of moving objects; product of the mass and the velocity of an object (p = mv) impulse: product
Research Article Headway Distributions Based on Empirical Erlang and Pearson Type III Time Methods Compared
 Research Journal of Applied Sciences, Engineering and Technology 7(21): 4410-4414, 2014 DOI:10.19026/rjaset.7.817 ISSN: 2040-7459; e-issn: 2040-7467 2014 Maxwell Scientific Publication Corp. Submitted:
A Speed-Delay Study of Highway 401 in Toronto, Ontario
 A Speed-Delay Study of Highway 41 in Toronto, Ontario Bruce Hellinga and Michel Van Aerde Department of Civil Engineering Queen's University, Kingston, Ontario, Canada K7L 3N6 ABSTRACT Travel time is an
Name Period Date. Record all givens, draw a picture, arrow all vectors, write the formula, substitute and solve. units
 Example Problems 5.2 Friction E1. A monkey is dragging a box full of books from his office to his car. The combined weight of the box and books is 134 N. If the coefficient of static friction between the
Signalized Intersection Delay Models
 Transportation System Engineering 56. Signalized Intersection Delay Models Chapter 56 Signalized Intersection Delay Models 56.1 Introduction Signalized intersections are the important points or nodes within
A New Paradigm for Rear-end Crash Prevention Driving Performance
 Copyright 2001 Society of Automotive Engineers, Inc. A New Paradigm for Rear-end Crash Prevention Driving Performance August L. Burgett and Robert J. Miller, Jr. National Highway Traffic
Collisions in Two Dimensions
 Collisions in Two Dimensions Why physicists are so awesome at pool, and How to reconstruct car accidents! Practice: 6.31, 6.33, 6.39, 6.41, 6.43, 6.45, 6.47, 6.49, 6.51, 6.53, 6.55, 6.63, 6.73 I hope you
Modelling and Simulation for Train Movement Control Using Car-Following Strategy
 Commun. Theor. Phys. 55 (2011) 29 34 Vol. 55, No. 1, January 15, 2011 Modelling and Simulation for Train Movement Control Using Car-Following Strategy LI Ke-Ping (Ó ), GAO Zi-You (Ô Ð), and TANG Tao (»
Estimation of Measures of Effectiveness Based on Connected Vehicle Data
 Estimation of Measures of Effectiveness Based on Connected Vehicle Data Juan Argote, Eleni Christofa, Yiguang Xuan, and Alexander Skabardonis Abstract Vehicle-infrastructure cooperation via the Connected
arxiv: v1 [physics.soc-ph] 13 Oct 2017
![arxiv: v1 [physics.soc-ph] 13 Oct 2017](/thumbs/81/83343449.jpg "arxiv: v1 [physics.soc-ph] 13 Oct 2017") arxiv:171.5752v1 [physics.soc-ph] 13 Oct 217 Analysis of risk levels for traffic on a multi-lane highway Michael Herty Giuseppe Visconti Institut für Geometrie und Praktische Mathematik (IGPM), RWTH Aachen
arxiv:171.5752v1 [physics.soc-ph] 13 Oct 217 Analysis of risk levels for traffic on a multi-lane highway Michael Herty Giuseppe Visconti Institut für Geometrie und Praktische Mathematik (IGPM), RWTH Aachen
Answers to Problem Set Number 02 for MIT (Spring 2008)
") Answers to Problem Set Number 02 for 18.311 MIT (Spring 2008) Rodolfo R. Rosales (MIT, Math. Dept., room 2-337, Cambridge, MA 02139). March 10, 2008. Course TA: Timothy Nguyen, MIT, Dept. of Mathematics,
Answers to Problem Set Number 02 for 18.311 MIT (Spring 2008) Rodolfo R. Rosales (MIT, Math. Dept., room 2-337, Cambridge, MA 02139). March 10, 2008. Course TA: Timothy Nguyen, MIT, Dept. of Mathematics,
A Bayesian. Network Model of Pilot Response to TCAS RAs. MIT Lincoln Laboratory. Robert Moss & Ted Londner. Federal Aviation Administration
 A Bayesian Network Model of Pilot Response to TCAS RAs Robert Moss & Ted Londner MIT Lincoln Laboratory ATM R&D Seminar June 28, 2017 This work is sponsored by the under Air Force Contract #FA8721-05-C-0002.
arxiv: v1 [physics.soc-ph] 17 Oct 2016
![arxiv: v1 [physics.soc-ph] 17 Oct 2016](/thumbs/90/102622259.jpg "arxiv: v1 [physics.soc-ph] 17 Oct 2016") Local stability conditions and calibrating procedure for new car-following models used in driving simulators arxiv:1610.05257v1 [physics.soc-ph] 17 Oct 2016 Valentina Kurc and Igor Anufriev Abstract The
Local stability conditions and calibrating procedure for new car-following models used in driving simulators arxiv:1610.05257v1 [physics.soc-ph] 17 Oct 2016 Valentina Kurc and Igor Anufriev Abstract The
Modeling Driver Behavior During Merge Maneuvers
 Southwest Region University Transportation Center Modeling Driver Behavior During Merge Maneuvers SWUTC/98/472840-00064-1 Center for Transportation Research University of Texas at Austin 3208 Red River,
EVALUATION OF SAFETY PERFORMANCES ON FREEWAY DIVERGE AREA AND FREEWAY EXIT RAMPS. Transportation Seminar February 16 th, 2009
 EVALUATION OF SAFETY PERFORMANCES ON FREEWAY DIVERGE AREA AND FREEWAY EXIT RAMPS Transportation Seminar February 16 th, 2009 By: Hongyun Chen Graduate Research Assistant 1 Outline Introduction Problem
A Case Control Study of Speed and Crash Risk. Technical Report 3. Speed as a Risk Factor in Run-off Road Crashes
 A Case Control Study of Speed and Crash Risk Technical Report 3 Speed as a Risk Factor in Run-off Road Crashes Final Report Prepared by: Gary A. Davis, Sujay Davuluri, Jian Ping Pei Department of Civil
1. The diagram below shows water falling from a dam. Each minute kg of water falls vertically into the pool at the bottom.
 1. The diagram below shows water falling from a dam. Each minute 12 000 kg of water falls vertically into the pool at the bottom. The time taken for the water to fall is 2 s and the acceleration of the
INTERVEHICLE communications based on wireless technologies
 IEEE TRANSACTIONS ON INTELLIGENT TRANSPORTATION SYSTEMS 1 A Stochastic Model for Chain Collisions of Vehicles Equipped With Vehicular Communications Carolina Garcia-Costa, Esteban Egea-Lopez, Juan Bautista
Appendix C Final Methods and Assumptions for Forecasting Traffic Volumes
 Fairview Ave. and Main St. Improvements and Local Streets Plan Appendices Ada County Highway District Appendix C Final Methods and Assumptions for Forecasting Traffic Volumes January 3, 207 Appendices
Research on Heat Conduction Inverse Problem of Continuous Long Downhill Truck Brake
 International Conference on Civil, Transportation and Environment (ICCTE 2016) Research on Heat Conduction Inverse Problem of Continuous Long Downhill Truck Brake Shun Zeng1, a,heng Zhang2,b,Yunwei Meng1,c
A Cellular Automaton Model for Heterogeneous and Incosistent Driver Behavior in Urban Traffic
 Commun. Theor. Phys. 58 (202) 744 748 Vol. 58, No. 5, November 5, 202 A Cellular Automaton Model for Heterogeneous and Incosistent Driver Behavior in Urban Traffic LIU Ming-Zhe ( ), ZHAO Shi-Bo ( ô ),,
Evaluation of Road Safety in Portugal: A Case Study Analysis. Instituto Superior Técnico
 Evaluation of Road Safety in Portugal: A Case Study Analysis Ana Fernandes José Neves Instituto Superior Técnico OUTLINE Objectives Methodology Results Road environments Expected number of road accidents
Activity 4. Life (and Death) before Seat Belts. What Do You Think? For You To Do GOALS
 before Seat Belts. What Do You Think? For You To Do GOALS") Activity 4 Life (and Death) before Seat Belts Activity 4 Life (and Death) before Seat Belts GOALS In this activity you will: Understand Newton s First Law of Motion. Understand the role of safety belts.
Activity 4 Life (and Death) before Seat Belts Activity 4 Life (and Death) before Seat Belts GOALS In this activity you will: Understand Newton s First Law of Motion. Understand the role of safety belts.
April 10, Mr. Curt Van De Walle, City Manager City of Castle Hills 209 Lemonwood Drive Castle Hills, Texas 78213
 Mr. Curt Van De Walle, City Manager City of Castle Hills 209 Lemonwood Drive Castle Hills, Texas 78213 Subject: Revised Castle Hills BASIS Charter School Traffic Impact Analysis Review City of Castle Hills,
Spatial discrete hazards using Hierarchical Bayesian Modeling
 Spatial discrete hazards using Hierarchical Bayesian Modeling Mathias Graf ETH Zurich, Institute for Structural Engineering, Group Risk & Safety 1 Papers -Maes, M.A., Dann M., Sarkar S., and Midtgaard,
Warren County Schools PHYSICS PACING GUIDE (SEMESTER)
") Warren County Schools PHYSICS PACING GUIDE 2017 2018 (SEMESTER) Philosophical approach to the process of teaching and learning science in the Warren County School District (WCS). In WCS there is an emphasis
Warren County Schools PHYSICS PACING GUIDE 2017 2018 (SEMESTER) Philosophical approach to the process of teaching and learning science in the Warren County School District (WCS). In WCS there is an emphasis
Potential Issues with Advance Preemption. Roelof Engelbrecht Texas Transportation Institute
 1 Potential Issues with Advance Preemption Roelof Engelbrecht Texas Transportation Institute 2 Rail Preemption Designed to transfer right-of-way to the track movement and clear vehicles off the track(s)
Anticipatory Pricing to Manage Flow Breakdown. Jonathan D. Hall University of Toronto and Ian Savage Northwestern University
 Anticipatory Pricing to Manage Flow Breakdown Jonathan D. Hall University of Toronto and Ian Savage Northwestern University Flow = density x speed Fundamental diagram of traffic Flow (veh/hour) 2,500 2,000
A Data-Driven Misbehavior Detection System for Connected Autonomous Vehicles
 A Data-Driven Misbehavior Detection System for Connected Autonomous Vehicles ANKUR SARKER and HAIYING SHEN, University of Virginia, USA In a Connected and Autonomous Vehicle (CAV) system, some malicious
2.1 KINEMATICS HW/Study Packet
 2.1 KINEMATICS HW/Study Packet Required: READ Hamper pp 17-28 READ Tsokos, pp 38-62 SL/HL Supplemental: Cutnell and Johnson, pp 28-52 Giancoli, pp 19-38 ü ü ü ü ü REMEMBER TO. Work through all of the example
a) An object decreasing speed then increasing speed in the opposite direction.
 An object decreasing speed then increasing speed in the opposite direction.") Putting it all Together 10.1 Practice Use the kinematics equations to solve the following problems: a) You throw a marble up at the speed of 10 m/s. What is its maximum height? b) You drop a marble from
Putting it all Together 10.1 Practice Use the kinematics equations to solve the following problems: a) You throw a marble up at the speed of 10 m/s. What is its maximum height? b) You drop a marble from
EXAMINATION OF THE SAFETY IMPACTS OF VARYING FOG DENSITIES: A CASE STUDY OF I-77 IN VIRGINIA
 0 0 0 EXAMINATION OF THE SAFETY IMPACTS OF VARYING FOG DENSITIES: A CASE STUDY OF I- IN VIRGINIA Katie McCann Graduate Research Assistant University of Virginia 0 Edgemont Road Charlottesville, VA 0 --
A FIELD EXPERIMENT ON THE ACCURACY OF VISUAL ASSESSMENT OF WINTER ROAD CONDITIONS
 A FIELD EXPERIMENT ON THE ACCURACY OF VISUAL ASSESSMENT OF WINTER ROAD CONDITIONS Naoto Takahashi Civil Engineering Research Institute for Cold Region 1-34, Hiragishi 1-3, Toyohira-ku, Sapporo, Hokkaido