VALIDATION OF A CFD APPROACH FOR GAS TURBINE INTERNAL COOLING PASSAGE HEAT TRANSFER PREDICTION. A Thesis. presented to
|
|
|
- Stephanie Booker
- 6 years ago
- Views:
Transcription
1 VALIDATION OF A CFD APPROACH FOR GAS TURBINE INTERNAL COOLING PASSAGE HEAT TRANSFER PREDICTION A Thesis presented to the Faculty of California Polytechnic State University, San Luis Obispo In Partial Fulfillment of the Requirements for the Degree Master of Science in Aerospace Engineering by Daniel Wilde June 2015
2 2015 Daniel Wilde ALL RIGHTS RESERVED ii
3 COMMITTEE MEMBERSHIP TITLE: Validation of A CFD Approach for Gas Turbine Internal Cooling Passage Heat Transfer Prediction AUTHOR: Daniel Wilde DATE SUBMITTED: June 2015 COMMITTEE CHAIR: David Marshall, Ph.D. Professor of Aerospace Engineering COMMITTEE MEMBER: Robert McDonald, Ph.D. Associate Professor of Aerospace Engineering COMMITTEE MEMBER: Paul Choboter, Ph.D. Associate Professor of Mathematics COMMITTEE MEMBER: Kim Shollenberger, Ph.D. Professor of Mechanical Engineering iii
4 ABSTRACT Validation of a CFD Approach for Gas Turbine Internal Cooling Passage Heat Transfer Prediction Daniel Wilde GE Power & Water, has directed the enclosed research regarding CFD and its application to internal convective turbine cooling. This report was prepared as an account of work sponsored by an agency of the United States Government. Neither the United States Government nor any agency thereof, nor any of their employees, makes any warranty, express or implied, or assumes any legal liability or responsibility for the accuracy, completeness, or usefulness of any information, apparatus, product, or process disclosed, or represents that its use would not infringe privately owned rights. Reference herein to any specific commercial product, process, or service by trade name, trademark, manufacturer, or otherwise does not necessarily constitute or imply its endorsement, recommendation, or favoring by the United States Government or any agency thereof. The views and opinions of authors expressed herein do not necessarily state or reflect those of the United States Government or any agency thereof. This report describes the development and application of a validated Computational Fluid Dynamics (CFD) modelling approach for internal cooling passages in rotating turbomachinery. A CFD Modelling approach and accompanying assumptions are tuned and validated against academically available experimental results for various serpentine passages. Criteria of the CFD modelling approach selected for investigation into advanced internal cooling flows include accuracy, robustness, industry familiarity, and computational cost. Experimental data from NASA HOST (HOt Section Technology), Texas A&M, and University of Manchester tests are compared to RANS CFD results generated using Fluent v14.5 in order to benchmark a CFD modelling approach. Capability of various turbulence models in the representation of cooling physics is evaluated against experimental data. Model sensitivity to boundary conditions and mesh density is also evaluated. The development of a validated computational model of internal turbine cooling channels with bounded error allows for the identification of particular shortcomings of heat transfer correlations and provides a baseline for future CFD based exploration of internal turbine cooling concepts. iv
5 ACKNOWLEDGMENTS The Master s Thesis is considered a culminating experience for graduate education and is the product of instruction, collaboration, and support which have come from many important figures around me who I would like to thank. I would like to thank my advisor, Dr. David Marshall for taking me on as a graduate student and remaining supportive and available over the long duration of the thesis process, in spite of my having moved out of state. Additionally, I would like to thank my team at QuEST, Jean Valcin, Daniel Sartoris, and Jan Zlebek, who not only provided feedback on the engineering analysis behind this project, but also helped with data processing, formatting, and generation of many plots and images which appear in this report. I would also like to thank GE Power & Water for directing this research and providing the opportunity to perform some truly interesting analysis. Specifically, I would like to thank the GE engineers and managers involved in the project for attending my weekly updates and providing feedback and insight. Thanks to Benjamin Lacy, Fred Willet, Sandip Dutta, Franklin Fu, and Sam Ciray I would also like to thank my parents who have been there for me me all along the way. Finally, I would like to thank my wife, Jordan Elkins who has remained supportive throughout this entire process, in spite of it taking years longer than I had expected. Thanks for keeping me focused most of the time. v
6 TABLE OF CONTENTS Page LIST OF TABLES... viii LIST OF FIGURES... ix DEFINITIONS AND ABBREVIATIONS... xii CHAPTER 1. INTRODUCTION Turbine Cooling and Serpentine Passages Scope of Analysis PHYSICAL PHENOMENA OF INTERNAL COOLING Flow through a rectangular passage Effects of Passage Curvature Dean Vortices Görtler Vortices Physical Effects of Rotation Physical Effects of Buoyancy Non Dimensional Parameters of interest Summary of rotating passage physics MODEL VALIDATION Experimental data Selection HOST Experiment Background Data Analysis Procedure HOST Passage Geometry Texas A&M Experiment Background University of Manchester Experiment Background Grid Independence Study Model Selection and Calibration Plenum Entrance Effect Chamfer Impact Simulation convergence and Physical unsteadiness vi
7 3.3.4 Turbulence Modelling Model Selection Conclusions HOST Validation Baseline Results Passage Heat Pickup Detailed Validation Stationary Baseline Condition Rotating Baseline Condition High Rotation Number Condition Density Ratio Variation HOST Validation Summary Texas A&M Experiment CFD Validation University of Manchester Experiment CFD Validation CONCLUSIONS BIBLIOGRAPHY APPENDICES A. Section Cuts of Velocity for Select HOST Operating Points vii
8 Table LIST OF TABLES Page 1. Table 1. Validation operating point test suite Table 2. Operating point used for validation against Texas A&M data [5] Table 3. Operating point used for validation against Iacovides experimental data Table 4. Meshes included in grid sensitivity study Table 5. Grid independence study results Table 6. Summary of HOST validation study meshes Table 7. Error from experiment for Turbulence model study Table 8. CFD error and uncertainty breakdown Table 9. Simulation setup used for Final Simulations Table 10. HOST validation test suite Table 11. Net passage heat transfer from CFD and experiment (Btu/h) Table 12. Sensitivity of experiment and CFD to changes in operating condition Table 13. J.C. Han Validation Operating Point viii
9 Figure LIST OF FIGURES Page 1. Example of internal cooling geometry of a turbine blade [2] Secondary flows in a straight, square duct [9] [8] Steady, Non-Rotating Square Channel CFD Showing Dean Vortices; (left) view looking radially inward; (right) isometric showing projected vectors and secondary flows Effects of rotation in a straight square passage [2] HOST passage side view [2] Bend Dimensions Host documentation of geometry [2] (black) overlaid with QuEST model (red) HOST passage geometry with various turbulator configurations Texas A&M rig geometry [5] Texas A&M experimental rig geometry Experimental passage geometry [4] Experimental facility diagram [4] Leading and trailing wall Nusselt Number ratio for grid independence study Velocity contours and mesh at mid plane with element counts specified Comparison of secondary flow leaving the 1 st bend with different mesh types Nominal mesh resolution in turbulated region y+ contours for rotating turbulated baseline simulation Boundary layer mesh properties Experiment inlet configuration [2] Experimentally measured inlet profiles Entrance mesh resolution Entry region heat transfer Full passage heat transfer with varying inlet condition Chamfer Geometry Heat transfer impact of chamfer Solution oscillation with iteration Heat transfer variation by station along the HOST passage ix
10 28. Steady state, pseudo averaged, and time averaged Nu# on leading endwall at stationary baseline condition Passage Nusselt Number predicted with various turbulence models Wall shear contours from various turbulence models (psi) Nusselt Number Ratio predicted by various turbulence models for rotating baseline operating point Experiment comparison to CFD 45 degree plot Side view of passage flow for non-rotating smooth HOST geometry (Case 1) Velocity visualization viewed toward leading end wall Case 6 Velocity Side View Heat transfer along passage for Case Heat transfer along passage for Case Heat transfer along passage for Case Passage Nusselt number for stationary operation Impact of various turbulator geometries on passage heat transfer Heat transfer along passage for Case Heat transfer along passage for Case Heat transfer along passage for Case Nusselt number ratio for baseline rotating operating point simulations, Cases 4, 5, and % variation in Nusselt number associated with rotating vs. stationary baseline cases degree plots representing error of baseline set of operating points Heat transfer along passage for Case Combined wall heat transfer along passage for Case Combined wall heat transfer along passage for Case Combined wall heat transfer along passage for Case Nu/Nu variation throughout passage due to changing Reynolds Number Reynolds number impact on passage heat transfer Heat transfer by station along HOST passage for simulation Heat transfer by station along HOST passage for simulation Nu/Nu variation in passage at increased rotational speed % Impact of increased rotational speed on passage heat transfer x
11 57. Heat transfer by station along HOST passage for simulation Heat transfer by station along HOST passage for simulation Heat transfer by station along HOST passage for simulation Heat transfer by station along HOST passage for simulation Nu/Nu Variation in passage for various density ratios Mesh illustration for passage Nusselt number along passage for CFD and Experiment Difference between Leading and Trailing Nusselt number ratio due to rotation % Deviation between experimental and CFD predicted Nusselt Number Wall shear in the bend region (in psi) Mesh cut plane with axis of rotation indicated Nu/Nu comparison between experiment and CFD Experimental and CFD Nusselt Number Contours overlaid xi
12 DEFINITIONS AND ABBREVIATIONS CFD HOST RANS URANS SAS SST LEVM NLEVM RSM Re Ro Pr Nu Bo Computational Fluid Dynamics Hot Section Technology Reynolds Averaged Navier Stokes Unsteady Reynolds Averaged Navier Stokes Scale Adaptive Simulation Shear Stress Transport Linear Eddy Viscosity Model Non-Linear Eddy Viscosity Model Reynolds Stress Model Reynolds Number Rotation Number Prandtl Number Nusselt Number Buoyancy Parameter h, HTC Heat Transfer Coefficient Q k k ε ω Ω A T P ρ μ a b Heat Flow thermal conductivity Turbulence Kinetic Energy Turbulence Dissipation Specific Rate of Turbulence Dissipation Rotational speed Area Temperature Pressure density dynamic viscosity passage cross section dimension along axial direction passage cross section dimension from suction side to pressure side wall xii
13 R g c c p Ck C d F1 F2 Radius from axis of rotation gravitational constant Specific heat at constant pressure Loss coefficient Coefficient of discharge heat transfer coefficient multiplier to account for rotation effects heat transfer coefficient multiplier to account for entrance effects b Bulk flow property SUBSCRIPTS w film Property at passage wall Film property, average of wall and bulk property Nominal, based on a smooth straight passage xiii
14 1. INTRODUCTION This research effort is undertaken to provide practices and information which are useful in a practical sense for future cooling passage engineering efforts. Internal cooling of gas turbine rotors allows for increased firing temperatures which ultimately allow for increased power output of a given system. The understanding and prediction of turbine cooling performance translates to improvements to efficiency and capacity in power generation. A validated CFD approach for modelling the physics involved provides a valuable tool for the advancement of this understanding. 1.1 Turbine Cooling and Serpentine Passages In order to achieve high efficiency, modern turbine rotors are subjected to very high temperatures. The Brayton cycle, which represents a simplified gas turbine process, indicates that the power output of a gas turbine system increases as the firing temperature at the inlet to the turbine increases. This means that it is valuable to operate gas turbines at very high temperatures. In order to keep the metal temperature of the turbine blades within operational the range of the blade material, many measures are taken. When the primary gaspath surrounding the blade is above the allowable metal temperature, the blade temperature can be kept within acceptable limits by removing heat from the metal and insulating the blade from the hot environment. A common means for removal of heat from the turbine blade is to flow a small percentage of cool compressor bleed air through internal passages hollowed out within the blade. Often, these passages snake up and down within the blade before being exhausted into the hot gaspath, lending the name serpentine passages. An illustrative example of a serpentine passage from the NASA HOST documentation [2] is provided in Figure 1. 1

15 Figure 1. Example of internal cooling geometry of a turbine blade [2] In addition to allowing increased combustion temperature and power output, use of compressor bleed air to cool turbine blades reduces the amount of inlet flow which is involved in power generation. Any flow that is bled from the compressor reduces the efficiency of the engine, so it is key to use as little compressor bleed air as possible in order to cool the turbine. Note that other limiting factors exist which prevent arbitrarily high firing temperatures in gas turbines, such as the generation of nitrous oxide when burning hyrdrocarbons at excessive or uneven temperatures, but are not the focus of this document. This research is focused entirely on the performance and behavior of serpentine passages in blade cooling. 1.2 Scope of Analysis The scope of this project and report is to evaluate the capabilities of mainstream CFD methods for heat transfer prediction inside rotating serpentine passages and develop best 2
16 practices for internal passage modeling. Simulation is tuned and benchmarked against publically available experimental data to understand the capabilities and shortcomings of various CFD modelling approaches. This knowledge is accumulated across a wide range of operating points from various experimental programs. The majority of experimental data used comes from the NASA HOST (Hot Section Technology) program of the 1980s [2,3]. The HOST program includes experimentation across a wide range of operating parameters including Reynolds number, Rotation number, turbulator configuration, passage rotation angle, and density ratio. Additional experiments from Texas A&M [5] and the University of Manchester [4] are used to expand model validation to additional data points. Observations made through comparison to the described set of experimental data are used to build a modelling approach which is well understood in terms of accuracy and robustness. Model performance is considered in terms of accuracy, computational time, ease of implementation, and industry familiarity to down-select a CFD simulation approach. The resultant data set is used to explore computational model behavior and the impact of various modelling decisions on accuracy. 3
17 2. PHYSICAL PHENOMENA OF INTERNAL COOLING This section outlines the physics associated with internal passage flow in rotating turbomachinery. Interplay between duct flow, rotation, flow turning through passage bends, and buoyancy result in a very complex flow. The section introduces simple passage flow then addresses each of the additional physical phenomena present in a rotating cooling passage. 2.1 Flow through a rectangular passage Flow through a stationary square or rectangular duct has been shown by Nikuradse [7] to develop secondary flows in the passage corners. The development of these secondary flows is purely a function of anisotropic turbulence stress. The ability of CFD to predict this behavior is determined by the turbulence model selected. Most 2 equation RANS turbulence models (k-ε, k-ω) treat turbulence stress as an isotropic quantity, and are unable to predict the presence of corner secondary flows. It is well known that linear eddyviscosity models do not capture the anisotropic that is responsible. Figure 2 compares secondary flows predicted by various turbulence models in a square duct 4
![Figure 2. Secondary flows in a straight, square duct [9] [8] LEVM refers to a linear eddy-viscosity model. NLEVM refers to a nonlinear eddyviscosity model.](/docs-images/80/81246883/images/18-0.jpg "RSM refers to the Reynolds stress model which models turbulence anisotropically. DNS refers to direct numerical simulation of the full Navier-Stokes equations.")
18 Figure 2. Secondary flows in a straight, square duct [9] [8] LEVM refers to a linear eddy-viscosity model. NLEVM refers to a nonlinear eddyviscosity model. RSM refers to the Reynolds stress model which models turbulence anisotropically. DNS refers to direct numerical simulation of the full Navier-Stokes equations. The level of impact these flow structures have on the heat transfer within rotating cooling passages is difficult to assess. Their presence would likely attribute to enhanced heat transfer near the corners due to higher local shear. More significant impacts could be observed when these secondary flows interplay with those due to curvature and rotation, but would be very difficult to isolate. The magnitude of bend turning, Coriolis, and buoyancy driven secondary flows is expected to dominate these corner vortices, but the interplay between them could have interesting and highly coupled effects. 5
19 2.2 Effects of Passage Curvature Research into the effect of curvature on flow goes back nearly 150 years to the study of rivers. James Thomson [1] is typically given credit with forming the third theories regarding this phenomenon. His paper describes the phenomenon such that, as water moves around a river bend, a helical secondary current is set up in the flow. While significant work is still being done to understand these geological hydrodynamic process, the early work of river scientists formed the foundation of what we now know as Dean Vortices Dean Vortices The early work of Dean [2] [3] was paramount in understand the secondary flows through curved pipes. To understand this, he started by writing the Navier-Stokes equations in toroidal form. By assuming the radius ratio 1 was small, he was able to linearize the equations using the characteristic length values. While an approximation, it does capture all first-order effects. The final Dean Equations become u x x + u z z = 0 K ( Du x Dt u φ 2 ) = K p x + 2 u x K Du φ Dt K Du z Dt = u φ = K p z + 2 u z (1) Where D/Dt is the total or substantial derivative and K is the Dean Number K = ρua μ (a b ) 1/2 = Re C (2) 1 Radius ratio is the ratio of pipe radius to curvature radius 6


20 Where C is the curvature ratio. The key result from the Dean equations is that the flow is very nearly simple two-dimensional Navier-Stokes, but with an additional body force,u φ 2 acting towards the inside of the bend. Figure 3. Steady, Non-Rotating Square Channel CFD Showing Dean Vortices; (left) view looking radially inward; (right) isometric showing projected vectors and secondary flows Görtler Vortices Görtler vortices present additional potential flow instability due to curvature. When the boundary layer thickness is comparable to the radius of curvature of a wall, a pressure gradient exists across the boundary layer. This pressure variation causes centrifugal instability and subsequent formation of Görtler vortices. The onset of the instability can be predicted by the non-dimensional number called the Görtler number, which is defined as 7
21 G = ρuθ 1 μ (θ R ) 2 (3) Where θ is the momentum thickness. Typically instability occurs when G > Physical Effects of Rotation The effects of rotation are clear on a turbine cooling passage. However, correlation of these impacts is typically complex and not very robust. The issue is not only the complexity, but the difference in flow interaction each individual wall experiences. The inertial forces of rotation will create higher pressure on the pressure side wall and lower pressure on the suction side wall on outflowing passages, and higher pressure on the suction side wall for inflowing legs. This differential pressure along with the apparent Coriolis force drives flow along the sidewalls from the trailing wall to the leading wall when flow is moving away from the axis of rotation. This creates a highly destabilized boundary layer on the highpressure wall, against which the secondary flow impinges. Conversely, the leading wall has a dampened shear layer, which is much more stable. The pressure difference drives the fluid core towards the high pressure, destabilized wall. The general behavior for an outflowing straight passage is illustrated in Figure 4. 8
![Figure 4. Effects of rotation in a straight square passage [2] When flow is moving toward the axis of rotation, the Coriolis Effect has the opposite impact.](/docs-images/80/81246883/images/22-0.jpg "Flow at a higher radius in a passage has a greater tangential velocity than flow at a lower radius.")
22 Figure 4. Effects of rotation in a straight square passage [2] When flow is moving toward the axis of rotation, the Coriolis Effect has the opposite impact. Flow at a higher radius in a passage has a greater tangential velocity than flow at a lower radius. As air is moved from the higher radius to the lower one, it carries with it excess tangential velocity relative to the walls of the passage. This results in a motion of the bulk flow toward the leading interior wall. To compensate for this, there is a flow created along the sidewalls from the leading wall to the trailing. It is evident why a single, unified correlation for this flow is rare, if unachievable. 2.4 Physical Effects of Buoyancy Density variations create significant body forces in the presence of high rotational speed, which impact flow behavior. High rotational speeds drive denser, colder fluid toward the outer radius, pulling hotter fluid, relatively, toward the axis of rotation. For situations such as turbine cooling where the wall temperature is higher than the bulk temperature, 9
23 buoyancy drives warmer, near-wall flow toward the inner radius. In outflowing passages this results in a buoyancy force opposite the bulk flow direction, while in inflowing legs, the buoyancy force drives near wall flow in the direction of bulk flow. On outflowing legs, Coriolis enhances shear and heat transfer on the trailing, high pressure, wall. This creates density variation, with denser air near the leading, low pressure, wall. The existing secondary flow due to rotation interacts with the body forces due density variation, impacting the passage flow field and wall heat transfer. When density variations across the passage cross section interact with turbulators, especially turbulators orthogonal to the flow direction, the variation in buoyancy force can drive secondary flows that would not otherwise exist. [3 p78]. Buoyancy tends to enhance pressure side wall heat transfer. On outflowing legs, this complements Coriolis behavior, enhancing the total heat transfer augmentation on the high pressure wall. On inflowing legs, this behavior acts opposite Coriolis, which enhances shear on the leading wall. Often the phenomena cancel each other out on inflowing rotating passages. 2.5 Non Dimensional Parameters of interest When developing an understanding of fluid phenomena and their impacts, it is useful to specify the parameters that define the system in terms of normalized, non-dimensional parameters. Non dimensional parameters typically represent the ratio of quantities which are known to drive certain behavior. Correlations developed non-dimensionally can cover a wide range of operating points and system sizes. Buckingham Pi theorem and the concept of dynamic similitude demonstrate the power of non-dimensional parameters. A dimensional analysis performed prior to the NASA HOST 10
24 [2] [3] experimentation indicated that the physics of cooling flow in rotating turbomachinery can be expressed in terms of the following non-dimensional parameters. - Density Ratio: ρ b ρ w ρ b = T b T w T b for constant pressure ideal gas -Rotation number: Ωd h V b - Buoyancy Parameter: [ ρ b ρ w ] [ Ωd h ] [ ΩR ] = Density Ratio Ro# [ ΩR ] ρ b V b V b V b - Reynolds Number: ρ b V b d h μ b Notice that these parameters quantify the magnitude and impact of the physical phenomena described in this section, relative to each other. 2.6 Summary of rotating passage physics Many of the physical phenomena described in this section are difficult to predict and understand on their own. In rotating turbomachinery, these impacts and others interact in ways that are extremely difficult to predict analytically. Additionally, it is very difficult to isolate the effects from one another using experimental data, which only provides information for which instrumentation is in place to extract. Numerical models such as CFD present a unique opportunity to capture each of these phenomena and their interaction without making assumptions aside from those inherent to the computational model. The behavior of the fluid, as governed by the computational model used, can be interrogated freely for any and all features of the flow modelled, at any location or region within the simulation domain. A CFD model validated against experiment which captures these physical interactions is invaluable in the creation of updated correlations. Increased understanding of the flowfield and the ability to simulate flow behavior outside the range of experimental data are key objectives for the CFD model which is to be developed. 11
25 3. MODEL VALIDATION The first phase of the present effort consists of developing a CFD model of academic internal cooling applications and validating against experimental data. Primary characteristics of the model which need to be validated are mesh type, mesh resolution, Turbulence model, and treatment of unsteadiness in model. 3.1 Experimental data Selection The NASA HOST (Hot Section Technology) [1, 2] test suite represents the most comprehensive publically available data set for rotating internal passages. The project was undertaken in the late 1980 s to investigate heat transfer characteristics of rotating multipass passages of turbine blades from that period. Sensitivity of passage heat transfer to Reynolds Number, Rotation Number, Density Ratio, and Turbulator configuration were studied experimentally. The extent and availability of the HOST experimental data has led to its use in the generation of correlations and general understanding of serpentine cooling passage physics throughout the gas turbine industry. One issue encountered when validating CFD against the HOST data is that the bend geometry is not explicitly described in available literature. Diagrams and photographs are digitized to extract the geometry used in the CFD model described herein. Additional experimental data is included in the validation to improve confidence and filter out any uncertainties exclusive to the HOST experiment, including variations between the bend geometry used in the current model and the experimental bend geometry. Je-Chin Han of Texas A&M [5] has published several papers regarding heat transfer within serpentine passages. One set of J.C. Han experimental data was included in the validation phase of the current effort due to complete documentation of test article geometry, and more modern 12

26 instrumentation. Experimental data for wall heat transfer is collected at a higher resolution than in the HOST program, and the geometry is fully described in the documentation. Hector Iacovides of the University of Manchester has also conducted experimental research into heat transfer within rotating passages. Experimental results [4] are included in this validation because the experiment includes liquid crystal imaging, providing experimental contours of heat transfer, which can be validated against in 2-D. Some uncertainties in the test setup and postprocessing have arisen which will be discussed later HOST Experiment Background The HOST test article consists of a duct with 4 legs and 3 bends. The side view of the passage is illustrated in Figure 5. Figure 5. HOST passage side view [2] 13
27 The geometry is made up of a square cross section, 4 pass duct. The walls of the duct are split into plates which are labelled by letter in the image above. Heat transfer data is extracted from the experiment by performing an energy balance to solve for the heat transferred through each plate. Bulk temperature and material properties are calculated as an average for each plate s streamwise location to account for heat up. Error associated with the energy balance for plate heat flux cited by the HOST documentation [2] is ±2% for the 1 st leg, ±4% for the 2 nd leg, and ±7% for the final heated leg. This error is primarily due to compounding error in the calculation of bulk temperature along the passage Data Analysis Procedure The HOST published data is presented in terms of Nusselt number. The integrated heat flux through each plate is converted to a heat transfer coefficient by the following calculation. h = Q A (T w T Film ) Where T film is defined as the average of the bulk fluid temperature and wall temperature. T film = T w + T b 2 The HTC can then be normalized as a Nusselt number based on the hydraulic diameter and fluid thermal conductivity. Nu = h D h k In many cases, the Nusselt number is further normalized, as Nu/Nu inf. Where Nu inf represents the expected Nusselt number for a corresponding fully developed turbulent duct. Nu inf is calculated based on the Dittus Boelter equation. 14
28 Nu inf = Re 0.8 Pr 0.4 The HOST data uses the Colburn equation instead of Dittus-Boelter, assuming a constant Prandtl number equal to Nu inf = Re 0.8 This research uses the HOST calculation for Nu inf when comparing to HOST data, and Dittus Boelter when comparing to other data sets. The bulk temperature used in calculation of the HTC is an important factor. The NASA HOST program calculated the bulk fluid temperature at each station along the serpentine passage by integrating heat addition through all plates and using fluid Cp to calculate a temperature difference from the previous station. CFD allows the direct postprocessing of local bulk temperature, rather than using an estimation based on heat addition. When validating the CFD model against HOST data, the HOST methodology for updating bulk temperature was applied to the CFD results. Bulk temperature is updated at each station along the HOST test passage according to. T i = T i 1 + Q i 1 c pi 1 Where i is an index which represents the current region, associated with a set of heated plates in the experimental rig. The index, i increases in the streamwise direction. Q i represents the integrated heat flux through all heated plates at a given indexed region. Inlet temperature is prescribed, so the temperature throughout the passage is calculated by marching the above equation along the flow direction. Marching the fluid temperature represents a low-order, one sided discretization of the differential equation for conservation of thermal 15
29 energy. In the presence of sharp gradients, this approach could lead to appreciable numerical error. For that reason, the result has been compared against arithmetic mean, and log-mean temperature differences to ensure minimal error, well below 1%. Polynomial representation of air properties in terms of temperature is used to update c p, μ, and k at each station. Pressure data is interrogated from the CFD results and used in combination with bulk temperature to calculate local density based on the ideal gas equation of state. P = ρ R T Note that Re# and Pr# vary from station to station based on changes in material properties. Density, for example, is directly coupled to flow velocity through the continuity equation in a closed passage at steady state. ρ V A = constant The Nusselt number ratio, Nu/Nu inf can be thought of as the ratio of heat transfer observed in the experiment to the heat transfer that would be observed in a smooth straight tube. For example, if a straight turbulated duct exhibits a Nu/Nu inf of 2, this means that the presence of turbulators has doubled the heat transfer through the duct walls relative to a smooth passage. The data available from the HOST documentation is primarily in terms of Nusselt number ratio for each of the lettered stations in Figure 5 for each of the 4 walls of the passage, independently HOST Passage Geometry QuEST was unable to find any explicit documentation for some aspects of the HOST test article geometry. Specifically, the bend inner radius and tip radius within the bend were not documented. Digitizing images of the test article and referring to other CFD studies that validated against HOST (Sleiti), led to the tip geometry shown in Figure 6. 16


30 Figure 6. Bend Dimensions The inner radius of the bends is 1.25 Dh. The outer radius of the bends at the corners is 1 Dh. The minimum passage height, halfway through the bend is equal to the hydraulic diameter of the straight sections. The comparison of this geometry to an image from HOST documentation is shown in Figure 7. Figure 7. Host documentation of geometry [2] (black) overlaid with QuEST model (red) 17
![The geometry generated for this analysis is overlaid in red over an illustration from HOST Volume 2 [3]. 3D CAD of the HOST passage was generated and is illustrated in Figure 8.](/docs-images/80/81246883/images/31-0.jpg "Smooth Straight turbulators Skewed turbulators Figure 8. HOST passage geometry with various turbulator configurations On the right in figure 6, the non turbulated walls are color coded by region.")

31 The geometry generated for this analysis is overlaid in red over an illustration from HOST Volume 2 [3]. 3D CAD of the HOST passage was generated and is illustrated in Figure 8. Smooth Straight turbulators Skewed turbulators Figure 8. HOST passage geometry with various turbulator configurations On the right in figure 6, the non turbulated walls are color coded by region. The nomenclature used in this report refers to the orange surfaces shown as the outer sidewall. The red surfaces are referred to as the inner sidewall. Any blue surface is unheated and was treated as isothermal in the CFD and HOST experiment, including the inner radius of each bend. The turbulated walls are referred to as the leading and trailing endwalls. When the passage is rotating, the leading endwall is the wall visible in Figure 8, which leads the rotation, corresponding to the suction side of a turbine blade cooling passage. 18
32 A range of experimental test points were selected from the HOST program results to validate the CFD model against. The set of operating points included in the validation is summarized in Case Re Number Ro Number Radius Ratio (R/d) Rotation Angle Inlet Density Ratio Turbulators Purpose 1 25, None 2 25, Straight Baseline Stationary 3 25, deg 4 25, None 5 25, Straight Baseline Rotating 6 25, deg 7 25, None Effect of Rotation 8 25, deg Number 9 25, None 10 25, None 11 25, deg Effect of Density Ratio , deg 13 12, None 14 50, None 15 12, deg 16 75, deg Effect of Reynolds Number 19
33 Table 1. Validation operating point test suite Case Re Number Ro Number Radius Ratio (R/d) Rotation Angle Inlet Density Ratio Turbulators Purpose 1 25, None 2 25, Straight Baseline Stationary 3 25, deg 4 25, None 5 25, Straight Baseline Rotating 6 25, deg 7 25, None Effect of Rotation 8 25, deg Number 9 25, None 10 25, None 11 25, deg Effect of Density Ratio 12 25, deg 13 12, None 14 50, None 15 12, deg 16 75, deg Effect of Reynolds Number As indicated, the baseline operating condition is at a Reynolds number of 25,000 and an inlet density ratio of The Rotation number is 0.24 in the rotating baseline case. Other cases vary parameters away from the baseline case to evaluate the impact of changes in those parameters and assess the capability of the CFD model to capture those impacts. 20
34 Validation against HOST program data comprises the bulk of the current validation effort. A wide range of available data at varying operating points allows for a comprehensive look at modelling capability Texas A&M Experiment Background Experimental heat transfer measurements in a u-bend conducted by Je-Chin Han of Texas A&M are also included in the validation of the current CFD model. Experiments documented include many aspect ratios and operating points of a 2 pass rotating duct. Figure 9 illustrates the rig geometry selected for validation herein. Figure 9. Texas A&M rig geometry [5] 21
35 Heated plates indicated with cross-hatching surround the test section similarly to the HOST experiment. The interior bend radius is unheated. The aspect ratio of the duct is 2, with the suction and pressure side wall larger than the outer and inner sidewalls. Turbulators are not staggered, meaning that the pressure side and suction side turbulators extend into the flow passage at the same radial location, resulting in a net choking down of the passage dimension b equivalent to 2 e. The turbulators are feature sharp corners, unlike those considered for the HOST experiment which had rounded edges. Heat flux is measured through heated plates on the leading and trailing walls. These measurements for the leading and trailing endwall can be compared to CFD results. The CAD geometry created for the analysis is illustrated in Figure


![Operating point used for validation against Texas A&M data [5]](/docs-images/80/81246883/images/36-2.jpg "Parameter Value Ro # 0.21 Reynolds # 25,000 Density Ratio ρ ρ 0.")
36 Isometric Side Top (Semi Opaque) Figure 10. Texas A&M experimental rig geometry The operating point and geometric parameters chosen for comparison to CFD is outlined in Table 2. Table 2. Operating point used for validation against Texas A&M data [5] Parameter Value Ro # 0.21 Reynolds # 25,000 Density Ratio ρ ρ Rib height to hydraulic diameter (e/d h ) Rib pitch-to-height (P/e) 10 23
37 In this case rotation number is non-dimensionalized by b, the distance from the suction side wall to the pressure side wall. The J.C. Han experiment is included in this validation because the experimental data is more recent, the geometry is explicitly fully defined, and the number of plates, and therefore resolution of test data, is increased compared to the HOST data University of Manchester Experiment Background The experiment conducted by Iacovides of University of Manchester [4] consists of a 2 pass duct which is rotated on a turntable. The inflowing leg of the duct has a square cross section. The downstream leg expands to a 2:1 aspect ratio. The passage geometry is outlined in Figure 11. Figure 11. Experimental passage geometry [4] The reason for inclusion of this experiment in the model validation is that liquid crystals are used to generate experimental contours of Nusselt Number on the suction and pressure side walls. This 2-D representation of experimental data allows for a more qualitative validation of the CFD model physics. Stationary experiments were conducted at various Reynolds numbers with air and water as the working fluid. Rotating experiments were then conducted with water as the working fluid. The passage was mounted to a turntable within a chamber. For rotating experiments, the chamber was filled with water. The flowpath and experimental setup are illustrated in Figure
38 Figure 12. Experimental facility diagram [4] The primary uncertainty with validation against this experiment is due to uncertainty about the model placement within the chamber. The passage total length is 740 mm. the diameter of the chamber is 1.2 meters. Unfortunately, the specific orientation of the axis of rotation relative to the passage geometry is not specified in the documentation. This means that, at a given rotational speed, the rotational acceleration experienced at the bend cannot be precisely controlled to match the experiment. The experimental operating point against which CFD is validated is experimental test 7, described in Table 3 Table 3. Operating point used for validation against Iacovides experimental data Reynolds Inflowing leg Prandtl T in ( Number velocity (m/s) Number o Rotation C) Ω (rad/s) Number 36,
39 Very high resolution sampling of wall Nusselt number and availability of Nusselt Number contours are the key benefits of this data set. Use of water as the working fluid, and uncertainty about model orientation relative to the axis of rotation are the primary drawbacks of the data set. 3.2 Grid Independence Study Insufficient mesh resolution presents a possible source of error in any CFD analysis. The flow structures that are responsible for the performance of the system, in this case wall heat transfer, must be resolved to get an accurate result. A mesh that is too coarse to resolve these flow structures will artificially diffuse them, resulting in a poor prediction of wall heat transfer. A grid independence study is carried out using the HOST geometry to evaluate mesh density requirements for the following simulations. Simulations are performed on several meshes at varying resolution to delineate the necessary mesh resolution to capture all flow structures which drive wall heat transfer. Mesh resolution which is deemed adequate based on this comparison is used for all other simulation within this study. In addition to comparing mesh resolution, it is of interest to compare heat transfer results achieved with different mesh types. Unstructured tetrahedral meshes with inflation layers are standard for application to complex geometries for industrial application of CFD. Block structured hexahedral meshes, on the other hand, present advantages in terms of reduced element count and improved simulation performance at the cost of vastly increased time spent generating mesh. Block structured mesh is typically reserved for simpler geometries or academic analysis of complex geometries. To account for impact of mesh type and resolution on simulation results, several mesh resolutions of each type are generated for the HOST geometry with skewed turbulators The HOST geometry with skewed turbulators was chosen as the test case because the most complex flow is expected 26
40 which includes all the key physics that drive heat transfer in a rotating passage. The set of meshes compared is summarized in Table 4. 27
41 Table 4. Meshes included in grid sensitivity study Type Element Count Node Count Hex 6 M 5.9 M Hex 17 M 18.3 M Hex 32 M 33.1 M Hex 50 M 51.0 M Tet 9.4 M 4.4 M Tet 27 M 12.5 M Tet 41 M 18.8 M Tet 63 M 15.5 M All block structured mesh was generated using the Gridpro meshing software. Unstructured meshes are generated using ICEM in combination with the Fluent mesher. Postprocessing for heat transfer within the HOST program geometry is performed by monitoring integrated heat flux through each of the heated plates of the experiment. The heat transfer is then manipulated to calculate a normalized Nusselt number, Nu/Nu. Nu represents the Nusselt number expected for fully developed flow in a straight duct at the Reynolds number observed in the CFD. The procedure described in section is applied to calculate normalized Nusselt number, Nu/Nu throughout the passage. Normalized Nusselt numbers of each plate provide a convenient means to analyze heat transfer throughout the passage. Figure 13 compares these results for each of the meshes included in the grid independence study. 28
42 Leading Fine Tet Leading Mid Tet Leading Extra Coarse Tet Leading Fine Hex Leading Coarse Hex Leading_Extra_Coarse Hex Leading_Tet_Finest Leading Medium Hex Nu/Nu inf A B C D E F G H I J K L M N P R Station Nu/Nu inf Trailing Fine Tet Trailing Mid Tet Trailing Extra Coarse Tet Trailing Fine Hex Trailing Coarse Hex Trailing_Extra_Coarse Hex Trailing_Tet_Finest Trailing Medium Hex A B C D E F G H I J K L M N P R Station Figure 13. Leading and trailing wall Nusselt Number ratio for grid independence study Small variations are observed in computational results between the various block structured meshes included in the study. The unstructured mesh results, however, vary significantly. The Tet Finest data series approaches the behavior of the structured mesh results, but still differs significantly in some locations, especially station G on the leading endwall. 29


43 At station G, a vortex core is present which reattaches to the wall after the bend. The attachment point and path of the vortex core is significant to the local mesh resolution. Figure 14 and Figure 15 compare the nominal hex mesh results to the finest tetra mesh results at station G. Figure 14. Velocity contours and Mesh at mid plane with element counts specified 30

44 Figure 15. Comparison of secondary flow leaving the 1 st bend with different mesh types The course hex mesh results in a strong vortex which is fully attached to the inner bend wall at the indicated location. In the Tet mesh, this vortex is accompanied by additional secondary vortices and separated from the inner wall. Because the behavior in the bend is clearly grid dependent on all simulated tetrahedral meshes, the differences between results in Figure 14 and Figure 15 is interpreted as an impact of insufficient mesh resolution to capture the generation and propagation of the secondary flows which determine flow behavior downstream of the bend. A numerical summary of the grid independence study results is provided in Table 5. The 32M element hex mesh is chosen as the nominal hex mesh resolution, as it is shown to be grid independent. 31


45 Table 5. Grid independence study results The chosen mesh approach for the host validation study based on the 32 M element mesh in Table 5 is summarized below. Figure 16 illustrates the typical mesh resolution in the turbulated region. Figure 16. Nominal mesh resolution in turbulated region 32

46 Another important consideration in terms of mesh is boundary layer resolution. In order to model low-reynolds near wall behavior, either with k-ε enhanced wall functions or k- ω SST, it is important to have sufficient elements within the near wall region of the boundary layer. A 1 st element wall spacing y+ below 1 is desirable. Figure 17 shows the y+ range observed in the turbulated baseline simulation. Figure 17. y+ contours for rotating turbulated baseline simulation The contours of y+ shown are from turbulated results for the rotating baseline operating condition. The maximum y+ of 0.87 occurs near the exit boundary, and the area averaged y+ is When enhanced wall functions are applied, Fluent treats the region where the turbulent Reynolds number is below 200 as viscosity affected. The solver then blends from the near wall, low Reynolds model to the high Reynolds model. It is important to have several elements along this blend, with many elements in the viscosity affected region. 33
47 2 Layer Blending Function Turbulent Re# Figure 18 shows 38 elements in the viscosity affected region and 5 elements along the layer blend. 2 Layer Blending Function Turbulent Reynolds Number 1.20E E E E E E E Element count (from wall) Figure 18. Boundary layer mesh properties This data is collected normal to the wall at a location with average y+ compared to the bulk of the domain. The boundary layer is highly resolved in this analysis. Boundary layer meshing requirements are well understood. For the RANS modelling performed in this analysis, the boundary layer resolution in the utilized mesh is ideal. The final meshes used for HOST program validation and turbulence modelling study are listed in Table 6. Any results presented for the HOST geometries in upcoming sections are simulated on these meshes. The non-turbulated mesh consists of much fewer elements as there is no need to resolve turbulator-induced flow structures. 34


48 Table 6. Summary of HOST validation study meshes Geometry Element Count Shells Smooth 6 M Normal Turbulators 36 M Skewed Turbulators 31 M 3.3 Model Selection and Calibration Boundary conditions, geometric simplifications, and numerical models influence CFD results. This section describes the process undertaken to decide on each of these issues and create the most effective CFD model possible. The HOST program geometry and data were used to conduct this study Plenum Entrance Effect 35

49 Flow quantities at the simulation inlet significantly impact heat transfer in the first leg of duct. The HOST experiment included a feed tube providing air to a plenum upstream of the test article with a filter to condition the flow. Figure 19. Experiment inlet configuration [2] The plenum region is not included in the CFD model. A specific description of the plenum geometry and screen is not included in experiment documentation. Instead, experimental measurements were taken to characterize the velocity and turbulence intensity profiles at the passage inlet as illustrated in Figure


50 Velocity Turbulence intensity Figure 20. Experimentally measured inlet profiles This data was collected for stationary, non-rotating operation during the HOST experiment. The resolution of the profiles applied at the inlet is determined by the resolution of the data collected during the HOST experimentation. The test data inlet profile is fairly coarse, resulting in a sudden jump at the boundary. The resolution of the CFD mesh to which these profiles are applied is much finer, as shown in Figure 21. Figure 21. Entrance mesh resolution 37
51 Nu # The impact of mapping these profiles to the CFD model was checked by comparing to a simulation which used a flat velocity profile. Figure 22 compares the heat transfer in the first leg between experiment, correlation, and CFD. Heat transfer is shown for the nonturbulated, stationary, baseline case Experiment Correlation Full Map SST Flat SST x/d h Figure 22. Entry region heat transfer When compared to the experimental results, the CFD prediction of heat transfer at the duct entrance was consistently low. An entrance effect correlation was also applied, which predicted heat transfer between the experimental and computational prediction. The Full Map results in Figure 22 correspond to CFD simulation with the experimental profiles applied. The results for the full passage, including all legs is shown in Figure
52 Nusselt # HOST Experiment Full Map SST Flat SST A B C D E F G H I J K L M N P R Station Figure 23. Full passage heat transfer with varying inlet condition The impact of the applied profiles does impact the CFD result, but the deviation from experiment near the entrance is much greater than the difference between the sets of CFD results. Note that flow in the bends is subject to instability, and will be discussed in upcoming sections. The mapped inlet condition is used for upcoming analyses because it represents the most comprehensive boundary condition available for validation. Rotating simulations use a constant turbulence intensity inlet because the inlet profile is measured for a non-rotating case and does not represent the turbulence magnitude of rotating operation. 5% turbulence intensity and a length scale are applied. Inlet velocity is mapped for all HOST CFD cases Chamfer Impact Small chamfers in the corners of HOST duct are indicated in the NASA documentations [2]. These chamfers are created when the wall plates are pressed together and are roughly 1 mm. Chamfer Geometry is illustrated in Figure

53 Figure 24. Chamfer Geometry Mesh generation is greatly simplified by neglecting these chamfers. Heat transfer throughout the duct, with and without chamfers, for the non-turbulated, rotating, baseline operating point is compared in Figure 25. Nu/Nu inf Experiment Trailing SST Chamferred Trailing SST Unchamferred Trailing Experiment Leading SST Chamferred Leading SST Unchamferred Leading 0 a b c d e f g h i j k l m n p Station Figure 25. Heat transfer impact of chamfer In the entry leg and the entrance to the first bend, the impact of the chamfer is notable. Throughout the majority of the passage, the impact is below 10% and within the margin expected for CFD analysis of such a complex flow. Resolution of the chamfers 40
54 throughout this study would come at the cost of increased time and effort required, reduced mesh quality, and increased element count. Inclusion of the chamfer is out of scope of the current effort considering the magnitude of the impact Simulation convergence and Physical unsteadiness The physical phenomena experienced within rotating internal cooling passages result in complex, unsteady flow. Destabilized flow in the bends separates, resulting in unsteady turbulent structures which impact heat transfer. Additionally, the Coriolis driven flow is known to destabilize the boundary layer unstable at the trailing wall. [2] Physical unsteadiness in the problem being solved manifests in steady-state CFD simulation as solution oscillations or apparent poor convergence. The integrated heat flux through the separate plates is monitored as the CFD solver iterates. The variation in heat transfer throughout the final 5000 iterations of the rotating baseline case with skewed turbulators is illustrated in Figure 26. Figure 26. Solution oscillation with iteration 41
55 Nusselt # The monitors shown correspond to the inner bend, which exhibits high relative instability compared to the rest of the domain. When steady state results are used to report the heat transfer through these plates, the result is representative of a snapshot at that specific iteration, without regard for the oscillations present. Error bars based on min and max values observed in the last 5000 iterations are plotted along with the steady state CFD solution and experimental data for the non-rotating baseline smooth walled case. The bend regions and regions further downstream exhibit significant variation Experiment SST 0 A B C D E F G H I J K L M N P R Station Figure 27. Heat transfer variation by station along the HOST passage Note that the error bars are generated using the minimum and maximum value of each plate Nusselt number within the most recent 5000 iterations. Transient CFD which explicitly resolves unsteady behavior in time is computationally expensive in terms of storage space and run time. URANS SST and SAS-SST were run to evaluate the impact of a time averaged unsteady solution compared to a steady state snapshot solution. 42
56 A compromise between time averaging and steady state results is implemented to filter out noise without incurring the costs of full unsteady simulation. Heat flux is monitored through each plate in the passage and recorded, as shown in Figure 26. The heat flux of each plate is then arithmetically averaged over the most recent 5000 iterations, in a process referred to from here on as pseudo-time averaging. This is not equivalent to a true time average, but serves to filter out some of the solution instability. True unsteady simulation advances between timesteps then executes an inner loop to converge the updated flowfield. This process accounts for the unsteady transport of conservation properties in a timeaccurate way that pseudo time averaging does not. Steady state snapshot results, pseudo-time averaged results, and unsteady time averaged results are compared for the baseline rotating simulation in Figure 28 Figure 28. Steady state, pseudo averaged, and time averaged Nu# on leading endwall at stationary baseline condition 43
57 The pseudo averaged results follow the full unsteady results and experimental results more faithfully, with fewer outliers. At later stations, especially, the consistency of the results is improved significantly by filtering out unsteadiness with pseudo time averaging. The URANS dataset included is a time accurate solution with time averaging performed by Fluent Turbulence Modelling As discussed, the behavior of fluid within a rotating serpentine passage is driven by a combination of complex flow phenomena. The ability of different turbulence models to capture different aspects of these physical phenomena becomes an important question to address. Several available turbulence models are applied to the stationary and rotating operation of the HOST passage to evaluate performance. Realizable k-ε, or RKE is a variation of the of the k-ε model which mathematically removes one of the correlation constant inherent to standard k-ε. k-ε has been an industry standard 2 equation model for many years. Advantages are high industry familiarity and stability. Prediction of separation and reattachment, however, is relatively poor using RKE. Separation plays a large role in the internal cooling passage so RKE performance may be non-ideal. SST or shear stress transport is another 2 equation turbulence model which blends between k-ω near the wall, and k-ε in the domain away from the walls. Fluent and CFX SST based calculations are performed to ensure consistency in setup and repeatability of the simulation. RSM, or the Reynolds Stress Model is also included in this study. The advantage of RSM is that it represents turbulence viscosity anisotropically. k-ω and k-ε each use two transport equations to compute a scalar value of turbulence viscosity, in accordance with the 44
58 Boussinesq hypothesis. As a scalar, this viscosity is effectively isotropic, or acting the same in all directions. In reality turbulence is not always isotropic. For example, near a wall, turbulence fluctuations normal to the wall are suppressed relative to those along the wall. As indicated in section 2.1, capturing turbulence anisotropy allows RSM to capture features such as corner vortices that develop in a square duct. Disadvantages to RSM are relative instability, and a lack of common adoption within industry. The final model considered is SAS, or scale adaptive simulation. SAS is a modification to ω based models which adds a source term based on local mesh resolution [6]. The Fluent theory guide describes SAS as an improved URANS formulation which allows the resolution of the turbulent spectrum in unstable flow conditions. Heat transfer along the passage as predicted by the various turbulence models is illustrated in Figure 29 for the stationary operating point. Note that smooth wall geometry is used for comparison of turbulence models unless otherwise specified. 45
59 Nusselt # Nusselt # Experiment RKE SST CFX SST RSM SAS A B C D E F G H I J K L M N P R Station Leading A B C D E F G H I J K L M N P R Station Trailing 46
60 Nusselt # Nusselt # A B C D E1 E2 F1 F2 G H I J1 J2 K1 K2 L M N P1 P2 R1 R2 Station Outer A B C D E1 E2 F1 F2 G H I J1 J2 K1 K2 L M N Station Inner Figure 29. Passage Nusselt Number predicted with various turbulence models RKE is the clear outlier in the heat transfer calculations in Figure 29. RKE demonstrates consistently low heat transfer relative to experiment. However, RKE demonstrates more stable convergence and a cleaner, more consistent trend than the other models. A more qualitative comparison of results is included in Figure 30, which illustrates wall shear predicted by various turbulence models. 47

61 Figure 30. Wall shear contours from various turbulence models (psi) SST and RSM contours are instantaneous at a given time step. Noise appears in the separated, turbulent regions. Qualitatively, the degree of separation between SST and RSM results varies. SAS results are shown on a time averaged basis. Generally, wall shear behavior is consistent across all 3 turbulence models. Physical phenomena such as anisotropy and high frequency turbulence, which are resolved by RSM and SAS, respectively, do not appear to dominate flow behavior in the passage. 48
62 The heat transfer calculated by the various CFD turbulence models is compared in Figure 31 for the rotating baseline operating point. 3.5 Experiment RKE SST RSM SAS Nu/Nu inf Leading 0 A B C D E F G H I J K L M N P R Station Nu/Nu inf Trailing A B C D E F G H I J K L M N P R Station 49
63 Nu/Nu inf A B C D E 1 E 2 F 1 F 2 G H I J 1 J 2 K 2K 2 L M N P 1P 2R 1R 2 Station Outer Nu/Nu inf Inner A B C D E 1 E 2 F 1 F 2 G H I J 1 J 2 K 2 K 2 L M N Station Figure 31. Nusselt Number Ratio predicted by various turbulence models for rotating baseline operating point A summary of the deviation between CFD and experiment for the studied CFD models is presented in Table 7. 50

64 Table 7. Error from experiment for Turbulence model study Avg error indicates an arithmetic average which is equivalent to the average in the total heat flux of the passage. RMS error accounts for local deviations from experiment. SST Avg indicates results are averaged in pseudo-time using the most recent 5000 iterations of SST results. The RMS error is increased for ω based models which capture a greater degree of separation and accompanying unsteadiness in solution. These models, however, match the experiment much better in terms of average % error. This means that the omega based models exhibit local peaks and valleys that are not present in the experimental data, but follow the experimental trend in a bulk sense. RKE results in a smoother trend, but under-predicts total passage heat transfer. The results for the leading wall with various models are further compared to experiment in Figure 32. The 45 degree trendline represents a perfect match between CFD and the experimental data. 51
65 Nu/Nu CFD Leading SAS Rotating RSM Rotating SST Rotating RKE Rotating Nu/Nu CFD Trailing Nu/Nu experiment Nu/Nu experiment 3.0 Inner 3.0 Outer Nu/Nu CFD Nu/Nu CFD Nu/Nu experiment Nu/Nu experiment Figure 32. Experiment comparison to CFD 45 degree plot By plotting each data point with experimental Nu/Nu, error is represented as deviation from a 45 degree line. ± %20 variation between CFD and experiment is marked with dashed lines. The entrance region leading into the 1 st bend accounts for most of the outliers present. The SST model with pseudo time averaging is chosen for use in the computational model 52
66 due to a low average percent error with a level of noise filtering to reduce the impact of physical unsteadiness Model Selection Conclusions The exercises outlined in this section were used to calibrate a modelling setup and approach which best balances simulation accuracy, computational cost, Industry acceptance of models, and intuition to model the physics of internal cooling flow. Error in CFD analysis is generally categorized as discretization error, roundoff error, convergence error, and modelling error. The exercises performed in this model study allow the rough quantification of these various sources of error, summarized in 8. Table 8. CFD error and uncertainty breakdown Category Method of evaluation or reasoning Assessed error Discretization Mesh sensitivity study ~1% for nominal hex mesh Round-off Iterative / convergence Modelling / Approximation Double precision computing with moderate aspect ratios and variations Flow unsteadiness evaluation and averaging Inlet Condition study Chamfer Simplification study Negligible ~2% for 1 st up-pass increasing to 15% in final bend ~50% for 1 st section, ~10% for second, >5% further downstream Up to 8% locally in bend 1, generally <5% Turbulence model selection < 20% observed error The primary source of concern with respect to model accuracy is the level of variation from experiment observed in the turbulence model sensitivity study. Rotating passage flow is 53
67 characterized by interaction of several viscous phenomena which is difficult to capture using off the shelf turbulence modelling. Note that decoupling error due to turbulence model selection alone from other sources of error is not immediately possible. Reported error for turbulence model selection includes impacts of all other error sources. By investigating model sensitivity to various settings and inputs, an educated model selection is made possible. The model setup converged on for use in future simulations is summarized in Table 9. Table 9. Simulation setup used for Final Simulations Value Solver Fluent 14.5 Wall treatment Enhanced Fluid Air: incompressible Ideal Gas Discretization Second Order Pressure-Velocity Coupling SIMPLE Buoyancy Non-Boussinesq Rotation Frame Motion Turbulence Model SST Curvature Correction On Filtering Monitors Chamfers Stationary Inlet Mapping Rotating Pseudo Time Averaging, 5000 iterations Q through all plates Not Included Mapped Velocity, TKE, and ω Mapped Velocity, 5% Turbulence Intensity, 0.07*Dh length scale The applied material properties of air are temperature dependent. Polynomial fits for dynamic viscosity, thermal conductivity, and specific heat are applied with respect to temperature. 54
68 3.4 HOST Validation The modelling setup and approach developed in the preceding sections is evaluated against the HOST data throughout a suite of operating points with variations in various non-dimensional parameters. For the set of experimental operating points validated, see Table 10. Table 10. HOST validation test suite Case Re Number Ro Radius Ratio Number (R/d) Rotation Angle Inlet Density Ratio Turbulators Description 1 25, None 2 25, Straight 3 25, deg 4 25, None 5 25, Straight 6 25, deg Baseline Stationary Baseline Rotating 7 25, None Effect of Rotation 8 25, deg Number 9 25, None 10 25, None 11 25, deg 12 25, deg 13 12, None 14 50, None 15 12, deg 16 75, deg Effect of Density Ratio Effect of Reynolds Number Heat transfer experimental and CFD results are compared primarily in terms of total passage heat pick up, Plate Nusselt number, Plate Nusselt number ratio, % deviation from experiment, and % deviation from baseline operating point. 55


69 3.4.1 Baseline Results Simulations 1-6 represent baseline operation and are consistent with the grid independence and turbulence model comparison studies. Other operating points typically vary from these baseline conditions by varying one of the non-dimensional parameters used to describe the physics of rotating passages. The flowfield through the passage is illustrated using volume renderings and streamlines looking toward the leading suction side endwall. The volume rendering is a 3-D representation of the flow with opacity increasing with velocity and colored by velocity. The flow inlet is the leftmost leg base as shown. The nonrotating results with smooth walls, Case 1, are shown in Figure 33. Figure 33. Side view of passage flow for non-rotating smooth HOST geometry (Case 1) Secondary flows in the form of dean vortices are generated by the bend, but the flow is otherwise calm, with little crossflow. 56


70 The nonrotating baseline case with skewed turbulators (Case 3) is shown in Figure 34. Figure 34. Velocity visualization viewed toward leading end wall The addition of skewed turbulators generates secondary flows in the straight leg sections. Additionally, flow is concentrated, resulting in regions of higher velocity than is observed in the non-turbulated results. Results for the rotating baseline case with skewed turbulators are illustrated in Figure 35 57
71 Figure 35. Case 6 Velocity Side View In the bends, vortices carry high velocity flow toward the leading endwall. The flow is visibly less clean and uniform than in stationary operation, with passage rotation creating regions of high and low velocity near the wall in locations that were clean and uniform for the non-rotating case. 58
72 3.4.2 Passage Heat Pickup Validation of the total heat transfer of the entire heated section of the duct is performed in this section. The total heat transfer is computed by summing the plate heat transfer, Q, across all the heated plates in the passage. In this comparison, good agreement is achieved between the CFD model and experimental data. Table 11 compares the net heat pick up of the first two passes for each of the operating points simulated. Table 11. Net passage heat transfer from CFD and experiment (Btu/h) Qt,exp Qt,cfd Diff St. smooth % St. skewed % Rot. Smooth % Rot. Straight % Rot. Skewed % Low Re. smooth % Low Re. skew % High Re. smooth % High Re. skew % High Ro smooth % High Ro skewed % Low Temp. Smooth % Low Temp. Skewed % High Temp. smooth % High Temp. skewed % Results from only the first 2 passes are used to maintain consistency because, in some cases, experimental data is not available after the root bend. A trend observed is that the CFD validates bulk heat transfer more accurately against the experiment for turbulated passage geometries. Turbulators break up large secondary flows and 59
73 tend to stabilize a flow by restarting the boundary layer. In a smooth passage, complex flow features can develop gradually along a passage section. Errors that do develop are allowed to propagate and snowball more freely in a smooth passage. Future sections will investigate plate by plate heat transfer correlation, providing greater insight. For turbulated passages, the variation in net heat transfer rarely exceeds 5%, which is on the order of experimental uncertainty, quoted as 2% to 7%. The consistent match across the entire operating regime indicates that The CFD model captures the impact of changes in each of the parameters studied. The percent change in heat transfer observed due to variations in Reynolds number, Rotation number, and Buoyancy parameter is consistent between the CFD and experiment for smooth and turbulated geometries. The sensitivity of the experimental results and computational model to each of the perturbations from the baseline rotating condition is documented in Table 12. Baseline is defined as case 4 for smooth walled simulations and case 6 for cases with skewed turbulators. Table 12. Sensitivity of experiment and CFD to changes in operating condition %change from baseline (experiment to experiment) %change from baseline (CFD to CFD) Low Re. smooth -35.4% -41.6% Low Re. skew -42.4% -45.0% High Re. smooth 109.8% 85.0% High Re. skew 166.4% 152.6% High Ro smooth 16.2% 10.0% High Ro skewed 8.9% 3.5% Low Temp. Smooth -50.5% -42.9% Low Temp. Skewed -48.0% -49.0% High Temp. smooth 131.7% 139.4% High Temp. skewed 124.2% 107.5% 60
74 3.4.3 Detailed Validation With the general impression that the computational model captures bulk heat transfer and the impacts of the various physics at play in the HOST passage, more localized validation is performed. Heat transfer data from the HOST program is available for each of the 4 passage walls at 16 stream wise plate locations. CFD results are post-processed to match the data extraction methodology at these same locations. For each operating point considered, local heat transfer is compared against experiment, and conclusions are drawn about the passage physics and model capabilities Stationary Baseline Condition The stationary baseline condition benchmarks the computational model against experiment with as few physics involved as possible. In the absence of rotation, Coriolis Effect does not exist, and the impact of Buoyancy is vastly reduced. The stationary condition is primarily characterized by entrance effect and bend behavior. Figure 36 compares the net heat transfer at various stations along the passage between CFD and experiment for the smooth walled passage geometry, corresponding to Case 1. 61
75 Btu/hr Experiment CFD A B C D E E-b F F-b G H I J J-b K K-b Figure 36. Heat transfer along passage for Case 1 The heat transfer shown includes all heated plates from the experiment, including leading, trailing, and side walls. The first 2 stations exhibit a significant underprediction compared to experimental results. In spite of applying HOST program measurements for inlet velocity profile and turbulence intensity, entrance effects appear underpredicted by the CFD model. The behavior of the plenum setup in the HOST experimentation is not reflected properly using the applied CFD inlet condition. As discussed, specifics of the plenum and inlet setup from the HOST tests are not immediately available. Good data agreement is achieved downstream of entrance effects through the end of bend 1 (stations E and F). In the inflowing leg, the CFD results indicate higher heat transfer than observed in HOST testing. As the flow enters the root bend (stations J and K) the heat transfer rate again matches well between CFD and experiment. The third leg is not included in net heat transfer validation because the data was not provided in the HOST documentation beyond the root turn at some test conditions. Error analysis indicates that the experimental error due to accumulated error in the energy balance could reach 30% in the final outflowing leg. [2] 62
76 Btu/Hr Addition of turbulators to the stationary baseline operating point adds complexity to the flowfield. Turbulators along the leading and trailing walls reset the boundary layer and enhance turbulent mixing. This mixing also creates turbulent structures which tend to suppress the impact of other secondary flows. The total heat transfer along the passage with straight turbulators, orthogonal to the flow, is plotted in Figure Experiment CFD A B C D E E-b F F-b G H I J J-b K K-b Figure 37. Heat transfer along passage for Case 2 Under-prediction of heat transfer in the first leg due to inlet condition appears once again. Downstream of bend 1, excellent agreement is achieved. Net heat transfer in Case 3 is illustrated in Figure 38 with turbulators skewed 45 degrees relative to the passage orientation 63
77 Btu/Hr Experiment CFD A B C D E E-b F F-b G H I J J-b K K-b Figure 38. Heat transfer along passage for Case 3 The presence of turbulators enhances mixing near the wall, increasing the net heat transfer significantly. Similar to the smooth operating point, the CFD model underpredicts entry effects and overpredicts heat transfer in the inflowing leg. The skewed turbulators develop a secondary flow which appears to desensitize the first leg heat transfer to the passage inlet condition. Disparaties from experimental results are less noticable with skewed turbulators present. The impact of the turbulators appears well captured by the computational model. Plate by plate heat transfer represents the highest resolution at which experimental data from the HOST program is available. CFD results were postprocessed to allow back to back comparison of the heat transfer through each of the plates on individual walls for comparison. Figure 39 illustrates this comparison for the Stationary Baseline operating condition with no turbulators, straight turbulators, and skewed turbulators. Heat transfer is represented in terms of Nusselt Number. 64
78 Nusselt # Nusselt # 250 Leading A B C D E F G H I J K L M N P R Station Trailing A B C D E F G H I J K L M N P R Station 65
79 Nusselt # Nusselt # 250 Outer A B C D E1 E2 F1 F2 G H I J1 J2 K1 K2 L M N P1 P2 R1 R2 Station Inner A B C D E1 E2 F1 F2 G H I J1 J2 K1 K2 L M N Station Figure 39. Passage Nusselt number for stationary operation Eddies are generated in the passage due to bend effects, turbulators, and other phenomena which interact to create a complex flow. Individual plate heat transfer data is more sensitive to these secondary turbulent structures than station by station results, such as the results shown in Figure 36, Figure 37, and Figure 38. Station by station heat transfer, including leading, trailing, and side walls as one heat transfer surface, provides a measure of net heat transfer augmentation along the duct due to the various physical phenomena. Agreement between CFD and experimental data on 66
80 a station by station basis indicates that the magnitude of mixing and turbulence generation at any streamwise location is represented properly. Figure 39, which illustrates heat transfer on a plate by plate basis, is sensitive to the exact location at which turbulent flow structures interact with sidewalls. Agreement between CFD and experimental data on a plate by plate basis indicates a capture of the passage physics down to the location at which turbulent structures and eddies that are generated interact with individual walls. With RANS turbulence modelling and modern CFD capability, such agreement is challenging to achieve. Away from the entrance, the distribution of heat transfer on a plate by plate basis is reasonably well matched for cases 1, 2, and 3. Because flow behavior within a turbine cooling passage is complex, it is difficult to evaluate the agreement to CFD results by comparing heat transfer magnitude directly between CFD results and Experimental results. For example, if good data match is attained at Case 1, which is smooth walled and stationary, but a poor data match is observed at an operating point which includes reduced flowrate, rotation, and skewed turbulators, it is difficult to determine specific shortcomings of the model without further analysis. In order to evaluate model sensitivity to various physics at play, the change in heat transfer due to a single change in operating point is analyzed. In order to evaluate the ability of the CFD model to capture the impact of leading and trailing wall turbulators, The change in heat transfer predicted by the CFD model between smooth and turbulated results is compared to the change in heat transfer measured in the HOST data set. %Δ Nu going from case A to case B is defined as: Nu A Nu B Nu B 67
81 % Δ Nu % Δ Nu The impact of each turbulator type, straight and skewed, is compared against the smooth walled geometry for the stationary operating point in Figure % Leading 250.0% 200.0% 150.0% 100.0% 50.0% 0.0% -50.0% % 300.0% A B C D E F G H I J K L M N P R Station Trailing 250.0% 200.0% 150.0% 100.0% 50.0% 0.0% -50.0% A B C D E F G H I J K L M N P R Station 68
82 % Δ Nu % Δ Nu 140.0% 120.0% 100.0% 80.0% 60.0% 40.0% 20.0% 0.0% -20.0% -40.0% -60.0% 120.0% Outer A B C D E1 E2 F1 F2 G H I J1 J2 K1 K2 L M N P1 P2R1R2 Station Inner 100.0% 80.0% 60.0% 40.0% 20.0% 0.0% -20.0% -40.0% -60.0% A B C D E1 E2 F1 F2 G H I J1 J2 K1 K2 L M N Station Figure 40. Impact of various turbulator geometries on passage heat transfer 69
83 It appears that the impact of the straight turbulators is relatively poorly represented in the CFD model. Because the primary purpose of this effort is to validate a model used to improve the understanding of flow in passages with skewed turbulators, Investigation into the cause of disagreement between straight turbulated CFD results and experimental data was minimal in order to budget time to higher priority information. A likely cause for the degraded data match with straight turbulators is increased separation and reattachment which is historically difficult to capture with RANS CFD. With some exceptions late in the passage concerning the outer and inner sidewall heat transfer, the CFD model appears to capture the impact of adding skewed turbulators to the stationary passage well Rotating Baseline Condition The rotating baseline condition adds the impact of rotation to the stationary baseline operating point. Reynolds number and density ratio are held constant. The total heat transfer at each station along the passage is plotted in Figure 41 for the smooth walled rotating baseline case. 70
84 Btu/Hr Btu/Hr Experiment CFD 0 A B C D E E-b F F-b G H I J J-b K K-b Figure 41. Heat transfer along passage for Case 4 The CFD model differs from experimental results primarily in terms of entrance effect due to inlet condition, and the behavior downstream of the first bend. Figure 42 similarly plots section heat transfer along the rotating passage for case 5, with straight turbulators Experiment CFD A B C D E E-b F F-b G H I J J-b K K-b Figure 42. Heat transfer along passage for Case 5 71
85 Btu/Hr Downstream of the entrance, the agreement between CFD and experiment in terms of combined heat transfer on all 4 walls is very good. Heat transfer along the rotating passage with skewed turbulators, case 6, is illustrated in Figure Experiment CFD A B C D E E-b F F-b G H I J J-b K K-b Figure 43. Heat transfer along passage for Case 6 Nu/Nu for each of the plates within the passage for the rotating baseline condition, case 4, 5, and 6 is illustrated in Figure
86 Nu Nu Leading A B C D E F G H I J K L M N P R Station Trailing A B C D E F G H I J K L M N P R Station 73
87 Nu Nu Outer A B C D E1 E2 F1 F2 G H I J1 J2 K1 K2 L M N P1 P2 R1 R2 Station Inner A B C D E1 E2 F1 F2 G H I J1 J2 K1 K2 L M N Station Figure 44. Nusselt number for baseline rotating operating point simulations, Cases 4, 5, and 6 Similar to stationary operation, the straight turbulator geometry results show the greatest deviation from experiment. The behavior in the passage is significantly altered from stationary operation, with the trailing walls showing enhanced heat transfer for outflowing legs and degraded heat transfer on inflowing legs, as expected. The suction side, leading wall demonstrates 74
88 the opposite trend. Overall, a reasonable level of agreement is achieved between CFD and experiment. In order to isolate the impact of rotation on passage heat transfer, the percent increase in Nu/Nu from the stationary operating point to the rotating baseline operating point is plotted in Figure

89 % Δ Nu/Nuinf % Δ Nu/Nuinf 80% 60% 40% 20% 0% -20% -40% -60% -80% -100% Leading A B C D E F G H I J K L M N P R Station 100% 80% 60% 40% 20% 0% -20% -40% -60% -80% Trailing A B C D E F G H I J K L M N P R Station 76
90 % Δ Nu/Nuinf % Δ Nu/Nuinf 100% 80% 60% 40% 20% 0% -20% -40% -60% -80% Outer A B C D E1 E2 F1 F2 G H I J1 J2 K1 K2 L M N P1 P2 R1 R2 Station 100% 80% 60% 40% 20% 0% -20% -40% -60% -80% Inner A B C D E1 E2 F1 F2 G H I J1 J2 K1 K2 L M N P1 P2 R1 R2 Station Figure 45. % variation in Nusselt number associated with rotating vs. stationary baseline cases The leading, suction wall experiences decreased shear on the first outflowing leg when the passage is rotating. Legs further downstream exhibit less influence of rotation. Case 6, the skewed rotating baseline simulation, differs from the others and from the experiment in this first 77
91 Nu/Nu CFD Nu/Nu CFD Nu/Nu CFD Nu/Nu CFD leg. Aside from the leading wall for case 6, the impact of rotation appears well captured by the CFD model. Cases 1 through 6 are considered as the baseline data sets for HOST validation. The calculated Nusselt numbers are compared to the experimentally measured Nusselt numbers for all plates and each of these operating points in Figure 46. The solid line represents an exact agreement between CFD and experiment. The dashed lines represent ±20% error. 250 Leading 250 Outer Nu/Nu experiment Nu/Nu experiment 250 Trailing 250 Inner Nu/Nu experiment Nu/Nu experiment Figure degree plots representing error of baseline set of operating points Consistent with previous observations, the straight turbulator datasets, case 2 and case 4, which correspond to straight turbulators, are consistently outside the 20% error margin. Other datasets 78
92 Btu/Hr have outliers which exceed 20% error, but are generally within the dashed lines representing 20% error. Cases 15 through 18 explore the impact of variations to Reynold number relative to the baseline rotating operating condition with smooth walls and skewed turbulators. Reynolds number is reduced from 25,000 at the baseline operating point to 12,500 for cases 15 and 17, which feature smooth walls and skewed turbulators, respectively. Reynolds number is increased from 25,000 to 50,000 for case 16 with smooth walls and increased to 75,000 for case 18 with skewed turbulators. Low Reynolds passage operation is of particular concern to this research. Heat transfer for low Reynolds number operation with smooth passage walls, case 15, is illustrated in Figure Experiment CFD A B C D E E-b F F-b G H I J J-b K K-b Figure 47. Heat transfer along passage for Case 15 Combined heat transfer of all 4 walls along the passage for case 17, Low Reynolds number with skewed turbulators, appears in Figure
93 Btu/Hr Btu/Hr Experiment CFD 0 A B C D E E-b F F-b G H I J J-b K K-b Figure 48. Combined wall heat transfer along passage for Case 17 Heat transfer for low Reynolds number operation with smooth passage walls, case 16, is illustrated in Figure 49. Note that the High Reynolds Number operating point for the smooth walled case, driven by experimental data availability was at Re=50,000. The turbulated high Reynolds Number operating point is at Re = 75, Experiment CFD A B C D E E-b F F-b G H I J J-b K K-b Figure 49. Combined wall heat transfer along passage for Case 16 80
94 A B C D E E-b F F-b G H I J J-b K K-b Btu/Hr Combined heat transfer of all 4 walls along the passage for case 18, high Reynolds number with skewed turbulators, appears in Figure Experiment CFD Figure 50. Combined wall heat transfer along passage for Case 18 The impact of Reynolds Number variation for the each heated plate independently is documented in Figure
95 82
96 Figure 51. Nu/Nu variation throughout passage due to changing Reynolds Number Impact of Reynolds # variation is of significant importance to the current research. Behavior has been observed in cooling passages with low passage velocity which do not adhere to correlations developed using the HOST experimental dataset. One purpose of the current effort is to develop a model which can be used to extend the understanding of low Reynolds internal cooling. There is a strong dependence between Reynolds number and Nusselt number, increasing heat transfer with increasing Reynolds number. When Nusselt number is normalized as Nu/Nu, The 83
97 impact of increased Reynolds number is fairly small. Nu/Nu can be interpreted as the ratio of heat transfer observed to the heat transfer that would occur in a smooth duct with the same bulk velocity. Any impact of Reynolds number observed on this basis is not simply an increase in heat transfer that comes with increased bulk velocity. Overall, the HOST documentation cites a small impact on Nusselt number ratio due to Reynolds number variation [2]. The HOST data indicates that the greatest sensitivity to Reynolds number exists in the first bend on the leading and outer walls. Figure 52 below shows the change in Nusselt number ratio between the low Reynolds and High Reynolds datasets for turbulated and smooth geometries. Plotting Nu/Nu compares the impact of changing Reynolds number only, filtering out any differences between the baseline CFD and experimental results. For the Smooth walled data, the data shown is the increase in Nu/Nu due to increasing Reynolds number from 15,000 to 50,000. For the turbulated results the shown data represents the increase in Nu/Nu due to increasing Reynolds number from 15,000 to 75,
98 85
99 Figure 52. Reynolds number impact on passage heat transfer Keep in mind that the experimental error cited in the host documentation increases to ~7% after station K, in the final heated leg. Excluding the outer sidewall and data points after station K, the variation in heat transfer due to Reynolds number change is well represented. The outer sidewall exhibits noticeable mismatch between experimental result and CFD for the turbulated geometry in the 1 st leg. 86
100 Btu/Hr HOST documentation indicates that relaminarization is likely to occur at the low Reynolds operating point (Re=12,500). The CFD SST model used for this research assumes fully turbulent flow High Rotation Number Condition Simulations 9 and 10 in the HOST validation test suite exhibit a rotation number of 0.34 compared to the baseline Rotation number, These high rotation cases were included in the validation to assess the ability of the model to capture the impact of increased rotational speed relative to the bulk flow speed. Heat transfer along the passage for the smooth walled geometry is illustrated in Figure Experiment CFD A B C D E E-b F F-b G H I J J-b K K-b Figure 53. Heat transfer by station along HOST passage for simulation 9 87
101 Btu/Hr Consistently, we see a large discrepancy in heating in the first leg of the smooth walled passage. The impact of the plenum and screen used in the HOST experiment is clearly not captured in the CFD model inlet condition. The modelling approach used in this research would best be used in combination with a more precise inlet condition, or a domain that extends further upstream relative to the area of interest than in the current simulation. Downstream of the first bend, excellent data match is achieved. Passage heat transfer for the high rotation operating point with skewed turbulators (case 10) is illustrated in Figure Experiment CFD A B C D E E-b F F-b G H I J J-b K K-b Figure 54. Heat transfer by station along HOST passage for simulation 10 The impact of the inlet condition mismatch compared to the experiment is quickly drowned out by the turbulator induced mixing in the passage, resulting in a smaller region of net heat transfer error than with smooth walls. The impact of variation in Rotation number is illustrated in Figure 55 which compares, rotating baseline, and high Rotation # for the smooth walled and skewed turbulator geometry. 88
102 4.5 Leading Nu/Nu inf A B C D E F G H I J K L M N P R Station Trailing Nu/Nu inf A B C D E F G H I J K L M N P R Station 89
103 5 Outer Nu/Nu inf A B C D E1 E2 F1 F2 G H I J1 J2 K1 K2 L M N P1 P2 R1 R2 Station Inner Nu/Nu inf A B C D E1 E2 F1 F2 G H I J1 J2 K1 K2 L M N Station Figure 55. Nu/Nu variation in passage at increased rotational speed 90
104 The difference in Nusselt number between the baseline condition and high rotation condition for the smooth and skewed passages is examined by further processing the data. In order to isolate the impact of variations in Ro# on wall heat transfer, Nu/Nu is plotted in Figure 56. Increase in Nu/Nu due to changing rotation number from 0.24 to 0.34 is elucidated. 91
105 1.00 Leading Nu/Nu inf A B C D E F G H I J K L M N P R Station 1.40 Trailing Nu/Nu inf A B C D E F G H I J K L M N P R Station 92
106 1.40 Outer Nu/Nu inf A B C D E F G H I J K L M N P R Station 0.60 Inner Nu/Nu inf A B C D E F G H I J K L M N P R Station Figure 56. % Impact of increased rotational speed on passage heat transfer 93
107 Btu/Hr Overall, the impact of varying rotation speed is captured by the CFD model. Small, complex turbulent structures exist in the flow, which make local data matching difficult. These localized effects result in deviations that are typically limited to individual plates. Simulations with the smooth walled geometry are especially susceptible to localized variations in heat transfer Density Ratio Variation Heat pickup results with no turbulators and reduced density ratio, case 11 is illustrated along the passage in Figure Experiment CFD A B C D E E-b F F-b G H I J J-b K K-b Figure 57. Heat transfer by station along HOST passage for simulation 11 Heat pickup results with skewed turbulators and reduced density ratio, case 12 is illustrated along the passage in Figure
108 Btu/Hr Btu/Hr 60 Experiment CFD A B C D E E-b F F-b G H I J J-b K K-b Figure 58. Heat transfer by station along HOST passage for simulation 12 Heat pickup results without turbulators and increased density ratio, case 14 is illustrated along the passage in Figure Experiment CFD A B C D E E-b F F-b G H I J J-b K K-b Figure 59. Heat transfer by station along HOST passage for simulation 13 95
109 Btu / Hr Heat pickup results with skewed turbulators and high density ratio, case 14 is illustrated along the passage in Figure Exp CFD Figure 60. Heat transfer by station along HOST passage for simulation 14 The impact of Density ratio variation for the smooth walled passage geometry is documented in Figure 61. Case 11, 12, 13, and 14 are included. 96
110 4.5 Leading Nu/Nu inf A B C D E F G H I J K L M N P R Station 5 Trailing Nu/Nu inf A B C D E F G H I J K L M N P R Station 97
111 5 Outer Nu/Nu inf A B C D E1 E2 F1 F2 G H I J1 J2 K1 K2 L M N P1 P2 R1 R2 Station 3 Inner Nu/Nu inf A B C D E1 E2 F1 F2 G H I J1 J2 K1 K2 L M N Station Figure 61. Nu/Nu Variation in passage for various density ratios 98
112 Further processing of the large dataset generated for HOST validation is undertaken to evaluate model sensitivity to changes in passage operating point HOST Validation Summary Overall the validation of CFD data against HOST experimental data indicates a sensitivity of the CFD model to all of the primary factors that determine heat transfer in a rotating passage. Combined heat transfer of all 4 walls matches experiment much more consistently than the single plate results, indicating that small local flow structures are not as well represented by the model as is the bulk impact of flow features and operating point on total heat exchange. Entrance effect, and flow behavior entering and exiting the bends represent the greatest difficulty for the CFD model. An accurate representation of passage entry effects or a sufficient model runin to separate the area of interest from the inlet boundary is critical when modelling internal cooling to mitigate the sensitivity of calculation to assumptions made at the inlet. Bend entry and exit are driven by complex separated flow. RANS models such as SST are commercially applicable to such flows, but research has indicated that a more explicit Navier-Stokes simulation, such as L.E.S. can better predict free shear and turbulence behavior. The current CFD model accuracy is generally bounded by ± 20% error. LES based modelling could likely improve the accuracy of the model, but at great cost, outside the scope of current effort. Current practice relies on correlations for heat transfer predictions which typically exhibit error on the order of the current CFD model. 3.5 Texas A&M Experiment CFD Validation The simulation methodology developed for the HOST validation was also applied to the data set described in [5]. This data set is based on more modern instrumentation, with a more precise description provided of the test article geometry. 99


113 Mesh density is based on results of the HOST program grid independence study. A block structured hexahedral mesh is generated which features about 9 million elements. The geometry exhibits quarter symmetry so a quarter sector mesh is generated and smoothed, then instanced to create the full domain mesh. Figure 62. Mesh illustration for passage Mesh density is targeted toward the mesh size chosen for HOST simulation based on the grid independence study performed. The experimental operating point validated against is outlined in Table
114 Table 13. J.C. Han Validation Operating Point Parameter Value Re 25,000 Ro 0.21 Aspect Ratio 2:1 Turbulators 45 degree skewed The inlet condition described for the experimental rig [5] is difficult to replicate in CFD. Other documentation for internal cooling experiments from Texas A&M describe the inlet as a feed hole that is drilled into the base of the first leg which flows orthogonal to the leg direction. This approach is taken to provide a sudden inlet condition which does not carry developed rotational effects into the domain. The specific inlet geometry of this test is not described explicitly. An unheated section, purple in Figure 62, is included upstream of the heated section to create a partially developed flow profile in the experiment and CFD. An appreciable mismatch is observed, however, in the first heated section between the CFD and experiment. The heat transfer in the experimental rig is enhanced at the first plate relative to the others, suggesting that the flow was in fact not fully developed at that point. Figure 63 compares the leading and trailing wall heat transfer within the passage between CFD and experiment. 101
115 Nu/Nu X/D Experiment Leading Experiment Trailing CFD_Leading CFD Trailing Figure 63. Nusselt number along passage for CFD and Experiment Good agreement is observed away from the inlet, outlet and bend exit. Variations from the experiment at the first and last heated sections are likely due to differences between the treatment of the inlet and outlet in the CFD model and the experimental rig. CFD also predicts a higher level of heat transfer on both walls at the bend exit than measured in the experiment. The bend exit appears consistently to be the most difficult region to model due to large scale separation and coupling of various unstable physical phenomena. Because the rig geometry is perfectly symmetric, heat transfer variations between the leading and trailing walls can be attributed entirely to rotation effects. The difference in Nusselt number between the leading and trailing wall is illustrated for the CFD and experimental data in Figure 64. A positive value corresponds to trailing wall heat transfer greater than leading wall heat transfer. 102
116 Figure 64. Difference between Leading and Trailing Nusselt number ratio due to rotation The impact of rotation appears consistently reproduces by the CFD model with respect to the experiment. Aside from an overestimation of the impact leading into the bend at the fifth data point, the augmentation of heat transfer due to rotation is accurately modelled. The percent difference in Nusselt number ratio at each location is presented in Figure 65. Figure 65. % Deviation between experimental and CFD predicted Nusselt Number The observations are consistent with prior discussion of Figure 63. Early and late in the passage, a significant difference exists between the CFD and experiment, likely due to boundary conditions which don t perfectly represent the rig inlet and outlet which are not explicitly described. Otherwise, the only data point which exceeds 20% error is immediately after the bend. 103

117 Wall shear contours shown in Figure 66 illustrate the interaction with separated vortex cores and the wall downstream of the bend. High shear areas can be seen which attribute to over predicted heat transfer. Figure 66. Wall shear in the bend region (in psi) Overall, results of the added validation of the CFD model against the Texas A&M experimental data is fairly consistent with the HOST data based validation effort. Care needs to be taken to accurately represent domain boundaries, or include a sufficient buffer region upstream and downstream of the region of interest to eliminate error which is attributed to inlet and outlet treatment. Additionally, local heat transfer immediately downstream of the bend is difficult to match in terms of localized heat transfer, but in a bulk sense 3.6 University of Manchester Experiment CFD Validation 104

118 As indicated in section 3.1.3, The Iacovides experiment is validated against CFD at a Reynolds number of 36,000 and a Rotation number of 0.4. The working fluid is water with Prandtl # Before discussing results comparison between the CFD model and experimental results for this dataset, uncertainty in agreement between the operating points should be mentioned. The primary uncertainty in terms of agreement between the experimental test point and the operation point modelled in the CFD is the location of the axis of rotation. Figure 67 shows a cut plane of the passage mesh with an arbitrary axis of rotation illustrated. Figure 67. Mesh cut plane with axis of rotation indicated For this analysis, the axis of rotation was placed halfway between the inlet and the bend tip. The actual location is not explicitly called out in the experimental documentation. Because data is sampled near continuously, HTC, and Nusselt number published from the experiment are based on a continuously varying bulk temperature. Implementation of similar postprocessing of CFD results is prohibitive, so the CFD result are normalized by a constant reference temperature, specifically the mean of the inlet and exit temperature, 537 o R. 105
119 Figure 68. Nu/Nu comparison between experiment and CFD Experimental contours of wall Nusselt number are inherently time averaged. Because the behavior in the bend is inherently separated and unstable, Time averaged CFD results are necessary to make a good comparison. Unsteady CCT with time averaging of Nusselt number is performed in CFX. Figure 69 includes contours of Nusselt Number from the CFD simulation in color, and contours from the experiment as black bands. Recall that the CFD Nusselt Number is defined with a constant reference temperature, while the simulation uses a continuously varying reference temperature. 106


120 Nu # Figure 69. Experimental and CFD Nusselt Number Contours overlaid On entry to the bend, The CFD model predicts the formation of flow structures similar to the experimental contour results. Exiting the bend however, specifics of heat transfer and location of hot spots are less similar. In a bulk sense the duration and magnitude of heat transfer augmentation exiting the bend matches well, but the interaction of vortices with the wall varies. This behavior is consistent with observations from validation efforts against HOST [2] [3] data and Texas A&M [5] data. 107
121 4. CONCLUSIONS The validation exercise documented within this report evaluates the ability of RANS based CFD to predict convective heat transfer of cooling flow within a rotating serpentine passage. Comparison of various experimental data sets to CFD results provides an understanding of the capabilities and limitations of this modelling approach for the physics involved in turbine cooling with serpentine passages. With respect to initial modelling approach, note that Boundary conditions, mesh resolution, and turbulence modelling of the CFD model must be carefully considered, as these modelling choices can severely impact results. In the case of each of the three experimental programs considered, the treatment of the flow at the computational domain inlet proved a source of significant local error. Heat transfer at the entry of a passage is largely dependent on the flow state immediately upstream. A quality CFD model for a serpentine passage should either apply known turbulence levels and velocity profiles at the domain inlet, or include extra geometry upstream of the region of interest to allow the passage entry condition to develop within the model. In the case of this research, the inlet conditions and upstream geometry were not readily available. The level of mesh sensitivity for turbulated serpentine passages demonstrated herein indicates the importance of performing a mesh sensitivity analysis for any CFD analysis. The physical length scales to be captured by CFD must be resolvable on the provided mesh. In the case of this analysis, the smooth block structured meshes compare very favorably to unstructured tetrahedral meshes in terms of efficiency. A 6 million element structured mesh is shown to achieve lower grid dependence than a tetrahedral mesh of 63 million elements. It is often thought that high order discretization eliminates any effective performance advantage of structured hexahedral meshes over tetrahedral meshes, but this research demonstrates otherwise. High order 108
122 numerics reduce the impact of flow alignment of faces, but also note that a cube of a given edge length occupies over 8 times the volume of a perfect tetrahedron of the same edge length. This means that if you wish to resolve a given length scale, it requires roughly 8 times as many tetrahedra as hexahedra to occupy the same volume. Mesh sensitivity evaluation in conjunction with CFD analysis is an important check which greatly improves veracity of model results. Another key modelling choice which demonstrated great impact on simulation results is turbulence model selection. Different turbulence models present different benefits. It is important to consider what physics are involved in a problem and understand what available models can capture those physics. The balance between model complexity and the fidelity of turbulence modelling is an important consideration for CFD analysis and of central focus to research. The 2 equation SST model is demonstrated to provide sufficient accuracy in this case without incurring the significant computational cost of more sophisticated models such as RSM or Large Eddy Simulation. The experimental data utilized in this validation effort allowed for the evaluation of model accuracy with respect to bulk heat transfer and other key performance metrics for internal cooling, but a more complete and physically grounded validation may be possible with additional experimental data. The ideal experimental outputs for a comprehensive CFD model validation are listed below: Explicit documentation and characterization of inlet geometry Detailed dimensioned drawings sufficient to entirely re-create test article without assumptions High resolution 3-D velocity data at domain inlet to capture secondary flows High resolution turbulence intensity or turbulence kinetic energy and length scale data at the domain inlet 109
123 PIV (particle image velocimetry) data at bend entry, mid bend, and bend exit to understand secondary flow behavior and better understand turbulence model shortcomings Continuous wall shear data throughout heated section It is understood that acquisition of the data outlined above is extremely difficult given modern techniques and the inertial loading associated with rotating turbomachinery. Consider the list above a wish list which, if achieved, would facilitate future CFD validation to more completely understand simulation performance. Particularly, the understanding of secondary flow structures throughout the bend at various operating points could provide significant insight into the interaction of the driving physics which impact turbine cooling flow. Turbulence model against experimental behavior of these interactions would be paramount in providing physically based rationale for selection of a given model and open the door to model studies to improve heat transfer predictions in various rotating machinery applications. Internal cooling passages present an extremely difficult fluid dynamics problem. Considering the complexity of the flow and the level of error that is typically expected for Internal cooling heat transfer predictions, the CFD model validated herein provides a reliable means for the estimation for cooling passage heat transfer across a wide range of operating points. In general, the accuracy of the computational model is within 10% for heat transfer of a full passage, and 20% in terms of local features. This accuracy is consistent across variations in Reynolds number, rotation number, density ratio, and turbulator configuration. This level of accuracy is within an acceptable range for turbine cooling predictions. The key benefit of the model compared to Experimental correlation is in extrapolation. Because CFD is based on the solution of a set of governing conservation equations, the physical viability is not limited to the range of operating points for which tests have been performed. Having evaluated the ability of the CFD model to capture the effects of the range of physical phenomena which 110
124 impact internal cooling flow for rotating turbomachinery, we can simulate different internal cooling operating points with reasonable certainty in the results without performing additional experimentation. 111
125 BIBLIOGRAPHY 1. Dual Solutions for Steady Laminar Flow Through a Curved Tube. Dennis, S.C.R. and Ng, Michael. 3, s.l. : Oxford Journals, 1982, Quarterly Journal of Mechanics and Applied Mathematics, Vol. 35, pp Effects of Rotation on Coolant Passage Heat Transfer, Volume 1. T.J. Hajek, J.H. Wagner, B.V. Johnson, A.W. Higgins, and G.D. Steuber. NASA Contractor report 4396, Vol. I 3. Effects of Rotation on Coolant Passage Heat Transfer, Volume 2. B.V. Johnson, J.H. Wagner, G.D. Steuber. NASA Contractor Report 4396, Vol. II 4. Experimental study of thermal development in a rotating square-ended U-bend. H. Iacovides, D. Kounadis, Z. Xu. 2009, Experimental Thermal and Fluid Science Vol. 33 pp Heat Transfer in a Two-Pass Rectangular Rotating Channel with 45-deg Angled Rib Turbulators. Gm S. Azad Mohammad J. Uddin, Je-Chin Han, Hee-Koo Moon, and Boris Glezer. April 2002, Journal of Turbomachinery Vol. 124 pp Fluent Theory Guide, version 15 ANSYS Software documentation 7. Nikuradse, J Untersucheungen uber die Geschwindigkeitsverteilung in turbulenten Stromungen. Ph.D. Thesis, University of Gottingen, Germany 8. Reynolds number dependence of mean flow structure in square duct turbulence. Alfredo Pinelli, Markus Uhlmann, Atsushi Sekimoto, and Genta Kawahara. Journal of Fluid Mechanics 644 pp Numerical Study of Turbulent Secondary Flows in Curved Ducts. N. Hur, S. Thangam, C.G. Speziale. NASA Contractor Report , April 1,


126 APPENDICES A: Section Cuts of Velocity for Select HOST Operating Points Case 4 113


127 114


128 115


129 116


130 117

131 118

132 119

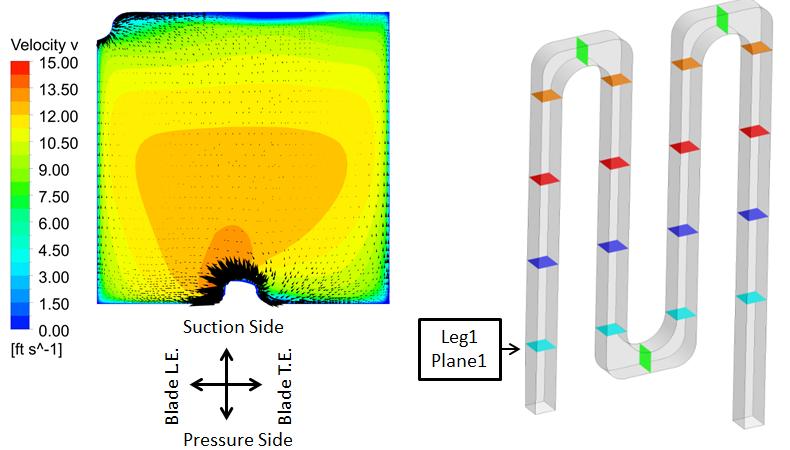
133 120 Case 6

134 121

135 122

136 123


137 124


138 125


139 126


140 127 Case 7

141 128

142 129

143 130


144 131


145 132


146 133

147 134

148 135
A Computational Fluid Dynamics Investigation of Solar Air Heater Duct Provided with Inclined Circular Ribs as Artificial Roughness
 Bonfring International Journal of Industrial Engineering and Management Science, Vol. 4, No. 3, August 2014 115 A Computational Fluid Dynamics Investigation of Solar Air Heater Duct Provided with Inclined
International Journal of Scientific & Engineering Research, Volume 6, Issue 5, May ISSN
 International Journal of Scientific & Engineering Research, Volume 6, Issue 5, May-2015 28 CFD BASED HEAT TRANSFER ANALYSIS OF SOLAR AIR HEATER DUCT PROVIDED WITH ARTIFICIAL ROUGHNESS Vivek Rao, Dr. Ajay
Design of Test Section for Coriolis Rig and Numerical Simulation of Cooling Flow Through Test Section
 University Turbine Systems Research (UTSR) Industrial Fellowship Program 2012 Design of Test Section for Coriolis Rig and Numerical Simulation of Cooling Flow Through Test Section Prepared For: Solar Turbines,
NUMERICAL SIMULATION OF FLOW AND HEAT TRANSFER IN INTERNAL MULTI-PASS COOLING CHANNEL WITHIN GAS TURBINE BLADE. A Thesis HUNG-CHIEH CHU
 NUMERICAL SIMULATION OF FLOW AND HEAT TRANSFER IN INTERNAL MULTI-PASS COOLING CHANNEL WITHIN GAS TURBINE BLADE A Thesis by HUNG-CHIEH CHU Submitted to the Office of Graduate Studies of Texas A&M University
Conjugate Heat Transfer Simulation of Internally Cooled Gas Turbine Vane
 Conjugate Heat Transfer Simulation of Internally Cooled Gas Turbine Vane V. Esfahanian 1, A. Shahbazi 1 and G. Ahmadi 2 1 Department of Mechanical Engineering, University of Tehran, Tehran, Iran 2 Department
TABLE OF CONTENTS CHAPTER TITLE PAGE
 v TABLE OF CONTENTS CHAPTER TITLE PAGE TABLE OF CONTENTS LIST OF TABLES LIST OF FIGURES LIST OF SYMBOLS LIST OF APPENDICES v viii ix xii xiv CHAPTER 1 INTRODUCTION 1.1 Introduction 1 1.2 Literature Review
NUMERICAL SIMULATION OF FLOW THROUGH TURBINE BLADE INTERNAL COOLING CHANNEL USING COMSOL MULTIPHYSICS
 International Journal of Emerging Technology and Innovative Engineering Volume 1, Issue 12, December 2015 (ISSN: 2394 6598) NUMERICAL SIMULATION OF FLOW THROUGH TURBINE BLADE INTERNAL COOLING CHANNEL USING
COMPUTATIONAL FLUID DYNAMICS ANALYSIS OF A V-RIB WITH GAP ROUGHENED SOLAR AIR HEATER
 THERMAL SCIENCE: Year 2018, Vol. 22, No. 2, pp. 963-972 963 COMPUTATIONAL FLUID DYNAMICS ANALYSIS OF A V-RIB WITH GAP ROUGHENED SOLAR AIR HEATER by Jitesh RANA, Anshuman SILORI, Rajesh MAITHANI *, and
NUMERICAL SIMULATION OF FLOW AND HEAT TRANSFER OF INTERNAL COOLING PASSAGE IN GAS TURBINE BLADE. A Dissertation GUOGUANG SU
 NUMERICAL SIMULATION OF FLOW AND HEAT TRANSFER OF INTERNAL COOLING PASSAGE IN GAS TURBINE BLADE A Dissertation by GUOGUANG SU Submitted to the Office of Graduate Studies of Texas A&M University in partial
Computational Fluid Dynamics Based Analysis of Angled Rib Roughened Solar Air Heater Duct
 Research Article International Journal of Thermal Technologies ISSN 2277-4114 2013 INPRESSCO. All Rights Reserved. Available at http://inpressco.com/category/ijtt Computational Fluid Dynamics Based Analysis
EFFECT OF RIB TURBULATORS ON HEAT TRANSFER PERFORMANCE IN STATIONARY RIBBED CHANNELS ARAVIND ROHAN SAMPATH. Bachelor of Production Engineering
 EFFECT OF RIB TURBULATORS ON HEAT TRANSFER PERFORMANCE IN STATIONARY RIBBED CHANNELS ARAVIND ROHAN SAMPATH Bachelor of Production Engineering Anna University May, 2007 Submitted in partial fulfillment
Numerical analysis of fluid flow and heat transfer in 2D sinusoidal wavy channel
 Numerical analysis of fluid flow and heat transfer in 2D sinusoidal wavy channel Arunanshu Chakravarty 1* 1 CTU in Prague, Faculty of Mechanical Engineering, Department of Process Engineering,Technická
ABSTRACT. Higher turbine inlet temperatures are desirable for higher efficiency of gas turbine engines.
 ABSTRACT SARJA, AJAY. Numerical Investigation of Multi Pass Serpentine Internal Cooling Designs to Negate Coriolis Force Effect on Heat Transfer. (Under the direction of Dr. Srinath V. Ekkad). Higher turbine
Numerical Methods in Aerodynamics. Turbulence Modeling. Lecture 5: Turbulence modeling
 Turbulence Modeling Niels N. Sørensen Professor MSO, Ph.D. Department of Civil Engineering, Alborg University & Wind Energy Department, Risø National Laboratory Technical University of Denmark 1 Outline
Flow analysis in centrifugal compressor vaneless diffusers
 348 Journal of Scientific & Industrial Research J SCI IND RES VOL 67 MAY 2008 Vol. 67, May 2008, pp. 348-354 Flow analysis in centrifugal compressor vaneless diffusers Ozturk Tatar, Adnan Ozturk and Ali
Manhar Dhanak Florida Atlantic University Graduate Student: Zaqie Reza
 REPRESENTING PRESENCE OF SUBSURFACE CURRENT TURBINES IN OCEAN MODELS Manhar Dhanak Florida Atlantic University Graduate Student: Zaqie Reza 1 Momentum Equations 2 Effect of inclusion of Coriolis force
Abstract 1. INTRODUCTION
 Numerical Investigation of Heat Transfer in Square Duct with 45 Rib-Grooved Turbulators Ananda Theertha K. R. 1, Narahari H. K. 2, Rajan N. K. S. 3 1-M. Sc. [Engg.] Student, 2-Head of Department, Automotive
CFD Analysis for Thermal Behavior of Turbulent Channel Flow of Different Geometry of Bottom Plate
 International Journal Of Engineering Research And Development e-issn: 2278-067X, p-issn: 2278-800X, www.ijerd.com Volume 13, Issue 9 (September 2017), PP.12-19 CFD Analysis for Thermal Behavior of Turbulent
ASPECT RATIO EFFECT ON HEAT TRANSFER IN ROTATING TWO-PASS RECTANGULAR CHANNELS WITH SMOOTH WALLS AND RIBBED WALLS. A Dissertation WEN-LUNG FU
 ASPECT RATIO EFFECT ON HEAT TRANSFER IN ROTATING TWO-PASS RECTANGULAR CHANNELS WITH SMOOTH WALLS AND RIBBED WALLS A Dissertation by WEN-LUNG FU Submitted to the Office of Graduate Studies of Texas A&M
Turbulent Boundary Layers & Turbulence Models. Lecture 09
 Turbulent Boundary Layers & Turbulence Models Lecture 09 The turbulent boundary layer In turbulent flow, the boundary layer is defined as the thin region on the surface of a body in which viscous effects
Application of COMSOL Multiphysics in Transport Phenomena Educational Processes
 Application of COMSOL Multiphysics in Transport Phenomena Educational Processes M. Vasilev, P. Sharma and P. L. Mills * Department of Chemical and Natural Gas Engineering, Texas A&M University-Kingsville,
EVALUATION OF FOUR TURBULENCE MODELS IN THE INTERACTION OF MULTI BURNERS SWIRLING FLOWS
 EVALUATION OF FOUR TURBULENCE MODELS IN THE INTERACTION OF MULTI BURNERS SWIRLING FLOWS A Aroussi, S Kucukgokoglan, S.J.Pickering, M.Menacer School of Mechanical, Materials, Manufacturing Engineering and
CFD STUDIES IN THE PREDICTION OF THERMAL STRIPING IN AN LMFBR
 CFD STUDIES IN THE PREDICTION OF THERMAL STRIPING IN AN LMFBR K. Velusamy, K. Natesan, P. Selvaraj, P. Chellapandi, S. C. Chetal, T. Sundararajan* and S. Suyambazhahan* Nuclear Engineering Group Indira
Flow characteristics of curved ducts
 Applied and Computational Mechanics 1 (007) 55-64 Flow characteristics of curved ducts P. Rudolf a *, M. Desová a a Faculty of Mechanical Engineering, Brno University of Technology,Technická,616 69 Brno,
CONJUGATE HEAT TRANSFER MODEL OF A FILM COOLED FLAT PLATE
 CONJUGATE HEAT TRANSFER MODEL OF A FILM COOLED FLAT PLATE Undergraduate Honors Thesis Presented in Partial Fulfillment of the Requirements for Graduation with Honors Research Distinction in the Department
CHAPTER 7 NUMERICAL MODELLING OF A SPIRAL HEAT EXCHANGER USING CFD TECHNIQUE
 CHAPTER 7 NUMERICAL MODELLING OF A SPIRAL HEAT EXCHANGER USING CFD TECHNIQUE In this chapter, the governing equations for the proposed numerical model with discretisation methods are presented. Spiral
INTERNATIONAL JOURNAL OF SCIENTIFIC & TECHNOLOGY RESEARCH VOLUME 5, ISSUE 09, SEPTEMBER 2016 ISSN
 Numerical Analysis Of Heat Transfer And Fluid Flow Characteristics In Different V-Shaped Roughness Elements On The Absorber Plate Of Solar Air Heater Duct Jitesh Rana, Anshuman Silori, Rohan Ramola Abstract:
Table of Contents. Foreword... xiii. Preface... xv
 Table of Contents Foreword.... xiii Preface... xv Chapter 1. Fundamental Equations, Dimensionless Numbers... 1 1.1. Fundamental equations... 1 1.1.1. Local equations... 1 1.1.2. Integral conservation equations...
A Numerical Study of Convective Heat Transfer in the Compression Chambers of Scroll Compressors
 Purdue University Purdue e-pubs International Compressor Engineering Conference School of Mechanical Engineering 2012 A Numerical Study of Convective Heat Transfer in the Compression Chambers of Scroll
Chapter 3 NATURAL CONVECTION
 Fundamentals of Thermal-Fluid Sciences, 3rd Edition Yunus A. Cengel, Robert H. Turner, John M. Cimbala McGraw-Hill, 2008 Chapter 3 NATURAL CONVECTION Mehmet Kanoglu Copyright The McGraw-Hill Companies,
DEVELOPMENT OF CFD MODEL FOR A SWIRL STABILIZED SPRAY COMBUSTOR
 DRAFT Proceedings of ASME IMECE: International Mechanical Engineering Conference & Exposition Chicago, Illinois Nov. 5-10, 2006 IMECE2006-14867 DEVELOPMENT OF CFD MODEL FOR A SWIRL STABILIZED SPRAY COMBUSTOR
Lecture 30 Review of Fluid Flow and Heat Transfer
 Objectives In this lecture you will learn the following We shall summarise the principles used in fluid mechanics and heat transfer. It is assumed that the student has already been exposed to courses in
NUMERICAL HEAT TRANSFER ENHANCEMENT IN SQUARE DUCT WITH INTERNAL RIB
 NUMERICAL HEAT TRANSFER ENHANCEMENT IN SQUARE DUCT WITH INTERNAL RIB University of Technology Department Mechanical engineering Baghdad, Iraq ABSTRACT - This paper presents numerical investigation of heat
COMPUTATIONAL SIMULATION OF THE FLOW PAST AN AIRFOIL FOR AN UNMANNED AERIAL VEHICLE
 COMPUTATIONAL SIMULATION OF THE FLOW PAST AN AIRFOIL FOR AN UNMANNED AERIAL VEHICLE L. Velázquez-Araque 1 and J. Nožička 2 1 Division of Thermal fluids, Department of Mechanical Engineering, National University
CFD study for cross flow heat exchanger with integral finned tube
 International Journal of Scientific and Research Publications, Volume 6, Issue 6, June 2016 668 CFD study for cross flow heat exchanger with integral finned tube Zena K. Kadhim *, Muna S. Kassim **, Adel
INTERNATIONAL JOURNAL OF APPLIED ENGINEERING RESEARCH, DINDIGUL Volume 2, No 1, 2011
 Experimental and Numerical comparison between the performance of Helical cone coils and ordinary helical coils used as dehumidifier for humidification dehumidification in desalination units Abo Elazm M.M.
COMPUTATIONAL FLOW ANALYSIS THROUGH A DOUBLE-SUCTION IMPELLER OF A CENTRIFUGAL PUMP
 Proceedings of the Fortieth National Conference on Fluid Mechanics and Fluid Power December 12-14, 2013, NIT Hamirpur, Himachal Pradesh, India FMFP2013_141 COMPUTATIONAL FLOW ANALYSIS THROUGH A DOUBLE-SUCTION
Contents. 1 Introduction to Gas-Turbine Engines Overview of Turbomachinery Nomenclature...9
 Preface page xv 1 Introduction to Gas-Turbine Engines...1 Definition 1 Advantages of Gas-Turbine Engines 1 Applications of Gas-Turbine Engines 3 The Gas Generator 3 Air Intake and Inlet Flow Passage 3
A CFD Analysis Of A Solar Air Heater Having Triangular Rib Roughness On The Absorber Plate
 International Journal of ChemTech Research CODEN( USA): IJCRGG ISSN : 0974-4290 Vol.5, No.2, pp 964-971, April-June 2013 ICGSEE-2013[14th 16th March 2013] International Conference on Global Scenario in
Development of a Parallel, 3D, Lattice Boltzmann Method CFD Solver for Simulation of Turbulent Reactor Flow
 DOE-FIU SCIENCE & TECHNOLOGY WORKFORCE DEVELOPMENT PROGRAM STUDENT SUMMER INTERNSHIP TECHNICAL REPORT June 4, 2012 to August 10, 2012 Development of a Parallel, 3D, Lattice Boltzmann Method CFD Solver
Performance characteristics of turbo blower in a refuse collecting system according to operation conditions
 Journal of Mechanical Science and Technology 22 (2008) 1896~1901 Journal of Mechanical Science and Technology www.springerlink.com/content/1738-494x DOI 10.1007/s12206-008-0729-6 Performance characteristics
Ray M. Stringfield Robert J. Kares J. R. Thomas, Jr.
 U4JR-96-1107 * v TITLE: AU THOR(S): SUBMITTED TO: TEMPERATURE DISTRIBUTION IN A FLOWING FLUID HEATED IN A MICROWAVE RESONANT CAVI'W Eric M. Nelson Ray M. Stringfield Robert J. Kares J. R. Thomas, Jr. AOT-9
Laminar flow heat transfer studies in a twisted square duct for constant wall heat flux boundary condition
 Sādhanā Vol. 40, Part 2, April 2015, pp. 467 485. c Indian Academy of Sciences Laminar flow heat transfer studies in a twisted square duct for constant wall heat flux boundary condition RAMBIR BHADOURIYA,
Meysam ATASHAFROOZ, Seyyed Abdolreza GANDJALIKHAN NASSAB, and Amir Babak ANSARI
 THERMAL SCIENCE: Year 014, Vol. 18, No., pp. 479-49 479 NUMERICAL INVESTIGATION OF ENTROPY GENERATION IN LAMINAR FORCED CONVECTION FLOW OVER INCLINED BACKWARD AND FORWARD FACING STEPS IN A DUCT UNDER BLEEDING
CFD Analysis of Forced Convection Flow and Heat Transfer in Semi-Circular Cross-Sectioned Micro-Channel
 CFD Analysis of Forced Convection Flow and Heat Transfer in Semi-Circular Cross-Sectioned Micro-Channel *1 Hüseyin Kaya, 2 Kamil Arslan 1 Bartın University, Mechanical Engineering Department, Bartın, Turkey
Comparison Of Square-hole And Round-hole Film Cooling: A Computational Study
 University of Central Florida Electronic Theses and Dissertations Masters Thesis (Open Access) Comparison Of Square-hole And Round-hole Film Cooling: A Computational Study 2004 Michael Glenn Durham University
Turbulent Scaling in Fluids. Robert Ecke, MST-10 Ning Li, MST-10 Shi-Yi Li, T-13 Yuanming Liu, MST-10
 Title: Author(s): Submitted to: Turbulent Scaling in Fluids Robert Ecke, MST-10 Ning Li, MST-10 Shi-Yi Li, T-13 Yuanming Liu, MST-10 RECEIVED OCT 3 I 1998 DOE Office of Scientific and Technical Information
THE EFFECT OF SAMPLE SIZE, TURBULENCE INTENSITY AND THE VELOCITY FIELD ON THE EXPERIMENTAL ACCURACY OF ENSEMBLE AVERAGED PIV MEASUREMENTS
 4th International Symposium on Particle Image Velocimetry Göttingen, Germany, September 7-9, 00 PIV 0 Paper 096 THE EFFECT OF SAMPLE SIZE, TURBULECE ITESITY AD THE VELOCITY FIELD O THE EXPERIMETAL ACCURACY
Numerical Prediction Of Torque On Guide Vanes In A Reversible Pump-Turbine
 Journal of Multidisciplinary Engineering Science and Technology (JMEST) ISSN: 3159 Vol. 2 Issue 6, June - 215 Numerical Prediction Of Torque On Guide Vanes In A Reversible Pump-Turbine Turbine and pump
Thermo-Hydraulic Performance of a Roughened Square Duct Having Inclined Ribs with a Gap on Two Opposite Walls
 International Journal of Engineering Research and Development e-issn: 2278-067X, p-issn: 2278-800X, www.ijerd.com Volume 7, Issue 10 (July 2013), PP. 55-63 Thermo-Hydraulic Performance of a Roughened Square
Heat Transfer Enhancement in Turbines using Dimples- A CFD Study Nitish Kumar Jain 1 Dr.U.S. Mallikarjun 2
 IJSRD - International Journal for Scientific Research & Development Vol. 3, Issue 05, 2015 ISSN (online): 2321-0613 Heat Transfer Enhancement in Turbines using Dimples- A CFD Study Nitish Kumar Jain 1
Large-eddy simulations for wind turbine blade: rotational augmentation and dynamic stall
 Large-eddy simulations for wind turbine blade: rotational augmentation and dynamic stall Y. Kim, I.P. Castro, and Z.T. Xie Introduction Wind turbines operate in the atmospheric boundary layer and their
FLOW AND HEAT TRANSFER ANALYSIS OF VARIOUS RIBS FOR FORCED CONVECTION HEAT TRANSFER
 FLOW AND HEAT TRANSFER ANALYSIS OF VARIOUS RIBS FOR FORCED CONVECTION HEAT TRANSFER 1 Navanath.G.Ghodake, 2 Prof.MRC. Rao, 3 Dr. R. R. Arakerimath 1 ME heat power student, 2 professor, 3 Professor & Dean
Determine the Inside Wall Temperature of DSTs using an Infrared Temperature Sensor
 SUMMARY DOCUMENT Determine the Inside Wall Temperature of DSTs using an Infrared Temperature Sensor Date submitted: July 29, 2016 Prepared by: Aparna Aravelli, Ph.D. Florida International University Collaborators:
Numerical and Experimental Study on the Effect of Guide Vane Insertion on the Flow Characteristics in a 90º Rectangular Elbow
 Numerical and Experimental Study on the Effect of Guide Vane Insertion on the Flow Characteristics in a 90º Rectangular Elbow Sutardi 1, Wawan A. W., Nadia, N. and Puspita, K. 1 Mechanical Engineering
PERFORMANCE SCREENING OF A LOUVERED FIN AND VORTEX GENERATOR COMBINATION
 HEFAT2014 10 th International Conference on Heat Transfer, Fluid Mechanics and Thermodynamics 14 26 July 2014 Orlando, Florida PERFORMANCE SCREENING OF A LOUVERED FIN AND VORTEX GENERATOR COMBINATION Bernd
CHAPTER 4 OPTIMIZATION OF COEFFICIENT OF LIFT, DRAG AND POWER - AN ITERATIVE APPROACH
 82 CHAPTER 4 OPTIMIZATION OF COEFFICIENT OF LIFT, DRAG AND POWER - AN ITERATIVE APPROACH The coefficient of lift, drag and power for wind turbine rotor is optimized using an iterative approach. The coefficient
Effects of the Leakage Flow Tangential Velocity in Shrouded Axial Compressor Cascades *
 TSINGHUA SCIENCE AND TECHNOLOGY ISSNll1007-0214ll21/21llpp105-110 Volume 14, Number S2, December 2009 Effects of the Leakage Flow Tangential Velocity in Shrouded Axial Compressor Cascades * KIM Jinwook
STP-TS THERMOPHYSICAL PROPERTIES OF WORKING GASES USED IN WORKING GAS TURBINE APPLICATIONS
 THERMOPHYSICAL PROPERTIES OF WORKING GASES USED IN WORKING GAS TURBINE APPLICATIONS THERMOPHYSICAL PROPERTIES OF WORKING GASES USED IN GAS TURBINE APPLICATIONS Prepared by: ASME Standards Technology, LLC
HEAT TRANSFER IN A RECIRCULATION ZONE AT STEADY-STATE AND OSCILLATING CONDITIONS - THE BACK FACING STEP TEST CASE
 HEAT TRANSFER IN A RECIRCULATION ZONE AT STEADY-STATE AND OSCILLATING CONDITIONS - THE BACK FACING STEP TEST CASE A.K. Pozarlik 1, D. Panara, J.B.W. Kok 1, T.H. van der Meer 1 1 Laboratory of Thermal Engineering,
Study of the Losses in Fluid Machinery with the Help of Entropy
 Study of the Losses in Fluid Machinery with the Help of Entropy Martin Böhle 1, Annika Fleder 1, Matthias Mohr 1 * SYMPOSIA ON ROTATING MACHINERY ISROMAC 16 International Symposium on Transport Phenomena
Numerical investigation of swirl flow inside a supersonic nozzle
 Advances in Fluid Mechanics IX 131 Numerical investigation of swirl flow inside a supersonic nozzle E. Eslamian, H. Shirvani & A. Shirvani Faculty of Science and Technology, Anglia Ruskin University, UK
UNIT II CONVECTION HEAT TRANSFER
 UNIT II CONVECTION HEAT TRANSFER Convection is the mode of heat transfer between a surface and a fluid moving over it. The energy transfer in convection is predominately due to the bulk motion of the fluid
Heat and Mass Transfer Prof. S.P. Sukhatme Department of Mechanical Engineering Indian Institute of Technology, Bombay
 Heat and Mass Transfer Prof. S.P. Sukhatme Department of Mechanical Engineering Indian Institute of Technology, Bombay Lecture No. 18 Forced Convection-1 Welcome. We now begin our study of forced convection
Augmented Heat Transfer in Square ducts with Transverse and Inclined Ribs with and without a gap
 Research Article International Journal of Current Engineering and Technology ISSN 2277-4106 2013 INPRESSCO. All Rights Reserved. Available at http://inpressco.com/category/ijcet Augmented Heat Transfer
Due Tuesday, November 23 nd, 12:00 midnight
 Due Tuesday, November 23 nd, 12:00 midnight This challenging but very rewarding homework is considering the finite element analysis of advection-diffusion and incompressible fluid flow problems. Problem
CFD STUDY OF MASS TRANSFER IN SPACER FILLED MEMBRANE MODULE
 GANIT J. Bangladesh Math. Soc. (ISSN 1606-3694) 31 (2011) 33-41 CFD STUDY OF MASS TRANSFER IN SPACER FILLED MEMBRANE MODULE Sharmina Hussain Department of Mathematics and Natural Science BRAC University,
CONVECTIVE HEAT TRANSFER
 CONVECTIVE HEAT TRANSFER Mohammad Goharkhah Department of Mechanical Engineering, Sahand Unversity of Technology, Tabriz, Iran CHAPTER 4 HEAT TRANSFER IN CHANNEL FLOW BASIC CONCEPTS BASIC CONCEPTS Laminar
Explicit algebraic Reynolds stress models for internal flows
 5. Double Circular Arc (DCA) cascade blade flow, problem statement The second test case deals with a DCA compressor cascade, which is considered a severe challenge for the CFD codes, due to the presence
Numerical Investigation of Multijet Air Impingement on Pin Fin Heat Sink with Effusion Slots
 , 23-25 October, 2013, San Francisco, USA Numerical Investigation of Multijet Air Impingement on Pin Fin Heat Sink with Effusion Slots N. K. Chougule G. V. Parishwad A. R. Nadgire Abstract The work reported
Managing Thermal Gradients on a Supercritical Carbon Dioxide Radial Inflow Turbine. David W. Stevens
 Managing Thermal Gradients on a Supercritical Carbon Dioxide Radial Inflow Turbine David W. Stevens dstevens@, Turbine Cooling Historically, a consistent engineering challenge Machine durability Traditional
Effect of roughness shape on heat transfer and flow friction characteristics of solar air heater with roughened absorber plate
 Advanced Computational Methods in Heat Transfer IX 43 Effect of roughness shape on heat transfer and flow friction characteristics of solar air heater with roughened absorber plate A. Chaube 1, P. K. Sahoo
STATOR/ROTOR INTERACTION
 TASK QUARTERLY 10 No 2, 113 124 CFD MODELLING OF TURBINE STAGE STATOR/ROTOR INTERACTION JERZY ŚWIRYDCZUK Institute of Fluid-Flow Machinery, Polish Academy of Sciences, Fiszera 14, 80-952 Gdansk, Poland
An alternative turbulent heat flux modelling for gas turbine cooling application
 TRANSACTIONS OF THE INSTITUTE OF FLUID-FLOW MACHINERY No. 3, 23, 2-?? MICHAŁ KARCZ and JANUSZ BADUR An alternative turbulent heat flux modelling for gas turbine cooling application Institute of Fluid-Flow
Slurry Pump Mixing Effectiveness in Tank 50H
 WSRC-STI-2008-00151 Si Young Lee and Richard A. Dimenna February 2008 Washington Savannah River Company Savannah River National Laboratory Aiken, SC 29808 Prepared for the U.S. Department of Energy Under
ENERGY PERFORMANCE IMPROVEMENT, FLOW BEHAVIOR AND HEAT TRANSFER INVESTIGATION IN A CIRCULAR TUBE WITH V-DOWNSTREAM DISCRETE BAFFLES
 Journal of Mathematics and Statistics 9 (4): 339-348, 2013 ISSN: 1549-3644 2013 doi:10.3844/jmssp.2013.339.348 Published Online 9 (4) 2013 (http://www.thescipub.com/jmss.toc) ENERGY PERFORMANCE IMPROVEMENT,
IJSRD - International Journal for Scientific Research & Development Vol. 3, Issue 06, 2015 ISSN (online):
:") IJSRD - International Journal for Scientific Research & Development Vol. 3, Issue 06, 2015 ISSN (online): 2321-0613 Experimental Investigation for Enhancement of Heat Transfer in Two Pass Solar Air Heater
IJSRD - International Journal for Scientific Research & Development Vol. 3, Issue 06, 2015 ISSN (online): 2321-0613 Experimental Investigation for Enhancement of Heat Transfer in Two Pass Solar Air Heater
Numerical Heat Transfer Study of Turbulent Square Duct Flow through W-Type Turbulators
 search Article International Journal of Thermal Technologies E-ISSN 2277 4114 214 INPRESSCO, All Rights served Available at http://inpressco.com/category/ijtt/ merical Heat Transfer Study of Turbulent
GA A22689 SLOW LINER FUSION
 GA A22689 SLOW LINER FUSION by AUGUST 1997 DISCLAIMER This report was prepared as an account of work sponsored by an agency of the United States Government. Neither the United States Government nor any
Predictionof discharge coefficient of Venturimeter at low Reynolds numbers by analytical and CFD Method
 International Journal of Engineering and Technical Research (IJETR) ISSN: 2321-0869, Volume-3, Issue-5, May 2015 Predictionof discharge coefficient of Venturimeter at low Reynolds numbers by analytical
TURBULENCE AND PRESSURE DROP BEHAVIORS AROUND SEMICIRCULAR RIBS IN A RECTANGULAR CHANNEL
 THERMAL SCIENCE: Year 2014, Vol. 18, No. 2, pp. 419-430 419 TURBULENCE AND PRESSURE DROP BEHAVIORS AROUND SEMICIRCULAR RIBS IN A RECTANGULAR CHANNEL by Md. Julker NINE a, Gyeong Hwan LEE a, HanShik CHUNG
EFFECT OF FORCED ROTATING VANELESS DIFFUSERS ON CENTRIFUGAL COMPRESSOR STAGE PERFORMANCE
 Journal of Engineering Science and Technology Vol. 6, No. 5 (2011) 558-574 School of Engineering, Taylor s University EFFECT OF FORCED ROTATING VANELESS DIFFUSERS ON CENTRIFUGAL COMPRESSOR STAGE PERFORMANCE
Numerical Study of the Three-dimensional Flow in a Flat Plate Solar Collector with Baffles
 Numerical Study of the Three-dimensional Flow in a Flat Plate Solar Collector with Baffles M.A. AMRAOUI a, K. ALIANE b a. Department of Mechanical Engineering, Faculty of Technology, University of Tlemcen,
Numerical Simulation of the Evolution of Reynolds Number on Laminar Flow in a Rotating Pipe
 American Journal of Fluid Dynamics 2014, 4(3): 79-90 DOI: 10.5923/j.ajfd.20140403.01 Numerical Simulation of the Evolution of Reynolds Number on Laminar Flow in a Rotating Pipe A. O. Ojo, K. M. Odunfa,
Conjugate Heat Transfer Analysis of an Internally Cooled Gas Turbine Vane
 Conjugate Heat Transfer Analysis of an Internally Cooled Gas Turbine Vane Kim, S. I., Lebel, L., Sreekanth, S., & Ozem, H. (2013). Conjugate Heat Transfer Analysis of an Internally Cooled Gas Turbine Vane.
Experimental Investigation of Internal Channel Cooling Via Jet Impingement
 Copyright 2013 Tech Science Press FDMP, vol.9, no.1, pp.77-89, 2013 Experimental Investigation of Internal Channel Cooling Via Jet Impingement Emad Elnajjar 1, Mohammad O. Hamdan, Yousef Haik Abstract:
Experimental Verification of CFD Modeling of Turbulent Flow over Circular Cavities using FLUENT
 Experimental Verification of CFD Modeling of Turbulent Flow over Circular Cavities using FLUENT T Hering, J Dybenko, E Savory Mech. & Material Engineering Dept., University of Western Ontario, London,
Comparison of two equations closure turbulence models for the prediction of heat and mass transfer in a mechanically ventilated enclosure
 Proceedings of 4 th ICCHMT May 17-0, 005, Paris-Cachan, FRANCE 381 Comparison of two equations closure turbulence models for the prediction of heat and mass transfer in a mechanically ventilated enclosure
Analysis of Temperature Distribution Using Conjugate Heat Transfer in a HPT Stage via CFD
 1 ISABE-2015-20186 Analysis of Temperature Distribution Using Conjugate Heat Transfer in a HPT Stage via CFD Lucilene Moraes da Silva Jesuino Takachi Tomita Cleverson Bringhenti Turbomachines Department
Forced Convection: Inside Pipe HANNA ILYANI ZULHAIMI
 + Forced Convection: Inside Pipe HANNA ILYANI ZULHAIMI + OUTLINE u Introduction and Dimensionless Numbers u Heat Transfer Coefficient for Laminar Flow inside a Pipe u Heat Transfer Coefficient for Turbulent
GA A THERMAL ION ORBIT LOSS AND RADIAL ELECTRIC FIELD IN DIII-D by J.S. degrassie, J.A. BOEDO, B.A. GRIERSON, and R.J.
 GA A27822 THERMAL ION ORBIT LOSS AND RADIAL ELECTRIC FIELD IN DIII-D by J.S. degrassie, J.A. BOEDO, B.A. GRIERSON, and R.J. GROEBNER JUNE 2014 DISCLAIMER This report was prepared as an account of work
On the transient modelling of impinging jets heat transfer. A practical approach
 Turbulence, Heat and Mass Transfer 7 2012 Begell House, Inc. On the transient modelling of impinging jets heat transfer. A practical approach M. Bovo 1,2 and L. Davidson 1 1 Dept. of Applied Mechanics,
Comparative study of Different Geometry of Ribs for roughness on absorber plate of Solar Air Heater -A Review
 Comparative study of Different Geometry of Ribs for roughness on absorber plate of Solar Air Heater -A Review Gulshan Singh Baghel 1, Dr. A R Jaurker 2 1. Student, M.E. (Heat Power engineering), Jabalpur
COMPUTATIONAL METHOD
 Multi Objective Design Optimization of Rocket Engine Turbopump Turbine Naoki Tani, Akira Oyama and Nobuhiro Yamanishi tani.naoki@jaxa.jp Japan Aerospace Exploration Agency JAXA is now planning to develop
3D Numerical Study on Laminar Forced Convection in V-Baffled Square Channel
 American Journal of Applied Sciences 10 (10): 1287-1297, 2013 ISSN: 1546-9239 2013 Boonloi and Jedsadaratanachai, This open access article is distributed under a Creative Commons Attribution (CC-BY) 3.0
DESIGN AND CFD ANALYSIS OF A CENTRIFUGAL PUMP
 DESIGN AND CFD ANALYSIS OF A CENTRIFUGAL PUMP 1 CH.YADAGIRI, 2 P.VIJAYANAND 1 Pg Scholar, Department of MECH, Holymary Institute of Technology, Ranga Reddy, Telangana, India. 2 Assistant Professor, Department
EXPERIMENTAL AND NUMERICAL STUDIES OF A SPIRAL PLATE HEAT EXCHANGER
 THERMAL SCIENCE: Year 2014, Vol. 18, No. 4, pp. 1355-1360 1355 EXPERIMENTAL AND NUMERICAL STUDIES OF A SPIRAL PLATE HEAT EXCHANGER by Rangasamy RAJAVEL Department of Mechanical Engineering, AMET University,
Keywords - Gas Turbine, Exhaust Diffuser, Annular Diffuser, CFD, Numerical Simulations.
 Numerical Investigations of PGT10 Gas Turbine Exhaust Diffuser Using Hexahedral Dominant Grid Vaddin Chetan, D V Satish, Dr. Prakash S Kulkarni Department of Mechanical Engineering, VVCE, Mysore, Department
International Journal of Advanced Engineering Technology E-ISSN
 Research Article EFFECT OF ROUGHNESS ELEMENT PITCH ON HEAT TRANSFER AND FRICTION CHARACTERISTICS OF ARTIFICIALLY ROUGHENED SOLAR AIR HEATER DUCT Aman Soi*, Ranjit Singh, Brij Bhushan Address for Correspondence