LECTURE 03: LINEAR REGRESSION PT. 1. September 18, 2017 SDS 293: Machine Learning
|
|
|
- Osborne Hoover
- 6 years ago
- Views:
Transcription
1 LECTURE 03: LINEAR REGRESSION PT. 1 September 18, 2017 SDS 293: Machine Learning

2 Announcements Need help with? Visit the Stats TAs! Sunday Thursday evenings 7 9 pm in Burton 301 (SDS293 alum available every night J )

3 Question: R or python?


4 Question: R or python? Supportive, statistically strong, but slow Optimized, operational, but sometimes opaque

5 And the winner is it depends.
6 Outline Motivation Running Example: Advertising Simple Linear Regression - Estimating coefficients - How good is this estimate? - How good is the model? Multiple Linear Regression - Estimating coefficients - Important questions Dealing with Qualitative Predictors Extending the Linear Model - Removing the additive assumption - Non-linear relationships Potential Problems


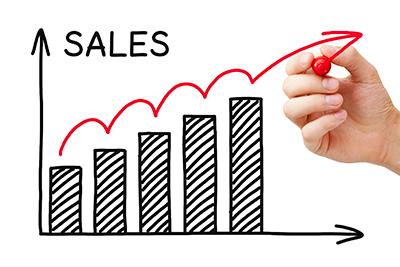
7 Motivation Why start a ML course with linear regression?


8 Running example: advertising
 20 15 10 5 Sales (in 1000s of units sold) 25 Last year s advertising budget 0 20 40 60 80 100 Budget (in $1,000s)")
9 Budget (in $1,000s) Budget (in $1,000s) Sales (in 1000s of units sold) Sales (in 1000s of units sold) Sales (in 1000s of units sold) 25 Last year s advertising budget Budget (in $1,000s)


10 Your task

11 Questions you might ask 1. Is there a relationship between budget and sales? 2. How strong is the relationship? 3. Which media contribute to sales? 4. How accurately can we estimate the effect? 5. How accurately can we predict future sales? 6. Is the relationship linear? 7. Is there synergy among the advertising media? Linear Regression
12 Simple linear regression Straightforward approach for predicting a quantitative response on the basis of a single predictor Assumption: there is a (roughly) linear relationship between X (the predictor) and Y (the response) intercept slope the response is approximately modeled as Y β $ + β & X a linear function of the predictor sales β $ + β & TV
13 Simple linear regression Reality: β $ and β & are unknown What we do know: x &, y &, x., y.,, x 0, y 0 Goal: find estimated coefficients β* $ and β* & such that y 1 β* $ + β* & x 1
14 Simple linear regression β $ β & pretty close minimizes RSS (other ways in Ch. 6)
15 Def. residuals and RSS Back to our hypothetical model: y2 1 = β* $ + β* & x 1 Def. residual: ε 1 = y 1 y2 1 (difference between observed and predicted responses) Def. residual sum of squares (RSS): RSS = ε &. + ε.. + +ε 0. RSS = y & β* $ + β* & x &. + + y 0 β* $ + β* & x 0.
16 Minimizing RSS: least squares Goal: β* $ and β* & that minimize RSS Dusting off our calculus (or looking it up), minimizers are: β* & =? :@A 9 :;9 = : ;=>? :@A 9 : ;9 B and β* $ = y> β* & x where x and y> are the mean values of the sample
17 Advertising example β* $ = β* & = We d expect to sell about 7,033 units without advertising Every additional $1, additional units sold


18 How good is this estimate? Assumption: Y β $ + β & X We estimated β* $ and β* & from the available data Consider this:
19 Standard error Idea: borrow the concept of standard error (SE): Var μ = SE μ. = σ. n σ is the standard deviation of the population n is the number of samples Note: the error gets smaller as the sample size increases
20 Standard error of β* &, β* $ Idea: use the standard deviation of ε for σ (why?) Start with the slope: And now the intercept:. σ SE β*. & = 0 x 1 x. 1S&. SE β* $ = σ. 1 x. n + 0 x 1 x. 1S& What happens as x spreads out? What happens when the mean of x is 0?
21 Just one problem Idea: use the standard deviation of ε for σ usually don t have this information What do we know about ε?
22 Residual standard error Idea: estimate standard deviation of ε using RSS to get residual standard error: RSE = UVV 0;. Now we can finally estimate SE, which can be used to compute confidence intervals In linear regression, the 95% confidence intervals are: β* $ ± 2 SE β* $ and β* & ± 2 SE β* &
23 Using SE for hypothesis testing Goal: determine if sales are related to advertising budget If there is NO relationship, what is the true value of β &? no relationship = no slope β & = 0 To test: compute the probability that we observed our (estimated) β & by chance, assuming a true value of 0 If this probability is small, we say a relationship exists

24 Advertising example β* $ = β* & =
25 How good is this model? RSE is (roughly) the amount the response will deviate from the true regression line RSE is an absolute measure, given in the same units as the response variable Question: how do you know what a good RSE is?
26 How good is this model? Alternate approach: measure the proportion of variance explained by the model R. is one such measure: R. = 1 RSS 0 y 1 y>. 1S& total variance in the response variance not explained after regression
27 TV and sales What does the RSE tell us? What does R. tell us?
28 Discussion Question: how could we handle multiple predictors?

29 Option 1: SLR for each predictor What problems do you see with this approach?
30 Option 2: extend the linear model Give each variable its own slope, e.g. sales β $ + β & TV + β. radio + β a newspaper + ε Each slope captures the average effect on Y of an increase in one predictor, holding all others constant Estimate coefficients using least squares (same as SLR!)


31 Advertising example What does this tell us? Do you notice anything unexpected?


32 What happened to newspaper ads? Let s look at the correlation between all the dimensions In SLR, newspaper spending was getting credit for radio spending s work!
33 Questions we ask in MLR Is at least one of the predictors useful in predicting the response? Do all the predictors help to explain the response, or is only a subset of the predictors useful? How well does the model fit the data? Given some predictor values, what response should we predict, and how accurate is our prediction?
34 Q1: is at least one predictor useful? SLR: test to see if the slope was 0 (no effect) MLR: test whether ALL of the slopes are 0 (no effect) To do this, we compute the F-statistic: F = TSS RSS p n p 1 RSS where p is the # of predictors and n is the sample size Value close to 1 à no effect Question: why look at the F-statistic and not just at the p- values for each predictor in turn? (hint: lots of predictors?)
35 Q2: do we need them all? Now we know that at least one predictor has an effect: which one(s) is it? Determining which predictors are associated with the response is referred to as variable selection Some classic approaches: - Exhaustive search - Forward selection - Backward selection - Mixed selection More detail in Ch. 6
36 Q3: How well does the model fit the data? Just like in SLR, we can use RSE and R. to measure how well our model fits the data Using the MLR model we created using all 3 predictors: Question: what would happen to the R. value if we remove newspaper from the model?
37 Q4: How confident are we? Now that we have a model, making a prediction is a piece of cake (just plug and chug!) Need to consider 3 kinds of uncertainty: 1. How far off are the coefficients? à confidence intervals 2. How far from linear is the true relationship? à ignore this for now 3. How much will any specific prediction vary from the true value, even if we had perfect coefficients? à prediction intervals

38 Quick activity: the Carseats data set
39 Quick activity: the Carseats data set Description: simulated data set on sales of car seats Format: 400 observations on the following 11 variables - Sales: unit sales at each location - CompPrice: price charged by nearest competitor at each location - Income: community income level - Advertising: local advertising budget for company at each location - Population: population size in region (in thousands) - Price: price charged for car seat at each site - ShelveLoc: quality of shelving location at site (Good Bad Medium) - Age: average age of the local population - Education: education level at each location - Urban: whether the store is in an urban or rural location - USA: whether the store is in the US or not
40 Quick activity: the Carseats data set 1. Find some friends (groups of 3-4 are ideal) 2. Hypothesize 5 possible relationships between variables in this dataset (e.g. Price predicts Sales) Question: could you test that hypothesis with the techniques you know right now?
41 Two-level qualitative predictors ({P1: enrolled }, {P2: enrolled }, {P3: auditing }, ) ({P1:1}, {P2:1}, {P3:0}, )

42 Two-level qualitative predictors y 1 = β $ + β & x 1 + ε 1 = d β $+β & + ε 1 if enrolled β $ +ε 1 if auditing
43 A note on dummy variables The decision to code enrolled students as 1 and auditing students as 0 is arbitrary It has no effect on model fit, or on the predicted values It does alter interpretation of the coefficients - If we swapped them, what would happen? - If we used (-1,1), what would happen?
44 Multi-level predictors Need dummy variables for all but one level For example: x 1& = i 1 if the ijk person is from Amherst 0 if the i jk person is not from Amherst x 1. = i 1 if the ijk person is from Mt. Holyoke 0 if the i jk person is not from Mt. Holyoke β $ + β & + ε 1 if i jk person is from Amherst y 1 = β $ + β & x 1& + β. x 1. + ε 1 = qβ $ + β. + ε 1 if i jk person is from Mt. Holyoke β $ + ε 1 if i jk person is from Smith baseline


45 Introduction to python Today s walkthrough was run using Jupyter: This allows me to build notebooks to combine step-bystep code and instructions/descriptions Want to learn more? Check out the Jupyter Notebook Tutorial: The Definitive Guide on DataCamp!
46 Coming up Next class: finish linear regression Assignment 1 comes out Wednesday - Due Wednesday Sept. 27 by 11:59pm
LECTURE 04: LINEAR REGRESSION PT. 2. September 20, 2017 SDS 293: Machine Learning
 LECTURE 04: LINEAR REGRESSION PT. 2 September 20, 2017 SDS 293: Machine Learning Announcements Stats TA hours start Monday (sorry for the confusion) Looking for some refreshers on mathematical concepts?
Machine Learning Linear Regression. Prof. Matteo Matteucci
 Machine Learning Linear Regression Prof. Matteo Matteucci Outline 2 o Simple Linear Regression Model Least Squares Fit Measures of Fit Inference in Regression o Multi Variate Regession Model Least Squares
Lecture 6: Linear Regression
 Lecture 6: Linear Regression Reading: Sections 3.1-3 STATS 202: Data mining and analysis Jonathan Taylor, 10/5 Slide credits: Sergio Bacallado 1 / 30 Simple linear regression Model: y i = β 0 + β 1 x i
Linear regression. Linear regression is a simple approach to supervised learning. It assumes that the dependence of Y on X 1,X 2,...X p is linear.
 Linear regression Linear regression is a simple approach to supervised learning. It assumes that the dependence of Y on X 1,X 2,...X p is linear. 1/48 Linear regression Linear regression is a simple approach
Lecture 6: Linear Regression (continued)
") Lecture 6: Linear Regression (continued) Reading: Sections 3.1-3.3 STATS 202: Data mining and analysis October 6, 2017 1 / 23 Multiple linear regression Y = β 0 + β 1 X 1 + + β p X p + ε Y ε N (0, σ) i.i.d.
Lecture 6: Linear Regression (continued) Reading: Sections 3.1-3.3 STATS 202: Data mining and analysis October 6, 2017 1 / 23 Multiple linear regression Y = β 0 + β 1 X 1 + + β p X p + ε Y ε N (0, σ) i.i.d.
Lecture 5: Clustering, Linear Regression
 Lecture 5: Clustering, Linear Regression Reading: Chapter 10, Sections 3.1-3.2 STATS 202: Data mining and analysis October 4, 2017 1 / 22 .0.0 5 5 1.0 7 5 X2 X2 7 1.5 1.0 0.5 3 1 2 Hierarchical clustering
Lecture 5: Clustering, Linear Regression
 Lecture 5: Clustering, Linear Regression Reading: Chapter 10, Sections 3.1-3.2 STATS 202: Data mining and analysis October 4, 2017 1 / 22 Hierarchical clustering Most algorithms for hierarchical clustering
Lecture 5: Clustering, Linear Regression
 Lecture 5: Clustering, Linear Regression Reading: Chapter 10, Sections 3.1-2 STATS 202: Data mining and analysis Sergio Bacallado September 19, 2018 1 / 23 Announcements Starting next week, Julia Fukuyama
Linear Regression In God we trust, all others bring data. William Edwards Deming
 Linear Regression ddebarr@uw.edu 2017-01-19 In God we trust, all others bring data. William Edwards Deming Course Outline 1. Introduction to Statistical Learning 2. Linear Regression 3. Classification
Statistical Methods for Data Mining
 Statistical Methods for Data Mining Kuangnan Fang Xiamen University Email: xmufkn@xmu.edu.cn Linear regression Linear regression is a simple approach to supervised learning. It assumes that the dependence
Data Analysis 1 LINEAR REGRESSION. Chapter 03
 Data Analysis 1 LINEAR REGRESSION Chapter 03 Data Analysis 2 Outline The Linear Regression Model Least Squares Fit Measures of Fit Inference in Regression Other Considerations in Regression Model Qualitative
Chapter 4. Regression Models. Learning Objectives
 Chapter 4 Regression Models To accompany Quantitative Analysis for Management, Eleventh Edition, by Render, Stair, and Hanna Power Point slides created by Brian Peterson Learning Objectives After completing
Business Statistics. Lecture 9: Simple Regression
 Business Statistics Lecture 9: Simple Regression 1 On to Model Building! Up to now, class was about descriptive and inferential statistics Numerical and graphical summaries of data Confidence intervals
BNAD 276 Lecture 10 Simple Linear Regression Model
 1 / 27 BNAD 276 Lecture 10 Simple Linear Regression Model Phuong Ho May 30, 2017 2 / 27 Outline 1 Introduction 2 3 / 27 Outline 1 Introduction 2 4 / 27 Simple Linear Regression Model Managerial decisions
Final Overview. Introduction to ML. Marek Petrik 4/25/2017
 Final Overview Introduction to ML Marek Petrik 4/25/2017 This Course: Introduction to Machine Learning Build a foundation for practice and research in ML Basic machine learning concepts: max likelihood,
Assumptions in Regression Modeling
 Fall Semester, 2001 Statistics 621 Lecture 2 Robert Stine 1 Assumptions in Regression Modeling Preliminaries Preparing for class Read the casebook prior to class Pace in class is too fast to absorb without
Midterm 2 - Solutions
 Ecn 102 - Analysis of Economic Data University of California - Davis February 24, 2010 Instructor: John Parman Midterm 2 - Solutions You have until 10:20am to complete this exam. Please remember to put
LECTURE 5. Introduction to Econometrics. Hypothesis testing
 LECTURE 5 Introduction to Econometrics Hypothesis testing October 18, 2016 1 / 26 ON TODAY S LECTURE We are going to discuss how hypotheses about coefficients can be tested in regression models We will
Regression Models. Chapter 4. Introduction. Introduction. Introduction
 Chapter 4 Regression Models Quantitative Analysis for Management, Tenth Edition, by Render, Stair, and Hanna 008 Prentice-Hall, Inc. Introduction Regression analysis is a very valuable tool for a manager
Section 3: Simple Linear Regression
 Section 3: Simple Linear Regression Carlos M. Carvalho The University of Texas at Austin McCombs School of Business http://faculty.mccombs.utexas.edu/carlos.carvalho/teaching/ 1 Regression: General Introduction
appstats27.notebook April 06, 2017
 Chapter 27 Objective Students will conduct inference on regression and analyze data to write a conclusion. Inferences for Regression An Example: Body Fat and Waist Size pg 634 Our chapter example revolves
Multiple (non) linear regression. Department of Computer Science, Czech Technical University in Prague
 linear regression. Department of Computer Science, Czech Technical University in Prague") Multiple (non) linear regression Jiří Kléma Department of Computer Science, Czech Technical University in Prague Lecture based on ISLR book and its accompanying slides http://cw.felk.cvut.cz/wiki/courses/b4m36san/start
Multiple (non) linear regression Jiří Kléma Department of Computer Science, Czech Technical University in Prague Lecture based on ISLR book and its accompanying slides http://cw.felk.cvut.cz/wiki/courses/b4m36san/start
Chapter 3 Multiple Regression Complete Example
 Department of Quantitative Methods & Information Systems ECON 504 Chapter 3 Multiple Regression Complete Example Spring 2013 Dr. Mohammad Zainal Review Goals After completing this lecture, you should be
Chapter 16. Simple Linear Regression and Correlation
 Chapter 16 Simple Linear Regression and Correlation 16.1 Regression Analysis Our problem objective is to analyze the relationship between interval variables; regression analysis is the first tool we will
Chapter 4: Regression Models
 Sales volume of company 1 Textbook: pp. 129-164 Chapter 4: Regression Models Money spent on advertising 2 Learning Objectives After completing this chapter, students will be able to: Identify variables,
Chapter 14 Student Lecture Notes 14-1
 Chapter 14 Student Lecture Notes 14-1 Business Statistics: A Decision-Making Approach 6 th Edition Chapter 14 Multiple Regression Analysis and Model Building Chap 14-1 Chapter Goals After completing this
Introduction to Regression
 Regression Introduction to Regression If two variables covary, we should be able to predict the value of one variable from another. Correlation only tells us how much two variables covary. In regression,
Announcements. Lecture 10: Relationship between Measurement Variables. Poverty vs. HS graduate rate. Response vs. explanatory
 Announcements Announcements Lecture : Relationship between Measurement Variables Statistics Colin Rundel February, 20 In class Quiz #2 at the end of class Midterm #1 on Friday, in class review Wednesday
LECTURE 10: LINEAR MODEL SELECTION PT. 1. October 16, 2017 SDS 293: Machine Learning
 LECTURE 10: LINEAR MODEL SELECTION PT. 1 October 16, 2017 SDS 293: Machine Learning Outline Model selection: alternatives to least-squares Subset selection - Best subset - Stepwise selection (forward and
Ch 13 & 14 - Regression Analysis
 Ch 3 & 4 - Regression Analysis Simple Regression Model I. Multiple Choice:. A simple regression is a regression model that contains a. only one independent variable b. only one dependent variable c. more
Chapter 27 Summary Inferences for Regression
 Chapter 7 Summary Inferences for Regression What have we learned? We have now applied inference to regression models. Like in all inference situations, there are conditions that we must check. We can test
Basic Business Statistics 6 th Edition
 Basic Business Statistics 6 th Edition Chapter 12 Simple Linear Regression Learning Objectives In this chapter, you learn: How to use regression analysis to predict the value of a dependent variable based
Keller: Stats for Mgmt & Econ, 7th Ed July 17, 2006
 Chapter 17 Simple Linear Regression and Correlation 17.1 Regression Analysis Our problem objective is to analyze the relationship between interval variables; regression analysis is the first tool we will
Applied Regression Analysis. Section 2: Multiple Linear Regression
 Applied Regression Analysis Section 2: Multiple Linear Regression 1 The Multiple Regression Model Many problems involve more than one independent variable or factor which affects the dependent or response
Regression Analysis. BUS 735: Business Decision Making and Research
 Regression Analysis BUS 735: Business Decision Making and Research 1 Goals and Agenda Goals of this section Specific goals Learn how to detect relationships between ordinal and categorical variables. Learn
STATS DOESN T SUCK! ~ CHAPTER 16
 SIMPLE LINEAR REGRESSION: STATS DOESN T SUCK! ~ CHAPTER 6 The HR manager at ACME food services wants to examine the relationship between a workers income and their years of experience on the job. He randomly
Chapter 14 Student Lecture Notes Department of Quantitative Methods & Information Systems. Business Statistics. Chapter 14 Multiple Regression
 Chapter 14 Student Lecture Notes 14-1 Department of Quantitative Methods & Information Systems Business Statistics Chapter 14 Multiple Regression QMIS 0 Dr. Mohammad Zainal Chapter Goals After completing
Correlation Analysis
 Simple Regression Correlation Analysis Correlation analysis is used to measure strength of the association (linear relationship) between two variables Correlation is only concerned with strength of the
Machine Learning for OR & FE
 Machine Learning for OR & FE Supervised Learning: Regression I Martin Haugh Department of Industrial Engineering and Operations Research Columbia University Email: martin.b.haugh@gmail.com Some of the
Inferences for Regression
 Inferences for Regression An Example: Body Fat and Waist Size Looking at the relationship between % body fat and waist size (in inches). Here is a scatterplot of our data set: Remembering Regression In
Lecture 14: Shrinkage
 Lecture 14: Shrinkage Reading: Section 6.2 STATS 202: Data mining and analysis October 27, 2017 1 / 19 Shrinkage methods The idea is to perform a linear regression, while regularizing or shrinking the
df=degrees of freedom = n - 1
 One sample t-test test of the mean Assumptions: Independent, random samples Approximately normal distribution (from intro class: σ is unknown, need to calculate and use s (sample standard deviation)) Hypotheses:
ECNS 561 Multiple Regression Analysis
 ECNS 561 Multiple Regression Analysis Model with Two Independent Variables Consider the following model Crime i = β 0 + β 1 Educ i + β 2 [what else would we like to control for?] + ε i Here, we are taking
MATH36061 Convex Optimization
 M\cr NA Manchester Numerical Analysis MATH36061 Convex Optimization Martin Lotz School of Mathematics The University of Manchester Manchester, September 26, 2017 Outline General information What is optimization?
Chapter 7 Student Lecture Notes 7-1
 Chapter 7 Student Lecture Notes 7- Chapter Goals QM353: Business Statistics Chapter 7 Multiple Regression Analysis and Model Building After completing this chapter, you should be able to: Explain model
9. Linear Regression and Correlation
 9. Linear Regression and Correlation Data: y a quantitative response variable x a quantitative explanatory variable (Chap. 8: Recall that both variables were categorical) For example, y = annual income,
Chapter 16. Simple Linear Regression and dcorrelation
 Chapter 16 Simple Linear Regression and dcorrelation 16.1 Regression Analysis Our problem objective is to analyze the relationship between interval variables; regression analysis is the first tool we will
STAT 212 Business Statistics II 1
 STAT 1 Business Statistics II 1 KING FAHD UNIVERSITY OF PETROLEUM & MINERALS DEPARTMENT OF MATHEMATICAL SCIENCES DHAHRAN, SAUDI ARABIA STAT 1: BUSINESS STATISTICS II Semester 091 Final Exam Thursday Feb
regression analysis is a type of inferential statistics which tells us whether relationships between two or more variables exist
 regression analysis is a type of inferential statistics which tells us whether relationships between two or more variables exist sales $ (y - dependent variable) advertising $ (x - independent variable)
Basic Business Statistics, 10/e
 Chapter 4 4- Basic Business Statistics th Edition Chapter 4 Introduction to Multiple Regression Basic Business Statistics, e 9 Prentice-Hall, Inc. Chap 4- Learning Objectives In this chapter, you learn:
Interactions. Interactions. Lectures 1 & 2. Linear Relationships. y = a + bx. Slope. Intercept
 Interactions Lectures 1 & Regression Sometimes two variables appear related: > smoking and lung cancers > height and weight > years of education and income > engine size and gas mileage > GMAT scores and
Course Introduction and Overview Descriptive Statistics Conceptualizations of Variance Review of the General Linear Model
 Course Introduction and Overview Descriptive Statistics Conceptualizations of Variance Review of the General Linear Model EPSY 905: Multivariate Analysis Lecture 1 20 January 2016 EPSY 905: Lecture 1 -
(ii) Scan your answer sheets INTO ONE FILE only, and submit it in the drop-box.
 Scan your answer sheets INTO ONE FILE only, and submit it in the drop-box.") FINAL EXAM ** Two different ways to submit your answer sheet (i) Use MS-Word and place it in a drop-box. (ii) Scan your answer sheets INTO ONE FILE only, and submit it in the drop-box. Deadline: December
FINAL EXAM ** Two different ways to submit your answer sheet (i) Use MS-Word and place it in a drop-box. (ii) Scan your answer sheets INTO ONE FILE only, and submit it in the drop-box. Deadline: December
determine whether or not this relationship is.
 Section 9-1 Correlation A correlation is a between two. The data can be represented by ordered pairs (x,y) where x is the (or ) variable and y is the (or ) variable. There are several types of correlations
2. Linear regression with multiple regressors
 2. Linear regression with multiple regressors Aim of this section: Introduction of the multiple regression model OLS estimation in multiple regression Measures-of-fit in multiple regression Assumptions
Inference with Simple Regression
 1 Introduction Inference with Simple Regression Alan B. Gelder 06E:071, The University of Iowa 1 Moving to infinite means: In this course we have seen one-mean problems, twomean problems, and problems
Chapter 14 Simple Linear Regression (A)
") Chapter 14 Simple Linear Regression (A) 1. Characteristics Managerial decisions often are based on the relationship between two or more variables. can be used to develop an equation showing how the variables
Chapter 14 Simple Linear Regression (A) 1. Characteristics Managerial decisions often are based on the relationship between two or more variables. can be used to develop an equation showing how the variables
Chi-square tests. Unit 6: Simple Linear Regression Lecture 1: Introduction to SLR. Statistics 101. Poverty vs. HS graduate rate
 Review and Comments Chi-square tests Unit : Simple Linear Regression Lecture 1: Introduction to SLR Statistics 1 Monika Jingchen Hu June, 20 Chi-square test of GOF k χ 2 (O E) 2 = E i=1 where k = total
MLR Model Selection. Author: Nicholas G Reich, Jeff Goldsmith. This material is part of the statsteachr project
 MLR Model Selection Author: Nicholas G Reich, Jeff Goldsmith This material is part of the statsteachr project Made available under the Creative Commons Attribution-ShareAlike 3.0 Unported License: http://creativecommons.org/licenses/by-sa/3.0/deed.en
Applied Regression Modeling: A Business Approach Chapter 3: Multiple Linear Regression Sections
 Applied Regression Modeling: A Business Approach Chapter 3: Multiple Linear Regression Sections 3.1 3.3.2 by Iain Pardoe 3.1 Probability model for (X 1, X 2,...) and Y 2 Multiple linear regression................................................
Linear Regression with 1 Regressor. Introduction to Econometrics Spring 2012 Ken Simons
 Linear Regression with 1 Regressor Introduction to Econometrics Spring 2012 Ken Simons Linear Regression with 1 Regressor 1. The regression equation 2. Estimating the equation 3. Assumptions required for
Python 데이터분석 보충자료. 윤형기
 Python 데이터분석 보충자료 윤형기 (hky@openwith.net) 단순 / 다중회귀분석 Logistic Regression 회귀분석 REGRESSION Regression 개요 single numeric D.V. (value to be predicted) 과 one or more numeric I.V. (predictors) 간의관계식. "regression"
Panel data can be defined as data that are collected as a cross section but then they are observed periodically.
 Panel Data Model Panel data can be defined as data that are collected as a cross section but then they are observed periodically. For example, the economic growths of each province in Indonesia from 1971-2009;
Estimating σ 2. We can do simple prediction of Y and estimation of the mean of Y at any value of X.
 Estimating σ 2 We can do simple prediction of Y and estimation of the mean of Y at any value of X. To perform inferences about our regression line, we must estimate σ 2, the variance of the error term.
Announcements. Unit 6: Simple Linear Regression Lecture : Introduction to SLR. Poverty vs. HS graduate rate. Modeling numerical variables
 Announcements Announcements Unit : Simple Linear Regression Lecture : Introduction to SLR Statistics 1 Mine Çetinkaya-Rundel April 2, 2013 Statistics 1 (Mine Çetinkaya-Rundel) U - L1: Introduction to SLR
LECTURE 6. Introduction to Econometrics. Hypothesis testing & Goodness of fit
 LECTURE 6 Introduction to Econometrics Hypothesis testing & Goodness of fit October 25, 2016 1 / 23 ON TODAY S LECTURE We will explain how multiple hypotheses are tested in a regression model We will define
Linear Regression Measurement & Evaluation of HCC Systems
 Linear Regression Measurement & Evaluation of HCC Systems Linear Regression Today s goal: Evaluate the effect of multiple variables on an outcome variable (regression) Outline: - Basic theory - Simple
22s:152 Applied Linear Regression. Chapter 8: 1-Way Analysis of Variance (ANOVA) 2-Way Analysis of Variance (ANOVA)
 2-Way Analysis of Variance (ANOVA)") 22s:152 Applied Linear Regression Chapter 8: 1-Way Analysis of Variance (ANOVA) 2-Way Analysis of Variance (ANOVA) We now consider an analysis with only categorical predictors (i.e. all predictors are
22s:152 Applied Linear Regression Chapter 8: 1-Way Analysis of Variance (ANOVA) 2-Way Analysis of Variance (ANOVA) We now consider an analysis with only categorical predictors (i.e. all predictors are
Forecasting. Copyright 2015 Pearson Education, Inc.
 5 Forecasting To accompany Quantitative Analysis for Management, Twelfth Edition, by Render, Stair, Hanna and Hale Power Point slides created by Jeff Heyl Copyright 2015 Pearson Education, Inc. LEARNING
Chapter 1. Linear Regression with One Predictor Variable
 Chapter 1. Linear Regression with One Predictor Variable 1.1 Statistical Relation Between Two Variables To motivate statistical relationships, let us consider a mathematical relation between two mathematical
Multiple Linear Regression II. Lecture 8. Overview. Readings
 Multiple Linear Regression II Lecture 8 Image source:https://commons.wikimedia.org/wiki/file:autobunnskr%c3%a4iz-ro-a201.jpg Survey Research & Design in Psychology James Neill, 2016 Creative Commons Attribution
Multiple Linear Regression II. Lecture 8. Overview. Readings. Summary of MLR I. Summary of MLR I. Summary of MLR I
 Multiple Linear Regression II Lecture 8 Image source:https://commons.wikimedia.org/wiki/file:autobunnskr%c3%a4iz-ro-a201.jpg Survey Research & Design in Psychology James Neill, 2016 Creative Commons Attribution
2 Prediction and Analysis of Variance
 2 Prediction and Analysis of Variance Reading: Chapters and 2 of Kennedy A Guide to Econometrics Achen, Christopher H. Interpreting and Using Regression (London: Sage, 982). Chapter 4 of Andy Field, Discovering
Applied Statistics and Econometrics
 Applied Statistics and Econometrics Lecture 6 Saul Lach September 2017 Saul Lach () Applied Statistics and Econometrics September 2017 1 / 53 Outline of Lecture 6 1 Omitted variable bias (SW 6.1) 2 Multiple
Linear Regression 9/23/17. Simple linear regression. Advertising sales: Variance changes based on # of TVs. Advertising sales: Normal error?
 Simple linear regression Linear Regression Nicole Beckage y " = β % + β ' x " + ε so y* " = β+ % + β+ ' x " Method to assess and evaluate the correlation between two (continuous) variables. The slope of
ECO220Y Simple Regression: Testing the Slope
 ECO220Y Simple Regression: Testing the Slope Readings: Chapter 18 (Sections 18.3-18.5) Winter 2012 Lecture 19 (Winter 2012) Simple Regression Lecture 19 1 / 32 Simple Regression Model y i = β 0 + β 1 x
Final Exam - Solutions
 Ecn 102 - Analysis of Economic Data University of California - Davis March 17, 2010 Instructor: John Parman Final Exam - Solutions You have until 12:30pm to complete this exam. Please remember to put your
Linear Regression with Multiple Regressors
 Linear Regression with Multiple Regressors (SW Chapter 6) Outline 1. Omitted variable bias 2. Causality and regression analysis 3. Multiple regression and OLS 4. Measures of fit 5. Sampling distribution
Warm-up Using the given data Create a scatterplot Find the regression line
 Time at the lunch table Caloric intake 21.4 472 30.8 498 37.7 335 32.8 423 39.5 437 22.8 508 34.1 431 33.9 479 43.8 454 42.4 450 43.1 410 29.2 504 31.3 437 28.6 489 32.9 436 30.6 480 35.1 439 33.0 444
Regression Models - Introduction
 Regression Models - Introduction In regression models there are two types of variables that are studied: A dependent variable, Y, also called response variable. It is modeled as random. An independent
LECTURE 10. Introduction to Econometrics. Multicollinearity & Heteroskedasticity
 LECTURE 10 Introduction to Econometrics Multicollinearity & Heteroskedasticity November 22, 2016 1 / 23 ON PREVIOUS LECTURES We discussed the specification of a regression equation Specification consists
Business Statistics 41000: Homework # 5
 Business Statistics 41000: Homework # 5 Drew Creal Due date: Beginning of class in week # 10 Remarks: These questions cover Lectures #7, 8, and 9. Question # 1. Condence intervals and plug-in predictive
Section 4: Multiple Linear Regression
 Section 4: Multiple Linear Regression Carlos M. Carvalho The University of Texas at Austin McCombs School of Business http://faculty.mccombs.utexas.edu/carlos.carvalho/teaching/ 1 The Multiple Regression
1 A Non-technical Introduction to Regression
 1 A Non-technical Introduction to Regression Chapters 1 and Chapter 2 of the textbook are reviews of material you should know from your previous study (e.g. in your second year course). They cover, in
Statistics for Managers using Microsoft Excel 6 th Edition
 Statistics for Managers using Microsoft Excel 6 th Edition Chapter 13 Simple Linear Regression 13-1 Learning Objectives In this chapter, you learn: How to use regression analysis to predict the value of
Inference for Regression Inference about the Regression Model and Using the Regression Line, with Details. Section 10.1, 2, 3
 Inference for Regression Inference about the Regression Model and Using the Regression Line, with Details Section 10.1, 2, 3 Basic components of regression setup Target of inference: linear dependency
Course Introduction and Overview Descriptive Statistics Conceptualizations of Variance Review of the General Linear Model
 Course Introduction and Overview Descriptive Statistics Conceptualizations of Variance Review of the General Linear Model PSYC 943 (930): Fundamentals of Multivariate Modeling Lecture 1: August 22, 2012
Determination of Density 1
 Introduction Determination of Density 1 Authors: B. D. Lamp, D. L. McCurdy, V. M. Pultz and J. M. McCormick* Last Update: February 1, 2013 Not so long ago a statistical data analysis of any data set larger
Binary Logistic Regression
 The coefficients of the multiple regression model are estimated using sample data with k independent variables Estimated (or predicted) value of Y Estimated intercept Estimated slope coefficients Ŷ = b
Business Statistics. Lecture 10: Course Review
 Business Statistics Lecture 10: Course Review 1 Descriptive Statistics for Continuous Data Numerical Summaries Location: mean, median Spread or variability: variance, standard deviation, range, percentiles,
Overview. Linear Regression with One Variable Gradient Descent Linear Regression with Multiple Variables Gradient Descent with Multiple Variables
 Overview Linear Regression with One Variable Gradient Descent Linear Regression with Multiple Variables Gradient Descent with Multiple Variables Example: Advertising Data Data taken from An Introduction
Simple Linear Regression: One Qualitative IV
 Simple Linear Regression: One Qualitative IV 1. Purpose As noted before regression is used both to explain and predict variation in DVs, and adding to the equation categorical variables extends regression
Lecture 2: Linear regression
 Lecture 2: Linear regression Roger Grosse 1 Introduction Let s ump right in and look at our first machine learning algorithm, linear regression. In regression, we are interested in predicting a scalar-valued
ECON 497 Midterm Spring
 ECON 497 Midterm Spring 2009 1 ECON 497: Economic Research and Forecasting Name: Spring 2009 Bellas Midterm You have three hours and twenty minutes to complete this exam. Answer all questions and explain
Announcements. J. Parman (UC-Davis) Analysis of Economic Data, Winter 2011 February 8, / 45
 Analysis of Economic Data, Winter 2011 February 8, / 45") Announcements Solutions to Problem Set 3 are posted Problem Set 4 is posted, It will be graded and is due a week from Friday You already know everything you need to work on Problem Set 4 Professor Miller
Announcements Solutions to Problem Set 3 are posted Problem Set 4 is posted, It will be graded and is due a week from Friday You already know everything you need to work on Problem Set 4 Professor Miller
Regression Models REVISED TEACHING SUGGESTIONS ALTERNATIVE EXAMPLES
 M04_REND6289_10_IM_C04.QXD 5/7/08 2:49 PM Page 46 4 C H A P T E R Regression Models TEACHING SUGGESTIONS Teaching Suggestion 4.1: Which Is the Independent Variable? We find that students are often confused
ECONOMETRIC MODEL WITH QUALITATIVE VARIABLES
 ECONOMETRIC MODEL WITH QUALITATIVE VARIABLES How to quantify qualitative variables to quantitative variables? Why do we need to do this? Econometric model needs quantitative variables to estimate its parameters
Chapter 12 - Part I: Correlation Analysis
 ST coursework due Friday, April - Chapter - Part I: Correlation Analysis Textbook Assignment Page - # Page - #, Page - # Lab Assignment # (available on ST webpage) GOALS When you have completed this lecture,
Statistics II Exercises Chapter 5
 Statistics II Exercises Chapter 5 1. Consider the four datasets provided in the transparencies for Chapter 5 (section 5.1) (a) Check that all four datasets generate exactly the same LS linear regression
Fitting a regression model
 Fitting a regression model We wish to fit a simple linear regression model: y = β 0 + β 1 x + ɛ. Fitting a model means obtaining estimators for the unknown population parameters β 0 and β 1 (and also for