UC San Diego UC San Diego Electronic Theses and Dissertations
|
|
|
- Elvin Terry
- 6 years ago
- Views:
Transcription
1 UC San Diego UC San Diego Electronic Theses and Dissertations Title Low Velocity Impacts of Variable Tip Radius on Carbon/ Epoxy Plates / Permalink Author Delaney, Mac P. Publication Date Peer reviewed Thesis/dissertation escholarship.org Powered by the California Digital Library University of California
2 UNIVERSITY OF CALIFORNIA, SAN DIEGO Low Velocity Impacts of Variable Tip Radius on Carbon/Epoxy Plates A Thesis submitted in partial satisfaction of the requirements for the degree of Master of Science in Structural Engineering by Mac P. Delaney Committee in Charge: Professor Hyonny Kim, Chair Professor Jurijs Bazilevs Professor Petr Krysl 2013
3
4 SIGNATURE PAGE The Thesis of Mac Delaney is approved, and it is acceptable in quality and form for Publication on microfilm and electronically: Chair University of California, San Diego 2013 iii
5 TABLE OF CONTENTS SIGNATURE PAGE... iii TABLE OF CONTENTS... iv LIST OF ABBREVIATIONS... vi LIST OF FIGURES... vii LIST OF TABLES... xi ACKNOWLEDGEMENTS... xii ABSTRACT OF THE THESIS... xiii CHAPTER 1: INTRODUCTION Motivation Previous Work Objectives... 7 CHAPTER 2: EXPERIMENTAL SETUP Pendulum Impact System Test Specimens Experimental Procedure CHAPTER 3: RESULTS Data Collection Failure Thresholds Determining the Failure Thresholds Failure Threshold Forces and Energies Damage Visibility Force History Data Contact Pressure Microscopy CHAPTER 4: DISCUSSION AND CONCLUSIONS REFERENCES APPENDICES Appendix I. Impact Force Correction Appendix Ia. Solving Force Correction Vibration Equations with MATLAB: iv
6 Appendix II. Potential Energy Calculations Appendix III. Testing Checklist Appendix IV. Data Summary Table Appendix V. Contact Area Plots Appendix VI. Force and C-Scan Data Appendix VII. Contact Area Processing Appendix VIII. Binomial Regressions using MATLAB v
7 LIST OF ABBREVIATIONS BVID Barely visible impact damage CFRP Carbon Fiber Reinforced Polymer FRP - Fiber Reinforced Polymer FTE Failure threshold energy FTF- Failure threshold force vi
8 LIST OF FIGURES Figure 1. Pendulum Impact System... 9 Figure 2. Test Setup Drawing. Side view (left) and front view (right) Figure 3. Impact tips of radii 12.7, 25.4, 50.8 and 76.2 mm from left to right Figure 4. Contact area sheet of a 53 J impact from a 76.2 mm tip on a 16 ply panel Figure 5. Incoming and rebounding laser voltage data for test LV-160; R50.8 mm tip impacting 24 ply panel at 54 J Figure 6. Force vs. time history for test LV-160; R50.8 mm tip impacting Figure 7. Contact mark left by test LV-160; R50.8 mm tip impacting 24 ply panel at 54 J Figure 8. C-Scan map for tests LV-160 (left), LV-161 (center), and LV-162 (right) Figure 9. Dent profile for test LV Figure 10. Binomial regressions for impact energies on 8 ply panels Figure 11. Binomial regressions for impact energies on 16 ply panels Figure 12. Binomial regressions for impact energies on 24 ply panels Figure 13. Impact energy vs. contact force for all tests. Solid markers are 8 ply tests, unfilled with thick borders are 16 ply tests, and unfilled with thin borders are 24 ply tests Figure 14. Binomial regressions for peak contact forces on 8 ply panels Figure 15. Binomial regressions for impact energies on 16 ply panels Figure 16. Binomial regressions for impact energies on 24 ply panels Figure 17. Failure Threshold Forces Figure 18. Failure Threshold Energies vii
9 Figure 19. Dent depth vs. peak contact force for 8 ply panel. Filled in data points indicate non damaging impacts, and open points indicate damaging impacts. The tail below each data point indicates relaxation of the dent. Points without a tail had no relaxation Figure 20. Dent depth vs. peak contact force for 16 ply panel. Filled in data points indicate non damaging impacts, and open points indicate damaging impacts. The tail below each data point indicates relaxation of the dent. Points without a tail had no relaxation Figure 21. Dent depth vs. peak contact force for 24 ply panel. Filled in data points indicate non damaging impacts, and open points indicate damaging impacts. The tail below each data point indicates relaxation of the dent. Points without a tail had no relaxation Figure 22. Damage area vs. peak contact force for 8 (left), 16 (middle), and 24 (right) ply panels Figure 23. Dent relaxation over time for 37 J impacts on a 24 ply panel Figure 24. Illustration of dents with equal depth but different visibility (left) and equal visibility but different depth (right) Figure 25. Damage area vs. relaxed dent depth for 8 (left), 16 (middle), and 24 (right) ply panels Figure 26. Damage area vs. dent visibility for 8 (left), 16 (middle), and 24 (right) ply panels viii
10 Figure 27. Force vs. time history for a non-damaging (12.5 J, 6.5 kn peak force) and a damaging (23.3 J, 9.9 kn peak force) impact with a 12.7 mm tip radius on a 16 ply panel Figure 28. Force vs. time history for a non-damaging (10.7 J, 7.4 kn peak force) and a damaging (30.0 J, 12.5 kn peak force) impact with a 12.7 mm tip radius on a 24 ply panel Figure 29. Damage indicating force pulses for 8 ply panels Figure 30. Damage indicating force pulses for 16 ply panels Figure 31. Damage indicating force pulses for 24 ply panels Figure 32. Kinetic energy vs. contact area for 8 (left), 16 (middle), and 24 (right) ply panels Figure 33. Kinetic energy vs. average contact pressure for 8 (left), 16 (middle), and 24 (right) ply panels Figure 34. Panel section prepared for microscopy mounted in epoxy Figure 35. Microscope image and C-Scan map of test LV-021, 16 ply panel impacted with 31 J by a 12.7 mm tip Figure 36. Microscope image of test LV-021 with increased magnification Figure 37. Microscope image of test LV-113, 16 ply panel impacted with 55 J by a 76.2 mm tip Figure 38. Microscope image of test LV-113 with increased magnification Figure 39. Pendulum Free Body Diagram Figure 40. Pendulum as spring-mass system Figure 41. Force pulse at impact site and in the transducer ix
11 Figure 42. Pendulum energy balance model Figure 43. Unprocessed contact sheet image (left) vs. processed image (right) Figure 44. Image produced by MATLAB function to verify that the contact area was properly measured x
12 LIST OF TABLES Table 1. Number of tests for each panel thickness and impactor tip radius R (mm) Table 2. Delamination/fiber failure threshold forces (kn) for each panel thickness (T in number of plies) and impact tip radius (R in mm) Table 3. Delamination/fiber failure threshold energies (J) for each panel thickness (T in number of plies) and impact tip radius (R in mm) Table 4. Average percent change from initial to relaxed dent depth for each panel thickness (T in number of plies) and impact tip radius (R in mm) Table 5. Force correction factors determined using constant acceleration and vibration analysis xi
13 ACKNOWLEDGEMENTS I would like to thank Professor Hyonny Kim for giving me the opportunity to work on this research. His patience and guidance have given me skills that I will use far beyond the field of aerospace structures. He is a truly dedicated professor and has been a pleasure to work for. I would also like to thank all the other students in the lab that have each given me much needed assistance over the course of this project, including Sarah Fung for the hundreds of impact tests that she helped me perform. I would like to thank all of the other professors I have had in my undergraduate and graduate careers for the knowledge and inspiration that they have given me. I would also like to thank my parents, my sister, and my brother, each of you has been a unique inspiration, and I would not have gotten to where I am today without you. Thank you. xii
14 ABSTRACT OF THE THESIS Low Velocity Impacts of Variable Tip Radius on Carbon/Epoxy Plates by Mac P. Delaney Master of Science in Structural Engineering University of California, San Diego, 2012 Professor Hyonny Kim, Chair With a growing use of composite materials in aircraft structures, there is a greater need to understand the response of these materials to low velocity impacts. Low velocity impacts from tool drops or ground equipment collisions can be of varying bluntness and can leave little or no visible evidence of damage. Therefore, a need exists to investigate the initiation of internal damage and the relationship between this internal damage and the external visible damage with respect to the bluntness of the impactor. xiii
15 A pendulum impactor was used to impact 76.2 x 127 mm carbon/epoxy panels that were 8, 16, and 24 plies thick. The panels were impacted by hardened steel tips with radii of 12.7 to 76.2 mm. The experimental results show that the failure threshold energies for each panel thickness and tip radius combination occur at a distinct and consistent energy. This threshold increases with impactor bluntness, and this effect is greater for the 8 ply panel than it is for the 16 or 24 ply panels. To describe the visibility of impact damage, the area of delamination was compared to the depth of the dents resulting from the impacts. For the sharper impact tips, there is a clear relationship between the delamination area and the depth of the dents. However, these relationships are dependent on the radius of the impact tip, and for the blunter impact tips no strong correlation could be determined between the delamination area and the depth of the dents. xiv
16 CHAPTER 1: INTRODUCTION 1.1 Motivation In recent decades composite materials have seen an increasing role in the civilian and military aerospace industry. Fiber-reinforced polymers (FRPs) have high stiffness and strength to weight ratios, as well as favorable fatigue and corrosion properties [1]. Since weight savings is of such high importance in aerospace structures, recent designs have replaced much of their metal structures with composite materials. For example, the Boeing 787 Dreamliner relies on FRPs for 50% of its structural weight, while in 1980 the comparable MD-80 only used composites in 5% of its structural weight [2]. A major concern with these materials that has prevented even faster utilization is their vulnerability to impact damage. The through-thickness strength in FRPs is significantly lower than the in-plane properties, thereby making them susceptible to damage during transverse impact events such as tool drops, runway kickup, or vehicle collisions [3]. These impacts are particularly dangerous because they often leave either non-visible or barely visible impact damage, yet can result in reductions in residual strength of up to 50% [4]. In contrast, metal components more readily exhibit evidence of the occurrence of a damaging impact event in the form of highly visible dents or cracks. In fiber reinforced composites, the initial forms of damage due to impacts include delamination and back face fiber breakage. These modes of damage are typically internal and thus not directly detectable by visually inspecting the exterior of the site of the impact. 1
17 2 The threat of impact damage on aircraft structures and the limited visibility of the resulting damage increase the importance of self-reporting the occurrence of impact events. Unfortunately, many events will not be witnessed, and those that are may go unreported because of a fear of the repercussions or a belief that no damage has occurred. Due to the modes by which FRPs sustain damage, a section that seems pristine on the surface may have significant internal damage that can potentially lead to structural failure. For composite materials to continue expanding their role in the aerospace and other fields, their behavior under impact loading still requires more extensive investigation. 1.2 Previous Work Because of the vulnerability of composite materials to being damaged by impact loads, extensive experimental and analytical research has been performed on this subject. Analytical work has attempted to create models that predict the delamination threshold loads or the depth of surface dents from impacts. In addition, numerous experimental investigations have tested composite structures under impact loads in attempts to further understand the material behavior. A review of some of the relevant work is provided here. Analytical models have made use of the Hertzian contact law or variations of it to attempt to describe the relationship between the contact force and the indentation of a composite material subjected to low velocity impacts. This law was originally developed for the contact between two isotropic spheres, but has served as a base for models
18 3 describing composite plates impacted by rigid spheres. Equation (1) describes the contact of an elastic sphere onto a semi-infinite elastic half space. (1) In this relationship F is the contact force, α is the indentation depth of the sphere into the half space, n is a power index determined experimentally, and k is the contact stiffness of a semi-infinite solid given by: In equation (2), the subscript s refers to the impacting sphere and t refers to the target panel, R is the radius of the impacting sphere, E refers to the modulus of elasticity, and ν is Poisson s ratio. Sun [5] developed a modified version of this contact law for composite laminates, where he defined the contact rigidity using the modulus of elasticity of the composite in the transverse direction, E z : The dependence on the radius of the impactor in these relationships is important because it indicates that higher forces will be required for blunter impact tips to create the same level of indentation. These higher forces caused by the blunter tips can exceed damage threshold levels for the material while leaving less visual evidence that damage has occurred. Wu and Shyu [6] experimentally determined that for impacts on thin
19 4 composite plates, this relationship breaks down as the impact tip radius increases from a 12.7 mm diameter tip to a 25.0 mm diameter tip. So with blunter tips, the force would still correlate with the parameters in equations 1-3, but not to the same degree as with sharper impact tips. Willis [7] showed that 1.5 could be used as a value for n in equation (1), and this value is often used for describing impacts on composite plates. Yang and Sun [8] investigated the fact that the force-indentation relationship was different during the unloading process measured through static indentation tests. The unloading force was described as: In equation (4) α m is the maximum indentation, F m is the maximum force, and α o is the residual, or permanent, indentation. The initial form of damage from low-velocity impacts on FRPs is typically cracking or delamination. Tests by Sjöblom and Hartness [9] showed matrix cracking from impacts as low as 1.0 J. This type of damage is difficult to detect, and does not significantly reduce the stiffness of the laminate. However, matrix cracks do serve as flaws that allow delamination and fiber breakage to initiate [10]. Adsit and Waszczak [4] showed through residual strength tests that delamination can significantly reduce the compressive strength and stiffness of the material. The tensile strength and stiffness is not greatly reduced until fiber breakage has occurred, which is usually only initiated at impact energy levels much greater than those that cause delamination. Zhang [11] and
20 5 Davies and Zhang [12] pointed out that delamination is a result of transverse shear stresses, which are at a maximum roughly halfway through the thickness of the laminate. Fiber failure, however, is a result of high tensile forces on the back face due to bending. Zhang also found that the threshold for delamination was chiefly dependent on the thickness, t, of the laminate, and in his experiments, the critical force thresholds could be predicted using the equation: The relationship in equation (5) does not take into account the radius of the impact tip, which was 6.35 mm in the experiments of Davies and Zhang. For larger impact radii, equation (5) would not be valid without having to redefine parameters (e.g., 680). Some studies have looked at the effect of the impact tip radius on low-velocity impacts. In a study on impacts using tip radii of 12.7 to mm, Whisler and Kim [13] found that increasing the tip radius also increased the damage initiation threshold in glass/epoxy composites. It was found that for a given panel thickness and impact energy level, the peak force was the same regardless of tip radius, but the blunter tips created a greater contact area and therefore a lower average contact pressure. This indicated that a blunter tip was less likely to cause surface dents than a sharper one because the contact force was less concentrated. Siow and Shim [1] investigated impacts on woven fiber composites with tip radii of 6.3 and 21 mm, and also found that increasing the radius of the impactor increases the damage initiation threshold. Yang and Cantwell [14] reached similar conclusions while looking at impacts from 4.6, 12, 14.4, and 19.2 mm diameter
21 6 tips. They noted that the effect of the increased tip radius was more significant for thinner laminates. Adsit and Waszczak [4] tested composite panels with tip radii of 6.3 and 25.4 mm. They found that the sharper impactor created more fiber damage which reduced tensile and compressive strength, while a blunter impactor created more delamination and less fiber damage, which only significantly reduced the compressive strength. In their study, the area of the dents were recorded rather than the depth, which was found to be difficult to record. Quantifying the dents in this way can be subjective, and in some cases the visible damage could not be recorded because the boundaries of the dents were questionable. Their study did prove that impacts causing internal but not visible damage can result in a dramatic reduction in strength. Attempts have been made to use the depths of surface dents as a metric to indicate internal damage. Wardle and Lagace [15] concluded that no useful correlation existed between the dent depth and internal damage of impacted graphite/epoxy plate and shell structures since dent depth and the internal damage extent was not distinct enough to describe a clear relationship. Their study also found that some impacts created significant internal damage with no measurable surface dents, and others created visible dents without any internal damage. In contrast, other investigations found clear relationships between internal and visible damage. Anderson and Madenci [16] found that significant internal damage was indicated by a threshold dent depth for foam and honeycomb core composite sandwich panels. In another study, Sun and Dicken [17] found that the extent of internal damage could be predicted by the depth of the surface dent in ARALL (aramid-aluminum) laminates. Both the sandwich and ARALL
22 7 composites possess properties that could have caused the damage to be more visual than in thin composite plates. The core in the sandwich panels and the aluminum in the ARALL sustain dents more readily than the fiber reinforced polymer portions of these materials, and this could be why relationships between dent depth and internal damage were more clearly visible than in thin monolithic FRP panels. 1.3 Objectives This investigation will explore the damage initiation of carbon/epoxy composite panels subjected to low-velocity impacts in relation to the radius of the impacting tip and the thickness of the panel. The relationship between visible damage (i.e. surface dents and cracks) and internal damage will also be investigated, as this is of particular interest in composite aircraft structures. In this research, visible damage will be quantified as the depths of the dents created on the surface of the panels as well as the span over which these dents exist. The depths of the initial and residual surface dents and the span of the dents will be related to the radius of the impact tip, the thickness of the panel, the peak contact force, and the extent of the internal damage.
23 CHAPTER 2: EXPERIMENTAL SETUP 2.1 Pendulum Impact System For this investigation a series of impact tests were carried out using a pendulum impact system (Figure 1). This system consisted of a stack of 50.8 mm diameter stainless steel masses, totaling up to 5.08 to 5.85 kg (depending on each tip s geometry), mounted on the end of a stiff, lightweight fiberglass rod. The swinging radius of the mass center is 1.42 m. The impacting face of the mass consisted of a hemispherical tip mounted onto a dynamic force-measuring load cell. A US Digital A-2 absolute encoder wheel with 3600 discrete steps was incorporated into the pendulum system so that the angle of the arm could be determined with 0.1 degree resolution. This enabled the desired potential energy to be set via exact placement of the pendulum arm prior to the impact test. Just before the pendulum came into contact with the panel, the arm passed through a laser photogate system so that the velocity of the pendulum head could be determined. The kinetic energy of the pendulum could then be calculated, allowing for a more accurate measure of the impact energy and a validation of the predicted energy prior to the test. The panels were confined between two 12.7 mm thick A36 steel plates (shown in Figure 1), each with a 76.2 x 127 mm window in accordance with ASTM D7136 standard [18]. The composite panels tested were 152 x 305 mm (visible in Figure 1), and consisted of three impact sites per panel. It should be noted that these panels were painted white (as shown in Figure 1) by an airline company s maintenance technicians 8

24 9 using aircraft exterior paint. In order to allow these panels to slide into the fixture, the front plate was only bolted on the top and bottom with 7.9 mm bolts (5/16 in.). To avoid damage that could potentially be created by the sharp corners at the boundary of the window, 3.2 mm thick silicone rubber strips were added to the edges. Aluminum shims were placed between the two steel plates so that the rubber strips would be compressed 1 mm every time. A drawing of the specimen-holding fixture setup is shown in Figure 2. Figure 1. Pendulum Impact System
25 10 Figure 2. Test Setup Drawing. Side view (left) and front view (right) Four interchangeable impact tips made of hardened steel were used in this investigation. The tips had radii of 12.7, 25.4, 50.8, and 76.2 mm (Figure 3). These tips had masses of 23.5, 462.2, 262.3, and grams respectively. The 12.7 mm radius tip was mounted to a DYTRAN 1050V6 force transducer which had a mass of 34.2 grams, and the other three tips were mounted to a DYTRAN 1060V5 force transducer which had a mass of grams. This was due to the different size of the 12.7 mm radius tip in comparison to the other three (see Figure 3). Because the mass of the impact tip was not negligible compared to the mass of the entire pendulum head, the force measured by the transducer had to be corrected to accurately know the force at the face of the impact. This is primarily a function of the mass of the tip which sits between the load cell and target panel. This dynamic correction is further described in Appendix I. The force transducer s output was in volts and needed to be converted to units of force. The

26 11 conversion factors given by the manufacturer were 4.58 kn/v and 20.8 kn/v for the 1050V6 and 1060V5 sensors respectively. Figure 3. Impact tips of radii 12.7, 25.4, 50.8 and 76.2 mm from left to right 2.2 Test Specimens The material used for these experiments was Toray T800/ Carbon/Epoxy prepreg tape. Panels were layed up quasi-isotropically in the orientation [(0/45/90/- 45) n ] S, where n ranged from 1 to 3, to make panels 8, 16, and 24 plies thick. The panels also included a 0.05 mm thick ply of plain weave glass/epoxy and aerospace grade paint on the impact side of the panel. These additions were included to make the panels more representative of aircraft laminates. The laminates were originally fabricated as 305 x 305 mm specimens and cut in half to make two 152 x 305 mm panels. The 8, 16, and 24 ply panels were measured to be 1.7, 3.3 and 4.9 mm respectively. From these measurements it can be calculated that each ply is 0.2 mm thick and the combined layer of glass fiber and paint on the impact side of the panels is 0.1 mm thick.
27 Experimental Procedure Before each impact test, the desired potential energy of the impact would be used to calculate the angle the pendulum arm would need to be set to (see Appendix II). The arm would be attached to a pneumatic release mechanism, and raised to the appropriate angle. As a safety precaution, the arm was also attached to a tether until just before impact, in case the release was accidentally triggered. Before releasing the pendulum, the tip would be marked with Dry Erase ink, and a sheet of paper was placed over the front of the panel. When the pendulum would strike the panel, the ink would transfer from the tip to the paper, leaving an imprint of the part of the tip that had come into contact with the panel. The paper was then digitally scanned and the contact area was determined via MATLAB image processing (see Appendix IV). In previous experiments, carbon paper was used to record the contact area, but this was found to be inconsistent and did not leave as clear of a mark as was desired. Several different types of ink were tested for this system including stamp ink, permanent ink, and roll on ink. Dry Erase ink was chosen because it transferred onto the paper very well, did not dry up (so it would transfer even after sitting for some time), and it did not splatter onto areas that the tip had not come into contact with. Figure 4 shows the contact sheet from a 53 J impact on a 16 ply panel, for an impact tip radius of 76.2 mm. The square in the lower left has a known area, and is used as a reference when calculating the contact area.
28 13 Figure 4. Contact area sheet of a 53 J impact from a 76.2 mm tip on a 16 ply panel After each impact, the panels were examined to determine the extent of internal damage and the depth of any surface dents. The presence of delamination was detected by pulse-echo ultrasonic A-Scan using a hand-held 5 MHz sensor connected to an NDT Automation Pocket UT version V1.81. If delamination was detected the panels were set aside to be C-Scanned using through-transmission ultrasound (5 MHz transducers) to determine the area of the damage. This was done using an NDT Automation 36 Lab Ultrason C-Scan System, model UPKII-T36. The surface dents were measured using a Mitutoyo model ID-S1012E depth indicator, capable of measuring dent depths with a resolution of 0.01 mm. Depth measurements were taken at the center of the point of impact and at +/ mm distance on either side of that point. The depth of the dent was then calculated as the average of the depths on either side of the impact minus the depth at the point of impact. The surface dents were measured immediately after the
29 14 impacts, and then again 24 hours later to record the relaxed dent depth. If no surface dent or delamination was detected, the panel could be impacted again, up to a limit of 3 total impacts to prevent the onset of damage from repeated loads. In order to keep track of all the steps involved in this test procedure, a checklist was implemented. This was referred to during testing, and can be found in Appendix III.
30 CHAPTER 3: RESULTS For this experimental investigation, 152 impact tests were performed on 8, 16, and 24 ply carbon/epoxy panels using impact tip radii of 12.7, 25.4, 50.8, and 76.2 mm. The amount of tests performed for each condition is shown in Table 1. These totals do not include practice or calibration tests, or impacts that did not yield valid data. Table 1. Number of tests for each panel thickness and impactor tip radius R (mm) Panel Type Thickness (mm) R 12.7 mm R 25.4 mm R 50.8 mm R 76.2 mm 8 plies plies plies From these tests the main quantities sought were the damage initiation thresholds, the visibility (dent depth) of damage, and insight regarding the interaction between the impactor radius and the resulting damage level. Each test is given a unique test number. A complete record of each test and associated information is listed in Appendix IV. 3.1 Data Collection For each impact, data were collected in several different forms. This section will summarize what type of data were collected and show typical outputs for a particular test. Immediately after an impact, data files were saved containing outputs from the force transducer and laser photogate systems. The laser excites a photodiode sensor 15
31 16 which is connected to a circuit that outputs a voltage of 2V when the beam was not blocked and 8V when it was blocked. By measuring the width of the pendulum arm and determining the time it took for the arm to pass through the laser, the velocity of the pendulum head just prior to impact could be calculated. As an example, Figure 5 shows a plot of the voltage vs. time for test LV-160. This test involved a R50.8 mm tip impacting a 4.9 mm thick 24 ply panel at 54 J of energy. Using these data, both the incoming and rebounding velocities could be determined. Figure 5. Incoming and rebounding laser voltage data for test LV-160; R50.8 mm tip impacting 24 ply panel at 54 J Data for this impact from the force transducer are shown in Figure 6. In this figure the appropriate dynamic force correction factor (see Appendix 1) and voltage-tokn conversion factor have been applied. The mark left by test LV-160 is shown in Figure 7 indicates a contact area of 158 mm 2.
32 Force (kn) time(ms) Figure 6. Force vs. time history for test LV-160; R50.8 mm tip impacting 24 ply panel at 54 J Figure 7. Contact mark left by test LV-160; R50.8 mm tip impacting 24 ply panel at 54 J

33 18 To determine the area of delamination damage, each panel was C-Scanned. Each panel had up to three impact areas, so multiple tests were C-Scanned simultaneously. The C-Scan map of tests LV-160 to LV-162 can be seen in Figure 8. Figure 8. C-Scan map for tests LV-160 (left), LV-161 (center), and LV-162 (right) Immediately after each impact, the panel was removed from the fixture so that the depth of the dent could be measured. The dent was then measured again no earlier than 24 hours after the impact so that the relaxed dent depth could also be measured. For test LV-160, the initial dent depth was measured to be 0.05 mm and the relaxed depth was 0.04 mm. In addition to the maximum depth of the dents, a profile was taken so that the span over which the dents existed could be measured. This was achieved by taking depth measurements every 1.58 mm (1/16 of an inch) along a path that passed through the dent. Figure 9 shows a plot of these measurements.
34 Depth (mm) Distance Along Panel (mm) Figure 9. Dent profile for test LV Failure Thresholds Determining the Failure Thresholds For each test the peak force and projectile kinetic energy were recorded, as well as whether any delamination or fiber breakage could be detected. The failure threshold force (FTF) was the minimum peak force at which an impact still initiated detectable damage (delamination or fiber breakage). Similarly, the failure threshold energy (FTE) was the minimum projectile kinetic energy at which an impact initiated damage (within detectable limit by ultrasonic A-Scan). In order to objectively determine the failure threshold forces and energies, a binomial regression was applied to the data. To do this, each impact was given a value of
35 20 1 if it was damaged and 0 if it was undamaged. These values were plotted against the peak force or impact energy, and a binomial regression fit was run to determine the likelihood of damage existing. The failure threshold was then defined as the point at which damage has a 50% probability of occurring, as determined by the binomial regression. The reason that this regression was used to determine the failure thresholds was because some impacts had no damage above the failure threshold and others had developed damage below it. This was because the damage initiation was driven by flaws in the material, and each panel had unique flaws that caused the onset of damage to vary slightly. Although there is a fairly narrow range where the damage threshold exists, there is still some overlap in the data. Using the binomial regression, the data of damaging and non-damaging hits was used to determine probability of damage, and we have defined the threshold to be when this probability is 50%. In many cases there is no overlap between damaging and non-damaging hits. In this case the regression simply produces a straight line from the highest non-damaging hit to the lowest damaging hit. The binomial regressions for the FTEs can be seen in Figures More information on how these plots were produced can be found in Appendix V. These plots of the FTEs were useful during testing because they helped indicate what energy levels future tests should be run at in order to further refine the failure threshold. In terms of describing the behavior of the material however, the FTF is a more physically insightful parameter. This is because the contact force represents a direct local relationship between the impactor and the target, while the FTE masks information related to the projectile mass and velocity, and is known to be sensitive to panel geometry
36 Damage 21 and boundary condition details. A direct relationship exists, however, between impact kinetic energy and peak contact force for each panel thickness. Thicker panels generated higher peak contact forces than thinner panels because of their increased stiffness. Figure 13 shows the impact energy vs. the peak contact force for all tests. Note the data for each panel thickness defines a different combined force vs. kinetic energy relationship, regardless of the tip radius mm 25.4 mm 50.8 mm 76.2 mm Impact Energy (J) Figure 10. Binomial regressions for impact energies on 8 ply panels
37 Damage Damage mm 25.4 mm 50.8 mm 76.2 mm Impact Energy (J) Figure 11. Binomial regressions for impact energies on 16 ply panels mm 25.4 mm 50.8 mm 76.2 mm Impact Energy (J) Figure 12. Binomial regressions for impact energies on 24 ply panels
38 Contact Force (kn) mm 25.4 mm 50.8 mm 76.2 mm Impact Energy (J) Figure 13. Impact energy vs. contact force for all tests. Solid markers are 8 ply tests, unfilled with thick borders are 16 ply tests, and unfilled with thin borders are 24 ply tests Figures show the binomial regression plots for the FTFs where the peak contact forces are those measured during each test. These FTF values are known to be intrinsic to the combination of panel thicknesses and impact tip radius, regardless of boundary condition [19, 10].
39 Damage Damage mm 25.4 mm 50.8 mm 76.2 mm Peak Contact Force (kn) Figure 14. Binomial regressions for peak contact forces on 8 ply panels mm 25.4 mm 50.8 mm 76.2 mm Peak Contact Force (kn) Figure 15. Binomial regressions for peak contact forces on 16 ply panels
40 Damage mm 25.4 mm 50.8 mm 76.2 mm Peak Contact Force (kn) Figure 16. Binomial regressions for peak contact forces on 24 ply panels Failure Threshold Forces and Energies The failure threshold force and energy data determined from binomial regressions are plotted in Figures 17 and 18 and Tables 2 and 3. The FTE and FTF can be seen to increase with impact tip radius, with this effect being greater on the 8 ply panels than for the 16 and 24 ply panels. This observation was consistent with the findings of Yang and Cantwell [14]. For the 76.2 mm tip, the FTE for the 8 ply panel was actually greater than for the two thicker panels. The differences in damage initiation between the panel thicknesses were due to different combinations of flexural and shear stresses being imposed by the various radius impacts. The 24 ply panels experienced much lower
41 26 flexural deformation during impact, so the force was mostly converted into transverse shear stresses, resulting in delamination damage. Fiber failure from flexural stress would require forces much higher than those that created delamination in this case. The 8 ply panels however, allowed for much more flexural deformation. This deformation created higher flexural stresses and prevented shear stress from building up. Tables 2 and 3 show the failure thresholds for both delamination and fiber breakage. The entries marked as NA indicates that the particular failure mode did not occur. The difference between the threshold for delamination and fiber failure is dependent on the thickness of the panel as well as the radius of the tip. The 8 ply panels had the smallest difference between delamination and fiber failure thresholds, with a 7% average change from the delamination FTF to the fiber failure. However, the average difference in delamination and fiber failure threshold forces for the 16 ply panels was 15%, and while no fiber failure was created in the 24 ply panels, the difference is expected to be even greater. This supports the idea that as the panel stiffness increases, more of the impact force is converted into shear stress than flexural stress, and so the difference between the delamination and fiber failure thresholds will be greater. The difference between the delamination and fiber failure thresholds decreases as the radius of the tip increases. For the 12.7, 25.4, 50.8, and 76.2 mm tips, the average changes between delamination FTF and fiber failure FTF were 54%, 21%, 3%, and 0% respectively. This is due to the combination of flexural and shear stresses from the impacts. The smaller tip radii have a smaller contact area, so the interlaminar shear stress around the border of the contact region will be higher, making delamination damage
42 27 more likely. The larger impact tip radii have larger contact areas and therefore lower interlaminar shear stresses around the border of the contact region. Therefore, less shear stress will develop and damage is more likely to be caused from flexural stresses, making fiber failure more likely. The reason the difference between the delamination FTF and the fiber failure FTF decreases with tip radius is because more of the impact force is being converted into shear stress for the smaller tip radii, and more of the impact force is being converted into flexural stresses for the larger tip radii. The difference in impact energy between the onset of delamination damage and fiber failure increases with panel thickness and decreases with impact tip radius. Due to these combined effects, the onset of fiber failure occurs at a lower impact energy than the onset of delamination damage in the 8 ply panels when impacted by a 76.2 mm tip. The onset of fiber failure occurs simultaneously with the onset of delamination damage in the 8 ply panels impacted by the 50.8 mm radius tips. In all other test conditions, delamination damage occurs at lower impact energy levels than fiber failure.
43 Failure Threshold Force (kn) Ply 16 Ply 24 Ply Impact Tip Radius (mm) Figure 17. Failure Threshold Forces Table 2. Delamination/fiber failure threshold forces (kn) for each panel thickness (T in number of plies) and impact tip radius (R in mm) Panel Type 8 Plies 1.7 FTF (kn) for Tip Radius (Fiber Failure Onset, kn) Thickness (mm) R12.7 R25.4 R50.8 R (6.6) 5.2 (5.7) 9.7 (9.7) NA (19.6) 16 Plies (9.9) 8.5 (10.9) 12.3 (13.0) 17.6 (17.6) 24 Plies (NA) 12 (NA) 14.3 (NA) 19.8 (NA)
44 Failure Threshold Energy (J) Ply 16 Ply 24 Ply Impact Tip Radius (mm) Figure 18. Failure Threshold Energies Table 3. Delamination/fiber failure threshold energies (J) for each panel thickness (T in number of plies) and impact tip radius (R in mm) Panel Type 8 Plies 1.7 FTE (J) for Tip Radius (Fiber Failure Onset, J) Thickness (mm) R12.7 R25.4 R50.8 R (16.3) 11.5 (12.2) 27.3 (27.3) NA (66.6) 16 Plies (22.2) 19.2 (28.5) 33.9 (36.2) 52.8 (52.9) 24 Plies (NA) 26.6 (NA) 35.2 (NA) 61.7 (NA)
45 Damage Visibility A common method of quantifying the visibility of damage is by using the depth of the dent left by the impact. Ideally, this depth which describes the surface deformations would correlate directly with the degree of internal damage. Figures show that the dent depth correlates with peak force (i.e. higher peak forces where damage formation corresponds with larger dent depths) particularly for the initial dents and for smaller radius impactor tips. Figure 22 shows that the delamination damage area has some correlation with peak force, meaning a relationship between dent depth and delamination area is implied. Again, this correlation is stronger for smaller-radius impactors and almost non-existent for the combination of largest-radius tip (76.2 mm) on thinnest panel (8 plies). Since there is a large range of scatter, and the relaxed dent depths often dropped to near zero, the lack of a visible dent does not necessarily guarantee that there is no internal damage present. This is supported by Wardle and Lagace [20], who concluded from their experiments that there was no clear relationship between dent depth and the internal damage. However, their experiments used a sharper impact tip (6.35 mm radius) and the impacts all had a peak contact forces below 3 kn. In the experiments presented here, blunter impact tips were used and contact forces were generated exceeding 20 kn.
46 Dent Depth (mm) Dent Depth (mm) mm 25.4 mm 50.8 mm 76.2 mm Peak Force (kn) Figure 19. Dent depth vs. peak contact force for 8 ply panel. Filled in data points indicate non damaging impacts, and open points indicate damaging impacts. The tail below each data point indicates relaxation of the dent. Points without a tail had no relaxation mm 25.4 mm 50.8 mm 76.2 mm Peak Force (kn) Figure 20. Dent depth vs. peak contact force for 16 ply panel. Filled in data points indicate non damaging impacts, and open points indicate damaging impacts. The tail below each data point indicates relaxation of the dent. Points without a tail had no relaxation
47 Delamination Area (mm 2 ) Dent Depth (mm) mm 25.4 mm 50.8 mm 76.2 mm Peak Force (kn) Figure 21. Dent depth vs. peak contact force for 24 ply panel. Filled in data points indicate non damaging impacts, and open points indicate damaging impacts. The tail below each data point indicates relaxation of the dent. Points without a tail had no relaxation mm 25.4 mm 50.8 mm 76.2 mm Peak Force (kn) Peak Force (kn) Peak Force (kn) Figure 22. Damage area vs. peak contact force for 8 (left), 16 (middle), and 24 (right) ply panels
48 33 Although the results from the impact tests do indicate that there is a correlation between internal damage and indentation, the usefulness of this relationship is questionable. Previous work has found that the visible threshold depth for a dent on a composite structure may be between 0.25 mm and 2.5 mm [21]. In this research, the largest dents created were all less than 0.25 mm. The only impacts that created dents greater than 0.25mm in depth also created visible cracks and significant fiber breakage on the front face of the panel. When such cracking exists on the impact-side, there is no need to rely on dent depth visibility to detect the presence of damage since the crack is much more easily detectable. The test results indicate that for this range of impact tip radii, significant damage occurs from impacts that create dents much shallower than these visible thresholds. Even though the dents created have been below the defined visual threshold for inspections, it does not mean that they are not identifiable. The visible thresholds of the dents refer to the detectability of the dents during an inspection of the aircraft. In other words, how easily the dents could be identified when the location of suspected damage is unknown. Based on observations from the experiments presented here, dents below 0.25 mm have been found to be readily observable. For impacts with the 12.7 mm tip, even dents as shallow as 0.02 mm could be seen with careful inspection in oblique lighting. However, the locations of the dents generated from these impacts are always known, so this level of visibility may only apply when an impact event is observed or when the area being inspected is relatively small. This emphasizes the necessity to report any observed impacts as soon as they occur. An unreported impact may cause a dent that will be
49 34 missed during subsequent blind inspections (i.e., location of the impact is not known a. priori), but when the location of the impact is known these shallow dents are much more likely to be identified since the exact location of the impact can be targeted for focused inspection. Another reason that observed impacts should be reported as soon as they occur is that the dents have a tendency to relax over time. Figures show the initial measured dent for each impact and underneath each data point is a tail indicating the relaxed dent depth measured over 24 hours after the impact occurred. Almost all impacts exhibited a measurable relaxation, and some even relaxed to less than 50% of their initial depth. For 8 ply panels, complete dent relaxation was even observed to occur (see Figure 19) for several cases. In order to investigate this dent relaxation further, the depth was recorded as a function of time for the case of identical 37 J impacts applied to a 24 ply panel with 12.7, 25.4, and 50.8 mm radius tips. Figure 23 shows these depth measurements over time. Measurements were taken up to 24 after the impacts, and again after even more time had passed, but after 6 hours no further relaxation was measurable. This relaxation phenomena further emphasizes the need to report any observed impacts quickly. Potential damage from impacts will be more difficult to locate after significant time passes before they are reported, not only because it will be more difficult to remember the exact impact site, but also because the visibility of the damage will be less evident. The amount that each dent relaxes relative to the initial depth generally decreases with increasing panel thickness and tip radius. Table 4 indicates the average percentage
50 Dent Depth (mm) 35 of relaxation from the initial dent depth for each tip radius and panel thickness. This can be explained by the reduction in interlaminar shear and bending stress as both the tip radius and panel thickness increase, which effectively reduces the peak strains and severity of damage that the impact event produces mm tip 25.4 mm tip 50.8 mm tip Time (Hours) Figure 23. Dent relaxation over time for 37 J impacts on a 24 ply panel
51 36 Table 4. Average percent change from initial to relaxed dent depth for each panel thickness (T in number of plies) and impact tip radius (R in mm) Panel Type Percent Dent Relaxation for Tip: Thickness (mm) R12.7 R25.4 R50.8 R Plies Plies Plies After the tests were run it was apparent that the shape of the dents were different depending on the radius of the impacting tip. To account for this, the span of each dent was measured by taking measurements every 1.58 mm (1/16 of an inch) along a path on the impact-side surface of the panel passing through the impact site. In order to avoid subjectivity from determining the span of the dents, the span of the dent was defined as the distance between those points on either side of the maximum depth location where the depth reached 1/3 the total depth. Figure 24 shows an illustration of how the span of a dent would be measured. After close inspection it was concluded that this threshold depth defining the span most closely matched the span over which the dent can be visually perceived to exist since contours and changes at depths less than 1/3 the total tended to be more gradual and thus difficult to perceive.
52 37 Figure 24. Illustration of dents with equal depth but different visibility (left) and equal visibility but different depth (right) Visibility of the dent depends on a combination of both the depth and the span. A dent with a short span will have sharper boundaries and will be more visible than a dent of equal depth but existing over a larger span (resulting in more smoothly-defined, shallower boundaries). Since the visibility of the dents increases with depth and decreases with span, a more comprehensive metric for describing the visibility can be defined as the ratio of dent depth divided by the dent span. Figure 24 shows an illustration of dents with equal depth but different depth/length ratio and dents with different depths but the same depth/span ratio. When relating this value of visibility to the delamination area, the correlation becomes more strongly dependent on the tip radius than when comparing dent depth alone. Figure 25 shows the dent depth vs. the delamination area, and Figure 26 shows the visibility (depth/span ratio) vs. delamination area for the 8, 16, and 24 ply panels. Both of these relationships are dependent on the impact tip radius, with the
53 Visibility (Depth / Span Ratio) Relaxed Dent Depth (mm) 38 smaller-radius tips exhibiting more dent visibility than larger-radius tips, for a given delamination area, particularly for the thicker panels mm 25.4 mm 50.8 mm 76.2 mm Delamination Area (mm 2 ) Delamination Area (mm 2 ) Delamination Area (mm 2 ) Figure 25. Damage area vs. relaxed dent depth for 8 (left), 16 (middle), and 24 (right) ply panels 7 x mm 25.4 mm 50.8 mm 76.2 mm Delamination Area (mm 2 ) Delamination Area (mm 2 ) Delamination Area (mm 2 ) Figure 26. Damage area vs. dent visibility for 8 (left), 16 (middle), and 24 (right) ply panels
54 39 Even if the dent from an impact could be located, determining the extent of damage from the characteristics of the dent remains a challenge. Figure 26 indicates that dents can have equal visibility but drastically different delamination areas based on the radius of the impactor. Figure 25 shows that looking at only the depth of the dent gives a weaker correlation with internal damage (i.e., there is more scatter range of delamination area for a given depth). Some low energy impacts from the 12.7 and 25.4 mm tips did not result in any internal damage, but created dents much more visible than impacts from the 50.8 and 76.2 mm tips that caused significant internal damage. As the radius of the impact tip increases, the visual evidence of damage decreases. Because of the strong dependence of the radius of the impactor on the visual and internal damage, determining internal damage level from visual damage could only be accurately accomplished if the radius of the impactor was known. This would be very difficult to determine in the field where even in witnessed events such as tool drops the radius of the impact tip would be difficult to determine as the tool could land in many different orientations. Since the radius of the impact is most likely not known for impacts on structures in the field, it cannot be concluded what size and kind of internal damage a visible dent may indicate, or in the case of the dent not being visible, whether or not there exists internal damage at all. 3.4 Force History Data Information regarding the nature of impact events has often been found by examining the force vs. time history. Appendix VI includes the force vs. time curves paired with the corresponding C-Scans for all impacts. They are organized by impact tip
55 Force (kn) 40 radius and panel thickness so that distinctive characteristics for each set of test parameters can be more easily identified. The force vs. time histories can reveal the occurrence of damage in two possible ways. The first is for a sharp section of oscillations to occur in a distinct section of the curve. This is seen in the 8 and 16 ply panels but not 24 ply panels. These oscillations indicated both delamination and fiber failure forms of damage. Figure 27 shows this type of response for a non-damaging (12.5 J, 6.5 kn peak force) and a damaging (23.3 J, 9.9 kn peak force) impact with a 12.7 mm tip radius on a 16 ply panel time(ms) time(ms) Figure 27. Force vs. time history for a non-damaging (12.5 J, 6.5 kn peak force) and a damaging (23.3 J, 9.9 kn peak force) impact with a 12.7 mm tip radius on a 16 ply panel The second way force curves could indicate damage was by the overall shape of the curve becoming distorted. In most cases a dip in the up-loading portion of the curve near the peak force can be observed. In some cases it could be seen that after an initial
56 Force (kn) 41 drop in force the load would increase again. This type of damage indication was only seen in the 24 ply panels, which only exhibited damage in the form of delamination (no fiber failure was created in any 24 ply panel). Figure 28 shows an example force history curve exhibiting these features. Both of these deviations from a simple half-sine like shaped force vs. time pulse indicate that damage has occurred, with the timing and force level of the onset of these deviations corresponding to the initiation of damage time(ms) time(ms) Figure 28. Force vs. time history for a non-damaging (10.7 J, 7.4 kn peak force) and a damaging (30.0 J, 12.5 kn peak force) impact with a 12.7 mm tip radius on a 24 ply panel The impact tip radius had a unique effect on the force history curves. Although the overall shape of the curve remained somewhat consistent, the magnitude and pulse duration were dependent on the tip radius. Figures show impacts that created similar levels of damage for each impact tip radius. The impacts plotted in the figures
57 42 correspond to the lowest energy impacts at which the presence of damage became evident in the force vs. time history curves. It can be seen from these figures that as the impact tip radius increases, the pulse time decreases and the peak force to create an initial level of damage increases. This decreasing critical force for smaller radius tips is due to the higher contact stresses and interlaminar shear stress developed by a smaller contact area for a given force level. It can also be seen that the differences between the curves for different tip radii become less distinct as the panel thickness increases. Figure 29. Damage indicating force pulses for 8 ply panels
58 43 Figure 30. Damage indicating force pulses for 16 ply panels Figure 31. Damage indicating force pulses for 24 ply panels
59 44 The thickness of the panels had a large influence on the force curves as well. The pulse time decreased with an increasing thickness, since the thicker panel is stiffer and thus dynamically responds at a higher frequency. Also, the peak force level required to create a certain level of damage increased with higher thickness since increased thickness results in lower interlaminar shear stress for a given radius tip and force level. This was the same effect that the tip radius had (i.e., increasing force for larger radius). The panel thickness however, also influenced the overall shape of the force curve. Impacts onto the 8 ply panels produced a more sinusoidal shape than the thicker panels. As seen in Figure 29, even though significant damage was evident, the overall shape of the curve was mostly unaffected for thinner panels. For the 24 ply panels however, the onset of damage greatly influenced the shape of the force curve. Figure 31 shows the typical shape of the force pulse from damaging impacts on 24 ply panels. The rate of force increases departs from the sine-type profile at the onset of damage and flattens out. This different force behavior for the panel thicknesses was most likely due to the ability of the thicker panels to develop alternate load paths, namely as planes of delamination are formed. With the 8 and 16 ply panels, the force curve peaks once damage has occurred and the onset of damage was indicated by the onset of distinct sharp oscillations in the curve. For the 24 ply panels however, the force continues to rise even after damage has occurred as new load paths develop, giving the pulse a distorted shape but no section of sharp oscillations as seen in the thinner panels. The difference between the 24 ply panels and the thinner panels may be a result of a difference in failure mode. In the 8 and 16 ply panels, damage was only evident in the
60 Contact Area (mm 2 ) 45 force vs. time histories when fiber breakage had occurred. There was no indication of damage in the force vs. time curves if only delamination had occurred. In the 24 ply panels, no fiber breakage was initiated for the range of impact energies investigated, and delamination was the only significant form of damage. For these panels, low levels of delamination were not detectable from the force vs. time histories, and there was only an indication of damage after larger amounts of delamination had occurred. 3.6 Contact Pressure The peak contact force was not dependent on the radius of the impact tip for impacts of the same energy on the same panel type. Figure 13 shows that a given energy level will correspond to a peak force independently of the tip radius. However, a blunter impact tip will create a larger contact area and require higher forces to produce damage. The kinetic energy vs. contact area can be seen in Figure mm 25.4 mm 50.8 mm 76.2 mm Kinetic Energy (J) Kinetic Energy (J) Kinetic Energy (J) Figure 32. Kinetic energy vs. contact area for 8 (left), 16 (middle), and 24 (right) ply panels
61 Average Contact Pressure (MPa) 46 The plots indicate that while the peak force may be the same for different tip radii, the contact area is strongly dependent on both the tip radius and panel thickness, and thus average contact pressure (calculated as peak force over contact area) will be different for varying radius impactors. It should be noted that the distribution of contact pressure throughout the entire contact region during an impact is not evenly distributed. It will typically be at a maximum in the center and greatly decrease at the boundaries. However, observing the average contact force can still offer some insight. Figure 33 shows the kinetic energy vs. the average contact pressure mm 25.4 mm 50.8 mm 76.2 mm Kinetic Energy (J) Kinetic Energy (J) Kinetic Energy (J) Figure 33. Kinetic energy vs. average contact pressure for 8 (left), 16 (middle), and 24 (right) ply panels An overall observation is that the average contact pressure increases for decreasing tip radius (smaller contact area), and also increases for thicker panels due to their higher stiffness (higher force). For the 76.2 mm radius tip, the contact pressure remains essentially constant for each panel type, despite the increasing peak force (see Figure 13). The other impact tip radii actually show a decrease in contact pressure as
62 47 kinetic energy increased. This indicates that the contact area increases with kinetic energy at a greater rate than the peak contact force does. It should be noted, however, that this decreasing contact pressure trend is dependent on the boundary conditions. For example, if the dimensions of the panel were much smaller, the global stiffness of the panel would be higher and the total deflection of the panel would be less. This smaller deflection would result in smaller contact areas and the average contact pressure could potentially increase with kinetic energy. The important observation from Figures 32 and 33 are that the contact area and average contact pressure are dependent on the impact tip radius. For a given kinetic energy, sharper radius tips will create much higher average contact pressures than blunter tips. Finally, from viewpoint of visibility, if the contact pressure is high enough, the panel surface could form a local indentation due to direct contact pressures, thereby leaving more visible dents. As indicated by Figure 33, this could more likely happen for smaller radius tips impacting thicker panels. 3.5 Microscopy In order to further investigate the damage morphology within the panels, a few select specimens were sectioned for microscope inspection. This was done by cutting through the impact site in the zero degree direction. This section of panel was then mounted in epoxy (see Figure 34) and then polished using five levels of sand paper with a progressively finer grit, the final level being 14,000 grit.

63 48 Figure 34. Panel section prepared for microscopy mounted in epoxy Figure 35 shows the cross section of a 16 ply panel damaged from a 12.7 mm radius tip impact. The figure also shows the corresponding C-Scan map indicating the cross section from the microscope image. The 31 J impact created 225 mm 2 of delamination damage and a small amount of backside fiber failure. The residual surface dent measured for this impact was 0.11 mm. This image shows that the surface dent is more evident on the impact side, with the permanent deformation propagating through the first plies and gradually decreasing as it reaches the back face. This clearly shows that such surface dents were not simply a result of the layer of paint on the front surface (see uppermost white layer in Figure 35) being compressed, and shows that the composite plies are in fact being permanently deformed by the impacts. Delamination can be identified in the panel at the mid-plane between the center two 45 degree plies, and between the 5 th and 6 th plies from the bottom, which are 0 and 45 degree plies respectively.

64 49 Figure 35. Microscope image and C-Scan map of test LV-021, 16 ply panel impacted with 31 J by a 12.7 mm tip Figure 36 shows an image of this same section with increased magnification. Matrix cracks in the 8 th and 9 th plies are indicated in the figure, these can be seen on either side of the center of the impact in Figure 35 as well. These matrix cracks are at a 45 degree angle relative to the impact, indicating that they are a result of transverse shear stresses. The cracks are also at the center of the laminate, where the shear stress is the highest. These matrix cracks do not typically result in significant losses in residual strength, but they do serve as flaws that allow delamination to initiate [9].

65 50 Figure 36. Microscope image of test LV-021 with increased magnification Figure 37 shows a 16 ply panel damaged with a 76.2 mm radius tip by a 55 J impact, which created 248 mm 2 of delamination and back side fiber breakage. In this image there is no obvious indication of a dent, and no measurable residual dent was detected. Furthermore, unlike the 12.7 mm impact shown in Figure 35, the delamination planes are not clearly visible for the larger-radius impactor.
 has occurred in the 2 nd, 3 rd, and 4 th plies from the bottom (a small portion of the cracks are indicated in the")
66 51 Figure 37. Microscope image of test LV-113, 16 ply panel impacted with 55 J by a 76.2 mm tip Figure 38 shows the same panel as in Figure 37 with increased magnification. This image shows that a large amount of matrix cracking (see faint vertical lines) has occurred in the 2 nd, 3 rd, and 4 th plies from the bottom (a small portion of the cracks are indicated in the figure, there are many more cracks along these plies, although they can be difficult to see). Unlike the cracks shown in Figure 34, these cracks are parallel to the direction of the impact and are on the back portion of the laminate rather than at the center, which indicates that they were caused by tensile bending stresses.

67 52 Figure 38. Microscope image of test LV-113 with increased magnification The matrix cracks in the microscope images are direct evidence that damage is being created by different mechanisms for impact tips of different radius. The sharper 12.7 mm tip impacts result in a smaller contact area, and create higher interlaminar shear stresses around the border of the contact region (i.e., in shear plug mode). The blunter 76.2 mm radius tip has a larger contact area and lower shear stress around the periphery. In order to initiate damage with the 76.2 mm tip, comparatively high contact forces and flexural stresses had to be developed, which required more energy than for failure resulting from the shear stress from the 12.7 mm radius tip.
68 CHAPTER 4: DISCUSSION AND CONCLUSIONS The failure modes of unidirectional carbon/epoxy composite panels subjected to low velocity impacts are complex and often leave little or no visible evidence of the existence damage, particularly for contact with large radius objects. Due to the increased use of composites in the aerospace industry, a more comprehensive understanding of the response of composite materials subject to a broader variety of impact loading is necessary. Experimental data were collected in order to investigate the damage initiation in composite panels subjected to low velocity impacts. Of major interest is the relationship between the development of externally visible damage and the extent of internal damage and how damage is affected by impactor radius. In these experiments, carbon/epoxy panels of 8, 16, and 24 ply thicknesses (1.7 mm to 4.9 mm) were impacted with steel tips having radii of 12.7, 25.4, 50.8, and 76.2 mm. For a given impact energy, peak contact force is not dependent on the radius of the impact tip, but mainly on the panel stiffness which is affected by the thickness, layup, and boundary conditions. However, the contact area and average contact pressure are strongly dependent on the tip radius. Thus, for a given energy and panel thickness, a larger-radius impact tip will produce the same peak force but a larger contact area than a smaller impact tip. A blunter tip distributes the contact force over a larger area, thereby developing lower interlaminar shear stress around the periphery of this contact area, and thus resulting in higher failure threshold with increasing tip radius. This effect is greater in the 8 ply panels than in the 16 or 24 ply panels. This is because the impact force 53
69 54 excites a combination of flexural and shear deformation, and also due to the reduced stiffness of the thinner panel. The thicker panels are stiffer and thus undergo much less flexural deformation. Thus, the impact generates higher contact forces that in turn produce high interlaminar shear stresses which induce delamination. However, the more compliant 8 ply panels undergo larger amounts of flexural deformations and thus lower contact force develops, resulting in reduced shear stress but increased flexural stress. Failure of a composite panel in bending is typically in the form of back face fiber breakage, usually just the backside adjacent one or two plies fail. For the 8 ply panels, fiber failure actually preceded delamination when impacted by the 50.8 or 76.2 mm tips (for the 12.7 and 25.4 mm tips delamination was still the initial form of failure). The failure thresholds of thinner panels, where bending failure response is dominant, are therefore more strongly affected by the tip radius geometry since the thinner panels are able to more closely conform to the tip s radius, thereby controlling the peak local bending stress. This relationship weakens as the panel flexural stiffness (panel thickness) increases. For the 76.2 mm tip, the FTE is actually higher in the 8 ply panels than in the 16 or 24 ply panels. Since visual inspection is the cheapest and most efficient method of inspecting an aircraft, a relationship between the presence of internal damage and the formation of visually-detectable evidence of this damage s presence, is desirable. Results show that for the 12.7 and 25.4 mm radius tips, relationships can be drawn between the dent depth and the delamination area. However, the usefulness of these relationships is questionable since the correlation between delamination area and dent depth is very dependent on the
70 55 impact tip radius, a parameter which is not always known except in a lab environment. Therefore, unless the radius of the impact tip is known, it will not be possible to relate the dent depth to an accurate estimate the internal damage size, particularly delamination. Even if the impact event is witnessed, determining the impacting radius can be difficult since an object could potentially impact the structure in many different orientations. For the larger radius impact tips (50.8 mm and 76.2 mm), no such relationship between dent depth and delamination can be observed over the range of energies tested and for the modes of damage produced (namely delamination and some small backside fiber failure). If a relationship does exist at higher energies, it would only be evident at impact energies that far exceed the FTE. Surface dents can be further described by measuring the span of the dents. A dent with a larger span will have more gradual boundaries and will therefore be less visible than a dent of equal depth but shorter span. A metric of visibility was defined as the depth of the dent divided by the span. However, relating this quantity to the delamination size produces similar results as when relating to the raw dent depth alone. The correlations for the sharper impact tips are still dependent on the tip radius, and no strong correlation emerges from the blunter impact tips. When an impact event such as a tool drop is witnessed, it is important to report the event as soon as possible based on two factors that were observed in this experiment. The first is that none of the dents created exceeded the depth that would be considered detectable during a visual inspection, but many of them were still easily detected when closely examined. This is because when the location of an impact is known and that area
71 56 is closely inspected, even very shallow dents (e.g., less than 0.05 mm) can be found. This is particularly important for very large structures where small depth dents (less than 0.25 mm) would normally not be visible. Therefore, if an impact is reported quickly, or if its location is marked/tagged, it is much more likely that the exact location of the impact is identified and the inspection and repair will be much more efficient. The second reason it is important to report witnessed impacts quickly is that the dents were observed to relax over time. Almost all dents exhibited some degree of relaxation, and time dependent studies indicate that it only takes six hours for the dents to relax to their final state. Not only will it be harder to remember exactly where an impact occurred when the event is not reported quickly, but the visual evidence of the impact will actually reduce as time passes. For this material system, the dents relaxed to their final state after six hours. Future work could consider residual strength testing to further determine what type of performance reduction would result from these types of impacts. Residual strength has been related to the extent and type of damage in the past, but it has been shown here that damage from different tip radii is induced by two separate mechanisms (shear or bending stresses) which are affected by the impactor tip geometry. Therefore, a direct comparison between the residual strength and the impact characteristics measured in these experiments (i.e., damage visibility, peak force, contact pressure, etc.) would be useful, especially with regards to the radius of the impact tip. Different layup orientations could also be considered. The layups used in this experiment were quasiisotropic and had even distributions of 0, 90 and +/-45 degree plies, and were not tailored to any specific aerospace structure. However, interlaminar shear stresses are dependent
72 57 on the layup orientation, and different layups could affect the damage initiation thresholds as well as the damage visibility.
73 REFERENCES [1] Y. P. Siow and V. P. W. Shim, "An Experimental Study of Low Velocity Impact Damage in Woven Fiber Composites," Journal of Composite Materials, vol. 32, no. 12, [2] R. McAdam, T. O'Hare and S. Moffett, "Collaborative Knowledge Sharing in Composite New Product Development: An Aerospace Study," Technovation, vol. 28, no. 5, pp , [3] D. S. Cairns and P. A. Lagace, "Thick Composite Plates Subjected to Lateral Loading," ASME Journal of Applied Mechanics, vol. 54, pp , [4] N. R. Adsit and J. P. Waszczak, "Effect of Near-Visual Damage on the Properties of Graphite/Epoxy," Composite Materials: Testing and Design, Fifth Conference, American Society for Testing and Materials, New Orleans, March [5] C. T. Sun, "An Analytical Method for Evaluation of Impact Damage Energy of Laminated Composites," Composite Materials: Testing and Design (Fourth Conference), American Society for Testing and Materials. pp , May [6] E. Wu and K. Shyu, "Response of Composite Laminates to Contact Loads and Relationship to Low-Velocity Impact," Journal of Composite Materials, vol. 27, no. 15, [7] J. Willis, "Hertzian Contact of Anisotrpotic Bodies," Journal of Mechanics and Physics of Solids, vol. 14, pp , [8] S. H. Yang and C. T. Sun, "Indentation Law for Composite Laminates," AM. Soc. Test. Mater, [9] P. Sjöblom and T. Hartness, "On Low-Velocity Impact Testing of Composite Materials," Journal of Composite Materials, vol. 22, pp , [10] G. Schoeppner and S. Arbrate, "Delamination Threshold Loads For Low Velocity Impact on Composite Laminates.," Composites Part A: Applied Science and Manufacturing, vol. 31, pp , [11] X. Zhang, "Impact damage in composite aircraft structures- experimental testing and numerical simulation," Proceedings of the Institute of Mechanical Engineers, Part G: Journal of Aerospace Engineering, vo. 212, pp , April [12] G. Davies and X. Zhang, "Impact Damage Prediction in Carbon Composite Structures," International Journal of Impact Engineering, Vol. 16, pp ,
74 59 [13] D. Whisler and H. Kim, "Effect of impactor radius on low-velocity impact damage of glass/epoxy composites," Journal of Composite Materials, p. DOI / , [14] F. J. Yang and W. J. Cantwell, "Impact Damage Initiation in Composite Materials," Composites Science and Technology, vol. 70, no. 2, pp , [15] B. L. Wardle and P. A. Lagace, "On the Use of Dent Depth as an Impact Damage Metric for Thin Composite Structures," Journal of Reinforced Plastics and Composites, vol. 16, no. 12, [16] T. Anderson and E. Madenci, "Experimental Investigation of Low-Velocity Impact Characteristics of Sandwich Composites," Composite Structures, vol. 50, no. 3, pp , [17] C. T. Sun, A. Dicken and H. F. Wu, "Characterization of Impact Damage in ARALL Laminates," Composites Science and Technology, vol. 49, no. 2, pp , [18] ASTM Standard, D7136, "Standard Test method for Measuring the Damage Resistance of a Fiber-Reinforced Polymer-Matrix Composite to a Drop-Weight Impact Event", ASTM International [19] W. C. Jackson and C. J. Poe, "The use of impact force as a scale parameter for the impact response of composite laminates," NASA Technical Memorandum AVSCOM Technical Report 92-B-001, January [20] B. Wardle and P. Lagace, "On the Use of Dent Depth as an Impact Damage Metric for Thin Composite Structures," Journal of Reinforced Plastics and Composites, vol. 16, no. 12, [21] "Military Handbook 17 - MIL-HDBK-17-3F: Composite Materials Handbook, Volume 3 - Polymer Matrix Composites Materials Usage, Design, and Analysis, Chapter 7," U.S. Department of Defense. June 2002, Chapter 7 [22] K. F. Ryan, "Dynamic Response of Graphite/Epoxy Plates Subjected to Impact Loading.," TELAC Report M.S Thesis, Massachusetts Institute of Technology, Vols , 1990.
75 APPENDICES Appendix I. Impact Force Correction During an impact event using the pendulum a transducer is used to measure the force data, the raw data from this transducer however is not the actual force seen at the point of impact. This is because of the hardened steel tip that experiences the impact before the force transducer. Because this mass is between the site of the impact and the force transducer, the force measured by the transducer will be less than the force at the point of impact. Two methods were used to determine the difference between the force measured and the actual force at the tip of the pendulum. In the first method, used by Ryan [22], the mass of the pendulum is split halfway through the force transducer to create two free body diagrams (see Figure 39). The equation of motion for both bodies together can be written: Where F is the force at the tip, m 1 is the mass of the tip and half the mass of the force transducer, m 2 is the total pendulum mass minus m 1, and a is the acceleration. The equation of motion for just the back end of the pendulum can be written as: 60
76 61 Where F T is the force measured by the transducer. Assuming that both sections have the same acceleration, equations (A1) and (A2) can be used to find the force at the tip in terms of the force in the transducer by solving for a and equating them: Figure 39. Pendulum Free Body Diagram For the second method the pendulum is split through the force transducer to make a free body diagram in the same way as the first method. In this model however, the stiffness of the force transducer is used to model the pendulum as a spring-mass system (see Figure 40). Figure 40. Pendulum as spring-mass system The equations of motion for the two masses x 1 and x 2 are written as:
77 62 In these equations is the acceleration and x is the displacement of each mass, F(t) is the force pulse applied at the tip, and k is the stiffness of the force transducer given by the manufacturer. Equations (A4) and (A5) can be solved to get the total displacement of the spring: (x 1 -x 2 ). (See Appendix Ia for solution method.) The force in the transducer can then be found using the spring-mass relation F=kx. This will be the force that the transducer should measure based on the impulse force applied to the system, so the relationship between the force at the tip to the force in the transducer can be determined. Table 5 shows the mass and force correction factors determined from each method for each impact tip. The difference between the two methods is very small, only about 0.3% for each tip. Because the vibration method takes into account more dynamic behavior of the system, the correction factors determined using that method were used when determining the force for the tests. Table 5. Force correction factors determined using constant acceleration and vibration analysis Tip Radius (mm) Constant Acceleration Factor Tip Mass (g) Vibration Factor
78 63 Appendix Ia. Solving Force Correction Vibration Equations with MATLAB: Equations (A4) and (A5) can be solved using the built in differential equation solvers in MATLAB. These solvers can only solve first order differential equations however, so the equations are manipulated to reduce the order. To do this, new variables are introduced, y 1 and y 2, such that: Using these new variables equations (A4) and (A5) can be re-written as: Now equations (A6) through (A9) give a system of four first order linear differential equations with four unknowns instead of two second order differential equations with two unknowns. The force pulse, F(t), can be approximated as a half sine wave.
79 64 Where A is the maximum amplitude and ω is the period of the pulse, or pi divided by the duration of the force pulse. MATLAB has several solvers for ordinary differential equations, but in order to use them the differential equations need to be called as a function handle. This means that the equations need to be stored as a separate function. Here is an example of how create a function with equations (A6)-(A9) above: For this example k = 9 x 10 9 N/m, m1 = 0.5 kg, m2 = 5.5 kg, peak force = 4 kn, and the force pulse is seconds. function xprime = Vib_ode(t,x) % Since the states are passed in as a single vector, let % x(1) = x1 % x(2) = x2 % x(3) = y1 % x(4) = y2 k=9e9; m1=0.5; m2=5; w=pi/0.0005; F=4e3*sin(w*t); xprime(1) = x(3); xprime(2) = x(4); xprime(3) = ((k*(x(2)-x(1)))+f)/m1; xprime(4) = (k*(x(1)-x(2)))/m2; xprime = xprime(:);% This ensures that the vector returned is a column vector end Now the four equations are stored as a function, and can be called by a MATLAB solver such as ode45. Below is a script that solves the equations using the MATLAB solver
80 65 ode45 and calculates what the force in the force transducer will be (using F=k((x 1 -x 2 )) relative to the impulse force. t0=0; tf= k=9e9; w=pi/0.0005; x0 = [ ]; [t,s] = ode45(@vib_ode,[t0,tf],x0); x1=s(:,1); x2=s(:,2); fc=k*(x1-x2); %calculated force in transducer fp=4e3*sin(w*t); %force pulse approximated as a sine wave Fa=max(fp)/max(fc); fprintf('f_tip = %4.4f x F_gauge\n\n', Fa) The output of this code reads: F_tip = x F_gauge This indicates that the force at the tip of the impactor is 4.62% greater than the force measured by the transducer. A plot can be made showing the original force pulse (approximated by a sine wave), and the force in the transducer as calculated above. figure hold on plot(t,fc,'r-') plot(t,fp,'b-') title('force Analysis') xlabel('time (s)') ylabel('force (N)') legend('force Pulse', 'Force in Transducer')
81 Force (N) 66 Force Analysis 4000 Force Pulse Force in Transducer time (s) x 10-4 Figure 41. Force pulse at impact site and in the transducer
82 67 Appendix II. Potential Energy Calculations In order to calculate the height of the pendulum required for a desired potential energy, an energy balance model is used (see Figure 42). Figure 42. Pendulum energy balance model In order to analyze the energy of the pendulum system, it will be broken down into two components. The first part is the concentrated mass, m, which is a distance L away from the pivot point O. The second part is the fiberglass bar that has a mass of m B,
83 68 which acts through the centroid of the bar a distance L B away from point O. When the arm is rotated by an angle of θ, the change in height of the mass is: And the change in height of the centroid of the bar is: The potential energy is: Substituting equations A11 and A12 into A13 and simplifying the result: The kinetic energy of a heavy mass on the end of a rotating bar is: Where J B is the rotational inertia: Substituting A17 into A16 and simplifying gives:
84 69 Assuming that all of the potential energy is converted into kinetic energy, KE=PE, equations A15 can be set equal to A18: Solving this equation for velocity gives: In order to facilitate calculating the height for each test, a MATLAB function was created to incorporate these calculations. The inputs are the initial step (the angle that the encoder wheel reads when the pendulum is touching the panel), the desired potential energy, and either the impact tip or mass of the head of the pendulum. The encoder wheel measures the angle of the pendulum arm in tenths of a degree so the output is a four digit integer (for example, 145 degrees = 1450). Since the pendulum can only be set to the nearest tenth of a degree, the MATLAB function calculates the exact angle of the arm for the desired potential energy, and then calculates and reports the energy at the angles rounded up and down to the nearest tenth of a degree. function Potential_Energy2 %%% -- ENTER TEST DATA -- STEP=input('Initial STEP = '); PE=input('Potential Energy = '); tip=input('tip Radius = '); if tip==50.8 MASS=4.813; %R50.8mm elseif tip==152.4 MASS=4.849; %R152.4mm elseif tip==101.6 MASS=4.841; %R101.6mm elseif tip==12.7
85 70 MASS=4.240; %R12.7mm elseif tip==25.4 MASS=5.013; %R=25.4mm else MASS=input('Pendulum Mass = '); end %%% -- CONSTANT DATA -- MBAR=0.838;%Mass of the fiberglass bar L=1.4224;%dist from pivot to mass CG G= ; %%% -- CALCULATIONS -- LB= ; %dist. from pivot to bar CG THETA=acosd(1-PE/(G*(MBAR*LB+MASS*L))); VEL=L*sqrt((G*(1- cosd(theta))*(mbar*lb+mass*l))/(((1/6)*mbar*lb^2)+(0.5*mass*l^2))); KE=(1/6)*MBAR*LB^2*(VEL/L)^2+0.5*MASS*VEL^2; HGT=STEP-(10*THETA); LOW_H=ceil(HGT);%LOW ENERGY HEIGHT LOW_T=(STEP-LOW_H)/10; LOW_STEP=STEP-(10*LOW_T); LOW_V=L*sqrt((G*(1- cosd(low_t))*(mbar*lb+mass*l))/(((1/6)*mbar*lb^2)+(0.5*mass*l^2))); LOW_E=(1/6)*MBAR*LB^2*(LOW_V/L)^2+0.5*MASS*LOW_V^2; HI_H=floor(HGT);%HIGH ENERGY HEIGHT HI_T=(STEP-HI_H)/10; HI_STEP=STEP-(10*HI_T); HI_V=L*sqrt((G*(1- cosd(hi_t))*(mbar*lb+mass*l))/(((1/6)*mbar*lb^2)+(0.5*mass*l^2))); HI_E=(1/6)*MBAR*LB^2*(HI_V/L)^2+0.5*MASS*HI_V^2; HEIGHT=L*(1-cosd(THETA)); fprintf('\nenergy= %4.4fJ vel= %4.4fm/s\n',PE,VEL) fprintf('step= %4.4g for high energy of %4.4fJ\n',HI_STEP,HI_E) fprintf('step= %4.4g for low energy of %4.4fJ\n',LOW_STEP,LOW_E) fprintf('height= %4.4f m\n\n',height) As an example, if we input 2600 as the initial step, 15 J as the potential energy, and 12.7 mm as the impact tip radius, the output of the function would read: ENERGY= J vel= m/s STEP= 2202 for high energy of J STEP= 2203 for low energy of J HEIGHT= m
86 71 Appendix III. Testing Checklist Pre-test -Tighten pendulum head and bolts on fixture -Set voltage scale, time capture range, and trigger value on picoscope -Test that force gauge and laser are capturing properly -Make sure all cables are properly connected -Make sure pendulum is secured at a low angle to the safety restraint before working in test area Test Procedure 1. Insert specimen into test fixture, mark corners to specify impact zone, write test number on upper left corner 2. Record test specifications: Date, target ID, target hit #, tip radius, pendulum height, potential energy 3. Turn on airflow for pneumatic release mechanism 4. Attach pendulum to release mechanism 5. Set up contact sheet and mark pendulum tip with dry erase 6. Set desired pendulum angle with crank based on target potential energy level 7. Set capture mode on picoscope and confirm capturing status in lower right corner 8. Clear any obstructions in path of pendulum 9. Impact panel by pressing open button, make sure to catch the pendulum carefully after impact to prevent multiple strikes. 10. Save test data 11. Secure pendulum with safety restraint before entering impact area 12. Measure indentation depth 13. A-scan impacted area to detect damage 14. If there is no damage and the panel has been hit less than three times on this impact zone then return to step If there is damage or the specimen has been impacted three times, move on to the next impact zone of the specimen. If this was the last impact zone then remove the specimen for C-scanning.
87 Appendix IV. Data Summary Table 72
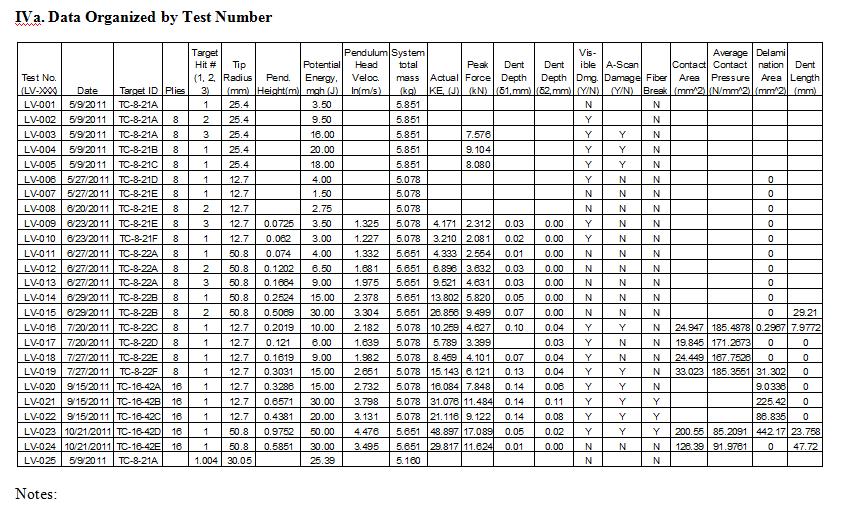
88 73
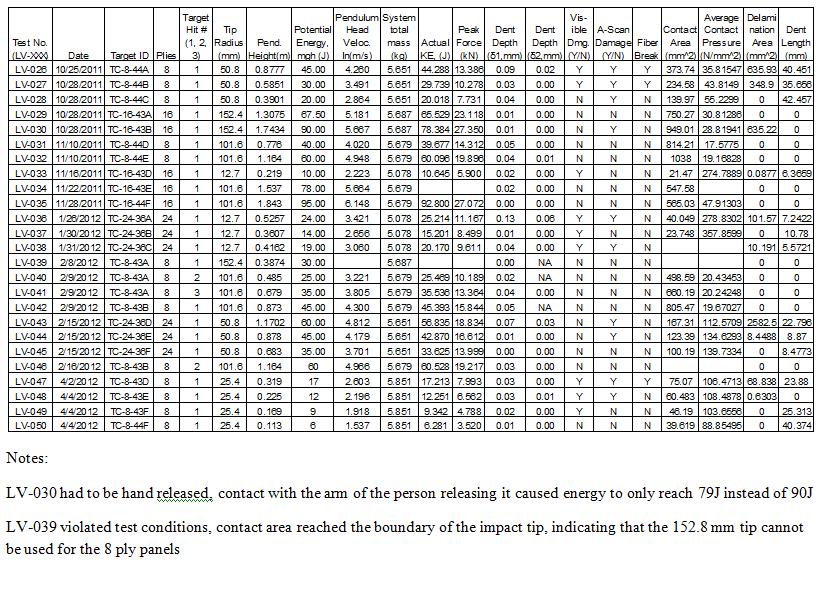
89 74
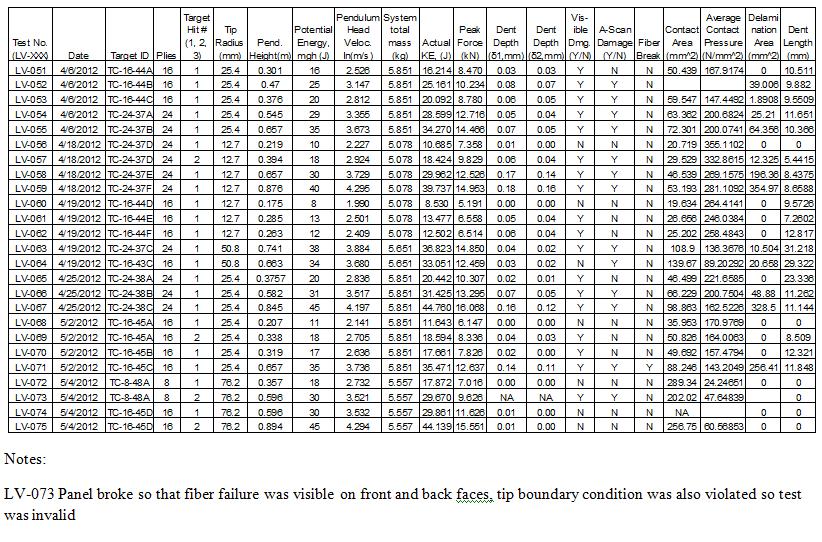
90 75
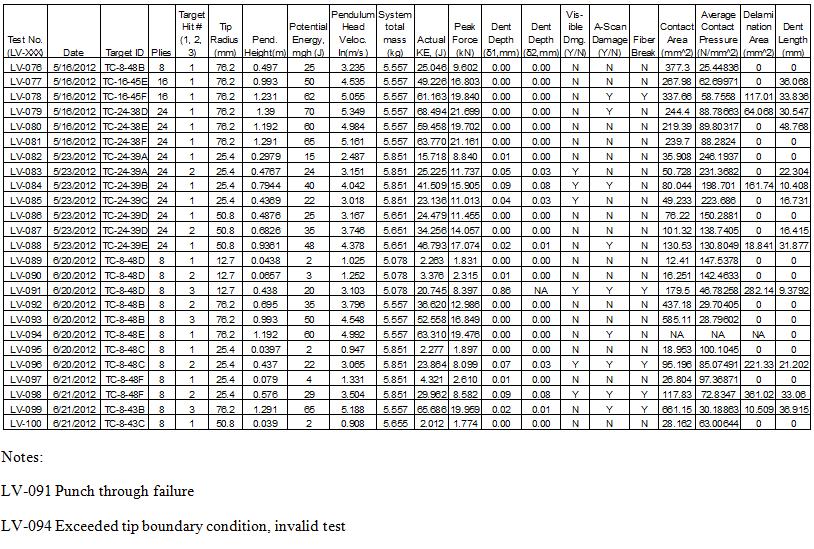
91 76
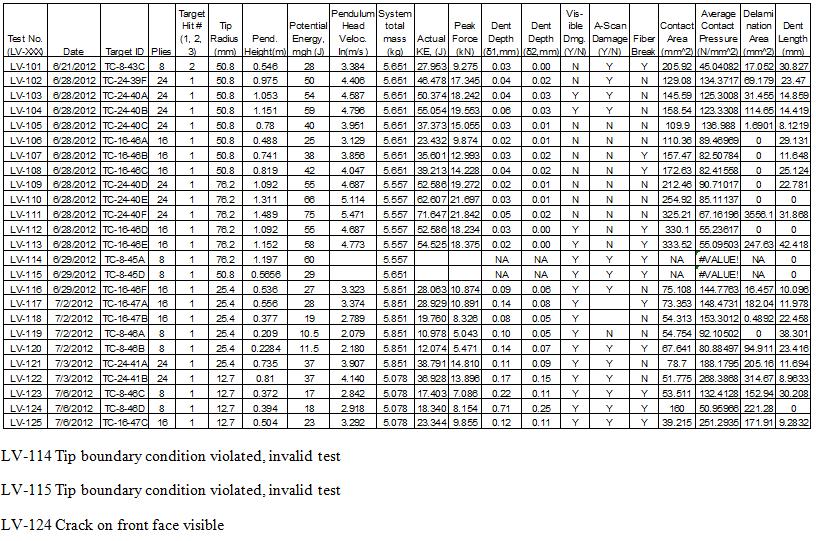
92 77
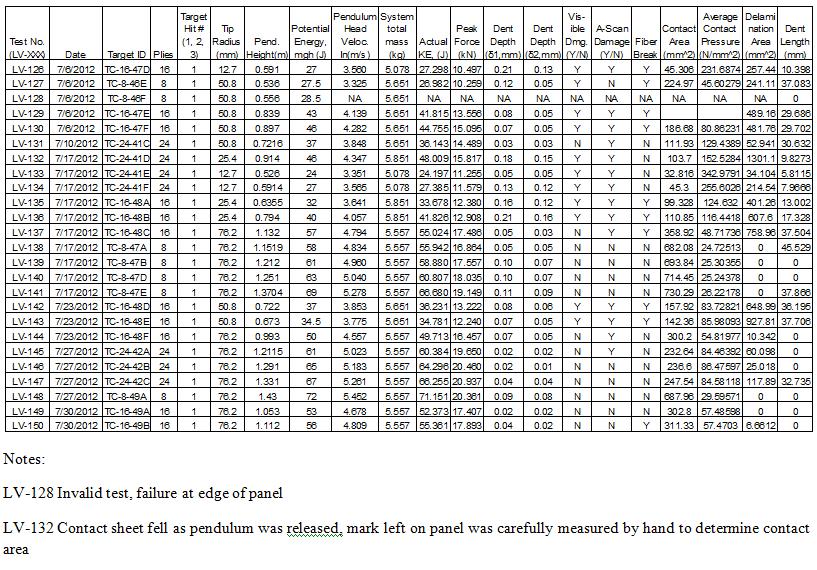
93 78
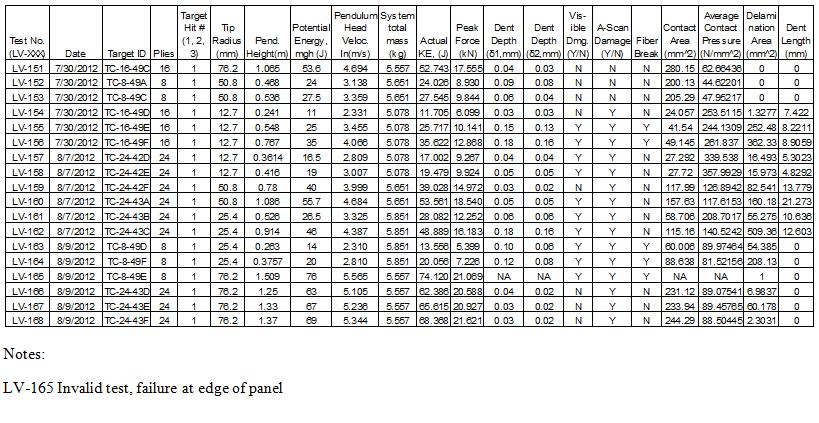
94 79
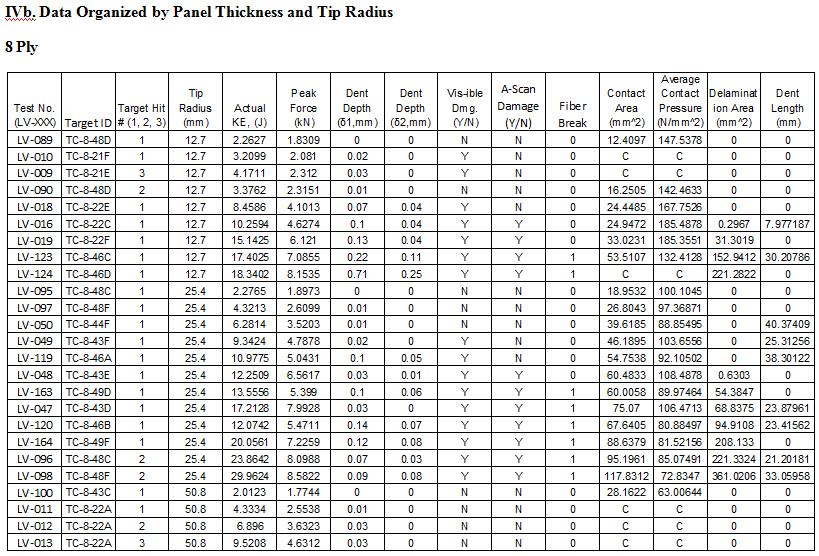
95 80
96 81 Test No. (LV-XXX) Target ID Target Hit # (1, 2, 3) Tip Radius (mm) Actual KE, (J) Peak Force (kn) Dent Depth (δ1,mm) Dent Depth (δ2,mm) Vis-ible Dmg. (Y/N) A-Scan Damage (Y/N) Fiber Break Contact Area (mm^2) Average Contact Pressure (N/mm^2) Delaminat ion Area (mm^2) LV-014 TC-8-22B N N 0 C C 0 0 LV-028 TC-8-44C N Y LV-152 TC-8-49A N N LV-015 TC-8-22B N N 0 C C LV-153 TC-8-49C N N LV-101 TC-8-43C N Y LV-127 TC-8-46E Y N LV-027 TC-8-44B Y Y LV-026 TC-8-44A Y Y LV-072 TC-8-48A N N LV-076 TC-8-48B N N LV-092 TC-8-48B N N LV-093 TC-8-48B N N LV-138 TC-8-47A N N LV-139 TC-8-47B N N LV-140 TC-8-47D N N LV-141 TC-8-47E N N LV-099 TC-8-43B N Y Dent Length (mm)
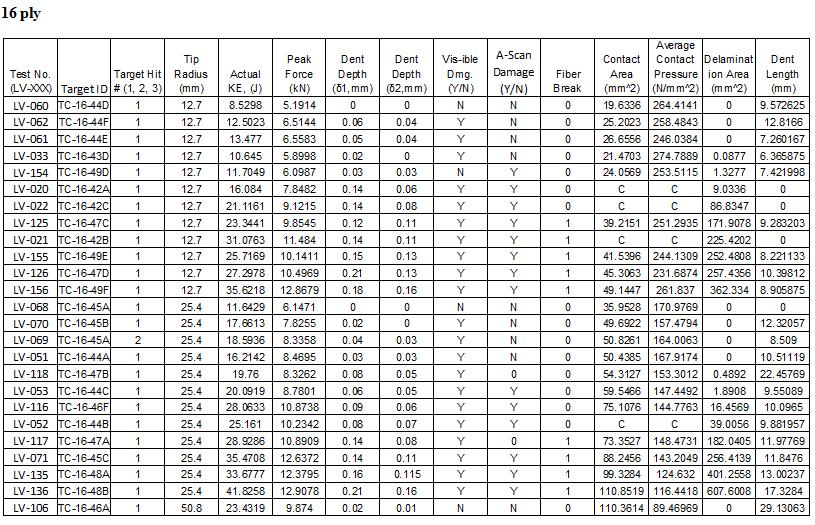
97 82
98 83 Test No. (LV-XXX) Target ID Target Hit # (1, 2, 3) Tip Radius (mm) Actual KE, (J) Peak Force (kn) Dent Depth (δ1,mm) Dent Depth (δ2,mm) Vis-ible Dmg. (Y/N) A-Scan Damage (Y/N) Fiber Break Contact Area (mm^2) Average Contact Pressure (N/mm^2) Delaminat ion Area (mm^2) LV-024 TC-16-42E N N LV-107 TC-16-46B N N LV-108 TC-16-46C N N LV-025 TC-16-42F N Y LV-064 TC-16-43C N Y LV-023 TC-16-42D Y Y LV-130 TC-16-47F Y Y LV-129 TC-16-47E Y Y 1 C C LV-142 TC-16-48D Y Y LV-143 TC-16-48E Y Y LV-074 TC-16-45D N N 0 NA NA LV-075 TC-16-45D N N LV-077 TC-16-45E N N LV-149 TC-16-49A N N LV-151 TC-16-49C N N LV-112 TC-16-46D Y N LV-150 TC-16-49B N N LV-144 TC-16-48F N Y LV-078 TC-16-45F N Y LV-113 TC-16-46E Y N LV-137 TC-16-48C N Y Dent Length (mm) Profile Depth (mm)
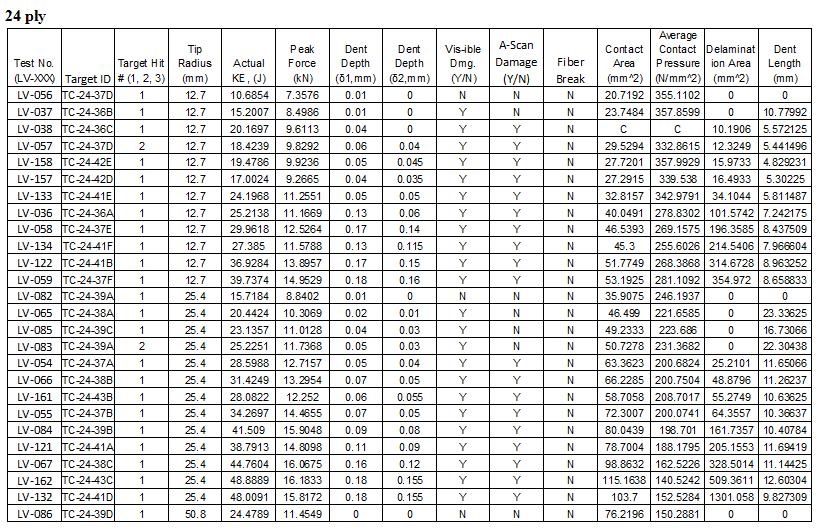
99 84
100 85 Test No. (LV-XXX) Target ID Target Hit # (1, 2, 3) Tip Radius (mm) Actual KE, (J) Peak Force (kn) Dent Depth (δ1,mm) Dent Depth (δ2,mm) Vis-ible Dmg. (Y/N) A-Scan Damage (Y/N) Fiber Break Contact Area (mm^2) Average Contact Pressure (N/mm^2) Delaminat ion Area (mm^2) LV-045 TC-24-36F N N N LV-087 TC-24-39D N N N LV-105 TC-24-40C N N N LV-044 TC-24-36E N Y N LV-063 TC-24-37C Y Y N LV-088 TC-24-39E N Y N LV-103 TC-24-40A Y Y N LV-131 TC-24-41C N Y N LV-102 TC-24-39F N Y N LV-159 TC-24-42F N Y N LV-104 TC-24-40B Y Y N LV-160 TC-24-43A Y Y N LV-043 TC-24-36D N Y N LV-109 TC-24-40D N N N LV-080 TC-24-38E N N N LV-081 TC-24-38F N N N LV-110 TC-24-40E N N N LV-168 TC-24-43F N Y N LV-166 TC-24-43D N Y N LV-146 TC-24-42B N N N LV-145 TC-24-42A N Y N LV-167 TC-24-43E N Y N LV-079 TC-24-38D N Y N LV-147 TC-24-42C N N N LV-111 TC-24-40F N N N Dent Length (mm)
101 86 Appendix V. Contact Area Plots Square shown in each plot has dimension x mm. Contact area reported in Appendix IV.
102 87
103 88
104 89
105 90
106 91
107 92
108 93
109 94
110 95
111 96
112 97
113 98
114 99
115 100
116 101
117 102
118 103
119 104
120 105
121 106
122 107
123 108
124 109 Appendix VI. Force and C-Scan Data Plots are included here of the force vs. time history and C-Scans for each impact. When visually inspecting this data it was convenient to look at both the force curve and C-Scan data together for comparison, so they are paired for each impact here. They are organized by impact tip radius and panel thickness to facilitate the comparison of similar tests. Peak force and damage area for each test are reported in Appendix IV. VIa mm tip, 8 ply panel
125 110
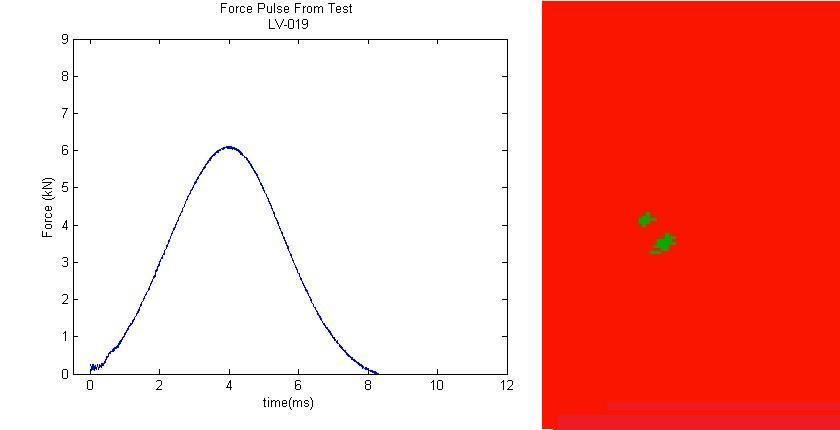
126 111

127 12.7 mm tip, 16 ply panel 112
128 113
129 114
130 115
131 12.7 mm tip, 24 ply panel 116
132 117
133 118
134 119
135 120
136 VIb mm tip, 8 ply panel 121
137 122
138 123
139 124
140 25.4 mm tip, 16 ply panel 125
141 126
142 127
143 128
144 25.4 mm tip, 24 ply panel 129
145 130
146 131
147 132
148 133
149 VIc mm tip, 8 ply panel 134
150 135
151 136
152 137

153 50.8 mm tip, 16 ply panel 138
154 139
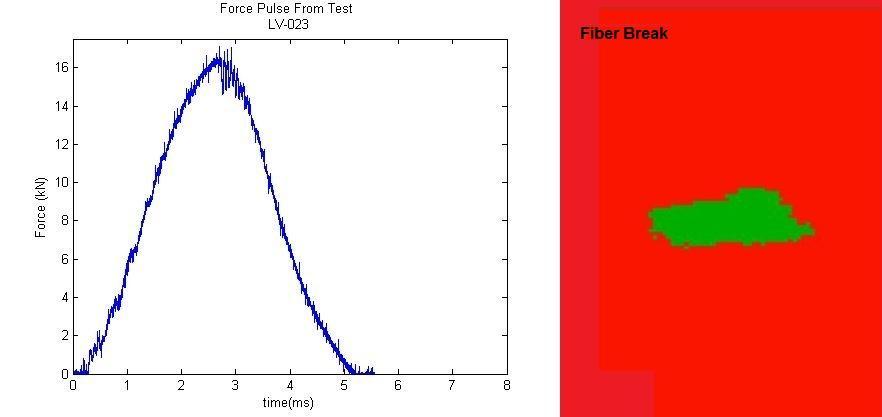
155 140
156 141
157 50.8 mm tip, 24 ply panel 142
158 143
159 144
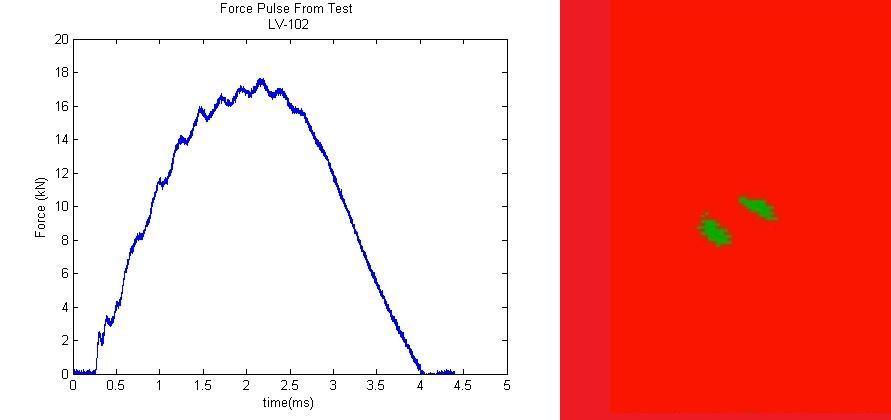
160 145
161 146
162 VId mm tip, 8 ply panel 147
163 148
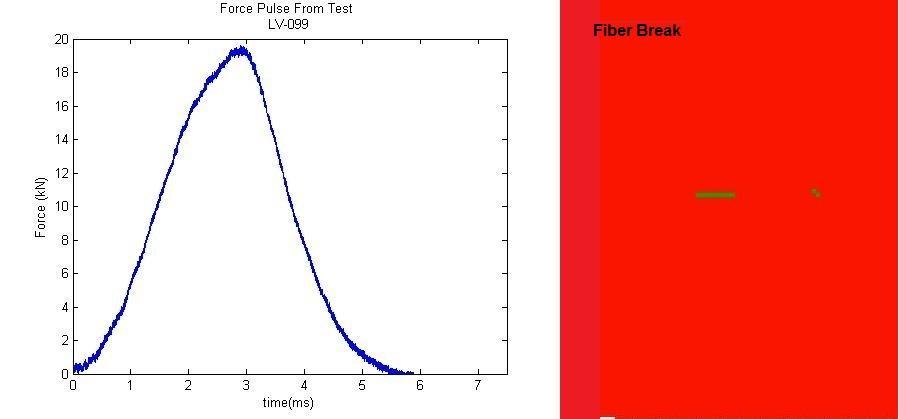
164 149
165 76.2 mm tip, 16 ply panel 150
166 151
167 152
168 76.2 mm tip, 24 ply panel 153
169 154
170 155
171 156
172 157
173 158 Appendix VII. Contact Area Processing In order to calculate the contact area between the pendulum impactor and the panel, the tip of the impactor was lightly coated with Dry Erase ink using a marker and during the impact the ink would transfer onto a sheet of paper placed on the surface of the panel. This sheet of paper included a reference square of known area printed out on it. The contact sheet would be scanned and processed using image processing software to remove any stray marks and darken the occasional area that did not transfer properly. This processing was minimal and did not alter the shape or area of the mark left by the impactor, it was only to facilitate the process of calculating the area of the mark. An example of a typical unprocessed and processed contact sheet is seen in Figure 43: Figure 43. Unprocessed contact sheet image (left) vs. processed image (right) In order to measure the area of the mark, the image was processed using a MATLAB function. The function would first scan the area of the image containing the reference

174 159 square and record how many pixels the square contained. Then it would scan the area of the sheet with the contact mark in it, record how many pixels the mark contained. This value was then compared to the pixels in the reference square to calculate the area of the mark. In order to verify that the correct areas were scanned, and that no part of the reference square or mark was left out, the function produced an image that indicated the areas scanned and what counted as the reference square and mark. For example, the image produced after analyzing the image from Figure 30 would look like this: Figure 44. Image produced by MATLAB function to verify that the contact area was properly measured Figure 44 verifies that the entire reference square and contact mark were included in the scans, and that no stray marks were included in the determination of either area. Since each image is a fairly large file, the function takes about 45 seconds to run each time. To expedite the process of analyzing many files at a time, a loop was incorporated in the
Impact Damage Formation on Composite Aircraft Structures
 Impact Damage Formation on Composite Aircraft Structures Hyonny Kim, Associate Professor Department of Structural Engineering Impact Damage Formation on Composite Aircraft Structures Motivation and Key
Disclaimer for FAA Research Publication
 Disclaimer for FAA Research Publication Although the FAA has sponsored this project, it neither endorses nor rejects the findings of the research. The presentation of this information is in the interest
A Numerical Study on Prediction of BFS in Composite Structures under Ballistic Impact
 VOL. 1, 2015 ISSN 2394 3750 EISSN 2394 3769 SCIENCE & TECHNOLOGY A Numerical Study on Prediction of BFS in Composite Structures under Ballistic Impact Bandaru Aswani Kumar 1, Suhail Ahmad 2 1. Research
Calibration and Experimental Validation of LS-DYNA Composite Material Models by Multi Objective Optimization Techniques
 9 th International LS-DYNA Users Conference Optimization Calibration and Experimental Validation of LS-DYNA Composite Material Models by Multi Objective Optimization Techniques Stefano Magistrali*, Marco
Blunt Impact Damage Formation on Composite Aircraft Structures
 Blunt Impact Damage Formation on Composite Aircraft Structures FAA Supported Research Project Hyonny Kim, Associate Professor University of California, San Diego Hyonny Kim, UCSD 1 incidental contact /
RELIABILITY OF COMPOSITE STRUCTURES - IMPACT LOADING -
 RELIABILITY OF COMPOSITE STRUCTURES - IMPACT LOADING - L.Guillaumat 1 1 LA.M.E.F.-E.N.S.A.M. Esplanade des Arts et Métiers 33405 Talence Cedex - FRANCE SUMMARY: This paper deals with a method to study
A SELF-INDICATING MODE I INTERLAMINAR TOUGHNESS TEST
 A SELF-INDICATING MODE I INTERLAMINAR TOUGHNESS TEST P. Robinson The Composites Centre, Department of Aeronautics, Imperial College London South Kensington, London, SW7 2AZ, UK p.robinson@imperial.ac.uk
Comparison with Low-Velocity Impact and Quasi-static Indentation Testing of Foam Core Sandwich Composites
 International Journal of Applied Physics and Mathematics, Vol. 2, No. 1, January 212 Comparison with Low-Velocity Impact and Quasi-static Indentation Testing of Foam Core Sandwich Composites Yan Li, An
SCALING EFFECTS IN THE LOW VELOCITY IMPACT RESPONSE OF FIBRE METAL
 SCALING EFFECTS IN THE LOW VELOCITY IMPACT RESPONSE OF FIBRE METAL LAMINATES J. G. Carrillo 1, S. McKown 1, M. Mujib 1 and W. J. Cantwell 1. R. Day 2 1 Department of Engineering, University of Liverpool,
Impact and Crash Modeling of Composite Structures: A Challenge for Damage Mechanics
 Impact and Crash Modeling of Composite Structures: A Challenge for Damage Mechanics Dr. A. Johnson DLR Dr. A. K. Pickett ESI GmbH EURO-PAM 99 Impact and Crash Modelling of Composite Structures: A Challenge
ISSN: ISO 9001:2008 Certified International Journal of Engineering Science and Innovative Technology (IJESIT) Volume 2, Issue 4, July 2013
 Volume 2, Issue 4, July 2013") Delamination Studies in Fibre-Reinforced Polymer Composites K.Kantha Rao, Dr P. Shailesh, K. Vijay Kumar 1 Associate Professor, Narasimha Reddy Engineering College Hyderabad. 2 Professor, St. Peter s Engineering
Delamination Studies in Fibre-Reinforced Polymer Composites K.Kantha Rao, Dr P. Shailesh, K. Vijay Kumar 1 Associate Professor, Narasimha Reddy Engineering College Hyderabad. 2 Professor, St. Peter s Engineering
Crashworthiness of composite structures: Experiment and Simulation
 Crashworthiness of composite structures: Experiment and Simulation Francesco Deleo, Bonnie Wade and Prof. Paolo Feraboli (UW) Dr. Mostafa Rassaian (Boeing R&T) JAMS 2010 The Joint Advanced Materials and
MECHANICAL FAILURE OF A COMPOSITE HELICOPTER STRUCTURE UNDER STATIC LOADING
 MECHANICAL FAILURE OF A COMPOSITE HELICOPTER STRUCTURE UNDER STATIC LOADING Steven Roy, Larry Lessard Dept. of Mechanical Engineering, McGill University, Montreal, Québec, Canada ABSTRACT The design and
Keywords: Adhesively bonded joint, laminates, CFRP, stacking sequence
 THE 19 TH INTERNATIONAL CONFERENCE ON COMPOSITE MATERIALS GLOBAL AND LOCAL INFLUENCE OF STACKING SEQUENCE ON THE STRENGTH OF ADHESIVELY BONDED JOINTS OF CFRP LAMINATES J. Rousseau*, P. Satthamnuwong DRIVE,
BIAXIAL STRENGTH INVESTIGATION OF CFRP COMPOSITE LAMINATES BY USING CRUCIFORM SPECIMENS
 BIAXIAL STRENGTH INVESTIGATION OF CFRP COMPOSITE LAMINATES BY USING CRUCIFORM SPECIMENS H. Kumazawa and T. Takatoya Airframes and Structures Group, Japan Aerospace Exploration Agency 6-13-1, Ohsawa, Mitaka,
THE ROLE OF DELAMINATION IN NOTCHED AND UNNOTCHED TENSILE STRENGTH
 THE ROLE OF DELAMINATION IN NOTCHED AND UNNOTCHED TENSILE STRENGTH M. R. Wisnom University of Bristol Advanced Composites Centre for Innovation and Science University Walk, Bristol BS8 1TR, UK M.Wisnom@bristol.ac.uk
PENETRATION OF FRAGMENTS INTO AIRCRAFT COMPOSITE STRUCTURES. G. Jenaro, F.Rey, G.Rosado and P. García
 23 RD INTERNATIONAL SYMPOSIUM ON BALLISTICS TARRAGONA, SPAIN 16-20 APRIL 2007 PENETRATION OF FRAGMENTS INTO AIRCRAFT COMPOSITE STRUCTURES. G. Jenaro, F.Rey, G.Rosado and P. García Laboratorio Químico Central
Multi Disciplinary Delamination Studies In Frp Composites Using 3d Finite Element Analysis Mohan Rentala
 Multi Disciplinary Delamination Studies In Frp Composites Using 3d Finite Element Analysis Mohan Rentala Abstract: FRP laminated composites have been extensively used in Aerospace and allied industries
Parametric Studies of Low Velocity Impact on E-glass/Epoxy using Ls-Dyna
 IOSR Journal of Mechanical and Civil Engineering (IOSR-JMCE) e-issn: 2278-1684,p-ISSN: 2320-334X, Volume 11, Issue 4 Ver. V (Jul- Aug. 2014), PP 33-39 Parametric Studies of Low Velocity Impact on E-glass/Epoxy
LAMB WAVE RESPONSE OF FATIGUED COMPOSITE SAMPLES. Reveiw of Progress in Quantitative Nondestructive Evaluation, Vol 13B (1994) pp.
 pp.") LAMB WAVE RESPONSE OF FATIGUED COMPOSITE SAMPLES Reveiw of Progress in Quantitative Nondestructive Evaluation, Vol 13B (1994) pp. 1261-1266 INTRODUCTION Michael D. Seale and Barry T. Smith Departments
LAMB WAVE RESPONSE OF FATIGUED COMPOSITE SAMPLES Reveiw of Progress in Quantitative Nondestructive Evaluation, Vol 13B (1994) pp. 1261-1266 INTRODUCTION Michael D. Seale and Barry T. Smith Departments
Finite element modelling of infinitely wide Angle-ply FRP. laminates
 www.ijaser.com 2012 by the authors Licensee IJASER- Under Creative Commons License 3.0 editorial@ijaser.com Research article ISSN 2277 9442 Finite element modelling of infinitely wide Angle-ply FRP laminates
IMPACT DAMAGE TO 3D WOVEN CFRP COMPOSITE PLATES
 IMPACT DAMAGE TO 3D WOVEN CFRP COMPOSITE PLATES G. Zumpano 1,3, MPF Sutcliffe 1, C Monroy Aceves 1, WJ Stronge 1, M. Fox 2 1 Cambridge University Engineering Department Trumpington Street, Cambridge, CB2
Composite Structures- Modeling, FEA, Optimization and Diagnostics
 Composite Structures- Modeling, FEA, Optimization and Diagnostics Ratan Jha Mechanical and Aeronautical Engineering Clarkson University, Potsdam, NY Composite Laminate Modeling Refined Higher Order Displacement
EXPERIMENTAL AND NUMERICAL STUDY OF OBLIQUE IMPACT ON HELICOPTER BLADES INFLUENCE OF THE CURVATURE
 EXPERIMENTAL AND NUMERICAL STUDY OF OBLIQUE IMPACT ON HELICOPTER BLADES INFLUENCE OF THE CURVATURE F. Pascal a, P. Navarro a*, S. Marguet a, J.F. Ferrero a, J. Aubry b, S. Lemaire b a Université de Toulouse,
COMPARISON OF EXPERIMENTAL RESULTS WITH FEM ONES OF RECTANGULAR CFRP TUBES FOR FRONT SIDE MEMBERS OF AUTOMOBILES
 16 TH INTERNATIONAL CONFERENCE ON COMPOSITE MATERIALS COMPARISON OF EXPERIMENTAL RESULTS WITH FEM ONES OF RECTANGULAR CFRP TUBES FOR FRONT SIDE MEMBERS OF AUTOMOBILES Hyoung-Soo Kim*, Goichi Ben**,Yoshio
LECTURE NO. 4-5 INTRODUCTION ULTRASONIC * PULSE VELOCITY METHODS
 LECTURE NO. 4-5 ULTRASONIC * PULSE VELOCITY METHODS Objectives: To introduce the UPV methods To briefly explain the theory of pulse propagation through concrete To explain equipments, procedures, calibrations,
Model-Assisted Probability of Detection for Ultrasonic Structural Health Monitoring
 4th European-American Workshop on Reliability of NDE - Th.2.A.2 Model-Assisted Probability of Detection for Ultrasonic Structural Health Monitoring Adam C. COBB and Jay FISHER, Southwest Research Institute,
Effects of Resin and Fabric Structure
 Fatigue of Wind Blade Laminates: Effects of Resin and Fabric Structure Details David Miller, Daniel D. Samborsky and John F. Mandell Montana State t University it MCARE 2012 Outline Overview of MSU Fatigue
Damage Inspection of Fiber Reinforced Polymer-Concrete Systems using a Distant Acoustic-Laser NDE Technique
 SPIE Smart Structures/NDE March 11, 2010, San Diego, CA Session 10: Civil Infrastructure Health Monitoring I Damage Inspection of Fiber Reinforced Polymer-Concrete Systems using a Distant Acoustic-Laser
DAMAGE SIMULATION OF CFRP LAMINATES UNDER HIGH VELOCITY PROJECTILE IMPACT
 18 TH INTERNATIONAL CONFERENCE ON COMPOSITE MATERIALS DAMAGE SIMULATION OF CFRP LAMINATES UNDER HIGH VELOCITY PROJECTILE IMPACT A. Yoshimura 1*, T. Okabe, M. Yamada 3, T. Ogasawara 1, Y. Tanabe 3 1 Advanced
MIS 231, NASA LaRC Hampton, VA
 COMBINED INVESTIGATION OF EDDY CURRENT AND ULTRASONIC TECHNIQUES FOR COMPOSITE MATERIALS NDE C. W. Davis US Anny ATCOM MIS 231, NASA LaRC Hampton, VA 23681-0001 S. Nath and J. P. Fulton Analytic Services
Computational Analysis for Composites
 Computational Analysis for Composites Professor Johann Sienz and Dr. Tony Murmu Swansea University July, 011 The topics covered include: OUTLINE Overview of composites and their applications Micromechanics
The Low-Velocity Impact Response of Laminated Composite Plates with Holes
 The Low-Velocity Impact Response of Laminated Composite Plates with Holes Dr. Nabil H. Hadi, Hayder H. Khaleel Mechanical Engineering Department, College of Engineering. University of Baghdad. Baghdad,
Non-conventional Glass fiber NCF composites with thermoset and thermoplastic matrices. F Talence, France Le Cheylard, France
 20 th International Conference on Composite Materials Copenhagen, 19-24th July 2015 Non-conventional Glass fiber NCF composites with thermoset and thermoplastic matrices. Thierry Lorriot 1, Jalal El Yagoubi
INTERNATIONAL JOURNAL OF APPLIED ENGINEERING RESEARCH, DINDIGUL Volume 2, No 1, 2011
 Interlaminar failure analysis of FRP cross ply laminate with elliptical cutout Venkateswara Rao.S 1, Sd. Abdul Kalam 1, Srilakshmi.S 1, Bala Krishna Murthy.V 2 1 Mechanical Engineering Department, P. V.
DEVELOPMENT OF THERMOELASTIC STRESS ANALYSIS AS A NON-DESTRUCTIVE EVALUATION TOOL
 DEVELOPMENT OF THERMOELASTIC STRESS ANALYSIS AS A NON-DESTRUCTIVE EVALUATION TOOL S. Quinn*, R.K. Fruehmann and J.M. Dulieu-Barton School of Engineering Sciences University of Southampton Southampton SO17
Theoretical Approach to Predict Transverse Impact Response of Variable-Stiffness Curved Composite Plates
 *Manuscript Click here to view linked References 1 1 1 1 1 1 1 0 1 0 1 0 1 0 1 0 1 Theoretical Approach to Predict Transverse Impact Response of Variable-Stiffness Curved Composite Plates B. Arachchige,
Strain Measurement. Prof. Yu Qiao. Department of Structural Engineering, UCSD. Strain Measurement
 Strain Measurement Prof. Yu Qiao Department of Structural Engineering, UCSD Strain Measurement The design of load-carrying components for machines and structures requires information about the distribution
Numerical Vibration Analysis of Impacted CFRP Specimens Using COMSOL Multiphysics
 Numerical Vibration Analysis of Impacted CFRP Specimens Using COMSOL Multiphysics Philipp Jatzlau 1, Florian Seybold 1 1 Technical University of Munich, Center for Building Materials, Chair of Non-destructive
A Study on the Tube of Integral Propeller Shaft for the Rear-wheel Drive Automobile Using Carbon Composite Fiber
 A Study on the Tube of Integral Propeller Shaft for the Rear-wheel Drive Automobile Using Carbon Composite Fiber Kibong Han Mechatronics Department, Jungwon University, 85 Munmu-ro, Goesan-gun, South Korea.
PREDICTION OF OUT-OF-PLANE FAILURE MODES IN CFRP
 PREDICTION OF OUT-OF-PLANE FAILURE MODES IN CFRP R. R. Pinto 1, P. P. Camanho 2 1 INEGI - Instituto de Engenharia Mecanica e Gestao Industrial, Rua Dr. Roberto Frias, 4200-465, Porto, Portugal 2 DEMec,
2 Experiment of GFRP bolt
 16 TH INTERNATIONAL CONFERENCE ON COMPOSITE MATERIALS FATIGUE LIFE EVALUATION OF BOLT MADE OF WOVEN FABRIC FRP Takeshi INOUE*, Hiroaki NAKAI**, Tetsusei KURASHIKI**, Masaru ZAKO**, Yuji KOMETANI*** *Graduate
THE MUTUAL EFFECTS OF SHEAR AND TRANSVERSE DAMAGE IN POLYMERIC COMPOSITES
 THE 19 TH INTERNATIONAL CONFERENCE ON COMPOSITE MATERIALS THE MUTUAL EFFECTS OF SHEAR AND TRANSVERSE DAMAGE IN POLYMERIC COMPOSITES L.V. Smith 1 *, M. Salavatian 1 1 School of Mechanical and Materials
EFFECT OF THERMAL FATIGUE ON INTRALAMINAR CRACKING IN LAMINATES LOADED IN TENSION
 EFFECT OF THERMAL FATIGUE ON INTRALAMINAR CRACKING IN LAMINATES LOADED IN TENSION J.Varna and R.Joffe Dept of Applied Physics and Mechanical Engineering Lulea University of Technology, SE 97187, Lulea,
Design of Hybrid Composites for Axial loads with Zero Coefficient of Thermal Expansion
 Design of Hybrid Composites for Axial loads with Zero Coefficient of Thermal Expansion Zaffar M. Khan 1 and Asim Shahzad 2 Institute of Space Technology, Islamabad, Pakistan, 44000 Aerospace structures
AE Source Orientation by Plate Wave Analysis * Michael R. Gorman Aeronautics and Astronautics Naval Postgraduate School Monterey, CA 93943
 AE Source Orientation by Plate Wave Analysis * Michael R. Gorman Aeronautics and Astronautics Naval Postgraduate School Monterey, CA 93943 William H. Prosser NASA Langley Research Center Hampton, VA 23665
NON-DESTRUCTIVE EVALUATION METHODS FOR COMPOSITE PILES
 NON-DESTRUCTIVE EVALUATION METHODS FOR COMPOSITE PILES John F. Davila Graduate Research Assistant 2006 URI-UPRM SUMMER INTERNSHIP RESEARCH PROGRAM Kingstown, RI July 29 of 2006 PRESENTATION OUTLINE Introduction
5 ADVANCED FRACTURE MODELS
 Essentially, all models are wrong, but some are useful George E.P. Box, (Box and Draper, 1987) 5 ADVANCED FRACTURE MODELS In the previous chapter it was shown that the MOR parameter cannot be relied upon
Composite Sandwich Structures with Honeycomb Core subjected to Impact
 Clemson University TigerPrints All Theses Theses 12-212 Composite Sandwich Structures with Honeycomb Core subjected to Impact Lei He Clemson University, he6@clemson.edu Follow this and additional works
Progressive Damage of GFRP Composite Plate Under Ballistic Impact: Experimental and Numerical Study
 Progressive Damage of GFRP Composite Plate Under Ballistic Impact: Experimental and Numerical Study Progressive Damage of GFRP Composite Plate Under Ballistic Impact: Experimental and Numerical Study Md
Indentation Energy in Bending of Sandwich Beams with Composite Laminated Faces and Foam Core
 Indentation Energy in Bending of Sandwich Beams with Composite Laminated Faces and Foam Core M. SADIGHI, H. POURIAYEVALI, and M. SAADATI Dept. of Mechanical Engineering, Amirkabir University of Tech, Tehran,
Experimental Investigation of the Impact Response of Cylindrically Curved Laminated Composite Panels
 Experimental Investigation of the Impact Response of Cylindrically Curved Laminated Composite Panels AIAA Student Paper by Laura S. Kistler* Dept. of Aerospace Engineering, Univ. of Michigan, Ann Arbor,
The Relationship between the Applied Torque and Stresses in Post-Tension Structures
 ECNDT 6 - Poster 218 The Relationship between the Applied Torque and Stresses in Post-Tension Structures Fui Kiew LIEW, Sinin HAMDAN * and Mohd. Shahril OSMAN, Faculty of Engineering, Universiti Malaysia
FIS Specifications for Flex Poles (Edition May 2008) Original Text: German
 Original Text: German") FIS Specifications for Flex Poles (Edition May 2008) Original Text: German 1 Field of Application and Basic Information The following FIS specifications for flex poles are intended to ensure that flex
FIS Specifications for Flex Poles (Edition May 2008) Original Text: German 1 Field of Application and Basic Information The following FIS specifications for flex poles are intended to ensure that flex
FRACTURE IN HIGH PERFORMANCE FIBRE REINFORCED CONCRETE PAVEMENT MATERIALS
 FRACTURE IN HIGH PERFORMANCE FIBRE REINFORCED CONCRETE PAVEMENT MATERIALS ERIK DENNEMAN A thesis submitted in partial fulfilment of the requirements for the degree of PHILOSOPHIAE DOCTOR (ENGINEERING)
Tuesday, February 11, Chapter 3. Load and Stress Analysis. Dr. Mohammad Suliman Abuhaiba, PE
 1 Chapter 3 Load and Stress Analysis 2 Chapter Outline Equilibrium & Free-Body Diagrams Shear Force and Bending Moments in Beams Singularity Functions Stress Cartesian Stress Components Mohr s Circle for
Fiber / Toughened Epoxy Composites under
 Fatigue Behavior o Impact-Damaged Carbon Fiber / Toughened Epoxy Composites under Compressive loading Toshio Ogasawara, Hisaya Katoh, unao ugimoto, and Takashi Ishikawa Advanced d Composite Technology
HIGH VELOCITY IMPACT ON TEXTILE REINFORCED COMPOSITES
 16 TH INTERNATIONAL CONFERENCE ON COMPOSITE MATERIALS HIGH VELOCITY IMPACT ON TEXTILE REINFORCED COMPOSITES Warnet L., Akkerman R., Ravensberg M. University of Twente, Faculty of Engineering Technology,
DYNAMICS AND DAMAGE ASSESSMENT IN IMPACTED CROSS-PLY CFRP PLATE UTILIZING THE WAVEFORM SIMULATION OF LAMB WAVE ACOUSTIC EMISSION
 DYNAMICS AND DAMAGE ASSESSMENT IN IMPACTED CROSS-PLY CFRP PLATE UTILIZING THE WAVEFORM SIMULATION OF LAMB WAVE ACOUSTIC EMISSION ABSTRACT Y. MIZUTAMI, H. NISHINO, M. TAKEMOTO and K. ONO* Aoyama Gakuin
Lamb Wave Behavior in Bridge Girder Geometries
 Lamb Wave Behavior in Bridge Girder Geometries I. J. Oppenheim a*, D. W. Greve b, N. L. Tyson a a Dept. of Civil and Environmental Engineering, Carnegie Mellon University, Pittsburgh, PA 15213 b Dept.
RATE-DEPENDENT OFF-AXIS COMPRESSIVE STRENGTH OF A UNIDIRECTIONAL CARBON/EPOXY LAMINATE AT HIGH TEMPERATURE
 16 TH INTERNATIONAL CONFERENCE ON COMPOSITE MATERIALS RATE-DEPENDENT OFF-AXIS COMPRESSIVE STRENGTH OF A UNIDIRECTIONAL CARBON/EPOXY LAMINATE AT HIGH TEMPERATURE Masamichi KAWAI *, Satoru SAITO **, Jian-Qi
Size Effects In the Crushing of Honeycomb Structures
 45th AIAA/ASME/ASCE/AHS/ASC Structures, Structural Dynamics & Materials Conference 19-22 April 2004, Palm Springs, California AIAA 2004-1640 Size Effects In the Crushing of Honeycomb Structures Erik C.
1. A pure shear deformation is shown. The volume is unchanged. What is the strain tensor.
 Elasticity Homework Problems 2014 Section 1. The Strain Tensor. 1. A pure shear deformation is shown. The volume is unchanged. What is the strain tensor. 2. Given a steel bar compressed with a deformation
Prediction of Delamination Growth Behavior in a Carbon Fiber Composite Laminate Subjected to Constant Amplitude Compression-Compression Fatigue Loads
 Prediction of Delamination Growth Behavior in a Carbon Fiber Composite Laminate Subjected to Constant Amplitude Compression-Compression Fatigue Loads J. Raju 1*, D.S. Sreedhar 2, & C.M. Manjunatha 1 1
Finite Element Analysis Of A High-Speed Suspension Boat Fuselage
 Lehigh University Lehigh Preserve Theses and Dissertations 2017 Finite Element Analysis Of A High-Speed Suspension Boat Fuselage Lean Fang Lehigh University Follow this and additional works at: https://preserve.lehigh.edu/etd
IMPACT STRENGTH AND RESPONSE BEHAVIOR OF CFRP GUARDER BELT FOR SIDE COLLISION OF AUTOMOBILES
 IMPACT STRENGTH AND RESPONSE BEHAVIOR OF CFRP GUARDER BELT FOR SIDE COLLISION OF AUTOMOBILES AOKI Y.*, BEN G.**, KIM H. S.* *College of Science & Technology, Nihon University **College of Industrial Technology,
Interlaminar fracture characterization in composite materials by using acoustic emission
 5th International Symposium on NDT in Aerospace, 13-15th November 2013, Singapore Interlaminar fracture characterization in composite materials by using acoustic emission Ian SILVERSIDES 1, Ahmed MASLOUHI
DELAMINATION CONTROL IN COMPOSITE BEAMS USING PIEZOELECTRIC ACTUATORS
 DELAMINATION CONTROL IN COMPOSITE BEAMS USING PIEZOELECTRIC ACTUATORS L Iannucci 1, M S I Shaik Dawood 1,2,3, E Greenhalgh 1 and A K Ariffin 3 1 Aeronautics Department, Imperial College London, South Kensington
FEASIBILITY STUDY ON A LARGE CHOPPER DISC FOR A TOF SPECTROMETER
 THE 19 TH INTERNATIONAL CONFERENCE ON COMPOSITE MATERIALS FEASIBILITY STUDY ON A LARGE CHOPPER DISC FOR A TOF SPECTROMETER V. Antonelli 1*, W. Lohstroh 2, H. Baier 1 1 Institute of Lightweight Structures,
TABLE OF CONTENTS. Mechanics of Composite Materials, Second Edition Autar K Kaw University of South Florida, Tampa, USA
 Mechanics of Composite Materials, Second Edition Autar K Kaw University of South Florida, Tampa, USA TABLE OF CONTENTS 1. INTRODUCTION TO COMPOSITE MATERIALS 1.1 Introduction... 1.2 Classification... 1.2.1
Lamb Waves in Plate Girder Geometries
 Lamb Waves in Plate Girder Geometries D.W. Greve, 1 N. L. Tyson 2, and I.J. Oppenheim 2 1 Electrical and Computer Engineering, Carnegie Mellon University, Pittsburgh, PA, 15213 2 Civil and Environmental
THREE DIMENSIONAL STRESS ANALYSIS OF THE T BOLT JOINT
 THREE DIMENSIONAL STRESS ANALYSIS OF THE T BOLT JOINT Víctor Martínez 1, Alfredo Güemes 2, Norbert Blanco 1, Josep Costa 1 1 Escola Politècnica Superior. Universitat de Girona. Girona, Spain (17071) 2
FRACTURE TOUGHNESS OF ADHESIVE BONDED COMPOSITE JOINTS UNDER MIXED MODE LOADING.
 FRACTURE TOUGHNESS OF ADHESIVE BONDED COMPOSITE JOINTS UNDER MIXED MODE LOADING. X. J. Gong, F. Hernandez, G. Verchery. ISAT - Institut Supérieur de l Automobile et des Transports, LRMA - Laboratoire de
COMPARISON OF COHESIVE ZONE MODELS USED TO PREDICT DELAMINATION INITIATED FROM FREE-EDGES : VALIDATION AGAINST EXPERIMENTAL RESULTS
 COMPARISON OF COHESIVE ZONE MODELS USED TO PREDICT DELAMINATION INITIATED FROM FREE-EDGES : VALIDATION AGAINST EXPERIMENTAL RESULTS A. Uguen 1, L. Zubillaga 2, A. Turon 3, N. Carrère 1 1 Laboratoire Brestois
Mechanical Behavior of Circular Composite Springs with Extended Flat Contact Surfaces
 Mechanical Behavior of Circular Composite Springs with Extended Flat Contact Surfaces Ping-Cheung Tse epartment of Mechanical Engineering, The Hong Kong Polytechnic University, Hunghom, Kowloon, Hong Kong
The Accuracy of Characteristic Length Method on Failure Load Prediction of Composite Pinned Joints
 , June 30 - July 2, 2010, London, U.K. The Accuracy of Characteristic Length Method on Failure Load Prediction of Composite Pinned Joints O. Aluko, and Q. Mazumder Abstract An analytical model was developed
Fatigue Life Analysis Of Joint Bar Of Insulated Rail Joint
 Fatigue Life Analysis Of Joint Bar Of Insulated Rail Joint Washimraja Sheikh, Piyush M. Sirsat, Nakul K. Mahalle RTM Nagpur University, Priyadarshini College of Engineering, Assistant Professor, Department
DESCRIBING THE PLASTIC DEFORMATION OF ALUMINUM SOFTBALL BATS
 DESCRIBING THE PLASTIC DEFORMATION OF ALUMINUM SOFTBALL BATS E. BIESEN 1 AND L. V. SMITH 2 Washington State University, 201 Sloan, Spokane St, Pullman, WA 99164-2920 USA 1 E-mail: ebiesen@gonzaga.edu 2
IMPACT AND POST-IMPACT RESPONSE OF A COMPOSITE MATERIAL TO MULTIPLE NON-COINCIDENT IMPACTS. Kevin R. Cromer
 IMPACT AND POST-IMPACT RESPONSE OF A COMPOSITE MATERIAL TO MULTIPLE NON-COINCIDENT IMPACTS by Kevin R. Cromer A thesis submitted to the Faculty of the University of Delaware in partial fulfillment of the
Composite models 30 and 131: Ply types 0 and 8 calibration
 Model calibration Composite Bi-Phase models 30 and 3 for elastic, damage and failure PAM-CRASH material model 30 is for solid and 3 for multi-layered shell elements. Within these models different ply types
Special edition paper
 Development of New Aseismatic Structure Using Escalators Kazunori Sasaki* Atsushi Hayashi* Hajime Yoshida** Toru Masuda* Aseismatic reinforcement work is often carried out in parallel with improvement
Effect of damage on performance of composite structures applications to static and fatigue strength predictions. Christos Kassapoglou
 Effect of damage on performance of composite structures applications to static and fatigue strength predictions Christos Kassapoglou Outline static open hole BVID fatigue constant amplitude B-Basis curve
The Ballistic Pendulum
 The Ballistic Pendulum Experimental Objectives The objective of this experiment is to study the law of conservation of momentum. We will apply the principle of conservation of linear momentum to a case
FINITE ELEMENT ANALYSIS OF COMPOSITE MATERIALS
 FINITE ELEMENT ANALYSIS OF COMPOSITE MATERIALS Ever J. Barbero Department of Mechanical and Aerospace Engineering West Virginia University USA CRC Press Taylor &.Francis Group Boca Raton London New York
AERO 214. Lab II. Measurement of elastic moduli using bending of beams and torsion of bars
 AERO 214 Lab II. Measurement of elastic moduli using bending of beams and torsion of bars BENDING EXPERIMENT Introduction Flexural properties of materials are of interest to engineers in many different
INTERNAL STRAIN MEASUREMENTS IN CFRP PLATES SUBJECTED TO IMPACT LOAD USING FBG SENSORS
 INTERNAL STRAIN MEASUREMENTS IN CFRP PLATES SUBJECTED TO IMPACT LOAD USING FBG SENSORS J. Frieden, J. Cugnoni, J. Botsis, Th. Gmür, D. Coric Laboratoire de Mécanique appliquée et d Analyse de Fiabilité
Finite Element-Based Failure Models for Carbon/Epoxy Tape Composites
 Finite Element-Based Failure Models for Carbon/Epoxy Tape Composites A Master Thesis Presented to The Academic Faculty by Guillaume Seon In Partial Fulfillment of the Requirements for the Degree Master
Feasibility of dynamic test methods in classification of damaged bridges
 Feasibility of dynamic test methods in classification of damaged bridges Flavio Galanti, PhD, MSc., Felieke van Duin, MSc. TNO Built Environment and Geosciences, P.O. Box 49, 26 AA, Delft, The Netherlands.
1 Force Sensing. Lecture Notes. 1.1 Load Cell. 1.2 Stress and Strain
 Lecture Notes 1 Force Sensing 1.1 Load Cell A Load Cell is a structure which supports the load and deflects a known amount in response to applied forces and torques. The deflections are measured to characterize
CONCRETE TECHNOLOGY LABORATORY
 CONCRETE TECHNOLOGY LABORATORY DEPARTMENT OF CIVIL ENGINEERING CHULALONGKORN UNIVERSITY Tested by... ID No.... Date... Graded by... TEST No. C-7 NON-DESTRUCTIVE TEST OF HARDENED CONCRETE Part A Pulse Velocity
Strength and Damage Tolerance of Adhesively Bonded Joints: Stress-Based and Fracture-Based Approaches
 Strength and Damage Tolerance of Adhesively Bonded Joints: Stress-Based and Fracture-Based Approaches Hyonny Kim Assistant Professor School of Aeronautics and Astronautics, Purdue University presented
CEEN 3320 Behavior & Properties of Engineering Materials Laboratory Experiment No. 1 Measurement Techniques
 Laboratory Experiment No. 1 Measurement Techniques Engineers rely on data from a wide variety of sources to design the things that make up our physical world and to ensure compliance with established specifications.
THE INFLUENCE OF DELAMINATION OPENING IN CARBON FIBRE/EPOXY LAMINATES ON SIGNAL CHARACTERISTICS OF PULSE PHASE THERMOGRAPHY
 THE 19 TH INTERNATIONAL CONFERENCE ON COMPOSITE MATERIALS THE INFLUENCE OF DELAMINATION OPENING IN CARBON FIBRE/EPOXY LAMINATES ON SIGNAL CHARACTERISTICS OF PULSE PHASE THERMOGRAPHY H. Schmutzler 1 *,
Failure modes of glass panels subjected to soft missile impact
 Failure modes of glass panels subjected to soft missile impact L. R. Dharani & J. Yu Dept. of Mech. and Aerospace Engineering and Engineering Mechanics, University of Missouri-Rolla, U.S.A. Abstract Damage
TABLE OF CONTENTS SECTION TITLE PAGE 2 PRINCIPLES OF SEISMIC ISOLATION OF BRIDGES 3
 TABLE OF CONTENTS SECTION TITLE PAGE 1 INTRODUCTION 1 2 PRINCIPLES OF SEISMIC ISOLATION OF BRIDGES 3 3 ANALYSIS METHODS OF SEISMICALLY ISOLATED BRIDGES 5 3.1 Introduction 5 3.2 Loadings for the Analysis
AMM06. An Approximate Analytical Modeling of Honeycomb Sandwich Structure Including the Effects of Imperfection, Core Thickness and Impact Damage
 9- October, 0, Krabi An Approximate Analytical Modeling of Honeycomb Sandwich Structure Including the Effects of Imperfection, Core Thickness and Impact Damage Tanzeel-ur-Rehman, Hamdan Ajmal Khan, Asif
NUMERICAL SIMULATION OF DAMAGE IN THERMOPLASTIC COMPOSITE MATERIALS
 5 th European LS-DYNA Users Conference Composites NUMERICAL SIMULATION OF DAMAGE IN THERMOPLASTIC COMPOSITE MATERIALS Kevin Brown 1, Richard Brooks, Nicholas Warrior School of Mechanical, Materials and
DAMAGE MECHANICS MODEL FOR OFF-AXIS FATIGUE BEHAVIOR OF UNIDIRECTIONAL CARBON FIBER-REINFORCED COMPOSITES AT ROOM AND HIGH TEMPERATURES
 DAMAGE MECHANICS MODEL FOR OFF-AXIS FATIGUE BEHAVIOR OF UNIDIRECTIONAL CARBON FIBER-REINFORCED COMPOSITES AT ROOM AND HIGH TEMPERATURES M. Kawai Institute of Engineering Mechanics University of Tsukuba,
RUNWAY DEBRIS IMPACT ON GENERIC COMPOSITE TURBOFAN BLADE MULTISCALE PROGRESSIVE FAILURE ANALYSIS
 RUNWAY DEBRIS IMPACT ON GENERIC COMPOSITE TURBOFAN BLADE MULTISCALE PROGRESSIVE FAILURE ANALYSIS Gong Huiling 1 Frank Abdi 2 Marc VillàMontero 2 Cody Godines 2 1 MVT Group Inc, Shanghai, China 2 Alpha
ND TESTING ADVANCES ON CFRP WITH ULTRASONIC AND THERMAL TECHNIQUES
 ND TESTING ADVANCES ON CFRP WITH ULTRASONIC AND THERMAL TECHNIQUES A. Carofalo 1, V. Dattoma 1, F. Palano 1 *, F.W. Panella 1 a Department of Engineering for Innovation, University of Salento, Lecce, Italy