Responses of phenology, synchrony and fecundity of breeding by African ungulates to interannual variation in rainfall
|
|
|
- Audrey Austin
- 6 years ago
- Views:
Transcription
1 Responses of phenology, synchrony and fecundity of breeding by African ungulates to interannual variation in rainfall Joseph O. Ogutu A,B,D, Hans-Peter Piepho B and Holly T. Dublin C A International Livestock Research Institute, PO Box 30709, Nairobi 00100, Kenya. B University of Hohenheim, Institute for Crop Science, Bioinformatics Unit, Stuttgart, Germany. C Species Survival Commission (SSC), The World Conservation Union (IUCN), c/o South African National Biodiversity Institute, Centre for Biodiversity Conservation, Private Bag X7, Claremont 7735, Cape Town, Republic of South Africa. D Corresponding author. jogutu2007@gmail.com
2 Fig. S1. The distribution of the observed number of newborns (solid vertical bars), from the onset of the birth season (July) per adult warthog of both sexes, and the fitted model (solid black curve) with 95% confidence bands (shaded region). The dashed black vertical line marks the location of the birth peak. The populationaveraged model (dashed curve) and location of peak birth month (dashed vertical line) are shown in gray.
3
4 Fig. S2. The distribution of the observed number of newborns (solid vertical bars), from the onset of the birth season (July) per adult zebra of both sexes, and the fitted model (solid black curve) with 95% confidence bands (shaded region). The dashed black vertical line marks the location of the birth peak. The population-averaged model (dashed curve) and location of peak birth month (dashed vertical line) are shown in gray.


5
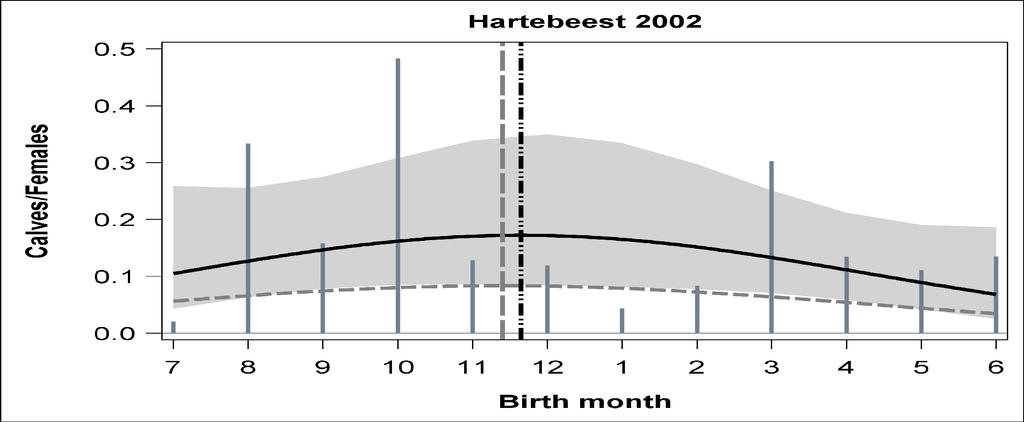
6 Fig. S3. The distribution of the observed number of newborns (solid vertical bars), from the onset of the birth season (July) per adult female hartebeest, and the fitted model (solid black curve) with 95% confidence bands (shaded region). The dashed black vertical line marks the location of the birth peak. The population-averaged model (dashed curve) and location of peak birth month (dashed vertical line) are shown in gray.


7
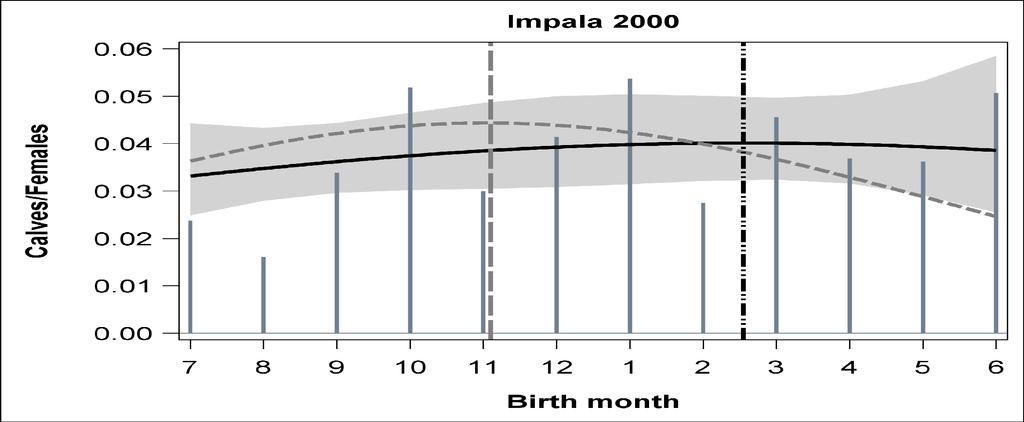
8 Fig. S4. The distribution of the observed number of newborns (solid vertical bars), from the onset of the birth season (July) per adult female impala, and the fitted model (solid black curve) with 95% confidence bands (shaded region). The dashed black vertical line marks the location of the birth peak. The population-averaged model (dashed curve) and location of peak birth month (dashed vertical line) are shown in gray.


9
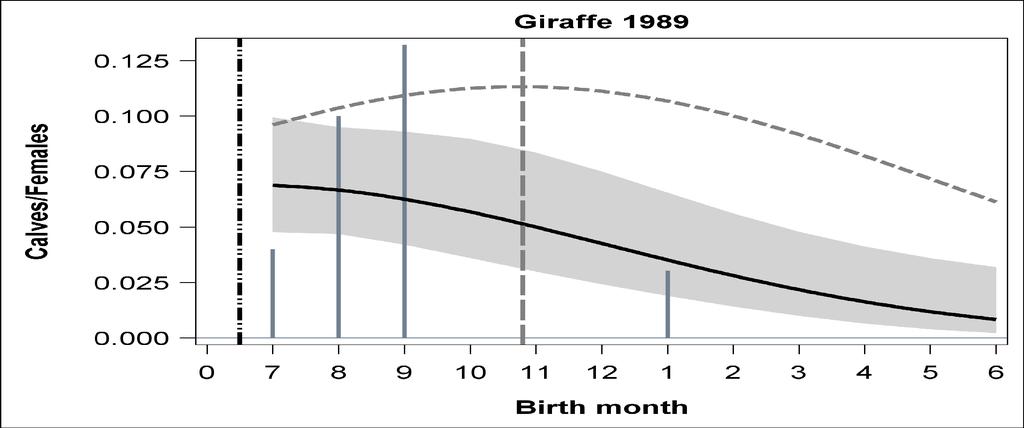
10 Fig. S5. The distribution of the observed number of newborns (solid vertical bars), from the onset of the birth season (July) per adult female giraffe, and the fitted model (solid black curve) with 95% confidence bands (shaded region). The dashed black vertical line marks the location of the birth peak. The population-averaged model (dashed curve) and location of peak birth month (dashed vertical line) are shown in gray.


11
12 Table S1. Results of the linear regression of the estimated month of birth peak, birth synchrony and peak fecundity rate divided by their respective populationaveraged values (arithmetic mean for peak fecundity) for on the annual, seasonal and quarterly rainfall components in the preceding (Annual1, wet1, dry1, earlywet1, latewet1, earlydry1 and latedry1) or current (Annual, wet, dry, earlywet, latewet, earlydry, latedry) year. The wet season spans November June, whereas the late-wet season spans March June. The Akaike information criterion-selected best models are highlighted in bold face font. R2 is the coefficient of determination.
13 Peak birth month Birth synchrony Species Rain Estimate SE T P> T R 2 AICc AICc Wi Estimate SE T P> T R 2 AICc AICc Wi Topi earlywet wet dry dry annual annual earlywet latewet latewet earlydry earlydry latedry latedry wet Warthog earlywet wet dry dry annual annual earlywet latewet latewet earlydry earlydry latedry latedry wet Zebra earlywet wet dry
14 dry annual annual earlywet latewet latewet earlydry earlydry latedry latedry wet Hartebeest earlywet wet dry dry annual annual earlywet latewet latewet earlydry earlydry latedry latedry wet Impala earlywet wet dry dry annual annual earlywet latewet
15 latewet earlydry earlydry latedry latedry wet Giraffe earlywet wet dry dry annual annual earlywet latewet latewet earlydry earlydry latedry latedry wet
16 Peak fecundity rate Species Rain Estimate SE T P> T R 2 AIC AIC Wi Topi earlywet wet dry dry annual annual earlywet latewet latewet earlydry earlydry latedry latedry wet Warthog earlywet wet dry dry annual annual earlywet latewet latewet earlydry earlydry latedry latedry wet Zebra earlywet wet dry dry annual annual earlywet latewet latewet earlydry earlydry latedry latedry wet Hartebeest earlywet wet dry dry annual annual earlywet
17 latewet latewet earlydry earlydry latedry latedry wet Impala earlywet wet dry dry annual annual earlywet latewet latewet earlydry earlydry latedry latedry wet Giraffe earlywet wet dry dry annual annual earlywet latewet latewet earlydry earlydry latedry latedry wet
18 SAS Code. SAS (version 9.3) code used to fit the random-coefficients regression model to estimate parameters needed to calculate the timing of peak births, birth synchrony and peak fecundity rate. /* Sample SAS Code (SAS Version 9.3) used to fit the random coefficients regression model to estimate parameters needed to calculate the timing of peak births, birth synchrony and peak fecundity rate. Zebra is used as an example species */ /*1.---Birthyear starts in July of the current year and ends in June of the following year*/ /*2.---The plots option generates plots of the studentized conditional (BLUP) and marginal residuals---*/; /*3.---Newborn is the count total of the newborn calves in each birth month. Birth month is defined as 1 for July for the current year and 12 for June of the following year---*/ /*4.---m is the birth month whereas m2 is m m. /*5.---logfemales is the natural logarithm of the count total of the adult male and female zebra in each month----*/. /*6.---mu, lower and upper are the predicted number of newborn and its lower and upper pointwise 95% confidence limits on the original or inverse link scale--*/ /*7.---This model was used for all the species with two minor modifications for topi, warthog and impala. For topi and warthog the statement requesting for an overdispersion parameter for the negative binomial model:random _residual_ /subject=birthyear; was dropped since allowing for overdispersion brought no improvement compared to not doing so. For impala the overdispersion parameter was allowed to vary across four groups of birthyears defined as follows: Group1: Drought years (1993,1997, 1999,2000), Group 2: Average years (1989,1990,1991,1992,1995,1996,1994), Group 3: wet years (2001,2002,2003) and Group 4: Flood years (1998)-*/. /*8.----Detailed documentation for the other glimmix procedure statements and options can be found in SAS user s guides freely available online ----*/ ods graphics on; ods output tests3=conception_tests3 Parameterestimates=conception_sol(where=(Effect ^='Scale')) covb=conception_covb
19 SolutionR=conception_solR estimates=estimates; Proc glimmix data=conception Noclprint Method=RSPL ic=pq initglm plots=(studentpanel (BLUP Marginal)); where species in ('Zebra'); by species; class birthyear ; Model newborn= m m2 / dist=negbin link=log solution covb offset=logfemales cl; Random int m m2/sub=birthyear type=un s; Random _residual_ /subject=birthyear; output out=pred Pred(ilink)=mu LCL(ilink)=lower UCL(Ilink)=Upper; nloptions tech=nmsimp Maxiter= maxfunc= ; /*9. ---Compute the variance of each random linear slope of month for each year--*/ estimate '1989' m 1/ subject 1 0; estimate '1990' m 1/ subject 0 1; estimate '1991' m 1/ subject 0 0 1; estimate '1992' m 1/ subject ; estimate '1993' m 1/ subject ; estimate '1994' m 1/ subject ; estimate '1995' m 1/ subject ; estimate '1996' m 1/ subject ; estimate '1997' m 1/ subject ; estimate '1998' m 1/ subject ; estimate '1999' m 1/ subject ; estimate '2000' m 1/ subject ; estimate '2001' m 1/ subject ; estimate '2002' m 1/ subject ; /*10.---Compute the variance of each random quadratic slope of month for each birth year---*/ estimate '1989' m2 1/ subject 1 0; estimate '1990' m2 1/ subject 0 1; estimate '1991' m2 1/ subject 0 0 1; estimate '1992' m2 1/ subject ; estimate '1993' m2 1/ subject ; estimate '1994' m2 1/ subject ; estimate '1995' m2 1/ subject ; estimate '1996' m2 1/ subject ; estimate '1997' m2 1/ subject ; estimate '1998' m2 1/ subject ; estimate '1999' m2 1/ subject ; estimate '2000' m2 1/ subject ; estimate '2001' m2 1/ subject ; estimate '2002' m2 1/ subject ;
20 /*11.---Compute the variance of the sum of the linear and quadratic random slopes of month for each year---*/ estimate '1989' m 1 m2 1/ subject 1 0; estimate '1990' m 1 m2 1 / subject 0 1; estimate '1991' m 1 m2 1 / subject 0 0 1; estimate '1992' m 1 m2 1 / subject ; estimate '1993' m 1 m2 1 / subject ; estimate '1994' m 1 m2 1 / subject ; estimate '1995' m 1 m2 1 / subject ; estimate '1996' m 1 m2 1 / subject ; estimate '1997' m 1 m2 1 / subject ; estimate '1998' m 1 m2 1 / subject ; estimate '1999' m 1 m2 1 / subject ; estimate '2000' m 1 m2 1 / subject ; estimate '2001' m 1 m2 1 / subject ; estimate '2002' m 1 m2 1 / subject ; run; ods graphics off; /*12.---Compute the covariance of the linear and quadratic random slopes of month for each birth year using the estimated parameters and the standard result: Cov X, Y 1 var X Y var X var Y. 2
Product Held at Accelerated Stability Conditions. José G. Ramírez, PhD Amgen Global Quality Engineering 6/6/2013
 Modeling Sub-Visible Particle Data Product Held at Accelerated Stability Conditions José G. Ramírez, PhD Amgen Global Quality Engineering 6/6/2013 Outline Sub-Visible Particle (SbVP) Poisson Negative Binomial
SAS Code: Joint Models for Continuous and Discrete Longitudinal Data
 CHAPTER 14 SAS Code: Joint Models for Continuous and Discrete Longitudinal Data We show how models of a mixed type can be analyzed using standard statistical software. We mainly focus on the SAS procedures
Lab 11. Multilevel Models. Description of Data
 Lab 11 Multilevel Models Henian Chen, M.D., Ph.D. Description of Data MULTILEVEL.TXT is clustered data for 386 women distributed across 40 groups. ID: 386 women, id from 1 to 386, individual level (level
Testing Indirect Effects for Lower Level Mediation Models in SAS PROC MIXED
 Testing Indirect Effects for Lower Level Mediation Models in SAS PROC MIXED Here we provide syntax for fitting the lower-level mediation model using the MIXED procedure in SAS as well as a sas macro, IndTest.sas
Class Notes: Week 8. Probit versus Logit Link Functions and Count Data
 Ronald Heck Class Notes: Week 8 1 Class Notes: Week 8 Probit versus Logit Link Functions and Count Data This week we ll take up a couple of issues. The first is working with a probit link function. While
SAS Syntax and Output for Data Manipulation:
 CLP 944 Example 5 page 1 Practice with Fixed and Random Effects of Time in Modeling Within-Person Change The models for this example come from Hoffman (2015) chapter 5. We will be examining the extent
A SUMMARY OF RAINFALL AT THE CARNARVON EXPERIMENT STATION,
 A SUMMARY OF RAINFALL AT THE CARNARVON EXPERIMENT STATION, 1931-213 J.C.O. Du Toit 1#, L. van den Berg 1 & T.G. O Connor 2 1 Grootfontein Agricultural Development Institute, Private Bag X529, Middelburg
Lecture 2: Linear and Mixed Models
 Lecture 2: Linear and Mixed Models Bruce Walsh lecture notes Introduction to Mixed Models SISG, Seattle 18 20 July 2018 1 Quick Review of the Major Points The general linear model can be written as y =
FREC 608 Guided Exercise 9
 FREC 608 Guided Eercise 9 Problem. Model of Average Annual Precipitation An article in Geography (July 980) used regression to predict average annual rainfall levels in California. Data on the following
Generalized Linear. Mixed Models. Methods and Applications. Modern Concepts, Walter W. Stroup. Texts in Statistical Science.
 Texts in Statistical Science Generalized Linear Mixed Models Modern Concepts, Methods and Applications Walter W. Stroup CRC Press Taylor & Francis Croup Boca Raton London New York CRC Press is an imprint
Evaluating the Effects of Temperature on Mortality in Manila City, Philippines from Using Distributed Lag Nonlinear Model
 Supplementary Information Evaluating the Effects of Temperature on Mortality in Manila City, Philippines from 2006 2010 Using Distributed Lag Nonlinear Model Modeling Approach: During the initial development,
Section Poisson Regression
 Section 14.13 Poisson Regression Timothy Hanson Department of Statistics, University of South Carolina Stat 705: Data Analysis II 1 / 26 Poisson regression Regular regression data {(x i, Y i )} n i=1,
Monthly overview. Rainfall
 Monthly overview 1 to 10 April 2018 Widespread rainfall continued to fall over most parts of the summer rainfall region during this period. Unseasonably good rain fell over the eastern half of the Northern
Construction of designs for twophase experiments with Tabu search
 Construction of designs for twophase experiments with Tabu search Nha Vo-Thanh In collaboration with Professor Hans-Peter Piepho University of Hohenheim Common bean experiment A breeding program by CIAT
Practice with Interactions among Continuous Predictors in General Linear Models (as estimated using restricted maximum likelihood in SAS MIXED)
") CLP 944 Example 2b page 1 Practice with Interactions among Continuous Predictors in General Linear Models (as estimated using restricted maximum likelihood in SAS MIXED) The models for this example come
CLP 944 Example 2b page 1 Practice with Interactions among Continuous Predictors in General Linear Models (as estimated using restricted maximum likelihood in SAS MIXED) The models for this example come
CORRELATION BETWEEN RAINFALL, STREAMFLOW AND GROUNDWATER LEVELS FOR THE ZACHARIASHOEK SUB- CATCHMENT NEAR WEMMERSHOEK, WESTERN CAPE
 CORRELATION BETWEEN RAINFALL, STREAMFLOW AND GROUNDWATER LEVELS FOR THE ZACHARIASHOEK SUB- CATCHMENT NEAR WEMMERSHOEK, WESTERN CAPE Nicolette Vermaak 1, Henry de Haast 2 & Gideon Steyl 3 1 Department of
Introduction to SAS proc mixed
 Faculty of Health Sciences Introduction to SAS proc mixed Analysis of repeated measurements, 2017 Julie Forman Department of Biostatistics, University of Copenhagen Outline Data in wide and long format
Effects of interannual climate variability on tropical tree cover
 Effects of interannual climate variability on tropical tree cover Milena Holmgren, Marina Hirota, Egbert H. Van Nes & Marten Scheffer Correspondence to: milena.holmgren@wur.nl Contents: 1. Climate Indexes.
East Africa The 2015 Season (Long Rains)
") East Africa The 2015 Season (Long Rains) EAST AFRICA SEASONAL ANALYSIS - 2015 HIGHLIGHTS The Long Rains season in the Horn of Africa has come to an end in May. With no further rainfall until the Short
East Africa The 2015 Season (Long Rains) EAST AFRICA SEASONAL ANALYSIS - 2015 HIGHLIGHTS The Long Rains season in the Horn of Africa has come to an end in May. With no further rainfall until the Short
Zambia. General Climate. Recent Climate Trends. UNDP Climate Change Country Profiles. Temperature. C. McSweeney 1, M. New 1,2 and G.
 UNDP Climate Change Country Profiles Zambia C. McSweeney 1, M. New 1,2 and G. Lizcano 1 1. School of Geography and Environment, University of Oxford. 2. Tyndall Centre for Climate Change Research http://country-profiles.geog.ox.ac.uk
Analysis of Count Data A Business Perspective. George J. Hurley Sr. Research Manager The Hershey Company Milwaukee June 2013
 Analysis of Count Data A Business Perspective George J. Hurley Sr. Research Manager The Hershey Company Milwaukee June 2013 Overview Count data Methods Conclusions 2 Count data Count data Anything with
H. Diagnostic plots of residuals
 H. Diagnostic plots of residuals 1. Plot residuals versus fitted values almost always a. or simple reg. this is about the same as residuals vs. x b. Look for outliers, curvature, increasing spread (funnel
Introduction to the Analysis of Hierarchical and Longitudinal Data
 Introduction to the Analysis of Hierarchical and Longitudinal Data Georges Monette, York University with Ye Sun SPIDA June 7, 2004 1 Graphical overview of selected concepts Nature of hierarchical models
Monthly overview. Rainfall
 Monthly overview 1-10 May 2018 During the first ten days of May, dry conditions were experienced across the country. Temperatures dropped to below 10 C over the southern half of the country for the first
Package HGLMMM for Hierarchical Generalized Linear Models
 Package HGLMMM for Hierarchical Generalized Linear Models Marek Molas Emmanuel Lesaffre Erasmus MC Erasmus Universiteit - Rotterdam The Netherlands ERASMUSMC - Biostatistics 20-04-2010 1 / 52 Outline General
over Time line for the means). Specifically, & covariances) just a fixed variance instead. PROC MIXED: to 1000 is default) list models with TYPE=VC */
. Specifically, & covariances) just a fixed variance instead. PROC MIXED: to 1000 is default) list models with TYPE=VC */") CLP 944 Example 4 page 1 Within-Personn Fluctuation in Symptom Severity over Time These data come from a study of weekly fluctuation in psoriasis severity. There was no intervention and no real reason
CLP 944 Example 4 page 1 Within-Personn Fluctuation in Symptom Severity over Time These data come from a study of weekly fluctuation in psoriasis severity. There was no intervention and no real reason
Chapter 4 Multi-factor Treatment Designs with Multiple Error Terms 93
 Contents Preface ix Chapter 1 Introduction 1 1.1 Types of Models That Produce Data 1 1.2 Statistical Models 2 1.3 Fixed and Random Effects 4 1.4 Mixed Models 6 1.5 Typical Studies and the Modeling Issues
A strategy for modelling count data which may have extra zeros
 A strategy for modelling count data which may have extra zeros Alan Welsh Centre for Mathematics and its Applications Australian National University The Data Response is the number of Leadbeater s possum
Lab 3: Two levels Poisson models (taken from Multilevel and Longitudinal Modeling Using Stata, p )
") Lab 3: Two levels Poisson models (taken from Multilevel and Longitudinal Modeling Using Stata, p. 376-390) BIO656 2009 Goal: To see if a major health-care reform which took place in 1997 in Germany was
Lab 3: Two levels Poisson models (taken from Multilevel and Longitudinal Modeling Using Stata, p. 376-390) BIO656 2009 Goal: To see if a major health-care reform which took place in 1997 in Germany was
MLMED. User Guide. Nicholas J. Rockwood The Ohio State University Beta Version May, 2017
 MLMED User Guide Nicholas J. Rockwood The Ohio State University rockwood.19@osu.edu Beta Version May, 2017 MLmed is a computational macro for SPSS that simplifies the fitting of multilevel mediation and
Contrasting Marginal and Mixed Effects Models Recall: two approaches to handling dependence in Generalized Linear Models:
 Contrasting Marginal and Mixed Effects Models Recall: two approaches to handling dependence in Generalized Linear Models: Marginal models: based on the consequences of dependence on estimating model parameters.
Influence of feeding conditions on breeding of African penguins importance of adequate local food supplies
 The following supplement accompanies the article Influence of feeding conditions on breeding of African penguins importance of adequate local food supplies Joël M. Durant 1,*, Robert J. M. Crawford 2,3,
Stats Review Chapter 14. Mary Stangler Center for Academic Success Revised 8/16
 Stats Review Chapter 14 Revised 8/16 Note: This review is meant to highlight basic concepts from the course. It does not cover all concepts presented by your instructor. Refer back to your notes, unit
Online appendix 1: Detailed statistical tests referred to in Wild goose dilemmas by Black, Prop & Larsson
 Online appendix 1: Detailed statistical tests referred to in Wild goose dilemmas by Black, Prop & Larsson Table 1. Variation in length of goslings association (days) with parents in relation to birth year
Topic 23: Diagnostics and Remedies
 Topic 23: Diagnostics and Remedies Outline Diagnostics residual checks ANOVA remedial measures Diagnostics Overview We will take the diagnostics and remedial measures that we learned for regression and
Drought Bulletin for the Greater Horn of Africa: Situation in June 2011
 Drought Bulletin for the Greater Horn of Africa: Situation in June 2011 Preliminary Analysis of data from the African Drought Observatory (ADO) SUMMARY The analyses of different meteorological and remote
SE Atlantic SST variability and southern African climate
 SE Atlantic SST variability and southern African climate Chris Reason Oceanography Dept, Univ. Cape Town Overview of southern African climate and tropical Atlantic SST South American monsoon, Benguela
Implementation of Pairwise Fitting Technique for Analyzing Multivariate Longitudinal Data in SAS
 PharmaSUG2011 - Paper SP09 Implementation of Pairwise Fitting Technique for Analyzing Multivariate Longitudinal Data in SAS Madan Gopal Kundu, Indiana University Purdue University at Indianapolis, Indianapolis,
L.A.OGALLO IGAD Climate Prediction and Applications Centre (ICPAC) Formerly known as Drought Monitoring Centre - Nairobi (DMCN)
 Formerly known as Drought Monitoring Centre - Nairobi (DMCN)") METEOROLOGICAL DROUGHT EARLY WARNING IN AFRICA L.A.OGALLO IGAD Climate Prediction and Applications Centre (ICPAC) Formerly known as Drought Monitoring Centre - Nairobi (DMCN) INTRODUCTION DROUGHT IS A
METEOROLOGICAL DROUGHT EARLY WARNING IN AFRICA L.A.OGALLO IGAD Climate Prediction and Applications Centre (ICPAC) Formerly known as Drought Monitoring Centre - Nairobi (DMCN) INTRODUCTION DROUGHT IS A
Week 5 Quantitative Analysis of Financial Markets Modeling and Forecasting Trend
 Week 5 Quantitative Analysis of Financial Markets Modeling and Forecasting Trend Christopher Ting http://www.mysmu.edu/faculty/christophert/ Christopher Ting : christopherting@smu.edu.sg : 6828 0364 :
STAT 705 Generalized linear mixed models
 STAT 705 Generalized linear mixed models Timothy Hanson Department of Statistics, University of South Carolina Stat 705: Data Analysis II 1 / 24 Generalized Linear Mixed Models We have considered random
Example 7b: Generalized Models for Ordinal Longitudinal Data using SAS GLIMMIX, STATA MEOLOGIT, and MPLUS (last proportional odds model only)
") CLDP945 Example 7b page 1 Example 7b: Generalized Models for Ordinal Longitudinal Data using SAS GLIMMIX, STATA MEOLOGIT, and MPLUS (last proportional odds model only) This example comes from real data
CLDP945 Example 7b page 1 Example 7b: Generalized Models for Ordinal Longitudinal Data using SAS GLIMMIX, STATA MEOLOGIT, and MPLUS (last proportional odds model only) This example comes from real data
Malawi. General Climate. UNDP Climate Change Country Profiles. C. McSweeney 1, M. New 1,2 and G. Lizcano 1
 UNDP Climate Change Country Profiles Malawi C. McSweeney 1, M. New 1,2 and G. Lizcano 1 1. School of Geography and Environment, University of Oxford. 2. Tyndall Centre for Climate Change Research http://country-profiles.geog.ox.ac.uk
Homework 5: Answer Key. Plausible Model: E(y) = µt. The expected number of arrests arrests equals a constant times the number who attend the game.
 = µt. The expected number of arrests arrests equals a constant times the number who attend the game.") EdPsych/Psych/Soc 589 C.J. Anderson Homework 5: Answer Key 1. Probelm 3.18 (page 96 of Agresti). (a) Y assume Poisson random variable. Plausible Model: E(y) = µt. The expected number of arrests arrests
EdPsych/Psych/Soc 589 C.J. Anderson Homework 5: Answer Key 1. Probelm 3.18 (page 96 of Agresti). (a) Y assume Poisson random variable. Plausible Model: E(y) = µt. The expected number of arrests arrests
Intraseasonal Characteristics of Rainfall for Eastern Africa Community (EAC) Hotspots: Onset and Cessation dates. In support of;
 Hotspots: Onset and Cessation dates. In support of;") Intraseasonal Characteristics of Rainfall for Eastern Africa Community (EAC) Hotspots: Onset and Cessation dates In support of; Planning for Resilience in East Africa through Policy, Adaptation, Research
Intraseasonal Characteristics of Rainfall for Eastern Africa Community (EAC) Hotspots: Onset and Cessation dates In support of; Planning for Resilience in East Africa through Policy, Adaptation, Research
Seasonal Hydrological Forecasting in the Berg Water Management Area of South Africa
 Seasonal Hydrological Forecasting in the Berg Water Management Area of South Africa Trevor LUMSDEN and Roland SCHULZE University of KwaZulu-Natal, South Africa OUTLINE Introduction Objectives Study Area
IGAD CLIMATE PREDICTION AND APPLICATIONS CENTRE (ICPAC) UPDATE OF THE ICPAC CLIMATE WATCH REF: ICPAC/CW/NO. 24, AUGUST 2011
 UPDATE OF THE ICPAC CLIMATE WATCH REF: ICPAC/CW/NO. 24, AUGUST 2011") IGAD CLIMATE PREDICTION AND APPLICATIONS CENTRE (ICPAC) UPDATE OF THE ICPAC CLIMATE WATCH REF: ICPAC/CW/NO. 24, AUGUST 2011 SUMMARY Drought conditions have persisted over some parts of the Arid and semi-arid
IGAD CLIMATE PREDICTION AND APPLICATIONS CENTRE (ICPAC) UPDATE OF THE ICPAC CLIMATE WATCH REF: ICPAC/CW/NO. 24, AUGUST 2011 SUMMARY Drought conditions have persisted over some parts of the Arid and semi-arid
Measuring relationships among multiple responses
 Measuring relationships among multiple responses Linear association (correlation, relatedness, shared information) between pair-wise responses is an important property used in almost all multivariate analyses.
Introduction to SAS proc mixed
 Faculty of Health Sciences Introduction to SAS proc mixed Analysis of repeated measurements, 2017 Julie Forman Department of Biostatistics, University of Copenhagen 2 / 28 Preparing data for analysis The
Epidemiology Wonders of Biostatistics Chapter 11 (continued) - probability in a single population. John Koval
 - probability in a single population. John Koval") Epidemiology 9509 Wonders of Biostatistics Chapter 11 (continued) - probability in a single population John Koval Department of Epidemiology and Biostatistics University of Western Ontario What is being
Epidemiology 9509 Wonders of Biostatistics Chapter 11 (continued) - probability in a single population John Koval Department of Epidemiology and Biostatistics University of Western Ontario What is being
SAS Code for Data Manipulation: SPSS Code for Data Manipulation: STATA Code for Data Manipulation: Psyc 945 Example 1 page 1
 Psyc 945 Example page Example : Unconditional Models for Change in Number Match 3 Response Time (complete data, syntax, and output available for SAS, SPSS, and STATA electronically) These data come from
Supplementary materials for:
 Supplementary materials for: Tang TS, Funnell MM, Sinco B, Spencer MS, Heisler M. Peer-led, empowerment-based approach to selfmanagement efforts in diabetes (PLEASED: a randomized controlled trial in an
Monthly Overview. Rainfall
 Monthly Overview Weather news during February 2017 was dominated by the arrival of Tropical Cyclone Dineo, the first cyclone to make landfall over southern Africa since cyclone Eline in February 2000.
36-309/749 Experimental Design for Behavioral and Social Sciences. Dec 1, 2015 Lecture 11: Mixed Models (HLMs)
") 36-309/749 Experimental Design for Behavioral and Social Sciences Dec 1, 2015 Lecture 11: Mixed Models (HLMs) Independent Errors Assumption An error is the deviation of an individual observed outcome (DV)
36-309/749 Experimental Design for Behavioral and Social Sciences Dec 1, 2015 Lecture 11: Mixed Models (HLMs) Independent Errors Assumption An error is the deviation of an individual observed outcome (DV)
Monthly Overview. Rainfall
 Monthly Overview Rainfall during August occurred mainly over the Western and Eastern Cape provinces, and KwaZulu- Natal. Rain in these provinces were regularly accompanied by cold fronts as they made landfall
The concept of breeding value. Gene251/351 Lecture 5
 The concept of breeding value Gene251/351 Lecture 5 Key terms Estimated breeding value (EB) Heritability Contemporary groups Reading: No prescribed reading from Simm s book. Revision: Quantitative traits
The GLIMMIX Procedure (Book Excerpt)
") SAS/STAT 9.22 User s Guide The GLIMMIX Procedure (Book Excerpt) SAS Documentation This document is an individual chapter from SAS/STAT 9.22 User s Guide. The correct bibliographic citation for the complete
SAS/STAT 9.22 User s Guide The GLIMMIX Procedure (Book Excerpt) SAS Documentation This document is an individual chapter from SAS/STAT 9.22 User s Guide. The correct bibliographic citation for the complete
SAS/STAT 14.2 User s Guide. The GLIMMIX Procedure
 SAS/STAT 14.2 User s Guide The GLIMMIX Procedure This document is an individual chapter from SAS/STAT 14.2 User s Guide. The correct bibliographic citation for this manual is as follows: SAS Institute
36-402/608 Homework #10 Solutions 4/1
 36-402/608 Homework #10 Solutions 4/1 1. Fixing Breakout 17 (60 points) You must use SAS for this problem! Modify the code in wallaby.sas to load the wallaby data and to create a new outcome in the form
Faculty of Health Sciences. Correlated data. Count variables. Lene Theil Skovgaard & Julie Lyng Forman. December 6, 2016
 Faculty of Health Sciences Correlated data Count variables Lene Theil Skovgaard & Julie Lyng Forman December 6, 2016 1 / 76 Modeling count outcomes Outline The Poisson distribution for counts Poisson models,
East Africa: The 2016 Season
 HIGHLIGHTS The first growing season of 2016 (March-May, Long Rains in Kenya, Belg in Ethiopia) brought good rainfall across Ethiopia, Eritrea and Somaliland. This was a welcome reprieve for many regions
INTRODUCTION TO ANIMAL BREEDING. Lecture Nr 3. The genetic evaluation (for a single trait) The Estimated Breeding Values (EBV) The accuracy of EBVs
 The Estimated Breeding Values (EBV) The accuracy of EBVs") INTRODUCTION TO ANIMAL BREEDING Lecture Nr 3 The genetic evaluation (for a single trait) The Estimated Breeding Values (EBV) The accuracy of EBVs Etienne Verrier INA Paris-Grignon, Animal Sciences Department
INTRODUCTION TO ANIMAL BREEDING Lecture Nr 3 The genetic evaluation (for a single trait) The Estimated Breeding Values (EBV) The accuracy of EBVs Etienne Verrier INA Paris-Grignon, Animal Sciences Department
Meteorological Information for Locust Monitoring and Control. Robert Stefanski. Agricultural Meteorology Division World Meteorological Organization
 Meteorological Information for Locust Monitoring and Control Robert Stefanski Agricultural Meteorology Division World Meteorological Organization Objectives of Workshop Presentation Meteorological requirements
Capture-Recapture Analyses of the Frog Leiopelma pakeka on Motuara Island
 Capture-Recapture Analyses of the Frog Leiopelma pakeka on Motuara Island Shirley Pledger School of Mathematical and Computing Sciences Victoria University of Wellington P.O.Box 600, Wellington, New Zealand
NFC ACADEMY COURSE OVERVIEW
 NFC ACADEMY COURSE OVERVIEW Algebra II Honors is a full-year, high school math course intended for the student who has successfully completed the prerequisite course Algebra I. This course focuses on algebraic
2015: A YEAR IN REVIEW F.S. ANSLOW
 2015: A YEAR IN REVIEW F.S. ANSLOW 1 INTRODUCTION Recently, three of the major centres for global climate monitoring determined with high confidence that 2015 was the warmest year on record, globally.
SAS Syntax and Output for Data Manipulation: CLDP 944 Example 3a page 1
 CLDP 944 Example 3a page 1 From Between-Person to Within-Person Models for Longitudinal Data The models for this example come from Hoffman (2015) chapter 3 example 3a. We will be examining the extent to
ANNUAL CLIMATE REPORT 2016 SRI LANKA
 ANNUAL CLIMATE REPORT 2016 SRI LANKA Foundation for Environment, Climate and Technology C/o Mahaweli Authority of Sri Lanka, Digana Village, Rajawella, Kandy, KY 20180, Sri Lanka Citation Lokuhetti, R.,
Operational Practices in South African Weather Service (SAWS)
") Operational Practices in South African Weather Service (SAWS) Abiodun Adeola, Hannes Rautenbach, Cobus Olivier 2018/06/12 1 Overview Seasonal Forecasting System at SAWS How to Interpret Seasonal Forecasts
Operational Practices in South African Weather Service (SAWS) Abiodun Adeola, Hannes Rautenbach, Cobus Olivier 2018/06/12 1 Overview Seasonal Forecasting System at SAWS How to Interpret Seasonal Forecasts
Overdispersion Workshop in generalized linear models Uppsala, June 11-12, Outline. Overdispersion
 Biostokastikum Overdispersion is not uncommon in practice. In fact, some would maintain that overdispersion is the norm in practice and nominal dispersion the exception McCullagh and Nelder (1989) Overdispersion
REPORT ON SOWING PERIOD AND FLOODING RISKS IN DOUALA, CAMEROON. Cameroon Meteorological Department
 REPORT ON SOWING PERIOD AND FLOODING RISKS IN DOUALA, CAMEROON BY GERVAIS DIDIER YONTCHANG Cameroon Meteorological Department PROJECT WORK FOR PART FULFILMENT OF THE e-siac COURSE (STATISTICS IN APPLIED
Best Linear Unbiased Prediction: an Illustration Based on, but Not Limited to, Shelf Life Estimation
 Libraries Conference on Applied Statistics in Agriculture 015-7th Annual Conference Proceedings Best Linear Unbiased Prediction: an Illustration Based on, but Not Limited to, Shelf Life Estimation Maryna
On the Use of Forecasts when Forcing Annual Totals on Seasonally Adjusted Data
 The 34 th International Symposium on Forecasting Rotterdam, The Netherlands, June 29 to July 2, 2014 On the Use of Forecasts when Forcing Annual Totals on Seasonally Adjusted Data Michel Ferland, Susie
Logistic Regression Analyses in the Water Level Study
 Logistic Regression Analyses in the Water Level Study A. Introduction. 166 students participated in the Water level Study. 70 passed and 96 failed to correctly draw the water level in the glass. There
Glossary. The ISI glossary of statistical terms provides definitions in a number of different languages:
 Glossary The ISI glossary of statistical terms provides definitions in a number of different languages: http://isi.cbs.nl/glossary/index.htm Adjusted r 2 Adjusted R squared measures the proportion of the
Great Lakes Update. Volume 199: 2017 Annual Summary. Background
 Great Lakes Update Volume 199: 2017 Annual Summary Background The U.S. Army Corps of Engineers (USACE) tracks and forecasts the water levels of each of the Great Lakes. This report is primarily focused
Random Effects. Edps/Psych/Stat 587. Carolyn J. Anderson. Fall Department of Educational Psychology. university of illinois at urbana-champaign
 Random Effects Edps/Psych/Stat 587 Carolyn J. Anderson Department of Educational Psychology I L L I N O I S university of illinois at urbana-champaign Fall 2012 Outline Introduction Empirical Bayes inference
September 2016 No. ICPAC/02/293 Bulletin Issue October 2016 Issue Number: ICPAC/02/294 IGAD Climate Prediction and Applications Centre Monthly Bulleti
 Bulletin Issue October 2016 Issue Number: ICPAC/02/294 IGAD Climate Prediction and Applications Centre Monthly Bulletin, For referencing within this bulletin, the Greater Horn of Africa (GHA) is generally
MISSION DEBRIEFING: Teacher Guide
 Activity 2: It s Raining Again?! Using real data from one particular location, students will interpret a graph that relates rainfall to the number of cases of malaria. Background The relationship between
Random Coefficient Model (a.k.a. multilevel model) (Adapted from UCLA Statistical Computing Seminars)
 (Adapted from UCLA Statistical Computing Seminars)") STAT:5201 Applied Statistic II Random Coefficient Model (a.k.a. multilevel model) (Adapted from UCLA Statistical Computing Seminars) School math achievement scores The data file consists of 7185 students
STAT:5201 Applied Statistic II Random Coefficient Model (a.k.a. multilevel model) (Adapted from UCLA Statistical Computing Seminars) School math achievement scores The data file consists of 7185 students
I used college textbooks because they were the only resource available to evaluate measurement uncertainty calculations.
 Introduction to Statistics By Rick Hogan Estimating uncertainty in measurement requires a good understanding of Statistics and statistical analysis. While there are many free statistics resources online,
Subject-specific observed profiles of log(fev1) vs age First 50 subjects in Six Cities Study
 vs age First 50 subjects in Six Cities Study") Subject-specific observed profiles of log(fev1) vs age First 50 subjects in Six Cities Study 1.4 0.0-6 7 8 9 10 11 12 13 14 15 16 17 18 19 age Model 1: A simple broken stick model with knot at 14 fit with
Subject-specific observed profiles of log(fev1) vs age First 50 subjects in Six Cities Study 1.4 0.0-6 7 8 9 10 11 12 13 14 15 16 17 18 19 age Model 1: A simple broken stick model with knot at 14 fit with
dm'log;clear;output;clear'; options ps=512 ls=99 nocenter nodate nonumber nolabel FORMCHAR=" = -/\<>*"; ODS LISTING;
 dm'log;clear;output;clear'; options ps=512 ls=99 nocenter nodate nonumber nolabel FORMCHAR=" ---- + ---+= -/\*"; ODS LISTING; *** Table 23.2 ********************************************; *** Moore, David
Dublin City Schools Mathematics Graded Course of Study Algebra I Philosophy
 Philosophy The Dublin City Schools Mathematics Program is designed to set clear and consistent expectations in order to help support children with the development of mathematical understanding. We believe
Stats Review Chapter 6. Mary Stangler Center for Academic Success Revised 8/16
 Stats Review Chapter Revised 8/1 Note: This review is composed of questions similar to those found in the chapter review and/or chapter test. This review is meant to highlight basic concepts from the course.
INTERACTIVE 3-DIMENSIONAL DIAGRAMS FOR TEACHING MULTIPLE REGRESSION. Doug Stirling Massey University, New Zealand
 INTERACTIVE 3-DIMENSIONAL DIAGRAMS FOR TEACHING MULTIPLE REGRESSION Doug Stirling Massey University, New Zealand d.stirling@massey.ac.nz Many concepts in simple linear regression can be explained or illustrated
Stochastic modelling of regional annual rainfall anomalies in East Africa
 Journal of Applied Statistics, Vol. 13, No., 1986 49 Stochastic modelling of regional annual rainfall anomalies in East Africa LABAN A. J. OGALLO, Department of Meteorology, University of Nairobi, P.O.
Fibonacci Numbers. November 7, Fibonacci's Task: Figure out how many pairs of rabbits there will be at the end of one year, following rules.
 Fibonacci Numbers November 7, 2010 Fibonacci's Task: Figure out how many pairs of rabbits there will be at the end of one year, following rules. Rules: 1. Start with a pair of new rabbits, born in December.
Week 8 Hour 1: More on polynomial fits. The AIC
 Week 8 Hour 1: More on polynomial fits. The AIC Hour 2: Dummy Variables Hour 3: Interactions Stat 302 Notes. Week 8, Hour 3, Page 1 / 36 Interactions. So far we have extended simple regression in the following
UNIVERSITY OF TORONTO. Faculty of Arts and Science APRIL 2010 EXAMINATIONS STA 303 H1S / STA 1002 HS. Duration - 3 hours. Aids Allowed: Calculator
 UNIVERSITY OF TORONTO Faculty of Arts and Science APRIL 2010 EXAMINATIONS STA 303 H1S / STA 1002 HS Duration - 3 hours Aids Allowed: Calculator LAST NAME: FIRST NAME: STUDENT NUMBER: There are 27 pages
Talking feet: Scatterplots and lines of best fit
 Talking feet: Scatterplots and lines of best fit Student worksheet What does your foot say about your height? Can you predict people s height by how long their feet are? If a Grade 10 student s foot is
Lecture 3: Inference in SLR
 Lecture 3: Inference in SLR STAT 51 Spring 011 Background Reading KNNL:.1.6 3-1 Topic Overview This topic will cover: Review of hypothesis testing Inference about 1 Inference about 0 Confidence Intervals
Analytical Report. Drought in the Horn of Africa February Executive summary. Geographical context. Likelihood of drought impact (LDI)
") Executive summary The current drought in the Horn of Africa is affecting especially Somalia, among other countries, in particular the central and southern regions, where most population is located. Overall,
Executive summary The current drought in the Horn of Africa is affecting especially Somalia, among other countries, in particular the central and southern regions, where most population is located. Overall,
TOOLS AND DATA NEEDS FOR FORECASTING AND EARLY WARNING
 TOOLS AND DATA NEEDS FOR FORECASTING AND EARLY WARNING Professor Richard Samson Odingo Department of Geography and Environmental Studies University of Nairobi, Kenya THE NEED FOR ADEQUATE DATA AND APPROPRIATE
SWIM and Horizon 2020 Support Mechanism
 SWIM and Horizon 2020 Support Mechanism Working for a Sustainable Mediterranean, Caring for our Future REG-7: Training Session #1: Drought Hazard Monitoring Example from real data from the Republic of
Biostatistics Workshop Longitudinal Data Analysis. Session 4 GARRETT FITZMAURICE
 Biostatistics Workshop 2008 Longitudinal Data Analysis Session 4 GARRETT FITZMAURICE Harvard University 1 LINEAR MIXED EFFECTS MODELS Motivating Example: Influence of Menarche on Changes in Body Fat Prospective
Current and future climate of the Cook Islands. Pacific-Australia Climate Change Science and Adaptation Planning Program
 Pacific-Australia Climate Change Science and Adaptation Planning Program Penrhyn Pukapuka Nassau Suwarrow Rakahanga Manihiki N o r t h e r n C o o k I s l a nds S o u t h e Palmerston r n C o o k I s l
Statistics 5100 Spring 2018 Exam 1
 Statistics 5100 Spring 2018 Exam 1 Directions: You have 60 minutes to complete the exam. Be sure to answer every question, and do not spend too much time on any part of any question. Be concise with all
Introduction to Linear Regression Analysis
 Introduction to Linear Regression Analysis Samuel Nocito Lecture 1 March 2nd, 2018 Econometrics: What is it? Interaction of economic theory, observed data and statistical methods. The science of testing
Breeding value for cassava mosaic disease resistance analyzed in a seedling nursery
 Breeding value for cassava mosaic disease resistance analyzed in a seedling nursery Kulakow Peter A. 1, Bakare Moshood A. 1, Agbona Afolabi 1, Parkes Elizabeth Y. 1, Ceballos Hernan 2, Rabbi Ismail Y.