Instrumental Variables in Action: Sometimes You get What You Need
|
|
|
- Helena Rich
- 6 years ago
- Views:
Transcription
1 Instrumental Variables in Action: Sometimes You get What You Need Joshua D. Angrist MIT and NBER May 2011
2 Introduction
3 Our Causal Framework A dummy causal variable of interest, i, is called a treatment, by analogy with clinical trials Treatment effects can be related to health, but also to education, the labor market, and a wide range of public policies Potential outcomes, 0i and 1i, describe what happens under alternative treatment assignments We assume these are meaningful even though we only ever get to see one of them (imagine they would be revealed by a randomized trial) We observe i = 0i + ( 1i 0i ) i Covariates are denoted by the vector, i Instrumental variables, denoted by i, provide leverage for causal inference when treatment is not randomly assigned
4 Our Constant-Effects Benchmark The traditional IV setup is a linear, constant-effects world With Bernoulli (dummy) treatment, we have 0i = α + η i 1i 0i = ρ i = 0i + i ( 1i 0i ) = α + ρ i + η i OLS is biased because D i and η i are correlated An instrument, Z i, independent of Y 0i and correlated with D i, solves the OVB problem: ρ = Cov( i, i ) Cov( i, i ) = Cov( i, i )/V ( i ) Cov( i, i )/V ( i ) = RF 1st Example: draft-lottery estimates of the effects of Vietnam-era service... but are these effects constant? We ll shortly consider the fact that it s a heterogeneous world: 1i 0i is not the same for everyone
5 Sometimes You Get What You Need In a design-based framework, observational data are viewed "as if" from a randomized trial Internal and external validity: A good instrument captures an internally valid causal effect: the (average) impact on a group subject to treatment manipulation The external validity of this effect is it s predictive value in populations other than the one for which the experiment is observed Examples Draft-lottery estimates of the effects of Vietnam-era military service Quarter-of-birth estimates of the effects of schooling on earnings Regression-discontinuity estimates of the effects of class size In each of these examples, IV captures causal effects for a well-defined subpopulation (a subset of the treated) With variable treatment intensity, we get effects over a limited (but knowable) range
6 Roadmap 1 An example: the effect of childbearing on mothers labor supply Two good instruments, two good answers 2 The theory of instrumental variables with heterogeneous potential outcomes Notation and framework The LATE Theorem 3 Implications for the design and analysis of field trials The Bloom Result Illustration: JTPA and MDVE 4 Average causal response in models with variable treatment intensity [time-permitting] The ACR theorem and weighting function A few more examples
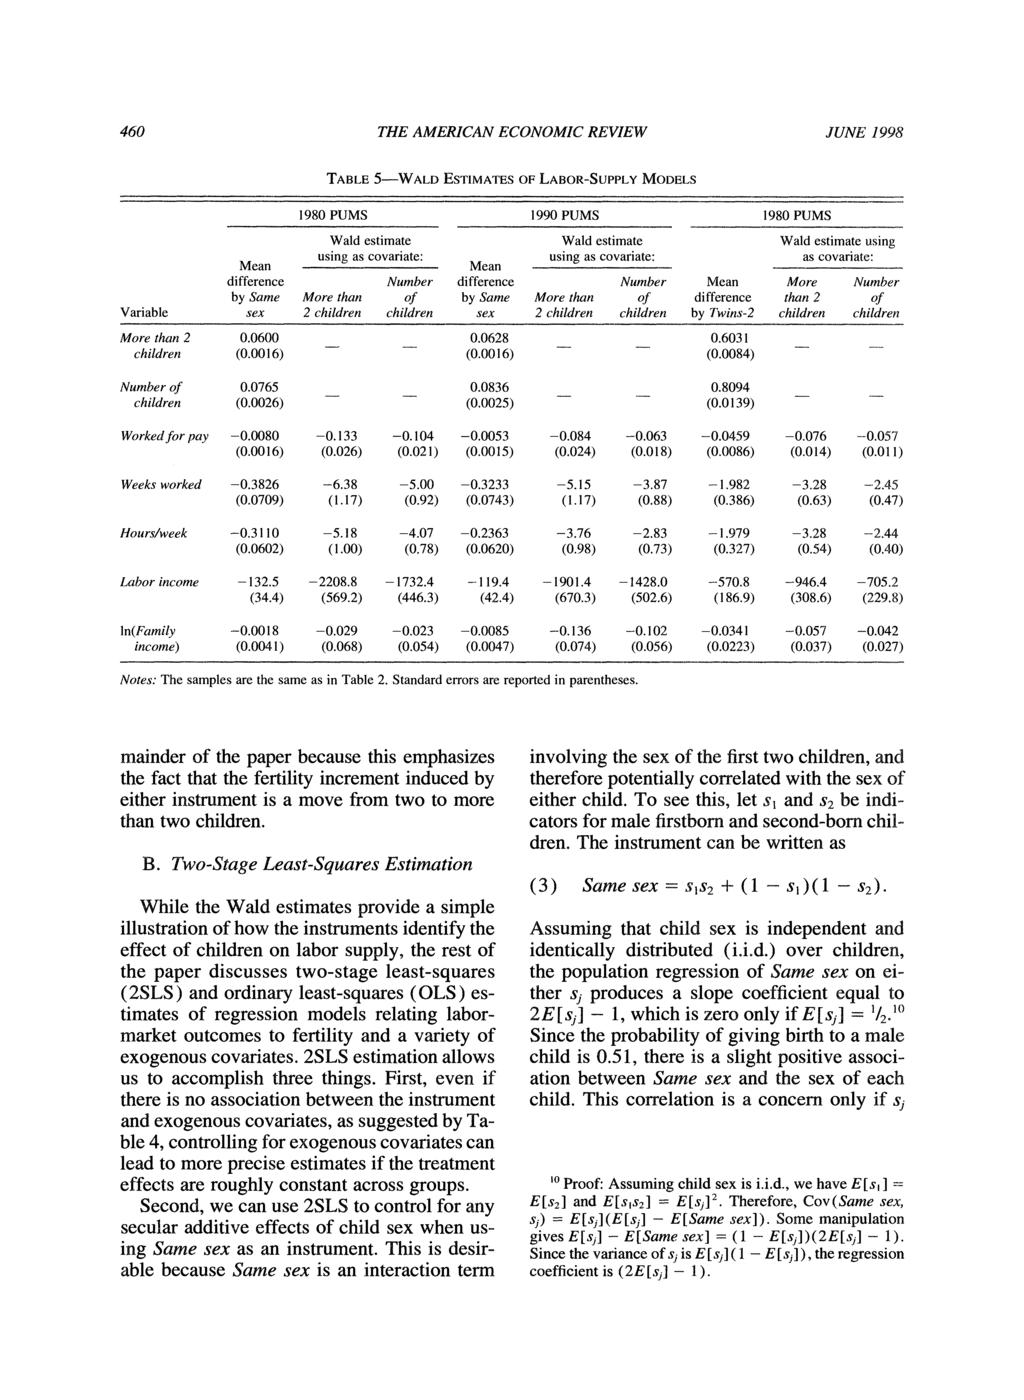
7 Children and Their Parents Labor Supply A causal model for the impact of more than two children i = 0i + i ( 1i 0i ) = α + ρ i + η i Dependent variables = employment, hours worked, weeks worked, earnings D i = 1[kids > 2] in families with at least two children Z i = twins or same-sex sibship at second birth With a Bernoulli instrument and no covariates, IV is Wald: Results ρ = Cov(Y i, Z i )/V (Z i ) Cov(D i, Z i )/V (Z i ) = RF 1st = E [ i i = 1] E [ i i = 0] E [ i i = 1] E [ i i = 0]
8 IV with Heterogeneous Potential Outcomes
9 The LATE Framework Let i (d, z) denote the potential outcome of individual i were this person to have treatment status i = d and instrument value i = z. Note the double-indexing: candidate instruments might have a direct effect on outcomes We assume, however, that IV initiates a causal chain: the instrument, i, affects i, which in turn affects i. To flesh this out, we first define potential treatment status, indexed against i 1i is i s treatment status when i = 1 0i is i s treatment status when i = 0 The first link in the chain is observed treatment status: i = 0i + ( 1i 0i ) i The causal effect of i on i is 1i 0i ; we assume there is one
10 LATE assumptions (Independence) Independence. The instrument is as good as randomly assigned: [{ i (d, z); d, z}, 1i, 0i ] i Independence says that draft lottery numbers are independent of potential outcomes and potential treatments Independence means the first-stage is the average causal effect of i on i : E [ i i = 1] E [ i i = 0] = E [ 1i i = 1] E [ 0i i = 0] = E [ 1i 0i ], Independence is suffi cient for a causal interpretation of the reduced form. Specifically, E [ i i = 1] E [ i i = 0] = E [ i ( 1i, 1) i ( 0i, 0)] The reduced form is the causal effect of the instrument on the dependent variable, but we have yet to link this to treatment
11 LATE assumptions (Exclusion) Exclusion. The instrument affects i only through i : 1i i (1, 1) = i (1, 0); 0i i (0, 1) = i (0, 0). The exclusion restriction means i can be written: i = i (0, i ) + [ i (1, i ) i (0, i )] i = 0i + ( 1i 0i ) i. for 1i and 0i that satisfy the independence assumption The exclusion restriction says that draft lottery numbers affect earnings only through veteran status; sex composition affects labor supply only through family size Exclusion takes us from RF causal effects to treatment effects
12 LATE assumptions (Monotonicity) A necessary technical assumption: Monotonicity. 1i 0i for everyone (or vice versa). By virtue of monotonicity, E [ 1i 0i ] = P [ 1i > 0i ] Interpreting monotonicity in latent-index models: i = { 1 if γ0 + γ 1 i > v i 0 otherwise, where v i is a random factor. This latent-index model characterizes potential treatment assignments as: 0i = 1[γ 0 > v i ] which clearly satisfy monotonicity 1i = 1[γ 0 + γ 1 > v i ],
13 The LATE Theorem Recap: The independence assumption is suffi cient for identification of a causal effect of the instrument The exclusion restriction means that the causal effect of the instrument on the dependent variable is due solely to the effect of the instrument on i. Exclusion is (or should be) more controversial than independence We also assume there is a first-stage; by virtue of monotonicity, this is the proportion of the population for which i is changed by i Given these assumptions, we have: THE LATE THEOREM. E [ i i = 1] E [ i i = 0] E [ i i = 1] E [ i i = 0] = E [ 1i 0i 1i > 0i ] Proof (See MHE 4.4.1)
14 The Compliant Subpopulation LATE compliers are subjects with 1i > 0i This language comes from randomized trials where i is treatment assigned and i is treatment received (more on this soon) LATE assumptions partition the world: Compliers D 1i > D 0i Always-takers D 1i = D 0i = 1 Never-takers D 1i = D 0i = 0 IV is uninformative for always-takers and never-takers because treatment status for these types is unchanged by the instrument (just as panel models with fixed effects capture effects only for "changers") Of course, we can assume effects are the same for all three groups (this is the constant-effects model)
15 The Compliant Subpopulation (cont.) From the fact that i = 0i + ( 1i 0i ) i, we learn that: { i = 1} = { 0i = 1i = 1} {{ 1i 0i = 1} { i = 1}} In words: {treated} = {always-takers} + {compliers assigned i = 1} TOT is a weighted average of effects on always-takers and compliers Latent-index example: i = 1[γ 0 + γ 1 i > v i ], where v i is correlated with potential outcomes but indep. of i. Compliers have γ 0 + γ 1 > v i > γ 0, so E [ 1i 0i 1i > 0i ] = E [ 1i 0i γ 0 + γ 1 > v i > γ 0 ] This usually differs from TOT
16 IV in Randomized Trials The compliance problem in RCTs: Not all those randomly assigned to the treatment group are treated When compliance is voluntary, an as-treated analysis is contaminated by selection bias Intention-to-treat analyses preserve independence but are diluted by non-compliance IV solves this problem: i, is a dummy variable indicating random assignment to the treatment group; i is a dummy indicating whether treatment was actually received There are no always-takers (no controls treated), so LATE = TOT THE BLOOM RESULT E [ i i = 1] E [ i i = 0] E [ i i = 1] = ITT effect compliance rate = E [ 1i 0i i = 1] Direct proof (Bloom, 1984; See MHE 4.4.3).
17 Bloom Example 1: Training The Job Training Partnership Act (JTPA) included a large randomized trial to evaluate the effect of training on earnings The JTPA offered treatment randomly; participation was voluntary Roughly 60 percent of those offered training received it The IV setup is i indicates those who received JTPA services i indicates the random offer of treatment i is earnings in the 30 months since random assignment The first-stage here is the compliance rate E [ i i = 1] E [ i i = 0] = = P[ i = 1 i = 1] (about.02 of the control group received JTPA services) Table Selection bias in OLS (as delivered); ITT (as assigned) is diluted; IV (TOT) is... just right!
18 Bloom Example 2: Battered Wives What s the best police response to domestic violence? The Minneapolis Domestic Violence Experiment (MDVE; Sherman and Berk, 1984) tries to find out Police were randomly assigned to advise, separate, or arrest Substantial compliance problems as offi cers made their own judgements in the field Assigned Treatment Table 1: Assigned and Delivered Treatments in Spousal Assault Cases Delivered Treatment Coddled Arrest Advise Separate Total Arrest 98.9 (91) 0.0 (0) 1.1 (1) 29.3 (92) Advise 17.6 (19) 77.8 (84) 4.6 (5) 34.4 (108) Separate 22.8 (26) 4.4 (5) 72.8 (83) 36.3 (114) Total 43.4 (136) 28.3 (89) 28.3 (89) 100.0(314) Notes: The table shows statistics from Sherman and Berk (1984), Table 1.
19 MDVE First-Stage and Reduced Forms Table 2: First Stage and Reduced Forms for Model 1 Endogenous Variable is Coddled Coddled-assigned Weapon Chem. Influence Dep. Var. mean First-Stage Reduced Form (ITT) (1) (2) * (3) (4) * (0.043) (0.043) (0.047) (0.041) (0.045) (0.042) (0.040) (0.038) (coddled-delivered) (failed) Notes: The table reports OLS estimates of the first-stage and reduced form for Model 1 in the text. * Other covariates include year and quarter dummies, and dummies for non-white and mixed race.
20 MDVE OLS and 2SLS Table 3: OLS and 2SLS Estimates for Model 1 Endogenous Variable is Coddled Coddled-delivered Weapon Chem. Influence OLS IV/2SLS (1) (2) * (3) (4) * (0.044) (0.038) (0.060) (0.053) (0.043) (0.043) (0.039) (0.039) Notes: The Table reports OLS and 2SLS estimates of the structural equation in Model 1. * Other covariates include year and quarter dummies, and dummies for non-white and mixed race.
21 Models with Variable Treatment Intensity
22 Average Causal Response [Skip to Summary] Suppose that i takes on values in the set {0, 1,..., s}. There are s unit causal effects, Y si Y s 1,i. A linear model assumes these are the same for all s and for all i, clearly unrealistic Fear not! 2SLS generates a weighted average of unit causal effects Suppose a single binary instrument, i (say, a dummy for late quarter births) is used to estimate the returns to schooling Let 1i denote the schooling i would get if i = 1, and let 0i denote the schooling i would get if i = 0. We observe i = 0i (1 i )+ i 1i Key assumptions: Independence and Exclusion. {Y 0i, Y 1i,..., Y si ; 0i, 1i } i First Stage. E [ 1i 0i ] = 0 Monotonicity. 1i 0i 0 i (or vice versa)
23 The ACR Theorem Angrist and Imbens (1995) show E [ i i = 1] E [ i i = 0] E [ i i = 1] E [ i i = 0] = s ω s E [Y si Y s 1,i 1i s > 0i ] s=1 where ω s = P[ 1i s > 0i ] s j=1 P[ 1i j > 0i ] The weights ω s are non-negative and sum to 1. The Wald estimator is a weighted average of the unit causal response along the length of a potentially nonlinear causal relation. E [Y si Y s 1,i 1i s > 0i ], is the average difference in potential outcomes for compliers at point s, people driven by the instrument from a treatment intensity less than s to at least s.
24 The ACR Weighting Function The relative size of the group of compliers at point s is P[ 1i s > 0i ]. This is P [ 1i s > 0i ] = P [ 1i s] P [ 0i s] = P [ 0i < s] P [ 1i < s], By Independence, this is an observed CDF difference: P[ 0i < s] P[ 1i < s] = P[ i < s i = 0] P[ i < s i = 1] Finally, because the mean of a non-negative random variable is one minus the CDF, = E [ i i = 1] E [ i i = 0] s j=1 (P [ i < j i = 0] P [ i < j i = 1]) = s P [ 1i j > 0i ] j=1 ACR weighting is proportional to the difference in the CDFs of treatment intensity with the instrument switched off and on
 i is years of schooling i indicates men born in the fourth quarter i is log weekly wage CDFs by quarter")
25 QOB Estimates of the Returns to Schooling The ACR weighting function shows us where the action is... Angrist and Krueger (1991) i is years of schooling i indicates men born in the fourth quarter i is log weekly wage CDFs by quarter of birth (first compared with fourth)=
26 Empirical Weighting Function For men born in the 1970 Census
27 More Variable Treatment Intensities Returns to schooling again, identified using compulsory attendance and child labor laws (Acemoglu and Angrist, 2000) Class size (Angrist and Lavy, 1999; Krueger, 1999) i is test score; i is class size i is Maimonides Rule (regression-discontinuity) or random assignment GRE test preparation (Powers and Swinton, 1984) i is GRE analytical score; i is hours of study i is randomly assigned letter of encouragement Maternal smoking (Permutt and Hebel, 1989) i is birthweight; i is mother s pre-natal smoking i is randomly assigned offer of anti-smoking counseling Quantity-quality trade-offs (Angrist, Lavy, and Schlosser, 2006) i is schooling, earnings, etc.; i is sibship size i is derived from twins and sibling-sex composition
28 Summary IV provides a powerful and flexible framework for causal inference An observational alternative to random assignment with a strong claim on internal validity A framework for other observational designs; Fuzzy RD is IV (See MHE Chpt 6) IV solves the compliance problem in randomized trials (the biomed RCT world has been slow to absorb this; e.g., AIDS vaccine trials) Of course, we can t always find a good instrument; sometimes the best we can do is run regressions And we might want to do that anyway, as in our recent charter study (Abdulkadiroglu, et al. 2009) Here, we use lotteries to create instruments for charter attendance; this solves the selection problem... for some But not everyone is in a lottery; this limits external validity We validate regression estimates in the lottery sample; this establishes internal validity of regression, which can used in a wider sample Internal and external validity are complements!
29 Tables and Figures
30
31 Instrumental Variables in Action 163 Table Results from the JTPA experiment: OLS and IV estimates of training impacts Comparisons by Comparisons by Instrumental Variable Training Status (OLS) Assignment Status (ITT) Estimates (IV) Without With Without With Without With Covariates Covariates Covariates Covariates Covariates Covariates (1) (2) (3) (4) (5) (6) A. Men 3,970 3,754 1, ,825 1,593 (555) (536) (569) (546) (928) (895) B. Women 2,133 2,215 1,243 1,139 1,942 1,780 (345) (334) (359) (341) (560) (532) Notes: Authors tabulation of JTPA study data. The table reports OLS, ITT, and IV estimates of the effect of subsidized training on earnings in the JTPA experiment. Columns 1 and 2 show differences in earnings by training status; columns 3 and 4 show differences by random-assignment status. Columns 5 and 6 report the result of using random-assignment status as an instrument for training. The covariates used for columns 2, 4, and 6 are high school or GED, black, Hispanic, married, worked less than 13 weeks in past year, AFDC (for women), plus indicators for the JTPA service strategy recommended, age group, and second follow-up survey. Robust standard errors are shown in parentheses. There are 5,102 men and 6,102 women in the sample.
32 Table Probabilities of compliance in instrumental variables studies Compliance Probabilities Endogenous First Stage, Variable (d) Instrument (z) Sample P[d = 1] P[d 1 > d 0 ] P[z = 1] P[d 1 > d 0 d = 1] P[d 1 > d 0 d = 0] (2) (3) (4) (5) (6) (7) (8) (9) Veteran status Draft eligibility White men born in 1950 Non-white men born in 1950 Twins at second birth ans More than two children and and Married women aged with two or more children in First two children are same sex High school graduatquarter Third- or fourth- Men born between birth 1930 and 1939 High school graduate State requires 11 White men aged or more years of school attendance e table computes the absolute and relative size of the complier population for a number of instrumental variables. The first ted in column 6, gives the absolute size of the complier group. Columns 8 and 9 show the size of the complier population he treated and untreated populations.
33 This calculation is illustrated in table 4.4.3, which reports 172 Chapter 4 Table Complier characteristics ratios for twins and sex composition instruments Twins at Second Birth First Two Children Are Same Sex P[x 1i = 1 P[x 1i = 1 d 1i > d 0i ]/ P[x 1i = 1 P[x 1i = 1 d 1i > d 0i ]/ P[x 1i = 1] d 1i > d 0i ] P[x 1i = 1] d 1i > d 0i ] P[x 1i = 1] Variable (1) (2) (3) (4) (5) Age 30 or older at first birth Black or hispanic High school graduate College graduate Notes: The table reports an analysis of complier characteristics for twins and sex composition instruments. The ratios in columns 3 and 5 give the relative likelihood that compliers have the characteristic indicated at left. Data are from the 1980 census 5 percent sample, including married mothers aged with at least two children, as in Angrist and Evans (1998). The sample size is 254,654 for all columns.
Instrumental Variables in Action
 Instrumental Variables in Action Remarks in honor of P.G. Wright s 150th birthday Joshua D. Angrist MIT and NBER October 2011 What is Econometrics Anyway? What s the difference between statistics and econometrics?
Instrumental Variables (Take 2): Causal Effects in a Heterogeneous World
: Causal Effects in a Heterogeneous World") Instrumental Variables (Take 2): Causal Effects in a Heterogeneous World Josh Angrist MIT 14.387 (Fall 2014) Our Constant-Effects Benchmark The traditional IV framework is the linear, constant-effects
Instrumental Variables (Take 2): Causal Effects in a Heterogeneous World Josh Angrist MIT 14.387 (Fall 2014) Our Constant-Effects Benchmark The traditional IV framework is the linear, constant-effects
150C Causal Inference
 150C Causal Inference Instrumental Variables: Modern Perspective with Heterogeneous Treatment Effects Jonathan Mummolo May 22, 2017 Jonathan Mummolo 150C Causal Inference May 22, 2017 1 / 26 Two Views
IV Estimation WS 2014/15 SS Alexander Spermann. IV Estimation
 SS 2010 WS 2014/15 Alexander Spermann Evaluation With Non-Experimental Approaches Selection on Unobservables Natural Experiment (exogenous variation in a variable) DiD Example: Card/Krueger (1994) Minimum
Groupe de lecture. Instrumental Variables Estimates of the Effect of Subsidized Training on the Quantiles of Trainee Earnings. Abadie, Angrist, Imbens
 Groupe de lecture Instrumental Variables Estimates of the Effect of Subsidized Training on the Quantiles of Trainee Earnings Abadie, Angrist, Imbens Econometrica (2002) 02 décembre 2010 Objectives Using
ExtrapoLATE-ing: External Validity and Overidentification in the LATE framework. March 2011
 ExtrapoLATE-ing: External Validity and Overidentification in the LATE framework Josh Angrist MIT Iván Fernández-Val BU March 2011 Instrumental Variables and External Validity Local Average Treatment Effects
AGEC 661 Note Fourteen
 AGEC 661 Note Fourteen Ximing Wu 1 Selection bias 1.1 Heckman s two-step model Consider the model in Heckman (1979) Y i = X iβ + ε i, D i = I {Z iγ + η i > 0}. For a random sample from the population,
Recitation Notes 6. Konrad Menzel. October 22, 2006
 Recitation Notes 6 Konrad Menzel October, 006 Random Coefficient Models. Motivation In the empirical literature on education and earnings, the main object of interest is the human capital earnings function
Instrumental Variables
 Instrumental Variables Teppei Yamamoto Keio University Introduction to Causal Inference Spring 2016 Noncompliance in Randomized Experiments Often we cannot force subjects to take specific treatments Units
Instrumental Variables
 Instrumental Variables Yona Rubinstein July 2016 Yona Rubinstein (LSE) Instrumental Variables 07/16 1 / 31 The Limitation of Panel Data So far we learned how to account for selection on time invariant
Sensitivity checks for the local average treatment effect
 Sensitivity checks for the local average treatment effect Martin Huber March 13, 2014 University of St. Gallen, Dept. of Economics Abstract: The nonparametric identification of the local average treatment
Recitation Notes 5. Konrad Menzel. October 13, 2006
 ecitation otes 5 Konrad Menzel October 13, 2006 1 Instrumental Variables (continued) 11 Omitted Variables and the Wald Estimator Consider a Wald estimator for the Angrist (1991) approach to estimating
Econometrics of causal inference. Throughout, we consider the simplest case of a linear outcome equation, and homogeneous
 Econometrics of causal inference Throughout, we consider the simplest case of a linear outcome equation, and homogeneous effects: y = βx + ɛ (1) where y is some outcome, x is an explanatory variable, and
II. MATCHMAKER, MATCHMAKER
 II. MATCHMAKER, MATCHMAKER Josh Angrist MIT 14.387 Fall 2014 Agenda Matching. What could be simpler? We look for causal effects by comparing treatment and control within subgroups where everything... or
Applied Microeconometrics. Maximilian Kasy
 Applied Microeconometrics Maximilian Kasy 7) Distributional Effects, quantile regression (cf. Mostly Harmless Econometrics, chapter 7) Sir Francis Galton (Natural Inheritance, 1889): It is difficult to
REGRESSION RECAP. Josh Angrist. MIT (Fall 2014)
") REGRESSION RECAP Josh Angrist MIT 14.387 (Fall 2014) Regression: What You Need to Know We spend our lives running regressions (I should say: "regressions run me"). And yet this basic empirical tool is
REGRESSION RECAP Josh Angrist MIT 14.387 (Fall 2014) Regression: What You Need to Know We spend our lives running regressions (I should say: "regressions run me"). And yet this basic empirical tool is
Introduction to causal identification. Nidhiya Menon IGC Summer School, New Delhi, July 2015
 Introduction to causal identification Nidhiya Menon IGC Summer School, New Delhi, July 2015 Outline 1. Micro-empirical methods 2. Rubin causal model 3. More on Instrumental Variables (IV) Estimating causal
Imbens, Lecture Notes 2, Local Average Treatment Effects, IEN, Miami, Oct 10 1
 Imbens, Lecture Notes 2, Local Average Treatment Effects, IEN, Miami, Oct 10 1 Lectures on Evaluation Methods Guido Imbens Impact Evaluation Network October 2010, Miami Methods for Estimating Treatment
Causal Inference with General Treatment Regimes: Generalizing the Propensity Score
 Causal Inference with General Treatment Regimes: Generalizing the Propensity Score David van Dyk Department of Statistics, University of California, Irvine vandyk@stat.harvard.edu Joint work with Kosuke
The Problem of Causality in the Analysis of Educational Choices and Labor Market Outcomes Slides for Lectures
 The Problem of Causality in the Analysis of Educational Choices and Labor Market Outcomes Slides for Lectures Andrea Ichino (European University Institute and CEPR) February 28, 2006 Abstract This course
Instrumental Variables
 Instrumental Variables Kosuke Imai Harvard University STAT186/GOV2002 CAUSAL INFERENCE Fall 2018 Kosuke Imai (Harvard) Noncompliance in Experiments Stat186/Gov2002 Fall 2018 1 / 18 Instrumental Variables
Lecture 8. Roy Model, IV with essential heterogeneity, MTE
 Lecture 8. Roy Model, IV with essential heterogeneity, MTE Economics 2123 George Washington University Instructor: Prof. Ben Williams Heterogeneity When we talk about heterogeneity, usually we mean heterogeneity
A Course in Applied Econometrics. Lecture 5. Instrumental Variables with Treatment Effect. Heterogeneity: Local Average Treatment Effects.
 A Course in Applied Econometrics Lecture 5 Outline. Introduction 2. Basics Instrumental Variables with Treatment Effect Heterogeneity: Local Average Treatment Effects 3. Local Average Treatment Effects
Chapter Course notes. Experiments and Quasi-Experiments. Michael Ash CPPA. Main point of experiments: convincing test of how X affects Y.
 Experiments and Quasi-Experiments Chapter 11.3 11.8 Michael Ash CPPA Experiments p.1/20 Course notes Main point of experiments: convincing test of how X affects Y. Experiments p.2/20 The D-i-D estimator
NBER WORKING PAPER SERIES EXTRAPOLATE-ING: EXTERNAL VALIDITY AND OVERIDENTIFICATION IN THE LATE FRAMEWORK. Joshua Angrist Ivan Fernandez-Val
 NBER WORKING PAPER SERIES EXTRAPOLATE-ING: EXTERNAL VALIDITY AND OVERIDENTIFICATION IN THE LATE FRAMEWORK Joshua Angrist Ivan Fernandez-Val Working Paper 16566 http://www.nber.org/papers/w16566 NATIONAL
Estimating the Dynamic Effects of a Job Training Program with M. Program with Multiple Alternatives
 Estimating the Dynamic Effects of a Job Training Program with Multiple Alternatives Kai Liu 1, Antonio Dalla-Zuanna 2 1 University of Cambridge 2 Norwegian School of Economics June 19, 2018 Introduction
NBER WORKING PAPER SERIES TREATMENT EFFECT HETEROGENEITY IN THEORY AND PRACTICE. Joshua D. Angrist
 NBER WORKING PAPER SERIES TREATMENT EFFECT HETEROGENEITY IN THEORY AND PRACTICE Joshua D. Angrist Working Paper 9708 http://www.nber.org/papers/w9708 NATIONAL BUREAU OF ECONOMIC RESEARCH 1050 Massachusetts
Empirical Methods in Applied Microeconomics
 Empirical Methods in Applied Microeconomics Jörn-Ste en Pischke LSE November 2007 1 Nonlinearity and Heterogeneity We have so far concentrated on the estimation of treatment e ects when the treatment e
PSC 504: Instrumental Variables
 PSC 504: Instrumental Variables Matthew Blackwell 3/28/2013 Instrumental Variables and Structural Equation Modeling Setup e basic idea behind instrumental variables is that we have a treatment with unmeasured
Prediction and causal inference, in a nutshell
 Prediction and causal inference, in a nutshell 1 Prediction (Source: Amemiya, ch. 4) Best Linear Predictor: a motivation for linear univariate regression Consider two random variables X and Y. What is
Quantitative Economics for the Evaluation of the European Policy
 Quantitative Economics for the Evaluation of the European Policy Dipartimento di Economia e Management Irene Brunetti Davide Fiaschi Angela Parenti 1 25th of September, 2017 1 ireneb@ec.unipi.it, davide.fiaschi@unipi.it,
Instrumental Variables
 Instrumental Variables Caveat An Instrumental Variable is a somewhat complicated methodological idea. Can be technically challenging at first. Good applications often are embedded in the language and questions
Methods to Estimate Causal Effects Theory and Applications. Prof. Dr. Sascha O. Becker U Stirling, Ifo, CESifo and IZA
 Methods to Estimate Causal Effects Theory and Applications Prof. Dr. Sascha O. Becker U Stirling, Ifo, CESifo and IZA last update: 21 August 2009 Preliminaries Address Prof. Dr. Sascha O. Becker Stirling
Applied Microeconometrics Chapter 8 Regression Discontinuity (RD)
") 1 / 26 Applied Microeconometrics Chapter 8 Regression Discontinuity (RD) Romuald Méango and Michele Battisti LMU, SoSe 2016 Overview What is it about? What are its assumptions? What are the main applications?
1 / 26 Applied Microeconometrics Chapter 8 Regression Discontinuity (RD) Romuald Méango and Michele Battisti LMU, SoSe 2016 Overview What is it about? What are its assumptions? What are the main applications?
IsoLATEing: Identifying Heterogeneous Effects of Multiple Treatments
 IsoLATEing: Identifying Heterogeneous Effects of Multiple Treatments Peter Hull December 2014 PRELIMINARY: Please do not cite or distribute without permission. Please see www.mit.edu/~hull/research.html
Testing for Rank Invariance or Similarity in Program Evaluation: The Effect of Training on Earnings Revisited
 Testing for Rank Invariance or Similarity in Program Evaluation: The Effect of Training on Earnings Revisited Yingying Dong and Shu Shen UC Irvine and UC Davis Sept 2015 @ Chicago 1 / 37 Dong, Shen Testing
Applied Microeconometrics I
 Applied Microeconometrics I Lecture 6: Instrumental variables in action Manuel Bagues Aalto University September 21 2017 Lecture Slides 1/ 20 Applied Microeconometrics I A few logistic reminders... Tutorial
PhD/MA Econometrics Examination January 2012 PART A
 PhD/MA Econometrics Examination January 2012 PART A ANSWER ANY TWO QUESTIONS IN THIS SECTION NOTE: (1) The indicator function has the properties: (2) Question 1 Let, [defined as if using the indicator
Regression Discontinuity Designs.
 Regression Discontinuity Designs. Department of Economics and Management Irene Brunetti ireneb@ec.unipi.it 31/10/2017 I. Brunetti Labour Economics in an European Perspective 31/10/2017 1 / 36 Introduction
Empirical Methods in Applied Economics
 Empirical Methods in Applied Economics Jörn-Ste en Pischke LSE October 2007 1 Instrumental Variables 1.1 Basics A good baseline for thinking about the estimation of causal e ects is often the randomized
Introduction to Econometrics
 Introduction to Econometrics STAT-S-301 Experiments and Quasi-Experiments (2016/2017) Lecturer: Yves Dominicy Teaching Assistant: Elise Petit 1 Why study experiments? Ideal randomized controlled experiments
Write your identification number on each paper and cover sheet (the number stated in the upper right hand corner on your exam cover).
.") Formatmall skapad: 2011-12-01 Uppdaterad: 2015-03-06 / LP Department of Economics Course name: Empirical Methods in Economics 2 Course code: EC2404 Semester: Spring 2015 Type of exam: MAIN Examiner: Peter
Formatmall skapad: 2011-12-01 Uppdaterad: 2015-03-06 / LP Department of Economics Course name: Empirical Methods in Economics 2 Course code: EC2404 Semester: Spring 2015 Type of exam: MAIN Examiner: Peter
Potential Outcomes Model (POM)
") Potential Outcomes Model (POM) Relationship Between Counterfactual States Causality Empirical Strategies in Labor Economics, Angrist Krueger (1999): The most challenging empirical questions in economics
Potential Outcomes Model (POM) Relationship Between Counterfactual States Causality Empirical Strategies in Labor Economics, Angrist Krueger (1999): The most challenging empirical questions in economics
Has the Family Planning Policy Improved the Quality of the Chinese New. Generation? Yingyao Hu University of Texas at Austin
 Very preliminary and incomplete Has the Family Planning Policy Improved the Quality of the Chinese New Generation? Yingyao Hu University of Texas at Austin Zhong Zhao Institute for the Study of Labor (IZA)
IV Estimation and its Limitations: Weak Instruments and Weakly Endogeneous Regressors
 IV Estimation and its Limitations: Weak Instruments and Weakly Endogeneous Regressors Laura Mayoral IAE, Barcelona GSE and University of Gothenburg Gothenburg, May 2015 Roadmap Deviations from the standard
Empirical approaches in public economics
 Empirical approaches in public economics ECON4624 Empirical Public Economics Fall 2016 Gaute Torsvik Outline for today The canonical problem Basic concepts of causal inference Randomized experiments Non-experimental
Experiments and Quasi-Experiments
 Experiments and Quasi-Experiments (SW Chapter 13) Outline 1. Potential Outcomes, Causal Effects, and Idealized Experiments 2. Threats to Validity of Experiments 3. Application: The Tennessee STAR Experiment
On Variance Estimation for 2SLS When Instruments Identify Different LATEs
 On Variance Estimation for 2SLS When Instruments Identify Different LATEs Seojeong Lee June 30, 2014 Abstract Under treatment effect heterogeneity, an instrument identifies the instrumentspecific local
Predicting the Treatment Status
 Predicting the Treatment Status Nikolay Doudchenko 1 Introduction Many studies in social sciences deal with treatment effect models. 1 Usually there is a treatment variable which determines whether a particular
Job Training Partnership Act (JTPA)
") Causal inference Part I.b: randomized experiments, matching and regression (this lecture starts with other slides on randomized experiments) Frank Venmans Example of a randomized experiment: Job Training
Causal inference Part I.b: randomized experiments, matching and regression (this lecture starts with other slides on randomized experiments) Frank Venmans Example of a randomized experiment: Job Training
Rockefeller College University at Albany
 Rockefeller College University at Albany PAD 705 Handout: Simultaneous quations and Two-Stage Least Squares So far, we have studied examples where the causal relationship is quite clear: the value of the
Partial Identification of Average Treatment Effects in Program Evaluation: Theory and Applications
 University of Miami Scholarly Repository Open Access Dissertations Electronic Theses and Dissertations 2013-07-11 Partial Identification of Average Treatment Effects in Program Evaluation: Theory and Applications
The problem of causality in microeconometrics.
 The problem of causality in microeconometrics. Andrea Ichino European University Institute April 15, 2014 Contents 1 The Problem of Causality 1 1.1 A formal framework to think about causality....................................
The returns to schooling, ability bias, and regression
 The returns to schooling, ability bias, and regression Jörn-Steffen Pischke LSE October 4, 2016 Pischke (LSE) Griliches 1977 October 4, 2016 1 / 44 Counterfactual outcomes Scholing for individual i is
Topics in Applied Econometrics and Development - Spring 2014
 Topic 2: Topics in Applied Econometrics and Development - Spring 2014 Single-Equation Linear Model The population model is linear in its parameters: y = β 0 + β 1 x 1 + β 2 x 2 +... + β K x K + u - y,
Controlling for Time Invariant Heterogeneity
 Controlling for Time Invariant Heterogeneity Yona Rubinstein July 2016 Yona Rubinstein (LSE) Controlling for Time Invariant Heterogeneity 07/16 1 / 19 Observables and Unobservables Confounding Factors
Flexible Estimation of Treatment Effect Parameters
 Flexible Estimation of Treatment Effect Parameters Thomas MaCurdy a and Xiaohong Chen b and Han Hong c Introduction Many empirical studies of program evaluations are complicated by the presence of both
The problem of causality in microeconometrics.
 The problem of causality in microeconometrics. Andrea Ichino University of Bologna and Cepr June 11, 2007 Contents 1 The Problem of Causality 1 1.1 A formal framework to think about causality....................................
14.74 Lecture 10: The returns to human capital: education
 14.74 Lecture 10: The returns to human capital: education Esther Duflo March 7, 2011 Education is a form of human capital. You invest in it, and you get returns, in the form of higher earnings, etc...
Causal Inference with and without Experiments I
 http://www.econ.ucsd.edu/~elib/250a/ Causal Inference with and without Experiments I 1. The Big Picture: Data, Statistics, Economic Theory and Applied Econometrics 2. Causal Inference: The SAT Prep example
Testing the validity of the sibling sex ratio instrument
 Testing the validity of the sibling sex ratio instrument Martin Huber September 1, 2014 University of Fribourg, Dept. of Economics Abstract: We test the validity of the sibling sex ratio instrument in
Instrumental Variables
 Instrumental Variables Econometrics II R. Mora Department of Economics Universidad Carlos III de Madrid Master in Industrial Organization and Markets Outline 1 2 3 OLS y = β 0 + β 1 x + u, cov(x, u) =
Principles Underlying Evaluation Estimators
 The Principles Underlying Evaluation Estimators James J. University of Chicago Econ 350, Winter 2019 The Basic Principles Underlying the Identification of the Main Econometric Evaluation Estimators Two
ECONOMETRICS II (ECO 2401) Victor Aguirregabiria. Spring 2018 TOPIC 4: INTRODUCTION TO THE EVALUATION OF TREATMENT EFFECTS
 Victor Aguirregabiria. Spring 2018 TOPIC 4: INTRODUCTION TO THE EVALUATION OF TREATMENT EFFECTS") ECONOMETRICS II (ECO 2401) Victor Aguirregabiria Spring 2018 TOPIC 4: INTRODUCTION TO THE EVALUATION OF TREATMENT EFFECTS 1. Introduction and Notation 2. Randomized treatment 3. Conditional independence
ECONOMETRICS II (ECO 2401) Victor Aguirregabiria Spring 2018 TOPIC 4: INTRODUCTION TO THE EVALUATION OF TREATMENT EFFECTS 1. Introduction and Notation 2. Randomized treatment 3. Conditional independence
Michael Lechner Causal Analysis RDD 2014 page 1. Lecture 7. The Regression Discontinuity Design. RDD fuzzy and sharp
 page 1 Lecture 7 The Regression Discontinuity Design fuzzy and sharp page 2 Regression Discontinuity Design () Introduction (1) The design is a quasi-experimental design with the defining characteristic
ted: a Stata Command for Testing Stability of Regression Discontinuity Models
 ted: a Stata Command for Testing Stability of Regression Discontinuity Models Giovanni Cerulli IRCrES, Research Institute on Sustainable Economic Growth National Research Council of Italy 2016 Stata Conference
EMERGING MARKETS - Lecture 2: Methodology refresher
 EMERGING MARKETS - Lecture 2: Methodology refresher Maria Perrotta April 4, 2013 SITE http://www.hhs.se/site/pages/default.aspx My contact: maria.perrotta@hhs.se Aim of this class There are many different
Selection endogenous dummy ordered probit, and selection endogenous dummy dynamic ordered probit models
 Selection endogenous dummy ordered probit, and selection endogenous dummy dynamic ordered probit models Massimiliano Bratti & Alfonso Miranda In many fields of applied work researchers need to model an
ECO375 Tutorial 9 2SLS Applications and Endogeneity Tests
 ECO375 Tutorial 9 2SLS Applications and Endogeneity Tests Matt Tudball University of Toronto Mississauga November 23, 2017 Matt Tudball (University of Toronto) ECO375H5 November 23, 2017 1 / 33 Hausman
Causality and Experiments
 Causality and Experiments Michael R. Roberts Department of Finance The Wharton School University of Pennsylvania April 13, 2009 Michael R. Roberts Causality and Experiments 1/15 Motivation Introduction
A Test for Rank Similarity and Partial Identification of the Distribution of Treatment Effects Preliminary and incomplete
 A Test for Rank Similarity and Partial Identification of the Distribution of Treatment Effects Preliminary and incomplete Brigham R. Frandsen Lars J. Lefgren April 30, 2015 Abstract We introduce a test
One Economist s Perspective on Some Important Estimation Issues
 One Economist s Perspective on Some Important Estimation Issues Jere R. Behrman W.R. Kenan Jr. Professor of Economics & Sociology University of Pennsylvania SRCD Seattle Preconference on Interventions
Statistical Analysis of Randomized Experiments with Nonignorable Missing Binary Outcomes
 Statistical Analysis of Randomized Experiments with Nonignorable Missing Binary Outcomes Kosuke Imai Department of Politics Princeton University July 31 2007 Kosuke Imai (Princeton University) Nonignorable
Noncompliance in Randomized Experiments
 Noncompliance in Randomized Experiments Kosuke Imai Harvard University STAT186/GOV2002 CAUSAL INFERENCE Fall 2018 Kosuke Imai (Harvard) Noncompliance in Experiments Stat186/Gov2002 Fall 2018 1 / 15 Encouragement
1 Motivation for Instrumental Variable (IV) Regression
 Regression") ECON 370: IV & 2SLS 1 Instrumental Variables Estimation and Two Stage Least Squares Econometric Methods, ECON 370 Let s get back to the thiking in terms of cross sectional (or pooled cross sectional) data
ECON 370: IV & 2SLS 1 Instrumental Variables Estimation and Two Stage Least Squares Econometric Methods, ECON 370 Let s get back to the thiking in terms of cross sectional (or pooled cross sectional) data
Selection on Observables: Propensity Score Matching.
 Selection on Observables: Propensity Score Matching. Department of Economics and Management Irene Brunetti ireneb@ec.unipi.it 24/10/2017 I. Brunetti Labour Economics in an European Perspective 24/10/2017
Education Production Functions. April 7, 2009
 Education Production Functions April 7, 2009 Outline I Production Functions for Education Hanushek Paper Card and Krueger Tennesee Star Experiment Maimonides Rule What do I mean by Production Function?
Exam ECON5106/9106 Fall 2018
 Exam ECO506/906 Fall 208. Suppose you observe (y i,x i ) for i,2,, and you assume f (y i x i ;α,β) γ i exp( γ i y i ) where γ i exp(α + βx i ). ote that in this case, the conditional mean of E(y i X x
Using Instrumental Variables for Inference about Policy Relevant Treatment Parameters
 Using Instrumental Variables for Inference about Policy Relevant Treatment Parameters Magne Mogstad Andres Santos Alexander Torgovitsky July 22, 2016 Abstract We propose a method for using instrumental
Identification Analysis for Randomized Experiments with Noncompliance and Truncation-by-Death
 Identification Analysis for Randomized Experiments with Noncompliance and Truncation-by-Death Kosuke Imai First Draft: January 19, 2007 This Draft: August 24, 2007 Abstract Zhang and Rubin 2003) derives
Econ 2148, fall 2017 Instrumental variables I, origins and binary treatment case
 Econ 2148, fall 2017 Instrumental variables I, origins and binary treatment case Maximilian Kasy Department of Economics, Harvard University 1 / 40 Agenda instrumental variables part I Origins of instrumental
Ec1123 Section 7 Instrumental Variables
 Ec1123 Section 7 Instrumental Variables Andrea Passalacqua Harvard University andreapassalacqua@g.harvard.edu November 16th, 2017 Andrea Passalacqua (Harvard) Ec1123 Section 7 Instrumental Variables November
Linearity in Instrumental Variables Estimation: Problems and Solutions
 DISCUSSION PAPER SERIES IZA DP No. 5216 Linearity in Instrumental Variables Estimation: Problems and Solutions Magne Mogstad Matthew Wiswall September 2010 Forschungsinstitut zur Zukunft der Arbeit Institute
What s New in Econometrics. Lecture 13
 What s New in Econometrics Lecture 13 Weak Instruments and Many Instruments Guido Imbens NBER Summer Institute, 2007 Outline 1. Introduction 2. Motivation 3. Weak Instruments 4. Many Weak) Instruments
Single-Equation GMM: Endogeneity Bias
 Single-Equation GMM: Lecture for Economics 241B Douglas G. Steigerwald UC Santa Barbara January 2012 Initial Question Initial Question How valuable is investment in college education? economics - measure
Regression Discontinuity
 Regression Discontinuity Christopher Taber Department of Economics University of Wisconsin-Madison October 24, 2017 I will describe the basic ideas of RD, but ignore many of the details Good references
Supplementary material to: Tolerating deance? Local average treatment eects without monotonicity.
 Supplementary material to: Tolerating deance? Local average treatment eects without monotonicity. Clément de Chaisemartin September 1, 2016 Abstract This paper gathers the supplementary material to de
ECON Introductory Econometrics. Lecture 17: Experiments
 ECON4150 - Introductory Econometrics Lecture 17: Experiments Monique de Haan (moniqued@econ.uio.no) Stock and Watson Chapter 13 Lecture outline 2 Why study experiments? The potential outcome framework.
SREE WORKSHOP ON PRINCIPAL STRATIFICATION MARCH Avi Feller & Lindsay C. Page
 SREE WORKSHOP ON PRINCIPAL STRATIFICATION MARCH 2017 Avi Feller & Lindsay C. Page Agenda 2 Conceptual framework (45 minutes) Small group exercise (30 minutes) Break (15 minutes) Estimation & bounds (1.5
Truncation and Censoring
 Truncation and Censoring Laura Magazzini laura.magazzini@univr.it Laura Magazzini (@univr.it) Truncation and Censoring 1 / 35 Truncation and censoring Truncation: sample data are drawn from a subset of
Instrumental Variables. Ethan Kaplan
 Instrumental Variables Ethan Kaplan 1 Instrumental Variables: Intro. Bias in OLS: Consider a linear model: Y = X + Suppose that then OLS yields: cov (X; ) = ^ OLS = X 0 X 1 X 0 Y = X 0 X 1 X 0 (X + ) =)
Growth Mixture Modeling and Causal Inference. Booil Jo Stanford University
 Growth Mixture Modeling and Causal Inference Booil Jo Stanford University booil@stanford.edu Conference on Advances in Longitudinal Methods inthe Socialand and Behavioral Sciences June 17 18, 2010 Center
The Econometric Evaluation of Policy Design: Part I: Heterogeneity in Program Impacts, Modeling Self-Selection, and Parameters of Interest
 The Econometric Evaluation of Policy Design: Part I: Heterogeneity in Program Impacts, Modeling Self-Selection, and Parameters of Interest Edward Vytlacil, Yale University Renmin University, Department
Chapter 6: Policy Evaluation Methods: Treatment Effects
 Chapter 6: Policy Evaluation Methods: Treatment Effects Joan Llull Microeconometrics IDEA PhD Program I. Potential Outcomes and Causality A. Potential Outcomes, Selection Bias, and Treatment Effects Consider
WORKSHOP ON PRINCIPAL STRATIFICATION STANFORD UNIVERSITY, Luke W. Miratrix (Harvard University) Lindsay C. Page (University of Pittsburgh)
 Lindsay C. Page (University of Pittsburgh)") WORKSHOP ON PRINCIPAL STRATIFICATION STANFORD UNIVERSITY, 2016 Luke W. Miratrix (Harvard University) Lindsay C. Page (University of Pittsburgh) Our team! 2 Avi Feller (Berkeley) Jane Furey (Abt Associates)
WORKSHOP ON PRINCIPAL STRATIFICATION STANFORD UNIVERSITY, 2016 Luke W. Miratrix (Harvard University) Lindsay C. Page (University of Pittsburgh) Our team! 2 Avi Feller (Berkeley) Jane Furey (Abt Associates)
A Consistent Variance Estimator for 2SLS When Instruments Identify Different LATEs
 A Consistent Variance Estimator for 2SLS When Instruments Identify Different LATEs Seojeong (Jay) Lee September 28, 2015 Abstract Under treatment effect heterogeneity, an instrument identifies the instrumentspecific
Identification and Extrapolation with Instrumental Variables
 Identification and Extrapolation with Instrumental Variables Magne Mogstad Alexander Torgovitsky September 19, 217 Abstract Instrumental variables (IV) are widely used in economics to address selection
The Economics of European Regions: Theory, Empirics, and Policy
 The Economics of European Regions: Theory, Empirics, and Policy Dipartimento di Economia e Management Davide Fiaschi Angela Parenti 1 1 davide.fiaschi@unipi.it, and aparenti@ec.unipi.it. Fiaschi-Parenti
Causal Directed Acyclic Graphs
 Causal Directed Acyclic Graphs Kosuke Imai Harvard University STAT186/GOV2002 CAUSAL INFERENCE Fall 2018 Kosuke Imai (Harvard) Causal DAGs Stat186/Gov2002 Fall 2018 1 / 15 Elements of DAGs (Pearl. 2000.
University of Toronto Department of Economics. Testing Local Average Treatment Effect Assumptions
 University of Toronto Department of Economics Working Paper 514 Testing Local Average Treatment Effect Assumptions By Ismael Mourifie and Yuanyuan Wan July 7, 214 TESTING LATE ASSUMPTIONS ISMAEL MOURIFIÉ