Regression Discontinuity
|
|
|
- Annabella Ferguson
- 6 years ago
- Views:
Transcription
1 Regression Discontinuity Christopher Taber Department of Economics University of Wisconsin-Madison October 24, 2017
2 I will describe the basic ideas of RD, but ignore many of the details Good references (and things I used in preparing this are): Identification and Estimation of Treatment Effects with a Regression-Discontinuity Design, Hahn, Todd, and Van der Klaauw, EMA (2001) Manipulation of the Running Variable in the Regression Discontinuity Design: A Density Test, McCrary, Journal of Econometrics (2008) Regression Discontinuity Designs: A Guide to Practice, Imbens and Lemieux, Journal of Econometrics (2008) Regression Discontinuity Designs in Economics, Lee and Lemiux, JEL (2010) You can also find various Handbook chapters or Mostly Harmless Econometrics which might help as well
3 The idea of regression discontinuity goes way back, but it has gained in popularity in recent years The basic idea is to recognize that in many circumstances policy rules vary at some cutoff point To think of the simplest case suppose the treatment assignment rule is: T i = { 0 X i < x 1 X i x
4 Many different rules work like this. Examples: Whether you pass a test Whether you are eligible for a program Who wins an election Which school district you reside in Whether some punishment strategy is enacted Birth date for entering kindergarten This last one should look pretty familiar-angrist and Krueger s quarter of birth was essentially a regression discontinuity design
5 The key insight is that right around the cutoff we can think of people slightly above as identical to people slightly below Formally we can write it the model as: If Y i = αt i + ε i E(ε i X i = x) is continuous then the model is identified (actually all you really need is that it is continuous at x = x ) To see it is identified not that Thus Thats it lim x x E(Y i X i = x) = E(ε i X i = x ) lim x x E(Y i X i = x) = α + E(ε i X i = x ) α = lim x x E(Y i X i = x) lim x x E(Y i X i = x)
6 What I have described thus far is referred to as a Sharp Regression Discontinuity There is also something called a Fuzzy Regression Discontinuity This occurs when rules are not strictly enforced Examples Birth date to start school Eligibility for a program has other criterion Whether punishment kicks in (might be an appeal process)
7 This isn t a problem as long as lim x x E(T i X i = x) > lim x x E(T i X i = x) To see identification we now have lim x x E(Y i X i = x) lim x x E(Y i X i = x) lim x x E(T i X i = x) lim x x E(T i X i = x) = α [lim x x E(T i X i = x) lim x x E(T i X i = x)] lim x x E(T i X i = x) lim x x E(T i X i = x) = α Note that this is essentially just Instrumental variables (this is often referred to as the Wald Estimator) You can also see that this works when T i is continuous
8 How do we do this in practice? There are really two approaches. The first comes from the basic idea of identification, we want to look directly to the right and directly to the left of the policy change Lets focus on the Sharp case-we can get the fuzzy case by just applying to Y i and T i and then taking the ratio The data should look something like this (in stata)
9 We can think about estimating the end of the red line and the end of the green line and taking the difference This is basically just a version of nonparametric regression at these two points
10 Our favorite way to estimate nonparametric regression in economics is by Kernel regression Let K (x) be a kernel that is positive and non increasing in x and is zero when x is large Examples: Normal pdf: exp( x 2 ) Normal Absolute value: Absolute { 1 x x < 1 Uniform: 1( x < 1) Uniform 0 x 1 Epanechnikov kernel: Epanechnikov { 3 4 ( 1 u 2 ) x < 1 0 x 1
11 The kernel regressor is defined as N i=1 E (Y X = x) K( X i x h )Y i N i=1 K( X i x h ) where h is the bandwidth parameter Note that this is just a weighted average it puts higher weight on observations closer to x when h is really big we put equal weight on all observations when h is really small, only the observations that are very close to x influence it
12 This is easiest to think about with the uniform kernel In this case ( ) Xi x K = 1( X i x < h) h So we use take a simple sample mean of observations within h units of X i Clearly in this case as with other kernels, as the sample size goes up, h goes down so that asymptotically we are only putting weight on observations very close to x
13 To estimate lim x x E(T i X i = x) we only want to use values of X i to the right of x, so we would use N i=1 lim x x E(T i X i = x) 1 (X i > x ) K( X i x h )Y i N i=1 1 (X i > x ) K( X i x h ) However it turns out that this has really bad properties because we are looking at the end point
14 For example suppose the data looked like this
15 For any finite bandwidth the estimator would be biased downward
16 It is better to use local linear (or polynomial) regression. Here we choose ( ) N ( Xi x â, ˆb ) = argmin a,b K [Y i a b(x i x )] 2 1 (X i x ) h i=1 Then the estimate of the right hand side is â. We do the analogous thing on the other side: ( ) N ( Xi x â, ˆb ) = argmin a,b K [Y i a b(x i x )] 2 1 (X i < x ) h i=1 (which with a uniform kernel just means running a regression using the observations between x h and x Lets try this in stata
17 There is another approach to estimating the model Define then where g is a smooth function g(x) = E(ε i X i = x) E(Y i X i, T i ) = αt i + g(x i ) Thus we can estimate the model by writing down a smooth flexible functional form for g and just estimate this by OLS The most obvious functional form that people use is a polynomial
18 There are really two different ways to do it: or Y i = αt i + b 0 + b 1 X i + b 2 X 2 i + v i Y i =αt i + b 0 + b 1 X i 1 (X i < x) + b 2 X 2 i 1 (X i < x) + b 3 X i 1 (X i x) + b 4 X 2 i 1 (X i x) + v i Lee and Lemieux say the second is better
19 Note that this is just as nonparametric as the Kernel approach You must promise to increase the degree of the polynomial as you increase the sample size (in the same way that you lower the bandwidth with the sample size) You still have a practical problem of how to choose the degree of the polynomial (in the same way you have a choice about how to choose the bandwidth in the kernel approaches) You can do both and use a local polynomial-in one case you promise to lower the bandwidth, in the other you promise to add more terms, you could do both Also, for the fuzzy design we can just do IV
20 Problems While RD is often really nice, there are three major problems that arise The first is kind of obvious from what we are doing-and is an estimation problem rather than an identification problem Often the sample size is not very big and as a practical matter the bandwidth is so large (or the degree of the polynomial so small) that it isn t really regression discontinuity that is identifying things
21 The second problem is that there may be other rules changes happening at the same cutoff so you aren t sure what exactly you are identifying One suggestion to test for this is to look at observable characteristics
22 The third is if the running variable is endogenous Clearly if people choose X i precisely the whole thing doesn t work For example suppose carrying 1 pound of drugs was a felony, but less than 1 was a misdemeanor people who get their paper in by 5:00 on thursday afternoon are on time, 5:01 is late and marked down by a grade Note that you need X i to be precisely manipulated, if there is still some randomness on the actual value of X i, rd looks fine
23 Mccrary (2008) suggests to test for this by looking at the density around the cutoff point: Under the null the density should be continuous at the cutoff point Under the alternative, the density would increase at the kink point when T i is viewed as a good thing
24 Lets look at some examples
25 Randomized Experiments from Non-random Selection in U.S. House Elections Lee, Journal of Econometrics, 2008 One of the main points of this paper is that the running variable can be endogenous as long as it can not be perfectly chosen. In particular it could be that: X i = W i + ξ i where W i is chosen by someone, but ξ i is random and unknown when W i is chosen Lee shows that regression discontinuity approaches still work in this case
26 Incumbency We can see that incumbents in congress are re-elected at very high rates Is this because there is an effect of incumbency or just because of serial correlation in preferences? Regression discontinuity helps solves this problem-look at people who just barely won (or lost).
27 Proportion Winning Election Incumbent Party Winning Candidate Runner-up Candidate Year
28 1.00 Probability of Winning, Election t Local Average Logit fit Democratic Vote Share Margin of Victory, Election t
29 1.00 Probability of Candidacy, Election t Local Average Logit fit Democratic Vote Share Margin of Victory, Election t
30 Vote Share, Election t Local Average Polynomial fit Democratic Vote Share Margin of Victory, Election t
31 690 D.S. Lee / Journal of Econometrics 142 (2008) Note: Details of data processing in Appendix A. Estimated standard errors in parentheses. Standard deviations of variables in brackets. Data include Democratic candidates (in election t). Democrat vote share and win probability is for the party, regardless of candidate. Table 1 Electoral outcomes and pre-determined election characteristics: democratic candidates, winners vs. losers: Variable All jmarginjo:5 jmarginjo:05 Parametric fit Winner Loser Winner Loser Winner Loser Winner Loser Democrat vote share election t þ (0.003) (0.003) (0.003) (0.003) (0.006) (0.006) (0.008) (0.008) [0.179] [0.15] [0.145] [0.124] [0.116] [0.107] Democrat win prob. election t þ (0.004) (0.005) (0.006) (0.006) (0.026) (0.023) (0.039) (0.035) [0.276] [0.285] [0.315] [0.294] [0.458] [0.396] Democrat vote share election t (0.003) (0.003) (0.003) (0.003) (0.007) (0.008) (0.009) (0.01) [0.189] [0.153] [0.152] [0.129] [0.129] [0.133] Democrat win prob. election t (0.005) (0.006) (0.007) (0.007) (0.027) (0.028) (0.038) (0.039) [0.31] [0.306] [0.36] [0.317] [0.493] [0.475] Democrat political experience (0.061) (0.025) (0.074) (0.029) (0.165) (0.124) (0.229) (0.145) [3.766] [1.293] [3.746] [1.39] [2.969] [2.111] Opposition political experience (0.018) (0.054) (0.025) (0.057) (0.118) (0.115) (0.131) (0.17) [1.084] [2.802] [1.262] [2.775] [2.122] [1.949] Democrat electoral experience (0.061) (0.028) (0.075) (0.032) (0.166) (0.131) (0.23) (0.151) [3.787] [1.457] [3.773] [1.55] [2.986] [2.224] Opposition electoral experience (0.019) (0.054) (0.027) (0.058) (0.12) (0.119) (0.132) (0.174) [1.189] [2.838] [1.357] [2.805] [2.157] [2.022] Observations
32 ARTICLE IN PRESS D.S. Lee / Journal of Econometrics 142 (2008) Table 2 Effect of winning an election on subsequent party electoral success: alternative specifications, and refutability test, regression discontinuity estimates Dependent variable (1) (2) (3) (4) (5) (6) (7) (8) Vote share Vote share Vote share Vote share Vote share Res. vote share 1st dif. vote share, Vote share t þ 1 t þ 1 t þ 1 t þ 1 t þ 1 t þ 1 t þ 1 t 1 Victory, election t (0.011) (0.011) (0.011) (0.011) (0.011) (0.014) (0.013) (0.011) Dem. vote share, t 1 (0.017) (0.017) Dem. win, t (0.007) (0.007) (0.009) (0.009) Dem. political experience (0.001) (0.003) (0.003) (0.002) Opp. political experience (0.001) (0.004) (0.004) (0.003) Dem. electoral experience (0.001) (0.003) (0.003) (0.002) Opp. electoral experience (0.001) (0.004) (0.004) (0.003) Note: Details of data processing in Appendix A. N ¼ 6558 in all regressions. Regressions include a fourth order polynomial in the margin of victory for the Democrats in election t, with all terms interacted with the Victory, election t dummy variable. Political and electoral experience is defined in notes to Table 2. Column (6) uses as its dependent variable the residuals from a least squares regression on the Democrat vote share ðt þ 1Þ on all the covariates. Column (7) uses as its dependent variable the Democrat vote share ðt þ 1Þ minus the
33 Maimonides Rule Angrist and Lavy look at the effects of school class size on kid s outcomes Maimonides was a twelfth century Rabbinic scholar He interpreted the Talmud in the following way: Twenty-five children may be put it charge of one teacher. If the number in the class exceeds twenty-five but is not more than forty, he should have an assistant to help with the instruction. If there are more than forty, two teachers must be appointed. This rule has had a major impact on education in Israel They try to follow this rule so that no class has more than 40 kids
34 But this means that If you have 80 kids in a grade, you have two classes with 40 each if you have 81 kids in a grade, you have three classes with 27 each
35 That sounds like a regression discontinuity We can write the rule as f sc = e s [ int ( es 1 40 ) + 1 ] Ideally we could condition on grades with either 80 or 81 kids More generally there are two ways to do this condition on people close to the cutoff and use f sc as an instrument Control for class size in a smooth way and use f sc as an instrument
36
37
38
39
40
41 To estimate the model they use an econometric framework Y ics = β 0 + β 1 C cs + β 2 X ics + α s + ε ics Now we can t just put in a school effect because we will loose too much variation so think of α s as part of the error term Their data is a bit different because it is by class rather than by individual-but for this that isn t a big deal Angrist and Lavy first estimate this model by OLS to show what we would get
42
43 Next, they want to worry about the fact that C cs is correlated with α s + ε ics They run instrumental variables using f sc as an instrument.
44
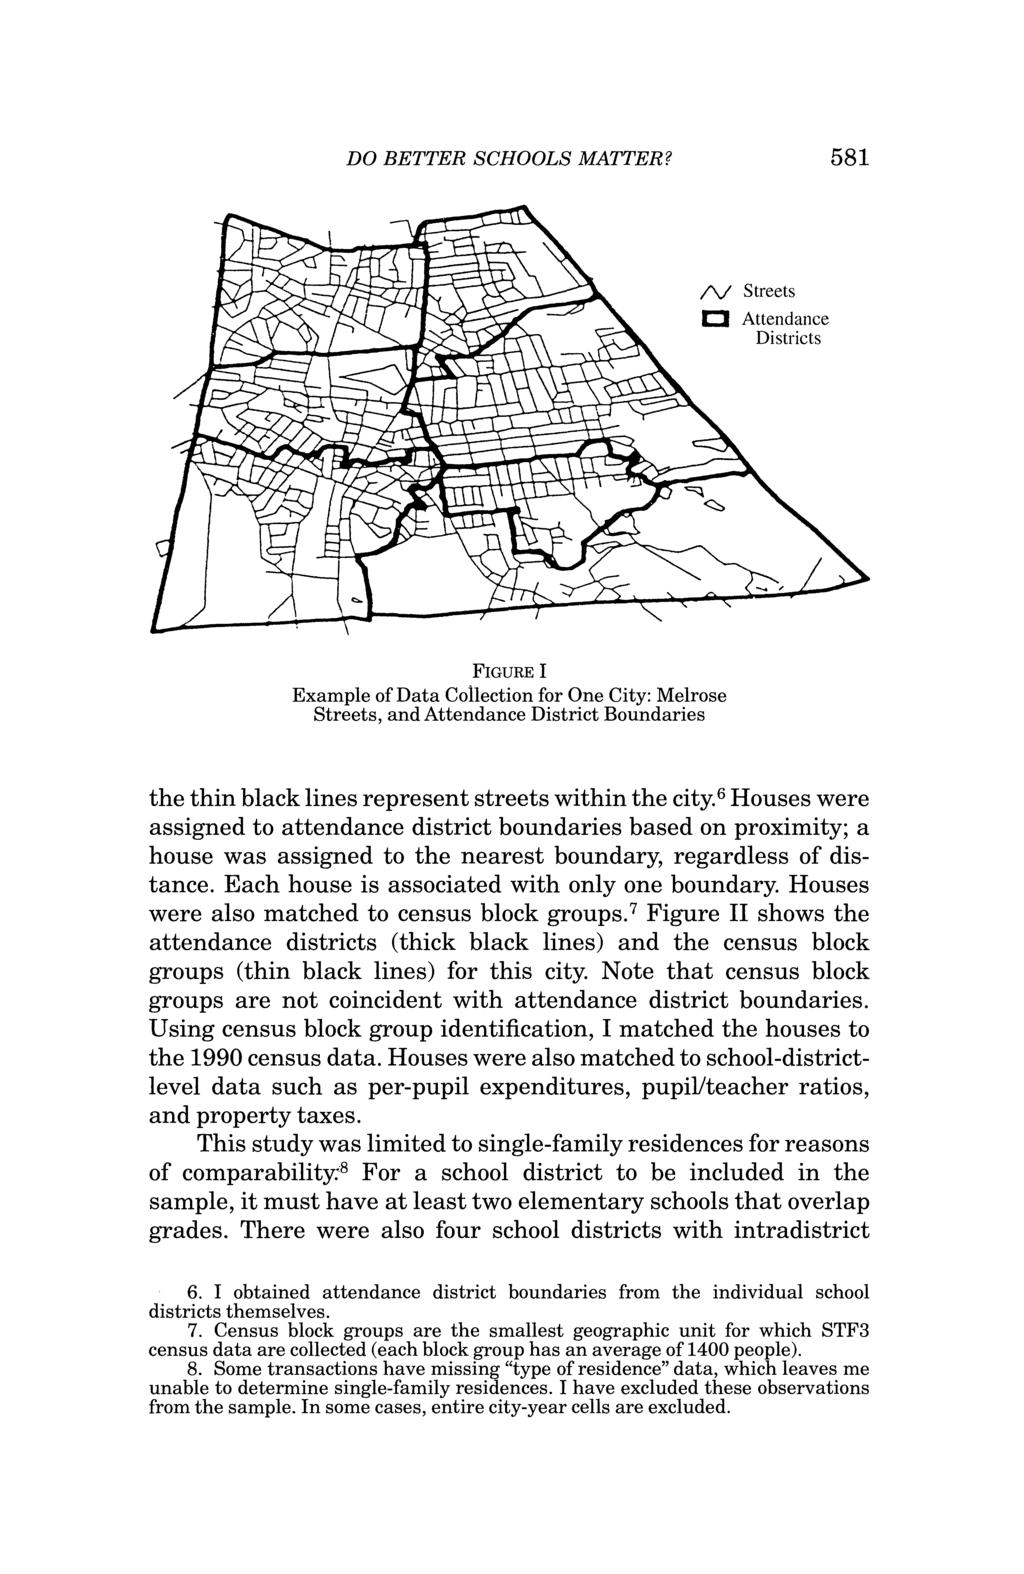
45 Do Better Schools Matter? Parental Valuation of Elementary Education Sandra Black, QJE, 1999 In the Tiebout model parents can buy better schools for their children by living in a neighborhood with better public schools How do we measure the willingness to pay? Just looking in a cross section is difficult: Richer parents probably live in nicer areas that are better for many reasons
46 Black uses the school border as a regression discontinuity We could take two families who live on opposite side of the same street, but are zoned to go to different schools The difference in their house price gives the willingness to pay for school quality.
47
48
49
50
51 Back
52 Back
53 Back
54 Back
Regression Discontinuity
 Regression Discontinuity Christopher Taber Department of Economics University of Wisconsin-Madison October 16, 2018 I will describe the basic ideas of RD, but ignore many of the details Good references
Regression Discontinuity
 Regression Discontinuity Christopher Taber Department of Economics University of Wisconsin-Madison October 9, 2016 I will describe the basic ideas of RD, but ignore many of the details Good references
Education Production Functions. April 7, 2009
 Education Production Functions April 7, 2009 Outline I Production Functions for Education Hanushek Paper Card and Krueger Tennesee Star Experiment Maimonides Rule What do I mean by Production Function?
Michael Lechner Causal Analysis RDD 2014 page 1. Lecture 7. The Regression Discontinuity Design. RDD fuzzy and sharp
 page 1 Lecture 7 The Regression Discontinuity Design fuzzy and sharp page 2 Regression Discontinuity Design () Introduction (1) The design is a quasi-experimental design with the defining characteristic
An Alternative Assumption to Identify LATE in Regression Discontinuity Design
 An Alternative Assumption to Identify LATE in Regression Discontinuity Design Yingying Dong University of California Irvine May 2014 Abstract One key assumption Imbens and Angrist (1994) use to identify
An Alternative Assumption to Identify LATE in Regression Discontinuity Designs
 An Alternative Assumption to Identify LATE in Regression Discontinuity Designs Yingying Dong University of California Irvine September 2014 Abstract One key assumption Imbens and Angrist (1994) use to
Regression Discontinuity Designs
 Regression Discontinuity Designs Kosuke Imai Harvard University STAT186/GOV2002 CAUSAL INFERENCE Fall 2018 Kosuke Imai (Harvard) Regression Discontinuity Design Stat186/Gov2002 Fall 2018 1 / 1 Observational
Econometrics of causal inference. Throughout, we consider the simplest case of a linear outcome equation, and homogeneous
 Econometrics of causal inference Throughout, we consider the simplest case of a linear outcome equation, and homogeneous effects: y = βx + ɛ (1) where y is some outcome, x is an explanatory variable, and
Supplemental Appendix to "Alternative Assumptions to Identify LATE in Fuzzy Regression Discontinuity Designs"
 Supplemental Appendix to "Alternative Assumptions to Identify LATE in Fuzzy Regression Discontinuity Designs" Yingying Dong University of California Irvine February 2018 Abstract This document provides
Applied Microeconometrics Chapter 8 Regression Discontinuity (RD)
") 1 / 26 Applied Microeconometrics Chapter 8 Regression Discontinuity (RD) Romuald Méango and Michele Battisti LMU, SoSe 2016 Overview What is it about? What are its assumptions? What are the main applications?
1 / 26 Applied Microeconometrics Chapter 8 Regression Discontinuity (RD) Romuald Méango and Michele Battisti LMU, SoSe 2016 Overview What is it about? What are its assumptions? What are the main applications?
Empirical Methods in Applied Economics Lecture Notes
 Empirical Methods in Applied Economics Lecture Notes Jörn-Ste en Pischke LSE October 2005 1 Regression Discontinuity Design 1.1 Basics and the Sharp Design The basic idea of the regression discontinuity
Regression Discontinuity Designs.
 Regression Discontinuity Designs. Department of Economics and Management Irene Brunetti ireneb@ec.unipi.it 31/10/2017 I. Brunetti Labour Economics in an European Perspective 31/10/2017 1 / 36 Introduction
ted: a Stata Command for Testing Stability of Regression Discontinuity Models
 ted: a Stata Command for Testing Stability of Regression Discontinuity Models Giovanni Cerulli IRCrES, Research Institute on Sustainable Economic Growth National Research Council of Italy 2016 Stata Conference
The Generalized Roy Model and Treatment Effects
 The Generalized Roy Model and Treatment Effects Christopher Taber University of Wisconsin November 10, 2016 Introduction From Imbens and Angrist we showed that if one runs IV, we get estimates of the Local
Regression Discontinuity: Advanced Topics. NYU Wagner Rajeev Dehejia
 Regression Discontinuity: Advanced Topics NYU Wagner Rajeev Dehejia Summary of RD assumptions The treatment is determined at least in part by the assignment variable There is a discontinuity in the level
ESTIMATING AVERAGE TREATMENT EFFECTS: REGRESSION DISCONTINUITY DESIGNS Jeff Wooldridge Michigan State University BGSE/IZA Course in Microeconometrics
 ESTIMATING AVERAGE TREATMENT EFFECTS: REGRESSION DISCONTINUITY DESIGNS Jeff Wooldridge Michigan State University BGSE/IZA Course in Microeconometrics July 2009 1. Introduction 2. The Sharp RD Design 3.
Regression Discontinuity
 Regression Discontinuity STP Advanced Econometrics Lecture Douglas G. Steigerwald UC Santa Barbara March 2006 D. Steigerwald (Institute) Regression Discontinuity 03/06 1 / 11 Intuition Reference: Mostly
Lecture 1: Introduction to Regression Discontinuity Designs in Economics
 Lecture 1: Introduction to Regression Discontinuity Designs in Economics Thomas Lemieux, UBC Spring Course in Labor Econometrics University of Coimbra, March 18 2011 Plan of the three lectures on regression
Identifying the Effect of Changing the Policy Threshold in Regression Discontinuity Models
 Identifying the Effect of Changing the Policy Threshold in Regression Discontinuity Models Yingying Dong and Arthur Lewbel University of California Irvine and Boston College First version July 2010, revised
Regression Discontinuity Design Econometric Issues
 Regression Discontinuity Design Econometric Issues Brian P. McCall University of Michigan Texas Schools Project, University of Texas, Dallas November 20, 2009 1 Regression Discontinuity Design Introduction
Instrumental Variables
 Instrumental Variables Department of Economics University of Wisconsin-Madison September 27, 2016 Treatment Effects Throughout the course we will focus on the Treatment Effect Model For now take that to
Section 7: Local linear regression (loess) and regression discontinuity designs
 and regression discontinuity designs") Section 7: Local linear regression (loess) and regression discontinuity designs Yotam Shem-Tov Fall 2015 Yotam Shem-Tov STAT 239/ PS 236A October 26, 2015 1 / 57 Motivation We will focus on local linear
Section 7: Local linear regression (loess) and regression discontinuity designs Yotam Shem-Tov Fall 2015 Yotam Shem-Tov STAT 239/ PS 236A October 26, 2015 1 / 57 Motivation We will focus on local linear
Lecture 10 Regression Discontinuity (and Kink) Design
 Design") Lecture 10 Regression Discontinuity (and Kink) Design Economics 2123 George Washington University Instructor: Prof. Ben Williams Introduction Estimation in RDD Identification RDD implementation RDD example
Lecture 10 Regression Discontinuity (and Kink) Design Economics 2123 George Washington University Instructor: Prof. Ben Williams Introduction Estimation in RDD Identification RDD implementation RDD example
Causal Inference with Big Data Sets
 Causal Inference with Big Data Sets Marcelo Coca Perraillon University of Colorado AMC November 2016 1 / 1 Outlone Outline Big data Causal inference in economics and statistics Regression discontinuity
Recitation Notes 6. Konrad Menzel. October 22, 2006
 Recitation Notes 6 Konrad Menzel October, 006 Random Coefficient Models. Motivation In the empirical literature on education and earnings, the main object of interest is the human capital earnings function
Regression Discontinuity Designs in Economics
 Regression Discontinuity Designs in Economics Dr. Kamiljon T. Akramov IFPRI, Washington, DC, USA Training Course on Applied Econometric Analysis September 13-23, 2016, WIUT, Tashkent, Uzbekistan Outline
Addressing Analysis Issues REGRESSION-DISCONTINUITY (RD) DESIGN
 DESIGN") Addressing Analysis Issues REGRESSION-DISCONTINUITY (RD) DESIGN Overview Assumptions of RD Causal estimand of interest Discuss common analysis issues In the afternoon, you will have the opportunity to
Addressing Analysis Issues REGRESSION-DISCONTINUITY (RD) DESIGN Overview Assumptions of RD Causal estimand of interest Discuss common analysis issues In the afternoon, you will have the opportunity to
Optimal Bandwidth Choice for the Regression Discontinuity Estimator
 Optimal Bandwidth Choice for the Regression Discontinuity Estimator Guido Imbens and Karthik Kalyanaraman First Draft: June 8 This Draft: September Abstract We investigate the choice of the bandwidth for
The Economics of European Regions: Theory, Empirics, and Policy
 The Economics of European Regions: Theory, Empirics, and Policy Dipartimento di Economia e Management Davide Fiaschi Angela Parenti 1 1 davide.fiaschi@unipi.it, and aparenti@ec.unipi.it. Fiaschi-Parenti
ECO Class 6 Nonparametric Econometrics
 ECO 523 - Class 6 Nonparametric Econometrics Carolina Caetano Contents 1 Nonparametric instrumental variable regression 1 2 Nonparametric Estimation of Average Treatment Effects 3 2.1 Asymptotic results................................
Simple Regression Model. January 24, 2011
 Simple Regression Model January 24, 2011 Outline Descriptive Analysis Causal Estimation Forecasting Regression Model We are actually going to derive the linear regression model in 3 very different ways
Regression Discontinuity Design on Model Schools Value-Added Effects: Empirical Evidence from Rural Beijing
 Regression Discontinuity Design on Model Schools Value-Added Effects: Empirical Evidence from Rural Beijing Kai Hong CentER Graduate School, Tilburg University April 2010 Abstract In this study we examine
Regression Discontinuity Design
 Regression Discontinuity Design Marcelo Coca Perraillon University of Chicago May 13 & 18, 2015 1 / 51 Introduction Plan Overview of RDD Meaning and validity of RDD Several examples from the literature
October 11, Keywords: Regression Discontinuity Design, Permutation Test, Induced Order Statistics, R.
 RATest: An R package for Randomization Tests with an application to testing the continuity of the baseline covariates in RDD using Approximate Permutation Tests Mauricio Olivares-González Department of
The regression discontinuity (RD) design has become
 design has become") Interpreting Regression Discontinuity Designs with Multiple Cutoffs Matias D. Cattaneo, University of Michigan Luke Keele, Penn State University Rocío Titiunik, University of Michigan Gonzalo Vazquez-Bare,
Interpreting Regression Discontinuity Designs with Multiple Cutoffs Matias D. Cattaneo, University of Michigan Luke Keele, Penn State University Rocío Titiunik, University of Michigan Gonzalo Vazquez-Bare,
Regression Discontinuity Design
 Chapter 11 Regression Discontinuity Design 11.1 Introduction The idea in Regression Discontinuity Design (RDD) is to estimate a treatment effect where the treatment is determined by whether as observed
Imbens, Lecture Notes 4, Regression Discontinuity, IEN, Miami, Oct Regression Discontinuity Designs
 Imbens, Lecture Notes 4, Regression Discontinuity, IEN, Miami, Oct 10 1 Lectures on Evaluation Methods Guido Imbens Impact Evaluation Network October 2010, Miami Regression Discontinuity Designs 1. Introduction
Next, we discuss econometric methods that can be used to estimate panel data models.
 1 Motivation Next, we discuss econometric methods that can be used to estimate panel data models. Panel data is a repeated observation of the same cross section Panel data is highly desirable when it is
Prediction and causal inference, in a nutshell
 Prediction and causal inference, in a nutshell 1 Prediction (Source: Amemiya, ch. 4) Best Linear Predictor: a motivation for linear univariate regression Consider two random variables X and Y. What is
Inference in Regression Model
 Inference in Regression Model Christopher Taber Department of Economics University of Wisconsin-Madison March 25, 2009 Outline 1 Final Step of Classical Linear Regression Model 2 Confidence Intervals 3
Returns to Tenure. Christopher Taber. March 31, Department of Economics University of Wisconsin-Madison
 Returns to Tenure Christopher Taber Department of Economics University of Wisconsin-Madison March 31, 2008 Outline 1 Basic Framework 2 Abraham and Farber 3 Altonji and Shakotko 4 Topel Basic Framework
Optimal bandwidth selection for the fuzzy regression discontinuity estimator
 Optimal bandwidth selection for the fuzzy regression discontinuity estimator Yoichi Arai Hidehiko Ichimura The Institute for Fiscal Studies Department of Economics, UCL cemmap working paper CWP49/5 Optimal
Lecture Notes Part 7: Systems of Equations
 17.874 Lecture Notes Part 7: Systems of Equations 7. Systems of Equations Many important social science problems are more structured than a single relationship or function. Markets, game theoretic models,
EMERGING MARKETS - Lecture 2: Methodology refresher
 EMERGING MARKETS - Lecture 2: Methodology refresher Maria Perrotta April 4, 2013 SITE http://www.hhs.se/site/pages/default.aspx My contact: maria.perrotta@hhs.se Aim of this class There are many different
Logistic regression: Why we often can do what we think we can do. Maarten Buis 19 th UK Stata Users Group meeting, 10 Sept. 2015
 Logistic regression: Why we often can do what we think we can do Maarten Buis 19 th UK Stata Users Group meeting, 10 Sept. 2015 1 Introduction Introduction - In 2010 Carina Mood published an overview article
Imbens/Wooldridge, Lecture Notes 3, NBER, Summer 07 1
 Imbens/Wooldridge, Lecture Notes 3, NBER, Summer 07 1 What s New in Econometrics NBER, Summer 2007 Lecture 3, Monday, July 30th, 2.00-3.00pm R e gr e ssi on D i sc ont i n ui ty D e si gns 1 1. Introduction
The Econometric Evaluation of Policy Design:: Part II: Some Approaches
 The Econometric Evaluation of Policy Design:: Part II: Some Approaches Edward Vytlacil, Yale University Renmin University June 2017 1 / 117 Lectures primarily drawing upon: Heckman and Smith (1995), Assessing
Why high-order polynomials should not be used in regression discontinuity designs
 Why high-order polynomials should not be used in regression discontinuity designs Andrew Gelman Guido Imbens 6 Jul 217 Abstract It is common in regression discontinuity analysis to control for third, fourth,
ECNS 561 Multiple Regression Analysis
 ECNS 561 Multiple Regression Analysis Model with Two Independent Variables Consider the following model Crime i = β 0 + β 1 Educ i + β 2 [what else would we like to control for?] + ε i Here, we are taking
Recitation Notes 5. Konrad Menzel. October 13, 2006
 ecitation otes 5 Konrad Menzel October 13, 2006 1 Instrumental Variables (continued) 11 Omitted Variables and the Wald Estimator Consider a Wald estimator for the Angrist (1991) approach to estimating
statistical sense, from the distributions of the xs. The model may now be generalized to the case of k regressors:
 Wooldridge, Introductory Econometrics, d ed. Chapter 3: Multiple regression analysis: Estimation In multiple regression analysis, we extend the simple (two-variable) regression model to consider the possibility
Solutions: Monday, October 22
 Amherst College Department of Economics Economics 360 Fall 2012 1. Focus on the following agricultural data: Solutions: Monday, October 22 Agricultural Production Data: Cross section agricultural data
IV Estimation and its Limitations: Weak Instruments and Weakly Endogeneous Regressors
 IV Estimation and its Limitations: Weak Instruments and Weakly Endogeneous Regressors Laura Mayoral IAE, Barcelona GSE and University of Gothenburg Gothenburg, May 2015 Roadmap Deviations from the standard
41903: Introduction to Nonparametrics
 41903: Notes 5 Introduction Nonparametrics fundamentally about fitting flexible models: want model that is flexible enough to accommodate important patterns but not so flexible it overspecializes to specific
Treatment Effects. Christopher Taber. September 6, Department of Economics University of Wisconsin-Madison
 Treatment Effects Christopher Taber Department of Economics University of Wisconsin-Madison September 6, 2017 Notation First a word on notation I like to use i subscripts on random variables to be clear
Finding Instrumental Variables: Identification Strategies. Amine Ouazad Ass. Professor of Economics
 Finding Instrumental Variables: Identification Strategies Amine Ouazad Ass. Professor of Economics Outline 1. Before/After 2. Difference-in-difference estimation 3. Regression Discontinuity Design BEFORE/AFTER
What s New in Econometrics? Lecture 14 Quantile Methods
 What s New in Econometrics? Lecture 14 Quantile Methods Jeff Wooldridge NBER Summer Institute, 2007 1. Reminders About Means, Medians, and Quantiles 2. Some Useful Asymptotic Results 3. Quantile Regression
PSC 504: Instrumental Variables
 PSC 504: Instrumental Variables Matthew Blackwell 3/28/2013 Instrumental Variables and Structural Equation Modeling Setup e basic idea behind instrumental variables is that we have a treatment with unmeasured
Regression with a Single Regressor: Hypothesis Tests and Confidence Intervals
 Regression with a Single Regressor: Hypothesis Tests and Confidence Intervals (SW Chapter 5) Outline. The standard error of ˆ. Hypothesis tests concerning β 3. Confidence intervals for β 4. Regression
Has the Family Planning Policy Improved the Quality of the Chinese New. Generation? Yingyao Hu University of Texas at Austin
 Very preliminary and incomplete Has the Family Planning Policy Improved the Quality of the Chinese New Generation? Yingyao Hu University of Texas at Austin Zhong Zhao Institute for the Study of Labor (IZA)
Sociology Exam 2 Answer Key March 30, 2012
 Sociology 63993 Exam 2 Answer Key March 30, 2012 I. True-False. (20 points) Indicate whether the following statements are true or false. If false, briefly explain why. 1. A researcher has constructed scales
Lesson 21 Not So Dramatic Quadratics
 STUDENT MANUAL ALGEBRA II / LESSON 21 Lesson 21 Not So Dramatic Quadratics Quadratic equations are probably one of the most popular types of equations that you ll see in algebra. A quadratic equation has
1 Correlation between an independent variable and the error
 Chapter 7 outline, Econometrics Instrumental variables and model estimation 1 Correlation between an independent variable and the error Recall that one of the assumptions that we make when proving the
Sociology 593 Exam 2 Answer Key March 28, 2002
 Sociology 59 Exam Answer Key March 8, 00 I. True-False. (0 points) Indicate whether the following statements are true or false. If false, briefly explain why.. A variable is called CATHOLIC. This probably
Applied Health Economics (for B.Sc.)
") Applied Health Economics (for B.Sc.) Helmut Farbmacher Department of Economics University of Mannheim Autumn Semester 2017 Outlook 1 Linear models (OLS, Omitted variables, 2SLS) 2 Limited and qualitative
Applied Health Economics (for B.Sc.) Helmut Farbmacher Department of Economics University of Mannheim Autumn Semester 2017 Outlook 1 Linear models (OLS, Omitted variables, 2SLS) 2 Limited and qualitative
LECTURE 15: SIMPLE LINEAR REGRESSION I
 David Youngberg BSAD 20 Montgomery College LECTURE 5: SIMPLE LINEAR REGRESSION I I. From Correlation to Regression a. Recall last class when we discussed two basic types of correlation (positive and negative).
Chapter 12: Model Specification and Development
 Chapter 12: Model Specification and Development Chapter 12 Outline Model Specification: Ramsey REgression Specification Error Test (RESET) o RESET Logic o Linear Demand Model o Constant Elasticity Demand
Testing continuity of a density via g-order statistics in the regression discontinuity design
 Testing continuity of a density via g-order statistics in the regression discontinuity design Federico A. Bugni Ivan A. Canay The Institute for Fiscal Studies Department of Economics, UCL cemmap working
Models of Qualitative Binary Response
 Models of Qualitative Binary Response Probit and Logit Models October 6, 2015 Dependent Variable as a Binary Outcome Suppose we observe an economic choice that is a binary signal. The focus on the course
Testing Continuity of a Density via g-order statistics in the Regression Discontinuity Design
 Testing Continuity of a Density via g-order statistics in the Regression Discontinuity Design Federico A. Bugni Department of Economics Duke University federico.bugni@duke.edu Ivan A. Canay Department
Florian Hoffmann. September - December Vancouver School of Economics University of British Columbia
 Lecture Notes on Graduate Labor Economics Section 1a: The Neoclassical Model of Labor Supply - Static Formulation Copyright: Florian Hoffmann Please do not Circulate Florian Hoffmann Vancouver School of
1 Motivation for Instrumental Variable (IV) Regression
 Regression") ECON 370: IV & 2SLS 1 Instrumental Variables Estimation and Two Stage Least Squares Econometric Methods, ECON 370 Let s get back to the thiking in terms of cross sectional (or pooled cross sectional) data
ECON 370: IV & 2SLS 1 Instrumental Variables Estimation and Two Stage Least Squares Econometric Methods, ECON 370 Let s get back to the thiking in terms of cross sectional (or pooled cross sectional) data
Exploring Marginal Treatment Effects
 Exploring Marginal Treatment Effects Flexible estimation using Stata Martin Eckhoff Andresen Statistics Norway Oslo, September 12th 2018 Martin Andresen (SSB) Exploring MTEs Oslo, 2018 1 / 25 Introduction
Advanced Quantitative Research Methodology Lecture Notes: January Ecological 28, 2012 Inference1 / 38
 Advanced Quantitative Research Methodology Lecture Notes: Ecological Inference 1 Gary King http://gking.harvard.edu January 28, 2012 1 c Copyright 2008 Gary King, All Rights Reserved. Gary King http://gking.harvard.edu
Econ 582 Nonparametric Regression
 Econ 582 Nonparametric Regression Eric Zivot May 28, 2013 Nonparametric Regression Sofarwehaveonlyconsideredlinearregressionmodels = x 0 β + [ x ]=0 [ x = x] =x 0 β = [ x = x] [ x = x] x = β The assume
CHAPTER 6: SPECIFICATION VARIABLES
 Recall, we had the following six assumptions required for the Gauss-Markov Theorem: 1. The regression model is linear, correctly specified, and has an additive error term. 2. The error term has a zero
Density estimation Nonparametric conditional mean estimation Semiparametric conditional mean estimation. Nonparametrics. Gabriel Montes-Rojas
 0 0 5 Motivation: Regression discontinuity (Angrist&Pischke) Outcome.5 1 1.5 A. Linear E[Y 0i X i] 0.2.4.6.8 1 X Outcome.5 1 1.5 B. Nonlinear E[Y 0i X i] i 0.2.4.6.8 1 X utcome.5 1 1.5 C. Nonlinearity
Testing Restrictions and Comparing Models
 Econ. 513, Time Series Econometrics Fall 00 Chris Sims Testing Restrictions and Comparing Models 1. THE PROBLEM We consider here the problem of comparing two parametric models for the data X, defined by
Econometrics II. Nonstandard Standard Error Issues: A Guide for the. Practitioner
 Econometrics II Nonstandard Standard Error Issues: A Guide for the Practitioner Måns Söderbom 10 May 2011 Department of Economics, University of Gothenburg. Email: mans.soderbom@economics.gu.se. Web: www.economics.gu.se/soderbom,
Nonlinear Regression Functions
 Nonlinear Regression Functions (SW Chapter 8) Outline 1. Nonlinear regression functions general comments 2. Nonlinear functions of one variable 3. Nonlinear functions of two variables: interactions 4.
2 Prediction and Analysis of Variance
 2 Prediction and Analysis of Variance Reading: Chapters and 2 of Kennedy A Guide to Econometrics Achen, Christopher H. Interpreting and Using Regression (London: Sage, 982). Chapter 4 of Andy Field, Discovering
Using Matching, Instrumental Variables and Control Functions to Estimate Economic Choice Models
 Using Matching, Instrumental Variables and Control Functions to Estimate Economic Choice Models James J. Heckman and Salvador Navarro The University of Chicago Review of Economics and Statistics 86(1)
In economics, the amount of a good x demanded is a function of the price of that good. In other words,
 I. UNIVARIATE CALCULUS Given two sets X and Y, a function is a rule that associates each member of X with eactly one member of Y. That is, some goes in, and some y comes out. These notations are used to
Eco517 Fall 2014 C. Sims FINAL EXAM
 Eco517 Fall 2014 C. Sims FINAL EXAM This is a three hour exam. You may refer to books, notes, or computer equipment during the exam. You may not communicate, either electronically or in any other way,
Lecture 11: Extrema. Nathan Pflueger. 2 October 2013
 Lecture 11: Extrema Nathan Pflueger 2 October 201 1 Introduction In this lecture we begin to consider the notion of extrema of functions on chosen intervals. This discussion will continue in the lectures
Rockefeller College University at Albany
 Rockefeller College University at Albany PAD 705 Handout: Simultaneous quations and Two-Stage Least Squares So far, we have studied examples where the causal relationship is quite clear: the value of the
ECONOMICS 210C / ECONOMICS 236A MONETARY HISTORY
 Fall 018 University of California, Berkeley Christina Romer David Romer ECONOMICS 10C / ECONOMICS 36A MONETARY HISTORY A Little about GLS, Heteroskedasticity-Consistent Standard Errors, Clustering, and
Control Function and Related Methods: Nonlinear Models
 Control Function and Related Methods: Nonlinear Models Jeff Wooldridge Michigan State University Programme Evaluation for Policy Analysis Institute for Fiscal Studies June 2012 1. General Approach 2. Nonlinear
Regression, part II. I. What does it all mean? A) Notice that so far all we ve done is math.
 Notice that so far all we ve done is math.") Regression, part II I. What does it all mean? A) Notice that so far all we ve done is math. 1) One can calculate the Least Squares Regression Line for anything, regardless of any assumptions. 2) But, if
Regression, part II I. What does it all mean? A) Notice that so far all we ve done is math. 1) One can calculate the Least Squares Regression Line for anything, regardless of any assumptions. 2) But, if
NOWCASTING THE OBAMA VOTE: PROXY MODELS FOR 2012
 JANUARY 4, 2012 NOWCASTING THE OBAMA VOTE: PROXY MODELS FOR 2012 Michael S. Lewis-Beck University of Iowa Charles Tien Hunter College, CUNY IF THE US PRESIDENTIAL ELECTION WERE HELD NOW, OBAMA WOULD WIN.
Experiments and Quasi-Experiments
 Experiments and Quasi-Experiments (SW Chapter 13) Outline 1. Potential Outcomes, Causal Effects, and Idealized Experiments 2. Threats to Validity of Experiments 3. Application: The Tennessee STAR Experiment
Time Series and Forecasting Lecture 4 NonLinear Time Series
 Time Series and Forecasting Lecture 4 NonLinear Time Series Bruce E. Hansen Summer School in Economics and Econometrics University of Crete July 23-27, 2012 Bruce Hansen (University of Wisconsin) Foundations
More on Roy Model of Self-Selection
 V. J. Hotz Rev. May 26, 2007 More on Roy Model of Self-Selection Results drawn on Heckman and Sedlacek JPE, 1985 and Heckman and Honoré, Econometrica, 1986. Two-sector model in which: Agents are income
Dynamic Models Part 1
 Dynamic Models Part 1 Christopher Taber University of Wisconsin December 5, 2016 Survival analysis This is especially useful for variables of interest measured in lengths of time: Length of life after
THE MULTIVARIATE LINEAR REGRESSION MODEL
 THE MULTIVARIATE LINEAR REGRESSION MODEL Why multiple regression analysis? Model with more than 1 independent variable: y 0 1x1 2x2 u It allows : -Controlling for other factors, and get a ceteris paribus
Instrumental Variables
 Instrumental Variables Yona Rubinstein July 2016 Yona Rubinstein (LSE) Instrumental Variables 07/16 1 / 31 The Limitation of Panel Data So far we learned how to account for selection on time invariant
22s:152 Applied Linear Regression. Example: Study on lead levels in children. Ch. 14 (sec. 1) and Ch. 15 (sec. 1 & 4): Logistic Regression
 and Ch. 15 (sec. 1 & 4): Logistic Regression") 22s:52 Applied Linear Regression Ch. 4 (sec. and Ch. 5 (sec. & 4: Logistic Regression Logistic Regression When the response variable is a binary variable, such as 0 or live or die fail or succeed then
22s:52 Applied Linear Regression Ch. 4 (sec. and Ch. 5 (sec. & 4: Logistic Regression Logistic Regression When the response variable is a binary variable, such as 0 or live or die fail or succeed then
Why High-Order Polynomials Should Not Be Used in Regression Discontinuity Designs
 Why High-Order Polynomials Should Not Be Used in Regression Discontinuity Designs Andrew GELMAN Department of Statistics and Department of Political Science, Columbia University, New York, NY, 10027 (gelman@stat.columbia.edu)
ECON 594: Lecture #6
 ECON 594: Lecture #6 Thomas Lemieux Vancouver School of Economics, UBC May 2018 1 Limited dependent variables: introduction Up to now, we have been implicitly assuming that the dependent variable, y, was
Regression #8: Loose Ends
 Regression #8: Loose Ends Econ 671 Purdue University Justin L. Tobias (Purdue) Regression #8 1 / 30 In this lecture we investigate a variety of topics that you are probably familiar with, but need to touch