IV Estimation and its Limitations: Weak Instruments and Weakly Endogeneous Regressors
|
|
|
- Bonnie Butler
- 5 years ago
- Views:
Transcription
1 IV Estimation and its Limitations: Weak Instruments and Weakly Endogeneous Regressors Laura Mayoral IAE, Barcelona GSE and University of Gothenburg Gothenburg, May 2015
2 Roadmap Deviations from the standard framework: Irrelevant and weak instruments Endogeneous and weakly endogeneous regressors
3 3. Violations to the relevance condition: set up Consider the following model y = Xβ + ɛ; (1) X = ZΠ + v; (2) corr(ɛ, v) = 0 (3) Remarks: X is endogenous since corr(ɛ, v) = 0 Unless otherwise stated it s assumed throughout that Z is exogenous (E(Z ɛ) = 0) Without loss of generality, we omit exogenous regressors (if they exist, they can be partialled out)
4 3.1. Irrelevant instruments Recall that if there is just one IV then ˆβ 2sls = β + cov(z i, y) cov(z i, X i ) If cov(z i, X i ) = 0 Z is irrelevant. General case (more instruments): if E(Z X) = 0 Z is irrelevant. Using the notation above: Π = 0 Z is irrelevant
5 Irrelevant instruments, II What happens when Z is irrelevant? ˆβ 2sls is not identified. ˆβ 2sls is inconsistent (we knew this already!) The distribution of ( ˆβ 2sls β) is Cauchy-like The bias of ˆβ 2sls tends to that of ˆβ ols : The distribution of ˆβ 2sls is centered around the plim( ˆβ ols ).
6 3.2. Weak instruments Recall that if there is just one IV then ˆβ 2sls = β + cov(z i, y) cov(z i, X i ) If cov(z i, X i ) > 0 but close to zero: Z is weak. Why? cov(zi, X i ) would be close to zero the bias of ˆβ 2sls will be very large! In fact, the main problem derives from the fact that the finite-sample distribution is very different from the asymptotic one (and remember that 2SLS s justification is asymptotic!).
7 Weak instruments, consequences Although strictly speaking the conditions for consistency of ˆβ 2sls are met (since E(X Z) = 0) standard asymptotics yield very poor approximation to the finite-sample distributions when instruments are weak. As a result ˆβ 2sls is weakly identified, (i.e., its distribution is not well approximated by their standard asymptotic distribution). The source of the problem is not small-sample problems in a conventional sense, but rather, limited information, (see Bound et al. 1995). To evaluate how severe is the weak instrument problem, we need to have analytical expressions that approximate better the finite sample properties of the estimators when instruments are weak.
8 Analytical approximations to the finite sample distributions of IV estimators when instruments are weak Different approaches: Approach 1: Assume errors are normal and Z is fix. Then we can derive the exact distribution Define: µ 2 = Π Z ZΠ/σ 2 v µ 2 : concentration parameter, is a measure of the strength of the instruments. (In particular: it measures the share of the variance of X explained by Z normalised by the variance of v ).
9 Nelson and Startz (1990) show that µ( ˆβ 2sls β) = Λ µ plays the role that is usually played by N (sample size). If µ p : instruments are strong, Λ is the usual normal distribution If µ is small: then Λ is not standard and estimates will be very biased.
10 How big is the bias? VERY big if µ is small. The following graph plots Λ for different values of µ In this example: estimator. β = 0, ρ =.95 is the bias of the OLS
11
12 Approach 2: Weak instrument asymptotics Approach 1 is developed under very demanding assumptions: normality, fixed Z. Staiger and Stock (1997): showed that very similar results can be obtained (i.e., same distribution of β, Λ) under general conditions (Z not fixed, errors non normal).
13 Approach 2: Weak instrument asymptotics, II Their approach: assume Π = Π N = C/ (N) such that y = Xβ 0 + ɛ; (4) X = ZΠ + v; (5) Π = Π N = C/ (N) (6) corr(ɛ, v) = 0 (7) estimate β and compute the asymptotic distribution of β under Π = Π N = C/ (N) weak instrument asymptotics.
14 Weak instrument asymptotics As mentioned before, weak instruments should not be thought of a finite sample problem! Staiger and Stock show that: for each sample size (even for a very large one) there will exist some values of correlation between the instrument and the regressor such that the quality of normal approximation is poor
15 What s the meaning Π = Π N = C/ (N)? This is a just trick to obtain analytical expressions that approximate the distribution in finite samples in a better way. That is, we don t truly believe that Π = Π N = C/ (N), but it is useful to assume this setup. Why? We saw before that for any Π arbitrarily close to zero (but > 0), standard asymptotic theory will not be informative as the limited information problem will be eventually overcome by an infinite sample size. This solution is not satisfactory as we never have such a thing! By choosing Π = Π N = C/ (N), µ 2 remains constant as the sample size increases (rather than going to as it would for a fix Π > 0) (so the weak instruments problem remains even if N )
16 Summary of weak IV asymptotic results (Staiger and Stock, 1997). ˆβ 2sls is not consistent and non-normal The analytical expressions obtained under weak IV asymptotics: provide very good approximations of the finite sample distributions when the correlation between the instruments and the endogenous regressor is small. Test statistics (including J-test of overindentifying restrictions) do not have standard distributions.
17 Summary of weak IV asymptotic results, II. Bias of ˆβ 12sls : If Z is irrelevant (E(Z X)=0) ˆβ 2sls is centered around the plim( ˆβ ols ) Note. Remember [plim ˆβ ols = β + E(X X) 1 E(X ɛ)] If Z is weak: the bias of ˆβ 2sls tends to the bias of ˆβ ols
18 4. Violations to the exclusion condition: Set up Let s now consider violations to the exclusion restriction Set up y = Xβ + ɛ; (8) X = ZΠ + v; (9) ɛ = Zγ + ɛ (10) corr(ɛ, v) = 0 (11) Unless otherwise stated, assume Z is strong i.e. Π = 0 and is large. If γ = 0 Z is endogenous, (exclusion restriction is violated)
19 Endogeneous instruments, consequences β is not consistent. The bias (1 endogenous variable, 1 instrument): Very important: ˆβ 2sls β p cov(z, ɛ) cov(z, X) = γ Π Any correlation between Z an ɛ will be magnified if the correlation between Z and X is small (i.e., if Π is small)
20 An example: Estimating the causal effect of years of education on lifetime earnings, Angrist and Krueger (1991). Education is likely to be endogenous. Why? Omitted variable: innate ability. More talented people will tend to remain in school longer. Also, more talented people will tend to earn more money. Angrist and Krueger (1991) s approach: use quarter of birth as IV.
21 Their argument: US compulsory schooling laws are in terms of age, not number of years of schooling completed. If compulsory schooling age is 16, you can drop out on your 16th birthday (even if in the middle of the school year). School entry is once a year, and cutoffs are based on birthdays. Beginning school: kids that are 6 years olds by Sep. 1st The combination of these two generates variation in schooling for those who drop out as soon as they can. Consider two students, one born on August 31st and another born on Sep. 1st: by the time they turn 16, the second has ha 1 additional year of education.
22 Instrument validity Do birthdays satisfy the exclusion restriction, or could birthdays be correlated with earnings for other reasons than their effect on schooling? Birthday affects, e.g., age rank in class?. Do birthdays indeed affect schooling? Check the first stage.
23 Angrist and Krueger data Huge dataset. Data are from the 1980 US Census. 329,509 men born 1930 to 1939 (i.e. in their 40s when observed). For these men we have year of birth, quarter of birth, years of schooling, and earnings in 1979.
24 Do birthdays satisfy the exclusion restriction?, Bound, Jaeger and Baker (1995): argue that maybe Z is not exogenous: Some evidence that quarter of birth is related to school attendance rates, performance in reading, maths, etc. Differences in physical and mental health of individuals born in different times of the year. Key point: Although the correlation between Z and ɛ is likely to be small, it gets magnified by the very small correlation between quarter of birth and education!!. As a result, the bias can be very large.
25 Bound et al: used Angrist and Krueger data but instead of using the actual quarter of birth, they randomly assigned a quarter of birth to each observation. This random quarter of birth is exogenous but also, totally uncorrelated with education. However, the results using this instrument were very similar than those obtained with the true quarter of birth! Nothing in the second stage regression could suggest that the new Z was totally irrelevant! Another important point: the weak instrument problem was important even if the sample size was huge!!
26 Many weak instruments Angrist and Krueger used as instruments the interactions between quarter of birth and year of birth and quarter of birth and state of birth. Adding many weak instruments makes the problem even worse: the F statistic of the first stage gets smaller the bias gets worse. The next three tables are from Bound et al.. The first table shows that by increasing the number of (weak) instruments, the F statistic that tests the joint significance of the instruments in the the first stage decreases.
27
28 Table 2: many weak instruments contains instruments based on quarter of birth interacted with state of birth and year of birth. Table 3: uses the randomly generated quarters of birth (i.e., all instruments are irrelevant). Compare Tables 1/2 with 3: just by looking at the second stage regression you won t be able to detect that instruments are irrelevant: both tables look similar! but the first stage shows that the regressions are problematic look at the F s! Notice that the OLS estimates and those obtained with irrelevant instruments are very similar, as the theory predicts.
29
30
31 Weakly endogeneous regressors In practice, it is very likely that Z and ɛ have some correlation. Thus, as before, it is useful to study local violations to the exclusion restriction Set up y = Xβ + ɛ; (12) X = ZΠ + v; (13) ɛ = Zγ + ɛ (14) γ = γ n = B/ (N) (15) corr(ɛ, v) = 0 (16)
32 Interpretation: We don t believe that γ is as described, this is just a trick to find analytical expressions to the finite sample distributions under mild violations of the endogeneity restriction (and it works very well!).
33 Summary of asymptotic results under endogeneity of Z 1. Recall that γ = 0 ˆβ 2sls is not consistent 2. But if γ = γ n = B/ (N), ˆβ 2sls is consistent! 3. Asymptotic distribution of ˆβ 2sls is normal with the same variance-covariance matrix but centered on a wrong value. T 1/2 ( ˆβ 2sls β 0 ) d N( B Π, σ 2 ɛ Π 2 E(Z Z) ) (17)
34 Some implications Under mild violations of the exclusion restriction: point estimates might still be ok! (IF sample size is large, estimates are strong and violation is mild!!) Inference is wrong even under mild violations: we ll tend to reject the null hypothesis of no significance too often when it is true (size is wrong). If B is small relative to Π: the bias will be small. If we knew B or (it could be consistently estimated), we could correct the distribution and use it to obtain valid inference. But B cannot be consistently estimated! An alternative approach: Conley et al. (2012)
35 Plausibly exogeneous, Conley et al. (2012) Main idea: Relax the exclusion restriction by adopting a Bayesian approach Set up y = Xβ + Zγ + ɛ; (18) X = ZΠ + v; (19) corr(ɛ, v) = 0 (20) where X can contain various endogenous regressors (s) and Z contains r instruments (r s).
36 Plausibly exogeneous, II Bayesian approach: incorporate beliefs about γ The IV exclusion restriction is equivalent to the dogmatic belief that γ = 0. New belief: γ is close to zero, but maybe not identical to zero. To implement this technique in STATA: ssc install plausexog
37 Plausibly exogeneous, III 4 inference strategies that use prior information about γ 1. The research specifies the support of γ. 2 and 3: The research specifies some prior information about the distribution of γ and 4: Full Bayesian approach, with priors over all parameters. Their strategy allows to compute confidence intervals for β conditional on any potential value of γ This allows to evaluate the robustness to deviations from the exclusion restriction.
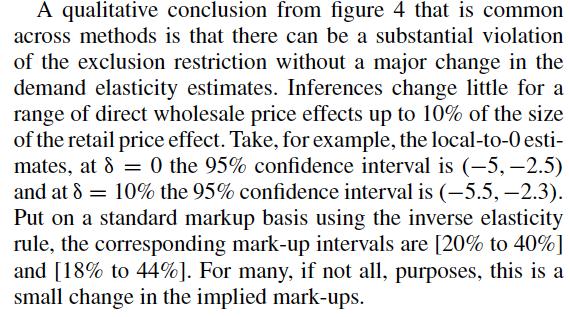
38 Example (from Conley et al.,) Price elasticity of Demand for margarine. log(share) = βlog(retailprice) + controls + v t Instrument: log wholesale prices. Why? they should primarily vary in response to cost shocks and be less sensitive to retail demand shocks than retail prices. The following picture shows that there can be substantial violations of the exclusion restriction and the estimates won t vary much. δ measures how large is the deviation from the exclusion restriction (i.e., δ = 0 exclusion restriction holds). Its precise definition varies depending on the method employed.
39
40
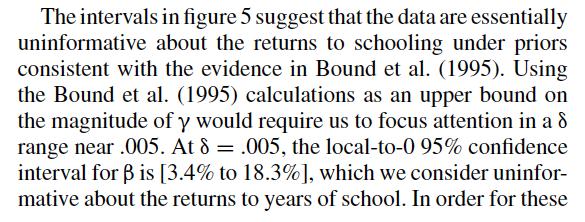
41 Example 2: Returns to schooling Data from Angrist and Krueger (1991), observations log(wage i ) = β 1 education i + controls + u i Conley use some of Bound s arguments/calculations to set up priors for the parameters.
42
43
44 Last remark: The stronger the instruments, the more robust your estimates will be to deviations from the exclusion restriction Since the strength of the instruments is something that can be evaluated (as opposed to the exogeneity ) is important to have instruments as strong as possible!
45 What you should do in practice? [Advice from Mostly Harmless...] Report the first stage and think about whether it makes sense. Are the magnitude and sign as you would expect? Report the F-statistics on the excluded instruments. The bigger it is the better. Use a proper test Pick your best single instrument and report just-identified estimates using this one only. Just-identified IV is approximately median-unbiased Check over-identified 2SLS estimates with LIML. If the LIML estimates are very different, or standard errors are much bigger, worry. See also Murray (2006) for more practical advice!
IV Estimation and its Limitations: Weak Instruments and Weakly Endogeneous Regressors
 IV Estimation and its Limitations: Weak Instruments and Weakly Endogeneous Regressors Laura Mayoral IAE, Barcelona GSE and University of Gothenburg Gothenburg, May 2015 Roadmap of the course Introduction.
IV Estimation and its Limitations: Weak Instruments and Weakly Endogeneous Regressors
 IV Estimation and its Limitations: Weak Instruments and Weakly Endogeneous Regressors Laura Mayoral, IAE, Barcelona GSE and University of Gothenburg U. of Gothenburg, May 2015 Roadmap Testing for deviations
1 Motivation for Instrumental Variable (IV) Regression
 Regression") ECON 370: IV & 2SLS 1 Instrumental Variables Estimation and Two Stage Least Squares Econometric Methods, ECON 370 Let s get back to the thiking in terms of cross sectional (or pooled cross sectional) data
ECON 370: IV & 2SLS 1 Instrumental Variables Estimation and Two Stage Least Squares Econometric Methods, ECON 370 Let s get back to the thiking in terms of cross sectional (or pooled cross sectional) data
Instrumental Variables and the Problem of Endogeneity
 Instrumental Variables and the Problem of Endogeneity September 15, 2015 1 / 38 Exogeneity: Important Assumption of OLS In a standard OLS framework, y = xβ + ɛ (1) and for unbiasedness we need E[x ɛ] =
ECO375 Tutorial 9 2SLS Applications and Endogeneity Tests
 ECO375 Tutorial 9 2SLS Applications and Endogeneity Tests Matt Tudball University of Toronto Mississauga November 23, 2017 Matt Tudball (University of Toronto) ECO375H5 November 23, 2017 1 / 33 Hausman
Econometrics. Week 8. Fall Institute of Economic Studies Faculty of Social Sciences Charles University in Prague
 Econometrics Week 8 Institute of Economic Studies Faculty of Social Sciences Charles University in Prague Fall 2012 1 / 25 Recommended Reading For the today Instrumental Variables Estimation and Two Stage
Instrumental Variables
 Instrumental Variables Kosuke Imai Harvard University STAT186/GOV2002 CAUSAL INFERENCE Fall 2018 Kosuke Imai (Harvard) Noncompliance in Experiments Stat186/Gov2002 Fall 2018 1 / 18 Instrumental Variables
Applied Econometrics (MSc.) Lecture 3 Instrumental Variables
 Lecture 3 Instrumental Variables") Applied Econometrics (MSc.) Lecture 3 Instrumental Variables Estimation - Theory Department of Economics University of Gothenburg December 4, 2014 1/28 Why IV estimation? So far, in OLS, we assumed independence.
Applied Econometrics (MSc.) Lecture 3 Instrumental Variables Estimation - Theory Department of Economics University of Gothenburg December 4, 2014 1/28 Why IV estimation? So far, in OLS, we assumed independence.
What s New in Econometrics. Lecture 13
 What s New in Econometrics Lecture 13 Weak Instruments and Many Instruments Guido Imbens NBER Summer Institute, 2007 Outline 1. Introduction 2. Motivation 3. Weak Instruments 4. Many Weak) Instruments
Econometrics of causal inference. Throughout, we consider the simplest case of a linear outcome equation, and homogeneous
 Econometrics of causal inference Throughout, we consider the simplest case of a linear outcome equation, and homogeneous effects: y = βx + ɛ (1) where y is some outcome, x is an explanatory variable, and
ECON Introductory Econometrics. Lecture 16: Instrumental variables
 ECON4150 - Introductory Econometrics Lecture 16: Instrumental variables Monique de Haan (moniqued@econ.uio.no) Stock and Watson Chapter 12 Lecture outline 2 OLS assumptions and when they are violated Instrumental
Instrumental Variables
 Instrumental Variables Department of Economics University of Wisconsin-Madison September 27, 2016 Treatment Effects Throughout the course we will focus on the Treatment Effect Model For now take that to
4.8 Instrumental Variables
 4.8. INSTRUMENTAL VARIABLES 35 4.8 Instrumental Variables A major complication that is emphasized in microeconometrics is the possibility of inconsistent parameter estimation due to endogenous regressors.
Recent Advances in the Field of Trade Theory and Policy Analysis Using Micro-Level Data
 Recent Advances in the Field of Trade Theory and Policy Analysis Using Micro-Level Data July 2012 Bangkok, Thailand Cosimo Beverelli (World Trade Organization) 1 Content a) Endogeneity b) Instrumental
Topics in Applied Econometrics and Development - Spring 2014
 Topic 2: Topics in Applied Econometrics and Development - Spring 2014 Single-Equation Linear Model The population model is linear in its parameters: y = β 0 + β 1 x 1 + β 2 x 2 +... + β K x K + u - y,
Wooldridge, Introductory Econometrics, 4th ed. Chapter 15: Instrumental variables and two stage least squares
 Wooldridge, Introductory Econometrics, 4th ed. Chapter 15: Instrumental variables and two stage least squares Many economic models involve endogeneity: that is, a theoretical relationship does not fit
An overview of applied econometrics
 An overview of applied econometrics Jo Thori Lind September 4, 2011 1 Introduction This note is intended as a brief overview of what is necessary to read and understand journal articles with empirical
8. Instrumental variables regression
 8. Instrumental variables regression Recall: In Section 5 we analyzed five sources of estimation bias arising because the regressor is correlated with the error term Violation of the first OLS assumption
Empirical Methods in Applied Economics
 Empirical Methods in Applied Economics Jörn-Ste en Pischke LSE October 2007 1 Instrumental Variables 1.1 Basics A good baseline for thinking about the estimation of causal e ects is often the randomized
Lecture 11 Weak IV. Econ 715
 Lecture 11 Weak IV Instrument exogeneity and instrument relevance are two crucial requirements in empirical analysis using GMM. It now appears that in many applications of GMM and IV regressions, instruments
Economics 241B Estimation with Instruments
 Economics 241B Estimation with Instruments Measurement Error Measurement error is de ned as the error resulting from the measurement of a variable. At some level, every variable is measured with error.
Linear IV and Simultaneous Equations
 Linear IV and Daniel Schmierer Econ 312 April 6, 2007 Setup Linear regression model Y = X β + ε (1) Endogeneity of X means that X and ε are correlated, ie. E(X ε) 0. Suppose we observe another variable
Ec1123 Section 7 Instrumental Variables
 Ec1123 Section 7 Instrumental Variables Andrea Passalacqua Harvard University andreapassalacqua@g.harvard.edu November 16th, 2017 Andrea Passalacqua (Harvard) Ec1123 Section 7 Instrumental Variables November
IV Estimation WS 2014/15 SS Alexander Spermann. IV Estimation
 SS 2010 WS 2014/15 Alexander Spermann Evaluation With Non-Experimental Approaches Selection on Unobservables Natural Experiment (exogenous variation in a variable) DiD Example: Card/Krueger (1994) Minimum
Regression with a Single Regressor: Hypothesis Tests and Confidence Intervals
 Regression with a Single Regressor: Hypothesis Tests and Confidence Intervals (SW Chapter 5) Outline. The standard error of ˆ. Hypothesis tests concerning β 3. Confidence intervals for β 4. Regression
A Course in Applied Econometrics Lecture 18: Missing Data. Jeff Wooldridge IRP Lectures, UW Madison, August Linear model with IVs: y i x i u i,
 A Course in Applied Econometrics Lecture 18: Missing Data Jeff Wooldridge IRP Lectures, UW Madison, August 2008 1. When Can Missing Data be Ignored? 2. Inverse Probability Weighting 3. Imputation 4. Heckman-Type
Instrumental Variables
 Instrumental Variables Econometrics II R. Mora Department of Economics Universidad Carlos III de Madrid Master in Industrial Organization and Markets Outline 1 2 3 OLS y = β 0 + β 1 x + u, cov(x, u) =
Applied Statistics and Econometrics
 Applied Statistics and Econometrics Lecture 6 Saul Lach September 2017 Saul Lach () Applied Statistics and Econometrics September 2017 1 / 53 Outline of Lecture 6 1 Omitted variable bias (SW 6.1) 2 Multiple
Lecture: Simultaneous Equation Model (Wooldridge s Book Chapter 16)
") Lecture: Simultaneous Equation Model (Wooldridge s Book Chapter 16) 1 2 Model Consider a system of two regressions y 1 = β 1 y 2 + u 1 (1) y 2 = β 2 y 1 + u 2 (2) This is a simultaneous equation model
Lecture: Simultaneous Equation Model (Wooldridge s Book Chapter 16) 1 2 Model Consider a system of two regressions y 1 = β 1 y 2 + u 1 (1) y 2 = β 2 y 1 + u 2 (2) This is a simultaneous equation model
Econometrics Summary Algebraic and Statistical Preliminaries
 Econometrics Summary Algebraic and Statistical Preliminaries Elasticity: The point elasticity of Y with respect to L is given by α = ( Y/ L)/(Y/L). The arc elasticity is given by ( Y/ L)/(Y/L), when L
Instrumental Variables, Simultaneous and Systems of Equations
 Chapter 6 Instrumental Variables, Simultaneous and Systems of Equations 61 Instrumental variables In the linear regression model y i = x iβ + ε i (61) we have been assuming that bf x i and ε i are uncorrelated
Internal vs. external validity. External validity. This section is based on Stock and Watson s Chapter 9.
 Section 7 Model Assessment This section is based on Stock and Watson s Chapter 9. Internal vs. external validity Internal validity refers to whether the analysis is valid for the population and sample
CHAPTER 6: SPECIFICATION VARIABLES
 Recall, we had the following six assumptions required for the Gauss-Markov Theorem: 1. The regression model is linear, correctly specified, and has an additive error term. 2. The error term has a zero
1. You have data on years of work experience, EXPER, its square, EXPER2, years of education, EDUC, and the log of hourly wages, LWAGE
 1. You have data on years of work experience, EXPER, its square, EXPER, years of education, EDUC, and the log of hourly wages, LWAGE You estimate the following regressions: (1) LWAGE =.00 + 0.05*EDUC +
Problem Set #6: OLS. Economics 835: Econometrics. Fall 2012
 Problem Set #6: OLS Economics 835: Econometrics Fall 202 A preliminary result Suppose we have a random sample of size n on the scalar random variables (x, y) with finite means, variances, and covariance.
Just How Sensitive are Instrumental Variable Estimates?
 Foundations and Trends R in Accounting Just How Sensitive are Instrumental Variable Estimates? Suggested Citation: Peter C. Reiss (2016), Just How Sensitive are Instrumental Variable Estimates?, Foundations
Econometrics Problem Set 11
 Econometrics Problem Set WISE, Xiamen University Spring 207 Conceptual Questions. (SW 2.) This question refers to the panel data regressions summarized in the following table: Dependent variable: ln(q
Instrumental Variables
 Instrumental Variables Yona Rubinstein July 2016 Yona Rubinstein (LSE) Instrumental Variables 07/16 1 / 31 The Limitation of Panel Data So far we learned how to account for selection on time invariant
Instrumental variables: Overview and advances
 Instrumental variables: Overview and advances Christopher F Baum 1 Boston College and DIW Berlin UKSUG 13, London, September 2007 1 Thanks to Austin Nichols for the use of his NASUG talks and Mark Schaffer
Instrumental Variables Estimation in Stata
 Christopher F Baum 1 Faculty Micro Resource Center Boston College March 2007 1 Thanks to Austin Nichols for the use of his material on weak instruments and Mark Schaffer for helpful comments. The standard
Handout 12. Endogeneity & Simultaneous Equation Models
 Handout 12. Endogeneity & Simultaneous Equation Models In which you learn about another potential source of endogeneity caused by the simultaneous determination of economic variables, and learn how to
Imbens/Wooldridge, Lecture Notes 13, Summer 07 1
 Imbens/Wooldridge, Lecture Notes 13, Summer 07 1 What s New in Econometrics NBER, Summer 2007 Lecture 13, Wednesday, Aug 1st, 2.00-3.00pm Weak Instruments and Many Instruments 1. Introduction In recent
ECO375 Tutorial 8 Instrumental Variables
 ECO375 Tutorial 8 Instrumental Variables Matt Tudball University of Toronto Mississauga November 16, 2017 Matt Tudball (University of Toronto) ECO375H5 November 16, 2017 1 / 22 Review: Endogeneity Instrumental
Problem Set - Instrumental Variables
 Problem Set - Instrumental Variables 1. Consider a simple model to estimate the effect of personal computer (PC) ownership on college grade point average for graduating seniors at a large public university:
Linear Models in Econometrics
 Linear Models in Econometrics Nicky Grant At the most fundamental level econometrics is the development of statistical techniques suited primarily to answering economic questions and testing economic theories.
Final Exam. Economics 835: Econometrics. Fall 2010
 Final Exam Economics 835: Econometrics Fall 2010 Please answer the question I ask - no more and no less - and remember that the correct answer is often short and simple. 1 Some short questions a) For each
Econ 1123: Section 2. Review. Binary Regressors. Bivariate. Regression. Omitted Variable Bias
 Contact Information Elena Llaudet Sections are voluntary. My office hours are Thursdays 5pm-7pm in Littauer Mezzanine 34-36 (Note room change) You can email me administrative questions to ellaudet@gmail.com.
Lecture 8: Instrumental Variables Estimation
 Lecture Notes on Advanced Econometrics Lecture 8: Instrumental Variables Estimation Endogenous Variables Consider a population model: y α y + β + β x + β x +... + β x + u i i i i k ik i Takashi Yamano
Chapter 6. Panel Data. Joan Llull. Quantitative Statistical Methods II Barcelona GSE
 Chapter 6. Panel Data Joan Llull Quantitative Statistical Methods II Barcelona GSE Introduction Chapter 6. Panel Data 2 Panel data The term panel data refers to data sets with repeated observations over
Warwick Economics Summer School Topics in Microeconometrics Instrumental Variables Estimation
 Warwick Economics Summer School Topics in Microeconometrics Instrumental Variables Estimation Michele Aquaro University of Warwick This version: July 21, 2016 1 / 31 Reading material Textbook: Introductory
Ordinary Least Squares Regression
 Ordinary Least Squares Regression Goals for this unit More on notation and terminology OLS scalar versus matrix derivation Some Preliminaries In this class we will be learning to analyze Cross Section
14.74 Lecture 10: The returns to human capital: education
 14.74 Lecture 10: The returns to human capital: education Esther Duflo March 7, 2011 Education is a form of human capital. You invest in it, and you get returns, in the form of higher earnings, etc...
EC402 - Problem Set 3
 EC402 - Problem Set 3 Konrad Burchardi 11th of February 2009 Introduction Today we will - briefly talk about the Conditional Expectation Function and - lengthily talk about Fixed Effects: How do we calculate
Eco 391, J. Sandford, spring 2013 April 5, Midterm 3 4/5/2013
 Midterm 3 4/5/2013 Instructions: You may use a calculator, and one sheet of notes. You will never be penalized for showing work, but if what is asked for can be computed directly, points awarded will depend
PSC 504: Instrumental Variables
 PSC 504: Instrumental Variables Matthew Blackwell 3/28/2013 Instrumental Variables and Structural Equation Modeling Setup e basic idea behind instrumental variables is that we have a treatment with unmeasured
Advances in microeconometrics and finance using instrumental variables
 Advances in microeconometrics and finance using instrumental variables Christopher F Baum 1 Boston College and DIW Berlin February 2011 1 Thanks to Austin Nichols for the use of his NASUG talks and Mark
A New Paradigm: A Joint Test of Structural and Correlation Parameters in Instrumental Variables Regression When Perfect Exogeneity is Violated
 A New Paradigm: A Joint Test of Structural and Correlation Parameters in Instrumental Variables Regression When Perfect Exogeneity is Violated By Mehmet Caner and Melinda Sandler Morrill September 22,
Instrumental Variables
 Università di Pavia 2010 Instrumental Variables Eduardo Rossi Exogeneity Exogeneity Assumption: the explanatory variables which form the columns of X are exogenous. It implies that any randomness in the
Multiple Regression. Midterm results: AVG = 26.5 (88%) A = 27+ B = C =
 A = 27+ B = C =") Economics 130 Lecture 6 Midterm Review Next Steps for the Class Multiple Regression Review & Issues Model Specification Issues Launching the Projects!!!!! Midterm results: AVG = 26.5 (88%) A = 27+ B =
Economics 130 Lecture 6 Midterm Review Next Steps for the Class Multiple Regression Review & Issues Model Specification Issues Launching the Projects!!!!! Midterm results: AVG = 26.5 (88%) A = 27+ B =
Chapter 6: Endogeneity and Instrumental Variables (IV) estimator
 estimator") Chapter 6: Endogeneity and Instrumental Variables (IV) estimator Advanced Econometrics - HEC Lausanne Christophe Hurlin University of Orléans December 15, 2013 Christophe Hurlin (University of Orléans)
Chapter 6: Endogeneity and Instrumental Variables (IV) estimator Advanced Econometrics - HEC Lausanne Christophe Hurlin University of Orléans December 15, 2013 Christophe Hurlin (University of Orléans)
Econometrics - 30C00200
 Econometrics - 30C00200 Lecture 11: Heteroskedasticity Antti Saastamoinen VATT Institute for Economic Research Fall 2015 30C00200 Lecture 11: Heteroskedasticity 12.10.2015 Aalto University School of Business
Notes 11: OLS Theorems ECO 231W - Undergraduate Econometrics
 Notes 11: OLS Theorems ECO 231W - Undergraduate Econometrics Prof. Carolina Caetano For a while we talked about the regression method. Then we talked about the linear model. There were many details, but
FNCE 926 Empirical Methods in CF
 FNCE 926 Empirical Methods in CF Lecture 2 Linear Regression II Professor Todd Gormley Today's Agenda n Quick review n Finish discussion of linear regression q Hypothesis testing n n Standard errors Robustness,
Econometrics II. Lecture 4: Instrumental Variables Part I
 Econometrics II Lecture 4: Instrumental Variables Part I Måns Söderbom 12 April 2011 mans.soderbom@economics.gu.se. www.economics.gu.se/soderbom. www.soderbom.net 1. Introduction Recall from lecture 3
Unless provided with information to the contrary, assume for each question below that the Classical Linear Model assumptions hold.
 Economics 345: Applied Econometrics Section A01 University of Victoria Midterm Examination #2 Version 1 SOLUTIONS Spring 2015 Instructor: Martin Farnham Unless provided with information to the contrary,
Lecture 4: Testing Stuff
 Lecture 4: esting Stuff. esting Hypotheses usually has three steps a. First specify a Null Hypothesis, usually denoted, which describes a model of H 0 interest. Usually, we express H 0 as a restricted
Inference in Regression Model
 Inference in Regression Model Christopher Taber Department of Economics University of Wisconsin-Madison March 25, 2009 Outline 1 Final Step of Classical Linear Regression Model 2 Confidence Intervals 3
On the Sensitivity of Return to Schooling Estimates to Estimation Methods, Model Specification, and Influential Outliers If Identification Is Weak
 DISCUSSION PAPER SERIES IZA DP No. 3961 On the Sensitivity of Return to Schooling Estimates to Estimation Methods, Model Specification, and Influential Outliers If Identification Is Weak David A. Jaeger
Mgmt 469. Causality and Identification
 Mgmt 469 Causality and Identification As you have learned by now, a key issue in empirical research is identifying the direction of causality in the relationship between two variables. This problem often
Simultaneous Equation Models
 Simultaneous Equation Models Suppose we are given the model y 1 Y 1 1 X 1 1 u 1 where E X 1 u 1 0 but E Y 1 u 1 0 We can often think of Y 1 (and more, say Y 1 )asbeing determined as part of a system of
Dealing With Endogeneity
 Dealing With Endogeneity Junhui Qian December 22, 2014 Outline Introduction Instrumental Variable Instrumental Variable Estimation Two-Stage Least Square Estimation Panel Data Endogeneity in Econometrics
ECNS 561 Multiple Regression Analysis
 ECNS 561 Multiple Regression Analysis Model with Two Independent Variables Consider the following model Crime i = β 0 + β 1 Educ i + β 2 [what else would we like to control for?] + ε i Here, we are taking
WISE International Masters
 WISE International Masters ECONOMETRICS Instructor: Brett Graham INSTRUCTIONS TO STUDENTS 1 The time allowed for this examination paper is 2 hours. 2 This examination paper contains 32 questions. You are
Econometrics Honor s Exam Review Session. Spring 2012 Eunice Han
 Econometrics Honor s Exam Review Session Spring 2012 Eunice Han Topics 1. OLS The Assumptions Omitted Variable Bias Conditional Mean Independence Hypothesis Testing and Confidence Intervals Homoskedasticity
Stat 135, Fall 2006 A. Adhikari HOMEWORK 10 SOLUTIONS
 Stat 135, Fall 2006 A. Adhikari HOMEWORK 10 SOLUTIONS 1a) The model is cw i = β 0 + β 1 el i + ɛ i, where cw i is the weight of the ith chick, el i the length of the egg from which it hatched, and ɛ i
Review of Econometrics
 Review of Econometrics Zheng Tian June 5th, 2017 1 The Essence of the OLS Estimation Multiple regression model involves the models as follows Y i = β 0 + β 1 X 1i + β 2 X 2i + + β k X ki + u i, i = 1,...,
Location Properties of Point Estimators in Linear Instrumental Variables and Related Models
 Location Properties of Point Estimators in Linear Instrumental Variables and Related Models Keisuke Hirano Department of Economics University of Arizona hirano@u.arizona.edu Jack R. Porter Department of
WISE International Masters
 WISE International Masters ECONOMETRICS Instructor: Brett Graham INSTRUCTIONS TO STUDENTS 1 The time allowed for this examination paper is 2 hours. 2 This examination paper contains 32 questions. You are
LECTURE 10: MORE ON RANDOM PROCESSES
 LECTURE 10: MORE ON RANDOM PROCESSES AND SERIAL CORRELATION 2 Classification of random processes (cont d) stationary vs. non-stationary processes stationary = distribution does not change over time more
Approximate Distributions of the Likelihood Ratio Statistic in a Structural Equation with Many Instruments
 CIRJE-F-466 Approximate Distributions of the Likelihood Ratio Statistic in a Structural Equation with Many Instruments Yukitoshi Matsushita CIRJE, Faculty of Economics, University of Tokyo February 2007
The Simple Linear Regression Model
 The Simple Linear Regression Model Lesson 3 Ryan Safner 1 1 Department of Economics Hood College ECON 480 - Econometrics Fall 2017 Ryan Safner (Hood College) ECON 480 - Lesson 3 Fall 2017 1 / 77 Bivariate
When Should We Use Linear Fixed Effects Regression Models for Causal Inference with Longitudinal Data?
 When Should We Use Linear Fixed Effects Regression Models for Causal Inference with Longitudinal Data? Kosuke Imai Department of Politics Center for Statistics and Machine Learning Princeton University
Statistics, inference and ordinary least squares. Frank Venmans
 Statistics, inference and ordinary least squares Frank Venmans Statistics Conditional probability Consider 2 events: A: die shows 1,3 or 5 => P(A)=3/6 B: die shows 3 or 6 =>P(B)=2/6 A B : A and B occur:
4 Instrumental Variables Single endogenous variable One continuous instrument. 2
 Econ 495 - Econometric Review 1 Contents 4 Instrumental Variables 2 4.1 Single endogenous variable One continuous instrument. 2 4.2 Single endogenous variable more than one continuous instrument..........................
Econ 1123: Section 5. Review. Internal Validity. Panel Data. Clustered SE. STATA help for Problem Set 5. Econ 1123: Section 5.
 Outline 1 Elena Llaudet 2 3 4 October 6, 2010 5 based on Common Mistakes on P. Set 4 lnftmpop = -.72-2.84 higdppc -.25 lackpf +.65 higdppc * lackpf 2 lnftmpop = β 0 + β 1 higdppc + β 2 lackpf + β 3 lackpf
Econometrics I KS. Module 2: Multivariate Linear Regression. Alexander Ahammer. This version: April 16, 2018
 Econometrics I KS Module 2: Multivariate Linear Regression Alexander Ahammer Department of Economics Johannes Kepler University of Linz This version: April 16, 2018 Alexander Ahammer (JKU) Module 2: Multivariate
Contest Quiz 3. Question Sheet. In this quiz we will review concepts of linear regression covered in lecture 2.
 Updated: November 17, 2011 Lecturer: Thilo Klein Contact: tk375@cam.ac.uk Contest Quiz 3 Question Sheet In this quiz we will review concepts of linear regression covered in lecture 2. NOTE: Please round
Applied Health Economics (for B.Sc.)
") Applied Health Economics (for B.Sc.) Helmut Farbmacher Department of Economics University of Mannheim Autumn Semester 2017 Outlook 1 Linear models (OLS, Omitted variables, 2SLS) 2 Limited and qualitative
Applied Health Economics (for B.Sc.) Helmut Farbmacher Department of Economics University of Mannheim Autumn Semester 2017 Outlook 1 Linear models (OLS, Omitted variables, 2SLS) 2 Limited and qualitative
Instrumental Variables. Ethan Kaplan
 Instrumental Variables Ethan Kaplan 1 Instrumental Variables: Intro. Bias in OLS: Consider a linear model: Y = X + Suppose that then OLS yields: cov (X; ) = ^ OLS = X 0 X 1 X 0 Y = X 0 X 1 X 0 (X + ) =)
ECON3150/4150 Spring 2016
 ECON3150/4150 Spring 2016 Lecture 6 Multiple regression model Siv-Elisabeth Skjelbred University of Oslo February 5th Last updated: February 3, 2016 1 / 49 Outline Multiple linear regression model and
EC212: Introduction to Econometrics Review Materials (Wooldridge, Appendix)
") 1 EC212: Introduction to Econometrics Review Materials (Wooldridge, Appendix) Taisuke Otsu London School of Economics Summer 2018 A.1. Summation operator (Wooldridge, App. A.1) 2 3 Summation operator For
1 EC212: Introduction to Econometrics Review Materials (Wooldridge, Appendix) Taisuke Otsu London School of Economics Summer 2018 A.1. Summation operator (Wooldridge, App. A.1) 2 3 Summation operator For
Gov 2000: 9. Regression with Two Independent Variables
 Gov 2000: 9. Regression with Two Independent Variables Matthew Blackwell Harvard University mblackwell@gov.harvard.edu Where are we? Where are we going? Last week: we learned about how to calculate a simple
Panel Data. March 2, () Applied Economoetrics: Topic 6 March 2, / 43
 Applied Economoetrics: Topic 6 March 2, / 43") Panel Data March 2, 212 () Applied Economoetrics: Topic March 2, 212 1 / 43 Overview Many economic applications involve panel data. Panel data has both cross-sectional and time series aspects. Regression
Panel Data March 2, 212 () Applied Economoetrics: Topic March 2, 212 1 / 43 Overview Many economic applications involve panel data. Panel data has both cross-sectional and time series aspects. Regression
Multiple Regression Analysis
 Multiple Regression Analysis y = 0 + 1 x 1 + x +... k x k + u 6. Heteroskedasticity What is Heteroskedasticity?! Recall the assumption of homoskedasticity implied that conditional on the explanatory variables,
Econometrics Review questions for exam
 Econometrics Review questions for exam Nathaniel Higgins nhiggins@jhu.edu, 1. Suppose you have a model: y = β 0 x 1 + u You propose the model above and then estimate the model using OLS to obtain: ŷ =
Econ 836 Final Exam. 2 w N 2 u N 2. 2 v N
 1) [4 points] Let Econ 836 Final Exam Y Xβ+ ε, X w+ u, w N w~ N(, σi ), u N u~ N(, σi ), ε N ε~ Nu ( γσ, I ), where X is a just one column. Let denote the OLS estimator, and define residuals e as e Y X.
ECON Introductory Econometrics. Lecture 17: Experiments
 ECON4150 - Introductory Econometrics Lecture 17: Experiments Monique de Haan (moniqued@econ.uio.no) Stock and Watson Chapter 13 Lecture outline 2 Why study experiments? The potential outcome framework.
Second Midterm Exam Economics 410 Thurs., April 2, 2009
 Second Midterm Exam Economics 410 Thurs., April 2, 2009 Show All Work. Only partial credit will be given for correct answers if we can not figure out how they were derived. Note that we have not put equal
Recitation Notes 6. Konrad Menzel. October 22, 2006
 Recitation Notes 6 Konrad Menzel October, 006 Random Coefficient Models. Motivation In the empirical literature on education and earnings, the main object of interest is the human capital earnings function
4 Instrumental Variables Single endogenous variable One continuous instrument. 2
 Econ 495 - Econometric Review 1 Contents 4 Instrumental Variables 2 4.1 Single endogenous variable One continuous instrument. 2 4.2 Single endogenous variable more than one continuous instrument..........................