A STUDY OF PYROLYSIS OF CHARRING MATERIALS AND ITS APPLICATION TO FIRE SAFETY AND BIOMASS UTILIZATION. Won Chan Park
|
|
|
- Meghan Scott
- 6 years ago
- Views:
Transcription
1 A STUDY OF PYROLYSIS OF CHARRING MATERIALS AND ITS APPLICATION TO FIRE SAFETY AND BIOMASS UTILIZATION by Won Chan Park A dissertation submitted in partial fulfillment of the requirements for the degree of Doctor of Philosophy (Mechanical Engineering) in The University of Michigan 008 Doctoral Committee: Professor Arvind Atreya, Chair Professor James F. Driscoll Professor Margaret S. Wooldridge Associate Professor Hong G. Im
2 Won Chan Park 008
3 To My Family ii
4 Acknowledgements I would like to express my deepest gratitude to my advisor, Dr. Arvind Atreya for his excellent guidance. This work would not have been possible without his consideration, encouragement, inspiration and insightful suggestions. I would also like to express my appreciation to my doctoral committee, Professor James F. Driscoll, Professor Hong G. Im and Professor Margaret S. Wooldridge for their thoughtful advice. I am grateful to Dr. Howard R. Baum for his helpful suggestions. I would like to thank Professor Michael M. Chen for his advice on numerical techniques. I wish to thank my colleagues, Sung-Joon Hwang, Seung Jun Shin, Paul Teini and former lab members, Dr. Tershia Pinder, Dr. Hyoseok Lee, Dr. Melissa Chernovsky and Dr. Xin He for their collaboration on my research. I also wish to thank Brad Hartwell for his help on my experimental apparatus. I am thankful to Sean Berhan for editing my writing for grammar. I owe my loving thanks to my wife Kyung Hee Lee, my daughter Seeong Park and my son Bradley Jin Park for their encouragement and understanding. My special gratitude is due to my parents and my brother and his family for their loving support. Financial support for this work was provided, in part, by National Institute of Standard and Technology and Industrial Assessment Center at the University of Michigan. iii
5 Table of Contents Dedication... ii Acknowledgements... iii List of Figures... vii List of Tables... xii List of Appendices... xiii List of Abbreviations... xiv Abstract... xvii 1. Introduction Background General features of wood pyrolysis Pyrolysis modeling Kinetics Outline of this thesis Charring solids undergoing opposed flow flame spread Determination of pyrolysis temperature Experimental and theoretical investigation of wood pyrolysis Three dimensional pyrolysis model for arbitrary geometry charring material Charring Solids Undergoing Opposed-flow Flame Spread Introduction Mathematical modeling Reaction mechanism Conservation of mass and energy iv
6 ..3 Numerical analysis Discretization of governing equations Curved interface Tracking interface Numerical analysis Temperature and pressure Product yields Pyrolysis temperature Simplified models: Char layer thickness Simplified models: Pressure Comparison with the analytical model Computational time Summary Determination of Pyrolysis Temperature for Charring Materials Introduction Energy and mass balanced pyrolysis temperature concept Pyrolysis models Finite-rate kinetics model Infinite-rate kinetics (pyrolysis-front) model Determination of the pyrolysis temperature Results and discussion Effect of boundary conditions Effect of geometry Effects of various parameters on the pyrolysis temperature Kinetic parameters Estimation of mass and energy balanced pyrolysis temperature Comparison with experiments on wood Summary Experimental and Theoretical Investigation of Wood Pyrolysis Introduction Problem description and literature review v
7 4. Experiment setup Experimental result Thermal mechanism of wood pyrolysis Model description Kinetics model Mass conservation Energy conservation Results Heat of pyrolysis and pyrolysis rate Exothermic reactions Modeling of endo-/exothermic wood pyrolysis Summary Three Dimensional Arbitrary Geometry Pyrolysis Model Conclusions and Future Work Summary Conclusions Contributions Future work Appendices References vi
8 List of Figures Figure 1.1 Pyrolysis of one dimensional wood slab, (Atreya 1983)... 3 Figure.1 Schematic of the physical problem: steady propagation of an opposedflow diffusion flame on the surface of a charring solid Figure. Kinetics models: (a) Three-way parallel finite rate reaction model, (b) Global finite rate reaction model, (c) Infinite rate reaction model Figure.3 Volume / node index stencils; (a) control volume index for finite volume method, (b) node index for finite difference method Figure.4 Neighboring nodes used for spatial derivatives of variables at node i, which is adacent to the char / virgin solid interface Figure.5 Nodes used for x-direction derivatives... 6 Figure.6 Interface tracking: new time interface nodes by circular profile... 7 Figure.7 Nodes used for 1 st derivative calculation... 9 Figure.8 Area weighted interpolation Figure.9 Boundary conditions of computational domain T T0 Figure.10 Temperature T = T T s 0 profiles; Case 1a Figure.11 Pressure P P = profiles; Case 1a P 0 Figure.1 Char density ρ ρ c c = distribution; Case 1a ρw ρa Figure.13 Profiles of the degree of pyrolysis for η = 1, η = 5%, 50%, 95% ; ρw Case 1a vii
9 Figure.14 Char yield ratio Sc S + S + S c t g at x = 0.09 m (x = 57.5) Figure.15 Comparison of products generation defined by 1 L x Lx 0 0 Ly 0 Sdy L i y ( c + t + g) S S S dydx ; i = c, t, g Figure.16 The rate of gaseous fuel coming out from the solid surface defined by Vys, ρis, ; i = t, g Lx 0 ( S ) 0 L c + St + Sg dydx L y x Figure.17 Comparison of virgin solid / char interface Figure.18 Comparison of pressure at x = 0.09 m (x = 57.5) αw Figure.19 Pressure P plotted on the parabolic coordinate ωc = ω which α c represents depth and is derived from the parabolic coordinates transformation V defined by the relation τ + iω = fs ( x+ iy) α w Figure 3.1 Schematic of a pyrolyzing charring solid for 1-D slab geometry Figure 3. Mass loss rate dy / dt, where, solid mass fraction: 1 L ( ρ ) 0 a ρc dx wl for a 1 cm thick slab exposed to Y = + 3 W / cm external ρ radiation Figure 3.3 Mass loss rate dy / external radiations. Y = ( ρ + ρ ) dt for 1 cm radius samples exposed to 3 W / L 0 a c xdx ρwl for a cylinder & 3 L ( ρ ) 3 0 a ρc x dx wl for a sphere Y = + ρ Figure 3.4 Effect of heat flux on energy and mass balanced T p Figure 3.5 Effect of thickness on energy and mass balanced T p Figure 3.6 Effect of heat of pyrolysis h0 on energy and mass balanced T p cm viii
10 Figure 3.7 Effect of thermal conductivity on energy and mass balanced pyrolysis temperature; (a) virgin material; (b) char Figure 3.8 Effect of specific heat capacity on energy and mass balanced pyrolysis temperature; (a) virgin material; (b) char Figure 3.9 Effect of density on energy and mass balanced pyrolysis temperature; (a) virgin material; (b) char Figure 3.10 Effect of the activation energy on mass-and-energy-balanced T p Figure 3.11 Effect of the pre-exponential constant on mass-and-energy-balanced T p Figure 3.1 Non-dimensional correlation of finite-rate and pyrolysis-front models for a wood slab, cylinder & sphere for estimating the mass-and-energy-balanced T p from primary variables namely: activation energy ( E ) ; pre-exponential factor( A ) ; heat of pyrolysis ( h 0 ) ; characteristic thickness( L ); virgin solid density( ρ w ) ; external heat flux( q ) ; and a random mix of these variables. Symbols represent these variables Figure 3.13 Comparison of (a) solid the solid mass fraction (Y ) and (b) its rate of change ( dy / dt ) between the models and the experimental measurements (Di Blasi et al. 001) Figure 4.1 Schematic diagram of the experimental apparatus Figure 4. Photography of the apparatus... 7 Figure 4.3 Schematic diagram of the tube furnace... 7 Figure 4.4 Wood sphere sample, (a) before pyrolysis, (b) after pyrolysis Figure 4.5 Thermocouples of wood sphere sample Figure 4.6 Argon mass flow rate; sonic orifice hole diameter: 0.5 mm Figure 4.7 Solid mass fraction measurements, temperature indicates the furnace temperature Figure 4.8 Temperature measurements at center and surface Figure 4.9 Temperature measurements at center ( r = 0), middle ( r = r / 0 ) and surface ( r = r 0 ); (a) T fn = 638K, (b) T fn = 688K, (c) T fn = 736K, (d) T fn = 783K, (e) T fn = 831K, (f) T fn = 879K ix
11 Figure 4.10 Solid mass fraction and temperatures of wood sphere pyrolysis at 688K Figure 4.11 Solid mass fraction of wood cylinders (d=0mm) and normalized temperature along the axis during isothermal pyrolysis of (a) 63K and (b) 773K. Solid line: model prediction; dashed line and solid squares: experimental. (Koufopanos et al. 1991) Figure 4.1 Solid mass fraction (a) and center temperature (b) of model-1 (solid line) with various Δh; -136, 64, 64 and 40 kj/kg and experiment (dotted line). Furnace temperature: 688K Figure 4.13 Temperature comparison between case A and case B of model-1 at center, middle and surface; furnace temperature: 831K Figure 4.14 Solid mass fraction comparison between model- and experiment (solid line: model-, dotted line: experiment) Figure 4.15 Center temperature comparison between model- and experiment (solid line: model-, dotted line: experiment) Figure 4.16 Decomposition rate of three components at the center of the wood sphere; Furnace temperature (a) 688K, (b) 83K, Model Figure 4.17 Solid mass fraction comparison between model-3 and experiment (solid line: model, dotted line: experiment) Figure 4.18 Center temperature comparison between model-3 and experiment (solid line: model, dotted line: experiment) Figure 4.19 Solid mass fraction comparison among model-a, model-b and experiment (circle: model-a, solid line: model-b, dotted line: experiment) Figure 4.0 Center temperature comparison among model-a, model-b and experiment (circle: model-a, solid line: model-b, dotted line: experiment) Figure 4.1 Final product fractions of model A and B Figure 5.1 Iso-pressure surface (P/P 0 = 1.007, P 0 = 101,300 Pa); time = 300 seconds, T fn = 688K Figure 5. Temperature contours inside the wood sphere; unit: K, time: 300 seconds, T fn = 688K Figure 5.3 Pressure contours inside the wood sphere; unit: Pa, time = 300 seconds, T fn = 688K Figure 5.4 Temperature comparison between 1-D model and 3-D model at surface, middle and center (circle: 1-D, line: 3-D), T fn = 688K x
12 Figure 5.5 Non-dimensional pressure comparison between 1-D model and 3-D model at middle and center (circle: 1-D, line: 3-D; P 0 = 101,300 Pa), T fn = 688K Figure D.1 Nodes used for temperature computation at node i, which is adacent to the char / virgin solid interface xi
13 List of Tables Table.1 Numerical analysis conditions Table. Properties and kinetic constants Table 3.1 Material properties and kinetic constants Table 3. Pyrolysis temperature; model B1: energy and mass balanced pyrolysis temperature, model B: constant pyrolysis temperature; units: K Table 3.3 Description of mixed cases; Values different from the base case are printed in bold fonts Table 4.1 Number of experiment repetitions Table 4. Model- hemicellulose pyrolysis model parameters Table 4.3 Model- cellulose pyrolysis model parameters... 8 Table 4.4 Model- lignin pyrolysis model parameters... 8 Table 4.5 Material properties and kinetics parameters Table 4.6 Model-1 kinetics parameters Table 4.7 Time to 60% mass loss (Y = 0.6) Table 4.8 Kinetics parameters of secondary tar decomposition for case B... 9 Table 4.9 Model-3 kinetic parameters and h Table 4.10 Model-A kinetic parameters and h Table 4.11 Final product fractions of model-a Table 4.1 Model-B kinetic parameters and h Table 4.13 Final product fractions of model-b xii
14 List of Appendices Appendix A Parallel / global reaction & simplified energy model Appendix B Global reaction & detailed energy model Appendix C Infinite rate reaction & detailed energy model Appendix D Infinite rate reaction & simplified energy model Appendix E Curved char / virgin solid interface xiii
15 List of Abbreviations A Pre-exponential Constant ( s 1 ) A Area ( m ) B Permeability ( m ) C, C Specific Heat Capacity ( J / kg K ) C P, C P Constant Pressure Specific Heat Capacity ( J / kg K ) d Pore Size ( m ) e Emissivity E Activation Energy ( J / mol K ) f F Fraction View Factor h Heat Transfer Coefficient ( / ) J x, J y Thermal Mass Flux Term ( kg / m s) k Reaction Rate ( s 1 ) L Length ( m) W m K, Enthalpy ( J / kg ) L ' Characteristic Thickness: Volume / Surface Area ( m ) Volatiles Mass Flux ( kg / m s ) m M Molecular Weight ( kg / mol ) n P Normal Component Pressure 101,300 Pa P 0 Ambient Pressure ( ) P t Tar Partial Pressure ( Pa ) P Gas Partial Pressure ( Pa ) g q Heat Flux ( W / m ) 3 Q Heat Generation ( W / m ) r Radius ( m ) r 0 Radius of Wood Sphere ( m ) R Universal Gas Constant ( J / mol K ) xiv
16 S Mass Generation ( kg / m 3 s ) t time ( s ) T Temperature ( K ) T 0 T fn T p T R x Reference Temperature Furnace Temperature Pyrolysis Temperature Reference Pyrolysis Temperature x Coordinate V Flow Velocity ( m/ s ) V Flame Spread Speed ( m/ s ) y Y fs Greek Letters y Coordinate Product Yield Fraction, Solid Mass Fraction α Thermal Diffusivity ( m / s ) β Skew Ratio in x - Direction γ Skew Ratio in x - Direction, Char Yield Fraction ε Porosity η Degree of Pyrolysis δ x Grid Size in x - Direction δ y Grid Size in y - Direction δ n Grid Size in Nomal Direction h Heat of Pyrolysis at Decompostion Temperature ( J / kg) h 0 Heat of Pyrolysis at Reference Temperature ( J / kg) t Time Step ( s) λ Thermal Conductivity ( W / m K ) λ Thermal Conductivity ( W / m K ) ν ξ Volatiles Fraction Factor Integral Variable µ Viscosity ( kg / m s) µ p Viscosity at p T ( kg / m s) 3 ρ Density ( kg / m ) σ Stefan Boltzmann Constant ( W / m K) τ φ Parabolic Coordinate ( K ) ( K ) ( K ) ( K ) Temporary Variable, Non-Dimensional Parameter xv
17 ω Ω Parabolic Coordinate, Mass Fraction Computational Domain Superscript m n Subscript a b c cl f fn fs g hcl if i,, k, l is l s t x y v w Iteration Step Time Step Vector Virgin Solid Curved Boundary / Interface Char Cellulose Final Char Furnace Flame Spread Gas Hemicellulose Interface Spatial Node Index Intermediate Solid lignin Surface Tar x Coordinate y Coordinate Total Volatiles Initial Virgin Solid Density 3 ( kg / m ) xvi
18 Abstract A theoretical and experimental study of pyrolysis of charring material applicable to fire safety and biomass utilization is presented in this thesis. This work is divided into three parts. In the first part, thermal decomposition and pressure generation in charring solids undergoing opposed-flow flame spread is numerically studied with a detailed physicsbased model. The result indicates that the char density and product yields are functions of depth due to an insulating char layer. The characteristics of various simplifying model assumptions such as global reaction, infinite rate kinetics and no convective gas transport were examined. In the second part, a method of determining the pyrolysis temperature by enforcing mass and energy balance is proposed and validated by comparison with the decomposition kinetics model and the experiments. This pyrolysis temperature has the form of pyrolysis rate weighted average temperature for the entire charring process. Heat flux, sample size, heat of pyrolysis and kinetic parameters are the most important for determining an appropriate pyrolysis temperature. A non-dimensional correlation to determine an appropriate was proposed. Excellent agreement between the pyrolysis front model using the correlation and experimental data of wood cylinder pyrolysis was achieved. Finally, pyrolysis of wood sphere is studied both experimentally and theoretically. Weight loss and temperatures of the sample were measured during the experiments. xvii
19 Center temperature showed two distinct thermal behaviors with endothermic and exothermic reactions. The numerical study revealed the following findings: (i) Contribution of secondary tar decomposition and lignin decomposition to the temperature peak are small. (ii) Exothermic intermediate solid decomposition is responsible for the temperature peak. (iii) The temperature plateau is caused by endothermic cellulose decomposition. Based on the experimental and numerical results, a novel wood pyrolysis model is proposed. The model consists of three endothermic parallel reactions producing tar, gas and intermediate solid, followed by exothermic intermediate solid conversion to char and exothermic tar decomposition to char and gas. A three-dimensional pyrolysis model for arbitrary geometry charring material was developed using front tracking method. The model was applied for wood sphere pyrolysis analysis and validated by comparison with the one-dimensional model. xviii
20 Chapter 1 Introduction 1.1 Background Wood and other forms of biomass have served as maor fuels for thousands of years since mankind first began to use fire for heating and cooking. Recently, interest in biomass utilization has increased owing to growing concern over the depletion of fossil fuels and global warming caused by greenhouse gas production from fossil fuel combustion. Biomass fuels, by contrast, are CO neutral as they are derived from fixing atmospheric CO by green plants photosynthesis, so their use does not add to the levels of atmospheric carbon. (E.C.) In December 007, the U.S. government passed a broad energy law to combat global warming and reduce U.S. dependence on imported oil. The law calls for production of 36 billion gallons of renewable fuel by 0. That includes corn-based ethanol, biodiesel from products such as soybeans and cellulosic fuels from switch grass, wood chips and other sources. Currently, corn based ethanol is the dominant bio-fuel produced in the U.S. However, bio-fuel production from food crops such as corn and soybeans is drawing controversy because of the impact on the price of agricultural products including grain crops and even non-food crops such as cotton as U.S. growers switch to more lucrative grain crops. (Kirchhoff 007) Also, growing crops and processing them to bio-oil consume significant amount of energy from coal and other fossil fuels, which bring into question the benefit of corn-based ethanol as bio-fuel. Bridgewater et al. pointed out that biomass is the only source of renewable liquid, gaseous and solid fuels and can be utilized in several ways; direct combustion to produce heat, gasification for fuel gas and fast pyrolysis for liquid bio-fuel or commodity chemicals. Among these biomass utilizing methods, fast pyrolysis is gaining the most 1
21 interest because its liquid products can be easily transported and stored for effective utilization. (Bridgwater et al. 1999) The abundance of biomass positions it as the most important renewable energy source in the U.S. Forestlands in the contiguous United States can produce about 368 million dry tons of sustainably removable biomass annually. The energy contained in the reported amount of biomass is equivalent to 87 billion gallons of ethanol, which is times the amount of U.S. ethanol production in 005. The total amount of biomass consists of 5 million dry tons of fuel wood harvested from forests, 145 million dry tons of residues from wood processing mills and pulp and paper mills, 47 million dry tons of urban wood residues including construction and demolition debris, 64 million dry tons of residues from logging and site clearing operations, and 60 million dry tons of biomass from fuel treatment operations to reduce fire hazards. (Perlack et al. 005) Wood is a construction material that poses considerable building fire hazard. As wood structure is widely used for building construction, understanding of charring material pyrolysis is important from the standpoint of fire protection technology. The U.S. National Fire Protection Association reported that during 006, 54,000 fires occurred in structures (mostly buildings) and 79% of them occurred in residential properties which resulted in,580 civilian fire deaths and 7 billion dollars of residential property loss. The total property damage that occurred in structure fires come to 9.6 billion dollars. In addition, 8,500 fires occurred as outside fires such as outside storage, crops, timbers, etc. and caused 6 million dollars in loss. (Karter 007) 1. General features of wood pyrolysis Wood, a representative charring material, is a complex mixture of natural polymers of high molecular weight, mainly cellulose (~50%), hemicellulose (~5%) and lignin (~5%). Each component decomposes to release volatiles at different temperatures; typically, hemicellulose 00~60, cellulose 40~350, lignin 80~500 (Drysdale 1999). The main products of wood pyrolysis are volatile products and char. In general, the volatile products are categorized into tar which contains the combustible volatiles
22 and has low volatility, and gas which consists of mainly CO, H and CO. These volatile products may either burn in a fire or be collected for commercial products such as bio-fuels. Pyrolysis condition has significant influence on the composition of pyrolysis products which, in turn, affect the liquid bio-fuel and combustion characteristics of a wood fire. Externally Applied Heat Flux F Convective Heat Losses h(t s - T ) Re-radiative Heat Losses eσ(t s 4 - T 4 ) T ρ f T s x a. Char with gases flowing through b. Pyrolysis zone ρ(x,t) c. Volatile condensation zone T(x,t) d. Virgin wood T = 0 x ρ w Figure 1.1 Pyrolysis of one dimensional wood slab, (Atreya 1983) Figure 1.1 shows the schematic diagram of pyrolysis of a one-dimensional thick wood slab which is initially at the ambient temperature, T. When the external heat flux is applied, the surface temperature begins to rise and heat is transported inside the slab by thermal conduction. When the temperature reaches the pyrolysis point, the wood begins to decompose from the surface. Then, the pyrolysis zone moves into deeper region of the slab leaving a char layer behind. Volatile products flow out to the surface is driven by the pressure gradient due to pressure generated at pyrolysis zone. The pressure peak seems to be located at the leading edge of the pyrolysis zone. Small portions of volatile products are believed to flow down into the slab ahead of the pyrolysis zone and to be condensed by the pressure gradient ahead of the pressure peak. However, the amount of volatile 3
23 condensation is expected to be much smaller than that of flow out to the surface, because the permeability of the char layer is significantly greater than that of unpyrolyzed wood material. As the thickness of the char layer increases, fine cracks begin to appear on the surface. These cracks abruptly decrease the flow resistance in the char layer and have a significant effect on the pyrolysis. 1.3 Pyrolysis modeling There has been extensive research into understanding the pyrolysis mechanism of charring material from both standpoints of liquid bio-fuel production and fire safety. Recently, numerical modeling has been widely used to predict the behavior of the charring material pyrolysis. Pyrolysis modeling of charring material (biomass or wood) deals with complex transient phenomenon involving chemical reactions, moisture drying and heat and mass transport processes. Most charring material pyrolysis models can be categorized into an analytical model, integral model and PDE (partial differential equation) model based on the solution approach. Analytical models can be solved mathematically for the exact solution based on various simplifying assumptions such as infinite rate kinetics and no volatiles convection. Atreya and Baum developed analytical models for opposed flow flame spread on charring material.(atreya and Baum 00; Baum and Atreya 007). Stagges obtained an exact solution for isothermal conditions in the char (Staggs 003). The integral model assumes a temperature profile inside the solid and infinite rate kinetics, so the complicated pyrolysis problem is simplified to an ODE (ordinary differential equation) of time. Although the integral model still needs to be numerically solved, the computational effort to solve the ODE problem is significantly smaller than a PDE problem. Staggs developed a pyrolysis model of char forming and filled polymers using the integral method with a quadratic temperature profile (Staggs 000). Moghtaderi developed an integral pyrolysis model for char forming solid and non-charring thermoplastic materials as a sub-model of CFD fire code (Moghtaderi 1997). Spearpoint 4
24 and Quintiere developed a pyrolysis model with the integral method for semi-infinite charring solid using a linear temperature profile in char and a quadratic temperature profile in virgin wood (Spearpoint et al. 000). Chen et al. used exponentially decaying temperature profiles in the virgin and char layers for the integral model (Chen 1993). Galgano et al. utilized the integral method for a wood cylinder pyrolysis model. (Galgano et al. 003; Galgano et al. 004). Comprehensive pyrolysis models which cover most physics of biomass pyrolysis are expressed as PDE s of space and time. Many comprehensive pyrolysis models utilize Arrhenius reaction type finite rate kinetics. Therefore, they can only be solved numerically. Kansa et al. developed a one-dimensional model considering volatile products transport equation by Darcy s law and single step global Arrhenius pyrolysis reaction. (Kansa et al. 1977) Their model showed good agreement with experimental results at low level intensity heat fluxes, but poor agreement at fire level intensity heat fluxes because structural change effect and secondary pyrolysis reaction were not taken into account. Chan investigated pyrolysis products distribution of a wood pellet depending on the pyrolysis conditions using three parallel primary reactions (wood -> char, wood -> 1 st tar and wood -> 1 st gas), and a moisture evaporation and secondary reaction (1 st tar-> nd tar and nd gas). (Chan 1983) Bellais et al. examined several shrinkage models for wood cylinder pyrolysis. (Bellais et al. 003) They reported that the predictions showed a better agreement for high temperature cases rather than low temperature cases; however, the shrinkage effect was small compared to experimental error range on mass loss. Bryden et al. summarized the general features of numerical biomass pyrolysis models which have been developed by several researchers. (Bryden et al. 00) (i) Most of the models are based on one dimensional energy and mass conservation equations with the assumption of local thermal equilibrium between gas and solids. (ii) For mass transfer, only gas phase flow is considered; the effects of diffusion and liquid phase flow are generally neglected. (iii) The particle is assumed as a porous media with inside flow following Darcy s law. (iv) Pyrolysis kinetics is modeled as multiple, competing two-step reactions. Each reaction rate is described by a 1 st order Arrhenius function with temperature. The first step reactions are decomposition of biomass material to tar, gas 5
25 and char. For these competing parallel reactions, each reaction rate is dependent on reaction conditions. The second step reaction is mainly tar cracking into gas and char. This reaction depends on temperature, heating rate and tar residence time in the particle. Generally, for small particles, the second step reaction is very small compared to the first step due to very short tar residence time in the particle. However, in the case of a biomass reactor, tar cracking occurs outside the particle and tar residence time in the reactor is significantly larger than that in the particle; therefore, the second step reaction becomes a very important factor to determine the pyrolysis products yields. (Di Blasi 00) 1.4 Kinetics Various kinetics schemes have been developed to describe charring material decomposition rate. From the standpoint of reaction rate, kinetics schemes are classified into two types: finite rate kinetics and infinite rate kinetics. The finite rate kinetics scheme is widely used for comprehensive PDE type pyrolysis models. A 1 st order Arrhenius reaction scheme is most often adapted for finite rate kinetics of solid and volatiles decomposition. The infinite rate kinetics scheme assumes pyrolysis occurs at a fixed temperature. This simplification eliminates complicated chemical reactions in the pyrolysis model, which only deals with thermal processes. The infinite rate kinetics scheme is widely adapted in integral models and analytical models for this advantage. Finite rate kinetics schemes vary in complexity from single step global reaction to multistep parallel reactions. In the single step global reaction scheme, the virgin solid is decomposed to char and volatiles. The yield ratio between char and volatiles is predetermined. Virgin solid (1-γ) Volatiles + γ Char In the single step parallel reaction schemes, products are generated by competing reactions. Thus, product yields depend on pyrolysis conditions which affect the reaction rates. 6
26 Virgin solid k t k c Volatiles Char Virgin solid k g k c k t Gas Tar Char In the multi-step parallel reaction scheme, the decomposition of tar is determined in the second step. Virgin solid k g k c k t Gas Tar k g k c Char For most pyrolysis models, wood is regarded as a homogeneous virgin solid for simplicity. A different approach is regarding wood as a mixture of hemicelluloses, cellulose and lignin. Each component decomposes independently. Parker measured kinetic parameters and heat of combustion of cellulose, xylan, mannan and lignin using PYROCAT (pyrolyzer and catalytic converter). (Parker 1988) Xylan and mannan are maor components of hemicellulose. The calculated mass loss rate of the mixture of four components did not show good agreement with the measurement. He attributed the discrepancy to the chemical structure difference between the commercially prepared xylan and mannan and those present in wood. Svenson et al. obtained kinetic parameters for cellulose, birch hemicelluloses and birch lignin in a single particle reactor. (Svenson et al. 004) Calculation of model birch which are the sum of three components showed good agreement with birch pyrolysis experiments above 400. However, there was a large difference of mass loss between calculation and measurement below Outline of this thesis This thesis presents a theoretical and experimental study of pyrolysis of charring material applicable to fire safety and biomass utilization. This work is divided into three parts: (i) numerical study of thermal decomposition and pressure generation in charring solids 7
27 undergoing opposed-flow flame spread (Park et al. 007), (ii) determination of pyrolysis temperature for charring materials (Park et al. 008), and (iii) experimental and theoretical investigation of wood pyrolysis. In addition to the three maor subects, development of a three dimensional arbitrary geometry pyrolysis model is presented Charring solids undergoing opposed flow flame spread Opposed-flow flame spread over solid fuel has been of interest among fire researchers because it is an important phenomenon in fire situations such as downward or horizontal flame spread against buoyancy induced air flow. Extensive research has been conducted on flame spread on vaporizing material such as PMMA (polymethylmethacrylate). De Ris developed a model of flame spread over vaporizing material. (De Ris 1969) Fernandez-Pello et al. experimentally investigated flame spread over PMMA cylinder of various diameters. (Fernandez-Pello et al. 1978; Fernandez-Pello et al. 1978) Delichatsios developed an exact solution for opposed flow flame spread over thermally thin materials. (Delichatsios 1986). Little research has been conducted on flame spread over charring material due to its complexity. Di Blasi numerically investigated flame spread rate over cellulosic slabs with various thickness (Di Blasi 1994; Di Blasi 1995). Most previous flame spread research has been focused on interaction between gas phase phenomena and solid fuel. The process of gaseous fuel generation inside charring material is more complicated than vaporizing solid fuel. For this reason, better understanding of more detailed physics of charring material is needed. Atreya and Baum developed analytical models for opposed flow flame spread over a charring solid based on simplifying assumptions. (Atreya et al. 00; Baum et al. 005). In chapter, thermal decomposition and pressure generation in charring solids undergoing opposed-flow flame spread has been numerically studied with a detailed physics-based model. Numerical results indicate that the char density and product yields are functions of depth due to an insulating char layer. In addition, the characteristics of various simplifying assumptions such as global reaction, infinite rate kinetics and no convective gas transport have been investigated. 8
28 1.5. Determination of pyrolysis temperature In order to simplify the complicated chemical reactions of pyrolysis modeling, pyrolysis front models (infinite rate kinetics models) assume that pyrolysis occurs abruptly at a predetermined constant temperature called pyrolysis temperature, T p. Thus, T p is a critical parameter in the pyrolysis front model because it characterizes the entire pyrolysis process. Nevertheless, relatively less attention has been devoted to determining T p than to developing the model itself. In chapter 3, an energy and mass balanced method of determining T p is proposed. The concept is to find T p that consumes the same amount of energy to produce the same amount of mass when using the pyrolysis front model as when using finite rate kinetics models for the entire charring process. The resulting T p has the form of pyrolysis rate weighted average temperature. Extensive numerical studies on various factors influencing the charring material pyrolysis show that heat flux, sample size, heat of decomposition and kinetic parameters are the most important factors for determining an appropriate pyrolysis temperature. For practical application, a non-dimensional correlation is developed to determine the appropriate pyrolysis temperature without solving the problem by using finite rate models Experimental and theoretical investigation of wood pyrolysis For several decades, many models have been developed to predict pyrolysis rate and product yields. From the standpoint of thermal mechanism, they regard the reactions as either endothermic or exothermic processes; however, the actual thermal behavior of wood pyrolysis is more complicated. Several researchers reported that both endothermic and exothermic reactions appeared during wood pyrolysis experiments. (Koufopanos et al. 1991; Bilbao et al. 1996; Milosavlevic et al. 1996; Di Blasi et al. 001; Strezov et al. 003) This was also observed in the experiments conducted for this work. 9
29 In chapter 4, investigation of wood pyrolysis is conducted by wood sphere pyrolysis experiments and theoretical model analysis emphasizing thermal behaviors. Based on the results, a novel pyrolysis model for wood pyrolysis is proposed Three dimensional pyrolysis model for arbitrary geometry charring material The shape and size of feed stock for a biomass reactor are also important variables which need to be optimized as well as temperature and feeding rate. In chapter 5, a three dimensional pyrolysis model for arbitrary geometry charring material is presented. Arbitrary geometry of charring material is rendered by the front tracking method based on finite difference method. The model is also useful for the analysis of various geometry wood structure pyrolysis in a fire. 10
30 Chapter Charring Solids Undergoing Opposed-flow Flame Spread Thermal decomposition and pressure generation in charring solids undergoing opposedflow flame spread have been numerically studied with a detailed physics-based model. The physical problem is modeled as a steady state two dimensional process including three parallel finite rate reactions and volatiles convection. Local thermal equilibrium is assumed between char matrix and volatiles. For pressure calculation, the volatiles are assumed to follow the ideal gas law and Darcy s law. Numerical results indicate that the char density and product yields are functions of depth due to an insulating char layer. In addition, the characteristics of various simplifying assumptions such as global reaction, infinite rate kinetics and no convective gas transport have been investigated. The global reaction model shows excellent agreement on char layer thickness with the detailed model. However, it predicts higher pressure inside the charring solid. The infinite reaction rate model shows thicker char layer in the fore region and thinner char layer in the downstream region due to constant pyrolysis temperature. Also, it shows lower pressure in the char. The simplified energy model predicts thicker char and higher pressure than the detailed model..1 Introduction Opposed-flow flame spread on a charring solid is one of the maor flame spread modes in a fire situation such as downward or horizontal flame spread against buoyancy induced air flow. Contrary to a vaporizing material, charring solid undergoes complex thermal decomposition resulting in an insulating char layer. This solid phase pyrolysis process 11
31 governs volatile fuel generation and its transport to the flame above the charring solid. Numerous studies have been done on the subect of charring material pyrolysis. However, most of them focused on unsteady one dimensional geometry models (Galgano et al. 003; Staggs 003) and only a few performed research on the charring process during flame spread (Atreya et al. 00; Baum et al. 005). Recently, an analytical model for opposed flow flame spread over a charring solid was developed by Atreya and Baum (Atreya et al. 00) based on simple assumptions. Their model assumes infinite rate kinetics with constant pyrolysis temperature and no gas convective transport. Pressure generation inside a charring solid also plays an important role in fuel gas transport and structural damage caused by rupture and subsequent breakage of the structure member in a fire. Although several models have dealt with pressure in a charring material, pressure calculation was primarily used to provide convective gas flow information required for the thermal analysis. Few previous works focused on pressure generation during the charring process. Fredlund measured pressure inside a wood block during the charring process and compared it with his numerical model (Fredlund 1988). Staggs developed a mathematical model for pressure in developing chars (Staggs 003). He derived exact solutions for isothermal conditions in the char. Baum et al. developed an analytical model for the transport of gases in a charring solid (Baum et al. 005). This model solves for the gas pressure and temperature distributions in the char. To prevent huge computational loads or to make the charring problem analytically tractable, not all the detailed physical phenomena are accounted for. Simplifications such as infinite rate kinetics, global reaction and no convective gas transport have been widely used in charring models. Since these simplifications inevitably affect the accuracy, it is important to assess their effects on the result especially when they are applied for fire safety applications. Thus, the purposes of this study are: (1) to numerically investigate the charring behavior and pressure generation in a charring solid during flame spread taking account of detailed physical processes, and () to assess the characteristics of simplified models by means of comparison with the detailed model. 1
32 . Mathematical modeling The schematic diagram of the physical problem is illustrated in Figure.1. Constant speed flame spread on the top surface of a semi-infinite charring material is considered. A thin flame sheet which stretches from the flame inception point to downstream of the wind blowing over the charring material advances against the wind direction at the constant speed V fs. The origin of coordinates is fixed to the flame foot to render the flame spread as a steady process with the charring solid moving into the flame foot with the constant velocity V fs. Heat flux coming from the flame sheet decreases downstream due to increasing distance between the flame sheet and char surface. On the other hand, heat conduction into the char decreases downstream as the char thickness increases. From these observations, it is reasonable to assume a constant temperature of the burning char surface ( x 0, y 0) > =. According to Atreya (Atreya 1983), the heat exchange between the gas phase and the solid phase across the upstream surface ( x 0, y 0) < = is small. Therefore, adiabatic condition for upstream and constant surface temperature for downstream are used as the charring solid surface boundary conditions. For pressure, ambient pressure boundary condition is applied at the surface. Figure.1 Schematic of the physical problem: steady propagation of an opposedflow diffusion flame on the surface of a charring solid 13
33 ..1 Reaction mechanism A three-way parallel finite rate reaction model is used for detailed analysis. A global finite rate reaction model and an infinite rate reaction model are used to simulate simplified versions of the problem. Kinetic rate constants for finite rate models were taken from Di Blasi s experimental work on beech wood (Di Blasi et al. 001). For the three-way parallel finite rate reaction model, three primary product classes, which are char, tar and gas, are formed by the thermal decomposition of the virgin solid. Tar and gas represent condensable volatiles and non-condensable volatiles. Each product formation rate is controlled by its kinetic rate constants. (Figure.) For the global finite rate reaction model, pyrolysis is modeled as a global decomposition reaction. Primary products are char and volatiles representing the sum of tar and gas. In contrast with the parallel reaction model, the product yield ratio between char and volatiles needs to be predetermined as ν for volatiles. For the infinite rate reaction model, the charring solid is divided into two zones, char and virgin solid. The thermal decomposition of virgin solid occurs abruptly at the interface between the two zones. The temperature along the interface is set to the constant pyrolysis temperature, T p. k g gas virgin soild k t tar k c char (a) virgin soild k w ν volatiles + virgin soild T = T p ν volatiles + 1 ν char 1 ν char (b) (c) Figure. Kinetics models: (a) Three-way parallel finite rate reaction model, (b) Global finite rate reaction model, (c) Infinite rate reaction model 14
34 .. Conservation of mass and energy The three-way parallel reaction model The steady state conservation of mass for each component inside the charring solid is described by the following equations. Solid phase components: V ρ S + S + S = (-1) + = (-) ( a fs) ( t g c) 0 ( ρ V c fs) S c 0 The volatiles in pore are assumed to be ideal gases and to follow Darcy s law. B ρ P t ( ερ V t fs) + S t = 0 µ B ρ P V S g g fs + g = µ ( ερ ) 0 Where, pressure P is the sum of partial pressures of tar and gas, P = Pt + Pg. (-3) (-4) Thermal decomposition kinetics is modeled as a first order Arrhenius reaction. Each product generation rate is described as follows: S S S = k ρ (-5) t t a = k ρ (-6) g g a = k ρ (-7) c c a k t t E t RT = Ae (-8) k g g E g RT = A e (-9) k c c E c RT = Ae (-10) The steady state conservation of energy with local thermal equilibrium assumption between volatiles and porous solid is described by: ( λ T) ρacw ρccc ε( ρtct ρgcg) Vfs T B (-11) + ( ρtct + ρgcg) P T + Q( T) = 0 µ 15
35 Heat generation QT ( ) is a function of temperature. When specific heat capacities do not vary with temperature, it can be given by: ( ) = ( ) 0 t( w t) + g( w g) + c( w c) 0 ( t + g + c) QT T T S C C S C C S C C h S S S where, h0 is heat of pyrolysis at reference temperature T 0. (-1) Porosity is defined as a function of solid phase density as follows: ρa + ρc ε = 1 ( 1 εw ) (-13) ρ w Viscosity of the volatiles is modeled as a linear function of temperature as: T µ = µ p (-14) T p Thermal conductivity and permeability are modeled as linearly interpolated between virgin solid and char. λ = (1 ηλ ) w + ηλ c (-15) B= (1 η) B w + ηb c (-16) where, degree of pyrolysis η is defined as η ρ a = 1 (-17) ρw By combining equations (-3), (-4) and the equation of state P = ρrt, the partial pressure equations of tar and gas can be obtained as follows: BP t ε Pt R P Vfs + St = 0 µ T T Mt BP g ε Pg R P Vfs + Sg = 0 µ T T Mg (-18) (-19) The global reaction model Virgin solid decomposition rate is modeled as a first order Arrhenius reaction: S = k ρ (-0) a w a k w w E w RT = A e (-1) 16
36 Pressure and energy equations for the global reaction model are described as follows, BP ε P R P Vfs ν Sa = 0 µ T T Mv where, ν is predetermined volatile fraction factor. B λ T ρacw + ρccc + ερvcv V fs T + ρvcv P T + Q T = µ ( ) ( ) ( ) 0 where, heat generation QT ( ) is given by, ( 0 0) ( ) ( ) ν( ) ( 1 ν)( ) (-) (-3) QT = Sa T T Cv Cw + Cc Cw + h (-4) The infinite rate reaction model For the infinite rate model, variables and properties become constant such as ρ c = ρ f, ρ ρ ε = ε ε, λ = λc or λw and B= Bc in char or virgin solid. Since volatiles a = w, c or w are generated along the interface and most of them travel through the char layer to the surface, the virgin solid can be modeled as impermeable and the pressure equation is solved only inside the char. Thus, the energy equation for virgin solid is reduced from equation (-3) to the following expression: α T V T = 0 (-5) w fs where, virgin solid thermal diffusivity is α λ / ( ρ C ) =. w w w w The conservation of energy in char considering volatiles flow is described as follows: B c λc T ( ρfcc + εcρvcv) Vfs T + ρvcv P T = 0 (-6) µ The Energy balance among conduction heat fluxes for both virgin solid and char and the heat of pyrolysis at decomposition temperature, ht ( p ) gives the char / virgin solid interface condition (Stefan condition). T λ λ T V ρ h T = c c w w fs w p ( ) 0 ; T Tp where, ( ) ( ) ν ( ) ( 1 ν)( ) ht = T T C C + C C + h p P 0 w v w c 0 = (-7) Since there is no volatile generation inside the char, equation (-3) can be reduced as follows: 17
37 BP c ε cp P Vfs = 0 µ T T Mass balance at the interface is given by the follow expression: ρ ρ ε ρ ρ B P µ n c ( w f ) Vfsnx = c vvfsnx + v if (-8) (-9) where, n x is the x -direction component of the interface normal vector n. The simplified energy model By neglecting the convective volatile transport in a charring solid, the energy equation does not contain pressure related terms. This approach eliminates the difficulty of solving the pressure equation. This simplified energy model is convenient especially when only the thermal process is of interest. In this model, equations (-11) and (-3) reduce as follows: λ T ρ C + ρ C V T + Q T = ( ) ( a w c c) fs ( ) 0 (-30) For pressure analysis, equations (-18), (-19) and (-) are applied for parallel reactions and global reaction mechanisms. For infinite rate model, equation (-6) reduces as below: α T V T = 0 c fs where, thermal diffusivity of char αc λc / ( ρ fcc) =. (-31)..3 Numerical analysis The mathematical models presented here were solved by numerical methods based on the finite volume method for finite rate reaction models and the finite difference method for infinite rate reaction models. Char / virgin solid interface of the infinite rate reaction model was found by the front tracking method developed by Jung et al. (Jung 000; Jung et al. 004) Originally, Jung s method was developed to track solidifying front of molten metal governed by conduction heat transfer. In this study, convection heat transfer terms are added to Jung s model to consider the effects of volatiles flow. 18
38 Though the problem of interest is steady state, an unsteady time derivative term is added to the steady state governing equations. The steady state solution is obtained from initial conditions after sufficient time integration. The Backward Euler method for time integration is applied for better numerical stability. The Implicit point method was used with iterations for each time step. Though temperature and pressure equations are strongly coupled to each other, they cannot be solved at the same time due to non-linearity. To resolve this problem, temperature and pressure equations are solved alternately and iterated to obtain consistency between the pressure and temperature at each time step Discretization of governing equations Governing equations are discretized to be numerically solved. Figure.3 shows volume / node index stencil in space used for the discretization of governing equations. i,+1 i,+1 i-1, i, i+1, i-1, i, i+1, i,-1 (a) i,-1 (b) Figure.3 Volume / node index stencils; (a) control volume index for finite volume method, (b) node index for finite difference method Discretization of detailed model governing equations for numerical analysis is described as follows. Discretized governing equations of simplified models are listed in Appendix A to D. Energy equation By adding the unsteady term, equation (-11) for two dimensions becomes the following; 19
39 T ρacw ρccc ε( ρtct ρgcg) t T T T = λ + λ ρacw + ρccc + ε( ρtct + ρgcg) Vfs x x y y x B P T P T + ( ρtct + ρgcg) + + Q( T) µ x x y y Components of equation (-3) are discretized as below; Temperature time derivative: T t T n+ + 1 n i, Ti, t (-3) (-33) where, n and n + 1 represent old and new time steps; m and m + 1 correspond to iteration steps. Conduction heat transfer: T λ λ x x δ x ( T T ) λ ( T T ) i+ 1/, i+ 1, i, i 1/, i, i 1, ( T T ) λ ( T T ) T λi, + 1/ i, + 1 i, i, 1/ i, i, 1 λ y y δ y where, interface thermal conductivities are calculated as: λ i+ 1/, = λ i + 1, λ i, λ + λ i+ 1, i, (-34) (-35) (-36) λ i, + 1/ = λ i, + 1 λ i, λ + λ i, + 1 i, (-37) Convection terms are discretized by the upwind scheme to increase stability of the solution. (Patankar 1980) Convection term by flame spread: ( ) ρ C + ρ C + ε ρc + ρ C V a w c c t t g g fs ( ) T x ρ C ρ C ε ρc ρ C V a w c c t t g g fs i, T T n+ + 1 n+ i, i 1, δ x Volatiles flow convection terms caused by the pressure gradient: (-38) 0
40 ( ρtct + ρgcg) B P T µ x x Bi, 1 P 1, 1, 1 1, ( ) max,0 n+ m P n+ m+ P, 1,, max,0 n+ m ρtct + ρgcg T i i Ti Ti+ 1, µ i, δx + x x x (-39) ( ρtct + ρgcg) B P T µ y y B 1 P P P + max,0 max,0 i, + µ i, δy y y y, + 1, + 1, , ( ρtct ρgcg) Ti, 1 Ti, Ti, + 1 where, max ( AB, ) i n m n m n m A for A> B =. B for A < B Spatial discretizations of pressure: P x P y P P n+ n+ i+ 1, i 1, P δ x P n+ n+ i, + 1 i, 1 δ y Finally, the discretized energy equation becomes: (-40) (-41) (-4) ( ρ C + ρ C + ερc + ερ C ) = a w c c t t g g i, λ λ + n+ + 1 n i, i, n+ n+ + 1 n+ + 1 n+ ( T T ) λ ( T T ) i+ 1/ i+ 1, i, i 1/ i, i, 1 δ x n+ n+ + 1 n+ + 1 n+ ( T T ) λ ( T T ) + 1/ i, + 1 i, 1/ i, i, 1 δ y T t T T T ( ρacw + ρccc + ερtct + ερgcg) V i, fs δ x max ( J,0) T J T + max ( J,0) T + δ x n+ + 1 n+ i, i 1, n+ n+ + 1 n+ x i 1, x i, x i+ 1, ( ) + ( ) n+ n+ + 1 n+ max Jy,0 Ti, 1 Jy Ti, max Jy,0 Ti, Q δ y i, (-43) where, volatile thermal mass flux terms driven by the pressure gradient: 1
41 B, ( ρ ρ ) J = C + C i x t t g g i, µ i, B, ( ρ ρ ) J = C + C i y t t g g i, µ i, P x P y (-44) (-45) After rearrangement, the new time step temperature is obtained by the following equation. n n+ n+ n+ n+ Ti, = ( BTi 1, + CTi+ 1, + DTi, 1 + ETi, F) (-46) A where, ( C C C C ) ρ + ρ + ερ + ερ λ + λ λ + λ A = + + t δx δy a w c c t t g g i, i + 1/, i 1/, i, + 1/ i, 1/ ( ρ ρ ερ ερ ) acw + ccc + tct + gcg V i, fs + Jx J y + + δx δy ( ρacw + ρccc + ερtct + ερgcg) Vfs + max ( Jx,0) λi 1/, i, B = + δx δx ( J ) λi+ 1/, max x,0 C = + δx δx ( ) λ max J,0 i, 1/ y D = + δy δy ( ) λ max J,0 i, + 1/ y E = + δy δy ( ρ C + ρ C + ερc + ερ C ), a w c c t t g g i n i, i, F = Q + T t (-47) Pressure equation With the unsteady term added, the tar partial pressure equation (-18) for char is discretized in two dimensions as below:
42 1 ε ε t T T 1 = δ x n+ n i, n+ + 1 i, n P 1, ti,, P n+ m n ti,, i, i, BPt µ T n+ i+ 1/, n+ n+ + 1 n+ n+ ( Pt, i+ 1, Pt, i, + Pg, i+ 1, Pg, i, ) n+ BPt n+ + 1 n+ n+ n+ ( Pti,, Pti, 1, + Pgi,, Pgi, 1, ) µ T i 1/, n+ BP t n+ n+ + 1 n+ n+ ( Pt,, i + 1 Pt,, i + Pg,, i + 1 Pg,, i ) 1 µ T i, + 1/ + n+ δ y BPt n+ n+ + 1 n+ n+ ( Pt, i 1, Pt, i, + Pg, i 1, Pg, i, ) µ T i, 1/ V δ n+ n fs εi+ 1, ε + n+ i 1, n+ R P n ti, + 1, P n ti, 1, + Sti,, x + + Ti + 1, T i 1, Mt where, inter-node volatile mass flux terms are: (-48) BP µ T µ T µ T n+ n+ n+ 1 Bi, Pt, i, Bi, P t t, i+ 1, = + n n + + i+ 1/, i, i, i, i+ 1, ; BP µ T µ T µ T n+ n+ n+ 1 B t i 1, Pt, i 1, Bi, Pt, i, = + n n + + i 1/, i 1, i 1, i, i, ; BP µ T µ T µ T n+ n+ n+ 1 Bi, Pt, i, B t i, + 1 Pt, i, + 1 = + n n + + i, + 1/ i, i, i, + 1 i, + 1 ; BP µ T µ T µ T n+ n+ n+ 1 B t i, 1 Pt,, i 1 Bi, Pt,, i = + n n + + i, 1/ i, 1 i, 1 i, i, (-49) After rearrangement, the new time step tar partial pressure is obtained by the following equation. n n+ n+ n+ n+ Pti,, = ( BPti, 1, + CPti, + 1, + DPti,, 1 + EPti,, + 1+ F) (-50) A where, n+ 1, 1, 1, 1,, 1 n + m n + m 1 n + m n + ε m i BPt BP t BPt BP t n+ i, δ µ µ δ µ µ i+ 1/, i 1/, i, + 1/ i, 1/ A = , T t x T T y T T n+ n+ BP Vfs ε t i 1, n+ i 1/, i 1, 1 B = +, δ x µ T δxt n+ n+ BP Vfs ε t i+ 1, n+ i+ 1/, i+ 1, 1 C =, δ x µ T δxt 3
43 t δ y µ T n+ 1 BP D =, t δ y µ T i, 1/ n+ 1 BP E =, i, + 1/ n+ n+ 1 BPt n n BP + + t n+ n+ F = ( Pgi, + 1, Pgi,, ) ( Pgi,, Pgi, 1, ) δ x µ T µ T i+ 1/, i 1/, n+ n+ 1 BPt n n BP + + t n+ n+ R + ( Pgi,, + 1 Pgi,, ) ( Pgi, 1, Pgi,, ) + S δ y µ T µ T M i, + 1/ i, 1/ t ε n i, n ti,, + P n ti,, Ti, t (-51) Similarly to tar partial pressure, the new time step gas partial pressure is obtained by the following equation: n n+ n+ n+ n+ Pgi,, = ( BPgi, 1, + CPgi, + 1, + DPgi,, 1 + EPgi,, + 1+ F) (-5) A where, n+ 1, 1, 1, 1,, 1 n + m n + m 1 n + m n + ε m i BPg BP g BPg BP g n+ i, δ µ µ δ µ µ i+ 1/, i 1/, i, + 1/ i, 1/ A = T t x T T y T T n+ n+ BPg V fs ε i 1, n+ i 1/, i 1, 1 B = + δ x µ T δx T n+ n+ BPg V fs ε i+ 1, n+ i+ 1/, i+ 1, 1 C = δ x µ T δx T D = E = 1 y BP g δ µ 1 y T BP g δ µ T n+ i, 1/ n+ i, + 1/ 4
44 n+ n+ 1 BPg BP F = P P P P δ x µ T µ T i+ 1/, i 1/, n+ n+ g n+ n+ ( ti, + 1, ti,, ) ( ti,, ti, 1, ) n+ n+ 1 BP BP n+ n+ g n+ n+ R + ( Pti,, + 1 Pti,, ) ( Pti, 1, Pti,, ) + δ µ µ g y T T M i, + 1/ i, 1/ g S ε n i, n g,, i + P n g,, i Ti, t (-53)..3. Curved interface In the infinite rate model, the domain of charring solid is divided between char and virgin solid by the char / virgin solid interface. Spatial derivatives of variables at the nodes near the interface are obtained by four-node scheme to ensure nd order accuracy. (Jung 000; Jung et al. 004) Neighboring nodes used for spatial derivatives of variables at node i, which is adacent to the char / virgin solid interface, are shown in Figure.4. The temporary variable φ corresponds to either pressure or temperature in the governing equations. φ i, + Char Interface φ i, + 1 φ i, φ i + 1, φ i+, Virgin solid φ bx φ by y x Figure.4 Neighboring nodes used for spatial derivatives of variables at node i, which is adacent to the char / virgin solid interface. 5
45 δ x b δ x δ x bx i i+1 i+ Figure.5 Nodes used for x-direction derivatives 1 st and nd derivatives in x-direction (Figure.5) are found as below: Skew ratio in x-direction of node i: δ x β = b (-54) δ x 1 st spatial derivative of φ in x-direction: φ = x δxβ β + + i ( 1)( β ) 3 4 3β 7β β β φi φi+ 1 φi+ + + δxβ β 1 β δx β 1 δx β φ bx ( + )( + ) ( + ) ( + ) nd spatial derivative of φ in x-direction: ( )( ) ( β) ( ) ( β ) ( ) φ 6 β 3 1 = φ + φ + φ + φ x x + + x x + x + bx i i+ 1 i+ δ β β 1 β βδ δ β 1 δ β i (-55) (-56) 1 st and nd spatial derivatives of φ in y-direction are found as below: Skew ratio in y-direction of node : δ y γ = b (-57) δ y 1 st spatial derivative of φ in y-direction: φ = y δyγ γ + + ( 1)( γ ) 3 4 3γ 7γ γ γ φ φ+ 1 φ+ + + δyγ γ 1 γ δy γ 1 δy γ φ by ( + )( + ) ( + ) ( + ) nd spatial derivative of φ in y-direction: (-58) 6
46 ( )( ) ( γ) ( ) ( γ ) ( ) φ 6 γ 3 1 = φ + φ + φ + φ y y + + y y + y + by δ γ γ 1 γ γδ δ γ 1 δ γ i (-59)..3.3 Tracking interface The procedure to find new time step char / virgin solid interface nodes is illustrated in Figure.6. Here, a three-node circular profile is employed to reconstruct the interface, whereas, the original Jung s method used a three-node quadratic profile. * First, temporary nodes ( l 1, l *, l + ( l 1 old * 1 ) are proected from old time step interface nodes, l old, l + 1 old ) by equation (-60). Second, a new time step interface is constructed based on three temporary nodes by equations (-61) ~ (-63). Third, new time step interface nodes ( l 1 new new, l, l + 1 new ) are found by equation (-64). Using a circular profile interface, normal vector n at a node is easily found by equation (-65). x 0, y 0 l 1 old R * l 1 old l l 1 new * l new l l +1 old * n l l +1 new * l +1 ( x x ) + ( y y ) = 0 0 R Figure.6 Interface tracking: new time interface nodes by circular profile Interface advancing velocity along interface normal vector n at an interface node is found as: 7
47 V T T λ λ = + (-60) c w n c n w if, n Vfsnx ρwqt ( p) Center of circular interface profile is found as: x y 0 = y y x x + y y x x + y y ( ) * * l+ 1 l 1 * * * * * * * * l+ 1 l 1 l+ 1 l 1 l l 1 l l 1 y * y * l l 1 y y x x x x ( ) * * l+ 1 l 1 * * * * l+ 1 l 1 l l 1 y * y * l l 1 x x + y y x x * * * * * * l l 1 l l 1 l l 1 0 = x0 ( y * y *) y * y * l l 1 l l 1 Radius of interface circular profile is found as: ( ) ( ) * 0 * 0 R x x y y l l (-61) (-6) = + (-63) Coordinates of New time step interface nodes are found by: ( ) new x = x ± R y y new l 1 0 l 1 0, new l ( ) new y = y ± R x x 0 l 0, ( ) new x = x ± R y y (-64) new l+ 1 0 l+ 1 0 Interface normal vector n at an interface node is found as: x x0 ˆ y y0 n = i + ˆ (-65) R R The pressure interface condition equation (-9) and interface advancing velocity equation (-60) need 1 st spatial derivatives of pressure and temperature along interface normal n vector at interface nodes for both sides of char and virgin solid. They are calculated by equation (-66) and (-67) using two nodes along n vector in char and virgin solid sides. (Figure.7) The distance between nodes δ n is determined as the shorter length between δ x and δ y. φ n p, char φc 4φc 1+ 3φp = δ n (-66) 8
48 φ n p, virgin solid φw 4φw 1+ 3φp = δ n (-67) The values at these nodes are found by area weighted interpolation using equation (-68) as shown in Figure.8. φ = Aaφ a + Abφb + Acφc + Adφd A + A + A + A a b c d (-68) φ c char δ n φ c1 n φp φ w1 virgin solid φ w Figure.7 Nodes used for 1 st derivative calculation 9
49 d c A b A a A c A d a b Figure.8 Area weighted interpolation.3 Numerical analysis Numerical analysis was performed on six cases with various combinations of kinetics and energy models. Case descriptions are summarized in Table.1. Properties and kinetic constants used for numerical analysis are summarized in Table.. Numerical analysis domain dimensions are 0.05m x 0.1m, 0.015m y 0m and a 301 x 181 grid is used. In order to obtain a steady state solution, the time integration is longer than twice of charred top surface length (0.1 m ) / flame spread speed. Flame spread speed is set at 1 mm/second which is obtained from the literature. (Atreya et al. 00) The boundary conditions of the computational domain are described in Figure.9. An adiabatic condition for upstream ( 0.05m x< 0 m) and constant temperature of Ts = 850K for downstream (0m x< 0.1 m) are imposed as top surface thermal boundary conditions. Ambient pressure P0 is imposed on the entire top surface. T y = 0 P 0 = 1 atm flame inception T = T = 850K S P 0 = 1 atm Vfs = 1 mm/ s T = T = 300 K 0 ρ = ρ = 700 kg / m w 3 virgin solid T y = 0 char T x = 0 P = 0 x Figure.9 Boundary conditions of computational domain 30
50 Table.1 Numerical analysis conditions case 1a parallel reactions & detailed energy equation case 1b parallel reactions & simplified energy equation case a global reaction & detailed energy equation case b global reaction & simplified energy equation case 3a infinite rate reaction & detailed energy equation case 3b infinite rate reaction & simplified energy equation case 4 analytical model (Atreya et al. 00; Baum et al. 005) Table. Properties and kinetic constants Property Value Source Property Value Source ρ w kg/m (Galgano et al. 003) w A s (Di Blasi et al. 001) 3 ρ f 9.8 kg/m Calculated h 430 kj/kg (Di Blasi et al. 001) Cw 1.5 kj/kg K (Di Blasi 1996) M g kg/mol (Gronli 1996) Cc 1.1 kj/kg K (Di Blasi 1996) M t 0.11 kg/mol (Gronli 1996) Ct.5 kj/kg K (Gronli 1996) M v kg/mol Calculated Cg 1.1 kj/kg K (Gronli 1996) p Cv.87 kj/kg K Calculated w ε w 0.4 (Galgano et al. 003) c 5 µ.3 10 kg/m s (Galgano et al. 003) B m (Gronli 1996) B m (Gronli 1996) Ec kj/mol (Di Blasi et al. 001) λw W/m K (Galgano et al. 003) Et kj/mol (Di Blasi et al. 001) λc W/m K (Galgano et al. 003) Eg 15.7 kj/mol (Di Blasi et al. 001) Vfs m/s (Atreya et al. 00) Ew 141. kj/mol (Di Blasi et al. 001) R J/mol K s (Di Blasi et al. 001) Tp K Calculated A 6 1 c s (Di Blasi et al. 001) T s 850 K (Atreya 1983) A 10 1 t s (Di Blasi et al. 001) T 0 A 9 1 g 300 K 31
51 .3.1 Temperature and pressure Temperature T ( T T ) ( T T ) = distribution of case 1a appears in Figure.10. The 0 / s 0 steep slope of iso-temperaure lines near x = 0 indicates that a relatively larger amount of pyrolysis occurs near the flame foot than in the downstream region. In addition, a larger temperature gradient near x = 0 indicates a thinner pyrolysis zone than that of the downstream region. In spite of a higher thermal conductivity of the char than that of the virgin solid, it is difficult to tell the temperature gradient difference between the char and the virgin solid regions. This is due to a portion of the thermal energy conducted through the char being absorbed by the endothermic reaction in the pyrolysis zone and the remaining heat being conducted into the unpyrolyzed region. Here, the thermal conductivities of the virgin solid and char are found at the middle temperatures during the charring process; 500 K for virgin solid and 770 K for char. Large char conductivity is attributed to a strong radiation effect inside the char pores at high temperature. Figure.11 shows pressure P = P/ P0 distribution inside the char layer and pyrolysis zone. To reduce the computational load, a pressure equation was computed for the char and pyrolysis zones which are pyrolyzed over 0.1%. The virgin solid ( η < 0.1% ) is assumed as impermeable. The pressure rises with depth up to P = 1.1 which covers char and most of the pyrolysis zone. The pressure gradient in the char region ( 1.0 P 1.07) < < does not vary much with depth because the volatile mass flow rate and the permeability are nearly constant. In the pyrolysis zone ( 1.07 P 1.1) < <, although the volatile mass flow rate decreases with the depth depending on η, the pressure gradient does not vary much due to the permeability decrease from char to virgin solid. The deep region ( P > 1.1) shows a pressure gradient of nearly zero due to the negligible volatiles generation and volatile flow rate. This observation validates the impermeable virgin solid assumption. 3


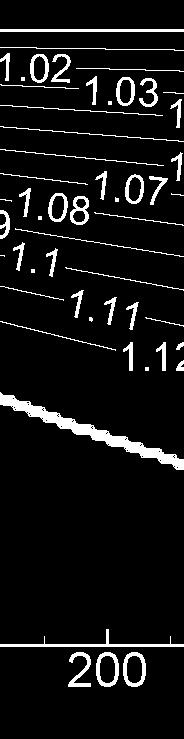

52 Figure.10 Temperature T T T0 = T T s 0 profiles; Case 1a Figure.11 Pressure P = P P 0 profiles; Case 1a 33
53 .3. Product yields Figure.1 shows that char density increases with depth in the completely pyrolyzed region. Near the surface, pyrolysis occurs at high temperature due to a fast heating rate which results in a higher volatiles yield. On the contrary, the deeper region shows a larger char density. The pyrolysis reaction zone can be recognized by the band of iso-char density profiles underneath the char region. The pyrolysis zone approximately matches the area between η = 5% and η = 95% in Figure.13. Figure.14 shows the char yield ratio defined by S / ( S + S + S ) at x = 0.09 m. Char yield of case 1a, 1b c c t g increases rapidly in the deep region. Product generation rates defined by 1 x 0 x 0 L 0 Sidy ( Sc + St + Sg) dydx ;,, Ly L Ly i = c t g ; L = 0.1m ; L = 0.015m are shown in Figure.15. All three production rates show a peak near x = 0, decrease rapidly until x = 0 and then gradually decrease. The pyrolysis rate decreases in the downstream region because heat conduction from the surface to the pyrolysis zone is reduced due to a thicker char layer. The tar production rate is one order larger than for the other two products. The gas production rate is larger than char for x< 70 and then the trend becomes the reversed for x> 70. The rate of gaseous fuel coming out from the solid surface is shown in Figure.16. Since the pressure gradient is nearly normal to the surface, gaseous fuel eection is coincident with Figure.15. Both the global reaction model and the infinite rate model need a product yield ratio as an input parameter, i.e. volatile fraction ν. The value was found based on the numerical result of case 1a by the integration of each product generation rate over the entire computational domain using equations (-69) and (-70). The products mass yield fractions are: char 13.3%, tar 73.5% and gas 13.%. This result gives ν = x y * i a i Ω E i RT S = ρ ke da, i = c, t, g (-69) 34
54 Y * i S =, * i * S i = c, t, g, = c, t, g (-70) Figure. 1 Char density ρ = c ρc ρ w distribut tion; Case 1a ρa Figure.13 Profiles of the degree of pyrolysis for η = 1, η = 5%, 50%, 95% ; ρw Case 1a 35
55 Figure.14 Char yield ratio S c Sc + St + S g at x = 0.09 m (x = 57.5) Figure.15 Comparison of products generation definedd by 1 L x Lx 0 0 Ly ( 0 Ly S c Sdy i ; i = c, + S + S dydx t g ) t, g 36
56 Figure.16 The rate of gaseous fuel coming out from the solid surface defined by Vys, ρis, ; i = t, g 1 Lx 0 ( L 0 Sc + St + Sg) dydx Ly x.3.3 Pyrolysis temperature The infinite rate model needs a constant pyrolysis temperature T p as an input parameter. Though using proper pyrolysis temperature is important for the infinite rate model, how to determine the pyrolysis temperature has not been clearly established in previous research. In this work, the pyrolysis temperature was determined by energy balance from the numerical result of case 1a. To match the energy balance between case 1a and the nfinite rate model, heat generation Q should be the same for both models. Based on this relation, the pyrolysis temperature can be found by equation (-71) and the value is T p T p = 696.6K. = ( T T0 Ω ) S ( * i ( i w C w S C C C i ) i ) da + T, 0 i = c, t, g (-71) 37
57 .3.4 Simplified models: Char layer thickness The interfaces between virgin solid and char of simplified models are compared with the detailed model in Figure.17. Instead of a discontinuous interface of the infinite rate model, the finite rate models show a gradual transition from virgin solid to char. For the comparison, η = 50% line is regarded as char / virgin solid interface for finite rate models. The global reaction model (case a, b) shows excellent agreement with the parallel reaction model (case 1a, 1b) in char layer thickness. The infinite rate model predicts a thicker char layer in the region near the flame foot ( x < 10 ) and then a thinner layer in the far downstream region ( x > 10 ) because pyrolysiss of the finite rate models startss at high temperature due to a fast heating rate near x = 0 and proceeds for lower temperature due to a slower heating rate caused by the thicker char layer. The simplified energy model (case 1b, b, 3b) predicts approximately 10% thicker char layers than the detailedd energy model becausee the no volatiles convective transport simplification does not account for the loss of thermal energy carried by the volatiles leaving the surface at T s. However, modification of the thermal properties of then char such as conductivity can be considered to energy model. improve the accuracy of the simplified Figure..17 Comparison of virgin solid / char interface 38
58 Figure.18 Comparison of pressure at x= 0.09 m (x = 57.5).3.5 Simplified models: Pressure The non-dimensional pressure profiles defined by P = P/ P at x= 0.09 m (x = 57.5) are shown in Figure.18. The infinite rate model predicts lower pressure than the finite rate models. The pyrolysis rate can be interpreted from the virgin solid / char interface slope. Except for the very beginning part ( x < 30 ), the interface slopes of the nfinite reaction rate models are smaller than those of the finite rate models (Figure.17). Thus, the finite rate models show more volatiles generation and a higher pressure rise for the domain of x > 30. The pressure profiles of the infinite rate model end at about y = 11 0 which matches the interface. The finite rate maintained until y = 18 and then the pressure models show that the pressure rise is rise drops down gradually to zero. The global reaction model estimates 8.5% higher pressure than the detailed reaction model at the deep zone. This is because the detailed reaction model predicts a higher char yield than the global reaction model whichh has a constant char yield ratio for y > 10 (Figure.14). The simplified energy model predicts a 9% higher pressure than the detailed energy model due to a higher pyrolysis rate as mentioned in the char depth comparison. 39
59 .3.6 Comparison with the analytical model For the purpose of validating the numerical model, the numerical result was compared with the analytical model which has been developed by Baum and Atreya (Atreya et al. 00; Baum et al. 005). Since the analytical model is based on infinite rate kinetics and the simplified energy model, the numerical result of case 3b can be directly compared. Case 4 and case 3b show excellent agreement in char depth and pressuree profile in Figure.17 and Figure.19. Here, parabolic variable ω in Figure.19 is defined by the c α w parabolic coordinates transformationn ωc = ω α al. 00; Baum et al. 005). c and τ + i ω = V fs α w ( x + iy) (Atreya et αw Figure.19 Pressure P plotted on the parabolic coordinate ωc = ω which α represents depth and is derived from the parabolic coordinates transformation VV fs defined by the relation τ + iω = ( x+ iy) α w.3.7 Computational time The computation times for the models were case 1a 10,005 seconds; case 1b 4,495 seconds; case a 1,487 seconds; case b 1,976 seconds; case 3a 8,69 seconds; case 3b 18,739 seconds. The CPU used was AMD Athlon GHz. The global reaction model (case ) was the fastest because its simple reaction kinetics reduces the c 40
60 computational load. Interestingly, the infinite reaction model (case 3) took large computational time compared to simple kinetics due to the huge numerical effort required to track the interface between the virgin solid and the char..4 Summary The thermal decomposition and pressure generation in charring solids undergoing opposed-flow flame spread have been numerically studied taking into account detailed physics. In addition, the characteristics of various simplified models have been investigated. A larger amount of pyrolysis occurs near the flame foot than in the downstream region and the pyrolysis zone is thinner near x = 0 than in the downstream region. The temperature gradient does not vary significantly from the char to virgin solid because the endothermic reaction effect is partly offset by the larger thermal conductivity of char than virgin solid. Pressure rises with depth in char layer and pyrolysis zone and the highest pressure exits at the bottom of the pyrolysis zone. This observation validates the impermeable virgin solid assumption. Since the pyrolysis occurs at a lower temperature in the deeper region, the char density increases with depth. The averaged products yield mass fractions are: char 13.3%, tar 73.5% and gas 13.%. The pyrolysis temperature was found by an energy balance relation from the parallel reaction model results, and the value is T = 696.6K. The global reaction model showed excellent p agreement with the parallel reaction models in the char layer thickness. However, it predicted a higher pressure in the char and pyrolysis zones. The infinite reaction rate model predicted a thicker char layer in the region near the flame foot and a thinner char layer in the far downstream region due to a constant pyrolysis temperature. It showed lower pressure in the char than the finite rate models. The simplified energy model predicted thicker char and higher pressure than the detailed energy model because it does not account for energy carried by volatile leaving the charring solid at surface temperature. However, modification of thermal properties such as conductivity of char can be considered to improve its accuracy. 41
61 Chapter 3 Determination of Pyrolysis Temperature for Charring Materials An energy and mass balanced method of determining the pyrolysis temperature is proposed. The concept is to find the pyrolysis temperature that consumes the same amount of energy to produce the same amount of mass when using the pyrolysis front model as when using finite rate kinetics models for the entire charring process. The resulting pyrolysis temperature has the form of pyrolysis rate weighted average temperature. Comparisons between finite rate kinetics and pyrolysis front models for various boundary conditions, geometries, heats of decomposition, kinetic parameters and assumptions used in the literature were made to assess the proposed method. Models using energy and mass balanced pyrolysis temperature show good agreement with finite rate models and the experiments. Extensive numerical studies on various factors influencing the charring material pyrolysis show that heat flux, sample size, heat of decomposition and kinetic parameters are the most important factors for determining an appropriate pyrolysis temperature. Thermal conductivity, specific heat and density have a lesser effect on the pyrolysis temperature. For practical application, a non-dimensional correlation is developed to determine the appropriate pyrolysis temperature without solving the problem by using finite rate models. With this correlation the energy and mass balanced pyrolysis temperature can be determined with a standard deviation of 7.6K. These predictions are validated by comparison with measurements of wood cylinder pyrolysis. A good agreement suggests that simpler pyrolysis front models yield practically useful and accurate results given an appropriate pyrolysis temperature. 4
62 3.1 Introduction Knowledge of the pyrolysis rate of charring materials like wood is important for the prediction of fire growth because it determines the amount of gaseous fuel generated by the solid for the flames. The process of solid pyrolysis, char formation and growth is quite complex it involves heat transfer, decomposition reactions, and fuel mass transfer. Numerous models (Lee et al. 1976; Atreya 1983; Desrosiers et al. 1984; Wichman et al. 1987; Chen 1993; Jia et al. 1999; Staggs 1999; Di Blasi et al. 001; Atreya et al. 00; Galgano et al. 005; Baum et al. 007; Park et al. 007) have been developed over decades for the analysis and prediction of this charring process. These include models with (i) finite-rate decomposition kinetics, and (ii) infinite-rate kinetics leading to a propagating pyrolysis front that separates char from the virgin material at a specified pyrolysis temperature. While pyrolysis-front models circumvent decomposition kinetics, they are attractive because they lead to analytical and/or computationally efficient solutions. This is advantageous because predicting fire growth in multi-story buildings remains a daunting task despite the remarkable growth in computational abilities. Pyrolysis-front models also gain credibility from the facts that: (i) under high temperature environment such as a fire, the kinetics time scale is significantly smaller than the time scale of heat transfer inside the charring solid, and (ii) decomposition kinetics of numerous materials involved in a fire is not well-known. Hence, it is reasonable to model the pyrolysis process by infinite-rate kinetics which assumes that the entire chemical reaction occurs abruptly at a constant pyrolysis temperature T p. The pyrolysis rate is then controlled by thermal processes and the choice of the pyrolysis temperature. The purpose of this study is to outline a physics-based method of determining an appropriate value of the pyrolysis temperature to improve the accuracy of the pyrolysis-front models. Since the decomposition reaction is characterized by the pyrolysis temperature, the choice of a proper pyrolysis temperature is critical for the accuracy of the infinite-rate model. Nevertheless, relatively less attention has been devoted to determining T p than to developing the model itself. T p has been either treated as a material property obtainable by some reproducible experiments or a convenient value was assumed from the literature. (Chen 1993; Atreya et al. 00; Baum et al. 007) Many methods have been used to 43
63 define the pyrolysis temperature in the literature. For example, it has been considered as: (i) the temperature at 50% weight loss of a TGA sample, (Desrosiers et al. 1984; Staggs 1999) (ii) the temperature at the inflection point of a TGA curve, (Staggs 1999) (iii) the temperature plateau observed during pyrolysis experiments, (Desrosiers et al. 1984) or (iv) estimated from the measured surface temperature and mass loss history. (Jia et al. 1999) Recently, Galgano et al. determined T p by comparing the pyrolysis-front model predictions with the results of a finite-rate model (Galgano et al. 005). T p was either taken as the reaction temperature of the finite-rate model at the 50% pyrolyzed condition or determined by the condition of equal peak mass loss rate between the finite-rate model and the pyrolysis-front model. However, T p obtained from a constant heating rate TGA curve may not be suitable for a thermally thick charring solid because its heating rate varies with both space and time. Likewise, while T p as the temperature plateau during pyrolysis may be a representative value, such a plateau is not always observed and its value varies with the sample size, shape and boundary conditions. Thus, there is need for a more general rigorous method of determining the pyrolysis temperature. In the present study, a physics-based method of finding the pyrolysis temperature is proposed and its performance is evaluated against finite-rate models and experiments for various geometries including 1-D slab, infinitely long cylinder, and sphere. The influence of various factors is also investigated. 3. Energy and mass balanced pyrolysis temperature concept Pyrolysis temperature can be determined by comparing the pyrolysis-front model with either the experimental measurements or finite-rate kinetics models. The key question is how to define the matching condition. In this work, T p is found by ensuring that the same amount of energy is consumed to produce the same amount of mass for the entire charring process of interest by using the pyrolysis-front model as when using the finiterate kinetics model. 44
64 3.3 Pyrolysis models Consider a moisture free and thermally thick charring solid initially at ambient temperature, T 0, that is exposed to a constant heat flux on its external surfaces. A schematic of the physical problem is illustrated in Figure 3.1 for the 1-D slab geometry. The heat flux is imposed on one side of the slab and the other side is insulated. This renders the half section of a slab of twice the thickness with both sides exposed to the same constant heat flux. When the surface temperature becomes high enough, pyrolysis begins at the surface, and later, the pyrolysis zone advances into the solid leaving behind an insulating char layer. Details of this zone are shown in the inset of Figure 3.1. Gaseous volatiles generated during pyrolysis are transported to the surface through the porous char matrix. Two types of models are considered: (i) a finite-rate decomposition kinetics model that yields a finite thickness of the pyrolysis zone, and (ii) an infinitelyfast kinetics model where the pyrolysis zone thickness is zero and a pyrolysis front, associated with T p, propagates through the solid. Maor assumptions made in the models are: (1) Volatiles and the char matrix are in local thermal equilibrium and the virgin solid is assumed to be impermeable to volatiles flow. () Volume of the charring solid remains constant during the charring process, i.e. no char shrinkage. (3) Thermal properties vary with density but are averaged over temperature. Thus, enthalpy is given by: T ht ( ) = Cp( T) dt Cp( T To). T o Finite-rate kinetics model During pyrolysis and in finite-rate kinetics models, the density of the solid in the pyrolyzing zone changes continuously from the initial density of the virgin solid ' ρ ' to the final density of char ' ρ '. Thus, at any instant, a partially pyrolyzed element may be f considered to be a mixture of both char and unpyrolyzed active material. Since zero shrinkage is assumed, all densities are based on the original volume of the solid element yielding the instantaneous solid density as ρ ( x, t) = ρ ( x, t) + ρ ( x, t) s a c where ρ a and ρ c w 45
65 are the densities of the active material and char respectively. At t = 0, ρ ( x,0) = ρ ( x,0) = a ρ and ( ) w ρ c x,0 = 0 and at t = t, ρ ( xt, ) = ρ ( xt, ) = ρ and ρ ( xt, ) = 0. f s f c f f a s f Insulated Virgin Solid x = 0 x Pyrolysis Zone Char Surface x = L Heat flux Heat loss Ts T 0 Virgin Solid T λ w x x x Pyrolysis Front ρ w ρ a T p x m v ρ = (1 γ ) a x t Char T( x, t) T λ c x x+ x m v xp = ρw(1 γ) x t Figure 3.1 Schematic of a pyrolyzing charring solid for 1-D slab geometry ρ f According to Park et al., it was shown that pyrolysis of the virgin solid to char and volatiles may be accurately modeled by a global one step finite rate reaction as long as the correct char yield is used. (Park et al. 007) Char yield, however, can only be determined by a multiple-step parallel reaction model or experiments. Therefore, for the present purpose, the decomposition rate is described by a 1 st order Arrhenius reaction rate with a prescribed char yield ' γ ' = ρ ρ as: f w ρa = kρa t ρc = γ kρa t (3-1) (3-) 46
66 where, E k Ae RT =. Conservation of mass yields: ρ v ρs + m v = = (1 γ ) kρa (3-3) t t where, m ρv v is the volatile mass flux and 0. t Conservation of energy (neglecting the mass of the volatiles in the pores of the charring solid) yields: T t ( ρ C + ρ C ) + C m T = ( λ T) + Q( T) a w c c pv v (3-4) Where, QT ( ) = ( Cw γ Cc (1 γ) Cpv)( T T0) h 0 kρa is the heat generation term and h 0 is the heat of pyrolysis to decompose a unit mass of active material at the reference temperature T 0. In equation (3-4), the thermal conductivity λ of the semi-pyrolyzed solid is estimated by a linear combination of virgin solid and char as: = ρ + ρ (3-4) a c λ λw λc ρw ρf For 1-D slab, cylindrical, and spherical cases, equation (3-4) reduces to: T T T (3-5) t x x x x 1 n a w c c pv v n ( ρ C + ρ C ) + C m = x λ + Q( T) Where, the geometric parameter n = 0 represents a slab, n = 1 a cylinder, and n = a sphere. Also the volatile mass flux is determined as below: n x ξ m v( x, t) = ( 1 γ ) kρ 0 a dξ. (3-6) x 3.3. Infinite-rate kinetics (pyrolysis-front) model For the pyrolysis front model, the solid is divided into two zones, virgin solid and char, by an isothermal pyrolysis front. For simplicity, virgin solid is assumed to be impermeable to volatiles flow. Therefore, the volatiles convection term is ignored in the energy equation: 47
67 T α w n T = x ; 0 x x n < < p t t x x x () (3-7) λw Where, αw = is the virgin solid thermal diffusivity and x p () t is the location of ρ C w w the pyrolysis front. The energy equation for the char includes the thermal effect of volatiles convection. T Cpv m v T αc n T + = x ; x n p () t < x< L t C ρ x x x x c c λc Where, L is the thickness, αc = ρ C n f c (3-8) is the char thermal diffusivity and x p() t dxp m v( x, t) = ρw ( 1 γ) is the volatiles mass flux. The location of the x dt pyrolysis front is determined by the conditions: dt dt dxp () t λc λw = ht ( p) ρw and T = Tp (3-9) dx dx dt c w where, heat of pyrolysis at T p is found as, ( ) ( ) ht = T T ( C γc (1 γ) C )( T T) h (3-10) p P 0 w c pv Determination of the pyrolysis temperature Consider an instantaneous snapshot of the pyrolysis process. The inset in Figure 3.1 shows the variation in various quantities during pyrolysis and the pyrolysis front approximation. The location of the pyrolysis front is determined by the value of ' T ' and it may not lie in the middle of the pyrolysis zone, as shown. Presumably, the pyrolysis front is somewhere within this reaction zone, but we do not know this to be true a priori. The control volume ' x ' is chosen to be thick enough to include both the entire finiterate pyrolysis zone and the pyrolysis front. As the pyrolysis front passes through ' x ' initially consisting of the virgin material at time ' t ', it is converted to char at t+ t (assuming no shrinkage). To determine the energy-and-mass-balanced T p, we first note p 48
68 that mass is automatically balanced as the sample goes from ρ w to ρ f for constant γ. To equalize the energy consumed by the finite-rate kinetics and the pyrolysis-front models, it is noted that there is no difference in the energy content of the remaining char as long as the energy imparted to the volatiles is the same for the two models. The rate at which energy is acquired by the pyrolysis gases according to the finite-rate kinetics model is: ( 1 ) x + x (, ) ( (, ) ) γ kρ ξ t C T ξ t T dξ. Since there is no more x a pv o creation of volatiles outside, this becomes: ( 1 γ ) L ρ (, ) ( (, ) ) k 0 a x t Cpv T x t To dx. The corresponding expression for the pyrolysis-front model is: ( 1 ) x + δ x dξ p ρw γ δ ( ξ ξp( t) ) Cpv( T( ξ, t) To) dξ. By again extending the integration x dt over the entire spatial domain and using properties of the delta function this becomes: dxp () t ρw( 1 γ) Cpv( T p( t) To). Equating these expressions give the time-dependent dt pyrolysis temperature ' T () t ' which is not practically useful. Thus, integrating over the p entire time that the charring process occurs yields a physically and computationally useful mass and-energy-balanced pyrolysis temperature T p as: 1 tf L Tp T( x, t) k ρ 0 0 a dxdt ρ L = (3-11) w Thus, ' T ' is the decomposition rate weighted average temperature for the entire pyrolysis process. p 3.4 Results and discussion The models presented above were numerically solved and compared to determine the energy-and-mass-balanced pyrolysis temperature for various sample thicknesses, shapes and boundary conditions. Material properties used are listed in Table
69 Table 3.1 Material properties and kinetic constants Property Value Source Property Value Source 3 ρ w 676 kg/m (Atreya 1983) A s (Atreya 1983) 16.4 kg/m (Atreya 1983) h kj/kg estimated 3 ρc Cw 1.49 kj/kg K (Lee et al. 1976) λw W/m K (Atreya 1983) Cc kj/kg K (Atreya 1983) λc W/m K (Lee et al. 1976) C kj/kg K (Atreya 1983) R J / mol K pv E kj/mol (Atreya 1983) T K Effect of boundary conditions Figure 3. shows that T p changes with the boundary conditions. The finite-rate model-a and two pyrolysis-front models one using the mass-and-energy-balanced T p (model-b1) and the other using a constant T p (model-b), are compared. For model-b1, T p was found by mass and energy balance from model-a. For model-b, the same T ( = 678 K) is used for all cases, which was the mass-and-energy-balanced T p for the no heat loss condition. Thus for Figure 3., models B1 and B are the same. T p used in the pyrolysisfront models are listed in Table 3.. As the surface heat loss increases, T p for model-b1 decreases and the difference between the models B1 and B increases. Model-A predicts earlier surface pyrolysis and a gradual increase in the pyrolysis rate, whereas, models B1 and B show a sudden increase in the pyrolysis rate when the surface temperature reaches the pyrolysis temperature. This implies that pyrolysis temperature models are inadequate for predicting the ignition temperature. They predict that pyrolysis temperature is, in fact, the ignition temperature. In the final pyrolysis stage, models B1 and B show a sudden decrease in the mass loss rate when the pyrolysis front reaches the insulated boundary. Models B1 and B agree better with model-a for the no heat loss boundary condition than for the radiation and convection boundary condition because faster heating rate and higher material temperature results in a thinner pyrolysis zone. As seen in Figure 3.d, model-b1 shows good agreement for the overall mass loss p 50
70 rate with model-a for all boundary conditions and the pyrolysis is completed in the same amount of time, whereas model-b predicts 14% longer pyrolysis time in. Thus, it is important to use an appropriate T p in pyrolysis-front models for different boundary conditions, and enforcing energy and mass balance is an effective method of finding the correct T p. Table 3. Pyrolysis temperature; model B1: energy and mass balanced pyrolysis temperature, model B: constant pyrolysis temperature; units: K Rad & Conv Radiation Convection No loss Model B Model B Effect of geometry Pyrolysis of a 1-D cylinder and sphere was analyzed using the pyrolysis-front model-b1 and finite-rate model-a. Radiation and convection boundary conditions were used to represent realistic conditions. As shown in Figure 3.3, the pyrolysis-front model-b1 generated a smaller peak mass loss rate and predicted a slightly longer pyrolysis time than the finite-rate model-a. Unlike the slab cases, a sudden decrease of mass loss rate for the pyrolysis-front model-b1 does not occur because for curved geometries, pyrolysis front area decreases as the pyrolysis zone approaches the center. Also, since curved geometries have a larger surface to volume ratio than the slab, total pyrolysis time is much shorter. 51
71 A B1 B A B1 B dy/dt x 10 3 (s -1 ) dy/dt x 1000 (s -1 ) Time (s) (a) Time (s) (b) A B1 B A B1 B dy/dt x 10 3 (s -1 ) 1.0 dy/dt x 10 3 (s -1 ) Time (s) Time (s) (c) (d) 1 L dy dt, where, solid mass fraction: Y = ( ρ + ρ ) Figure 3. Mass loss rate / 0 a c dx ρwl for a 1 cm thick slab exposed to 3 W / cm external radiation. Comparison of finiterate model-a with pyrolysis-front models for different boundary conditions: Case(a): no heat loss, Case(b): convection heat loss, Case(c): radiation heat loss, Case(d): radiation and convection heat loss. 5
72 A B A B dy/dt x 10 3 (s -1 ) dy/dt x 1000 (s -1 ) Time (s) (a) Figure 3.3 Mass loss rate dy / external radiations. Y = ( ρ + ρ ) Y = + ρ mass-and-energy-balanced T = 670K. (b) dt for 1 cm radius samples exposed to 3 W / L 0 a c xdx ρwl for a cylinder & 3 L ( ρ ) 3 0 a ρc x dx wl for a sphere. Comparison of finite rate model-a with T p model-b1 for: (a) cylinder ( Tp = 656K) (b) sphere ( p ) Time (s) cm Effects of various parameters on the pyrolysis temperature The effect of various parameters was studied to determine their influence on the energyand-mass-balanced T p. These parameters were individually varied around their base values to represent the variation found in the literature, and energy-and-mass-balanced Tp was determined by comparing the pyrolysis-front model with the finite-rate model. For this investigation, 1-D slab geometry illustrated in Figure 3.1 was used with radiation and convection heat loss boundary conditions. The sample thickness was 1cm. Material properties, heat of pyrolysis and kinetic parameters for the base condition are listed in Table 3.1. Heat flux: Figure 3.4 shows that for fire-level heat fluxes of to 10 W / cm, T p increases with the heat flux from K to K. At higher heat fluxes, the solid heats faster resulting in a higher T p. The influence of the heat flux on T p is significant 53
73 and the curve seems to suggest that as the heat flux is increased even further some asymptotic value of the pyrolysis temperature may be reached Tp (K) Heat Flux (W/cm ) Figure 3.4 Effect of heat flux on energy and mass balanced T p Sample size: figure 3.5 shows the effect of sample thickness. A thickness range from 0.1 to cm was used. In this range, T p changed from 607.0K to 697.8K. Thinner materials lead to higher pyrolysis temperatures due to higher heating rates a condition similar to higher heat fluxes Tp (K) Thickness (m) Figure 3.5 Effect of thickness on energy and mass balanced T p 54
74 Pyrolysis heat: In the literature, heat of pyrolysis is frequently used as the heat at the decomposition temperature which may be obtained directly from DSC measurements. In this work, however, a thermodynamic definition of the heat of pyrolysis is used. It is the difference in the heat of formation of the reactants and the products at the reference temperature (98.15K). Thus, the heat of pyrolysis at the decomposition temperature becomes a function of the temperature due to the differences in the specific heats of the reactants and the products as described in Eq. (3-10). The literature values of the heat of pyrolysis at the decomposition temperature vary greatly from +750 kj/kg (endothermic) to -130 kj/kg (exothermic and often significantly more exothermic). For example, using DSC, Bilbao et al. measured the heat of pyrolysis at the decomposition temperature for +74 kj/kg and -353 kj/kg (Bilbao et al. 1996). Considering the literature values, an estimated heat of pyrolysis at the reference temperature is 48.3 kj/kg. Figure 3.6 shows the effect of variations around this value on h 0. It is seen that T p is inversely proportional to the endothermic heat of pyrolysis, h0 exothermic ( ( ) 0). The actual reaction becomes QT > for small h0 because the specific heat of reactants is larger than the products. For these exothermic cases ( h kj kg) 0 < 100 /, T p increases sharply. Tp (k) E+00.E+05 4.E+05 6.E+05 8.E+05 1.E+06 heat of pyrolysis h 0 (J/kg) Figure 3.6 Effect of heat of pyrolysis h0 on energy and mass balanced T p 55
75 Thermal properties: T p varies from 66.8K to 649.8K with char thermal conductivity ranging from 0.08 W / mk to 0.4 W / mk. (Figure 3.7b) Char conductivity affects T p because it controls the heat transfer from the surface to the pyrolysis zone. Higher char conductivity increases the heating rate in the pyrolysis zone and hence T p. By contrast, the effect of virgin material conductivity was found to be negligible. (Figure 3.7a) The effect of specific heat is interesting. A large specific heat of either the char or the virgin material is expected to decrease the heating rate and hence the pyrolysis temperature. This happens for char and there is a slight decrease (~5K) for a.5 fold increase in the char specific heat. However, the virgin solid shows an opposite trend. (Figure 3.8) There is a slight increase (~0K) for a twofold increase in the virgin solid specific heat. Looking further, we find that the apparent temperature-dependent heat generation Q( T) in equation (3-4) becomes less endothermic with large C w, whereas C c has an opposite sign. The combined effect is that T p is only weakly proportional to C w. The effect of density is similar. (Figure 3.9) Larger density will increase the thermal load reducing the heating rate and resulting in slower pyrolysis and lower pyrolysis temperatures. 800 / 3 kg m. Larger w makes ( ) T p drops from K to 68.8 K over a ρ w range of ρ also leads to a smaller char yield γ for constant 400 / 3 kg m to ρ f, which QT less endothermic unless Cpv > Cc, which is the case. Likewise, larger ρ f will reduce the heating rate and result in larger γ. For Cpv > Cc, larger γ makes the reaction less endothermic increasing the pyrolysis temperature. These conflicting effects render a weak dependence of T p on ρ f (~5K increase over an eight fold increase in the char density). The net result is that Tp is nearly independent of αw = λw / ρwcw and weakly dependent on α c with the primary dependence coming through λ c. Overall, the variations in the pyrolysis temperature with the thermal properties is small compared to other parameters. Char yield: the effect of variation in char yield, which varies with the heating rate, on the pyrolysis temperature was also found to be relatively small compared to other factors. 56
76 The pyrolysis temperature varied from 63K ~ 637K over the char yield range of 7.4% ~ 59.%. (Figure 3.9b) Tp (K) virgin material thermal conductivity (W/m K) (a) Tp (K) char thermal conductivity (W/m K) (b) Figure 3.7 Effect of thermal conductivity on energy and mass balanced pyrolysis temperature; (a) virgin material; (b) char 57
77 Tp (K) virgin material specific heat capacity (J/kg K) (a) Tp (K) char specific heat capacity (J/kg K) (b) Figure 3.8 Effect of specific heat capacity on energy and mass balanced pyrolysis temperature; (a) virgin material; (b) char 58
78 Tp (K) virgin material density (kg/m 3 ) 700 (a) Tp (K) char density (kg/m 3 ) (b) Figure 3.9 Effect of density on energy and mass balanced pyrolysis temperature; (a) virgin material; (b) char Kinetic parameters Compared to the physical parameters, kinetic parameters, i.e. activation energy (E) and pre-exponential constant (A), directly influence the pyrolysis rate. Hence, strong relationships exist between T p and the kinetic parameters, as shown in Figure 3.10 and 59
79 3.11. T p varies by more than 100K for representative literature ranges of E and A. T p increases linearly with the activation energy and decreases exponentially with increase in the pre-exponential constant Tp (K) activation energy (J/mol) Figure 3.10 Effect of the activation energy on mass-and-energy-balanced T p Tp (K) E E E E+10 pre-exponential constant (s -1 ) Figure 3.11 Effect of the pre-exponential constant on mass-and-energy-balanced T p. 60
80 3.4.5 Estimation of mass and energy balanced pyrolysis temperature In the above parametric study, mass-and-energy-balanced T p was obtained by comparing the pyrolysis-front model with the finite-rate model. Clearly, a more convenient method of estimating T p must be found. Thus, the above understanding is summarized into a non-dimensional correlation. To normalize equation (3-11) which, if solved, will yield the desired T p we choose a reference temperature T R near the expected T p and rewrite equation (3-11) as: T T p R 1 t φ f f = e T ( ξ, τ) k ρ dτ dξ (3-1) 0 0 t * * * a E 1 1 t x * T( ξτ, ) * R T TR * ρa where τ = ; ξ = ; T ( ξ, τ) = ; k = e ; ρa = t L T ρ f R w Here t f is not a priori known. It is chosen from the physical parameters such that t f t f to make the integral of order unity. The above parametric study shows that t h L ρ q which leads to the non-dimensional parameter f 0 w / E A h0 L ρw φ = ln in equation (3-1). The characteristic thickness L is defined RTR q as: volume/surface-area. Thus, L = thickness for a slab; = radius / for a cylinder; and = radius / 3 for a sphere. It is important to note that φ includes the effect of all the maor variables that influence the pyrolysis temperature and has the correct dependences. T p / T is plotted against φ in Figure 3.1. The symbols in Figure 3.1 represent the R energy and mass balanced T p determined in the above parametric study by individually varying each parameter for a slab, cylinder and sphere, as well as nine mixed cases listed in Table 3.3 for three different values of T = 600 K, 650 K, 700K. Thus given the basic R variables and the material properties, an appropriate energy and mass balanced pyrolysis temperature can be determined from Figure 3.1 with a standard deviation of 7.6 K and used in the pyrolysis front model without sacrificing accuracy of the model prediction. 61
81 1.3 E ; A ; L ; q ρ w ; h ; + mixed 1. red slab blue cylinder green sphere Tp Tp TR TR = φ Standard deviation = 7.6 K φ= A h0 L ρ w E ln RTR q Figure 3.1 Non-dimensional correlation of finite-rate and pyrolysis-front models for a wood slab, cylinder & sphere for estimating the mass-and-energy-balanced T p from primary variables namely: activation energy ( E ) ; pre-exponential factor ( A ) ; heat of pyrolysis ( h0 ) ; characteristic thickness ( L ) ; virgin solid density ( ρw ) ; external heat flux ( q ) ; and a random mix of these variables. Symbols represent these variables. They were systematically varied over a representative literature range for wood. The dotted line is the best-fit correlation. This correlation is insensitive to the value of the reference pyrolysis temperature (TR ). TR was varied from 600K to 700K. 6
82 Table 3.3 Description of mixed cases; Values different from the base case are printed in bold fonts heat flux ( W / cm ) L ( m ) h 0 (kj/kg) E (kj/mol) A ( 1/ s) case 0 (base) E+08 case E+08 case E+08 case E+08 case E+08 case E+09 case E+07 case E+07 case E+09 case E Comparison with experiments on wood As an application of the method for determining T p, beech wood cylinder pyrolysis was modeled and compared with experimental measurements of Di Blasi et al. (Di Blasi et al. 001) In the experiments, cylinders of cm radius and 4cm length were exposed to thermal radiation of 40 to 80 / kw m. Details of the experimental and simulation conditions are described in the literature (Di Blasi et al. 001; Galgano et al. 005). Figure 3.13 shows the experimental data and calculations using the finite-rate model-a and the pyrolysis-front model-b1. The pyrolysis temperatures obtained from the correlation are listed in the Figure 3.13 caption. Comparisons with both the change in the solid mass fraction (Y ) and its rate of change ( dy / dt ) are shown. It is seen that the pyrolysis-front model agrees well with the finite-rate model. Further, both models agree equally well with the measurements. The discrepancy in the final stages of pyrolysis is believed to be caused by the volatiles convection term because its effect becomes more significant in the final stage due to 63
83 thicker char layer and larger temperature difference between the pyrolysis zone and the surface. Another possibility is that cracking of the char matrix that may allow the volatiles to leave without complete heat transfer with the char, as assumed in the models. Char cracking may also change the radiation boundary condition. Given these complications, the overall prediction of the models is equally acceptable for both the pyrolysis-front and the finite-rate model. The mass loss rate ( dy / dt ) predictions also show good agreement with the measurements for high heat flux boundary conditions (69, 80 kw / m ) and poor agreement for low heat flux boundary conditions (49, 40 kw / m ) for both models. 3.5 Summary A method of determining the pyrolysis temperature by enforcing mass and energy balance is proposed and validated by comparison with the decomposition kinetics model and the experiments. This pyrolysis temperature has the form of pyrolysis rate weighted average temperature for the entire charring process. The pyrolysis-front model using the mass-and-energy-balanced T p shows good agreement with the finite-rate model for various geometries, boundary conditions and properties. A comparison between the massand-energy-balanced T p and a constant T p showed the importance of choosing the proper pyrolysis temperature to improve the accuracy of the pyrolysis-front models. Extensive numerical studies on various factors influencing pyrolysis have shown that heat flux, sample size, heat of pyrolysis and kinetic parameters are the most important for determining an appropriate pyrolysis temperature. Further, this parametric study was used to derive a non-dimensional correlation to determine an appropriate T p without solving the problem by finite-rate models. The proposed correlation was used to predict the results of wood cylinder pyrolysis experiments (Di Blasi et al. 001). An excellent agreement validates both the correlation and the mass-and-energy-balanced pyrolysis temperature concept. 64
84 1 0.8 A B1 experiment 0.6 Y kw/m time (s) (a) dy/dt x 10 3 (s -1 ) A B1 exp. 40 exp. 49 exp. 69 exp kw/m time (s) Figure 3.13 Comparison of (a) solid the solid mass fraction (Y ) and (b) its rate of change ( dy / dt ) between the models and the experimental measurements (Di Blasi et al. 001). Y mass fraction, dy / dt mass loss rate. Values of T p (b) obtained from the correlation were: 636K for 651K for 69 kw / m and 655K for 80 kw / m. 40 kw / m ; 641K for 49 / kw m ; 65
85 Chapter 4 Experimental and Theoretical Investigation of Wood Pyrolysis Thermal decomposition of wood spheres has been studied both experimentally and theoretically. A wood sphere of 5.4 mm diameter was pyrolyzed in the vertical tube furnace at a temperature range of 638K ~ 879K. Mass loss and temperatures of the sample were measured during pyrolysis. Center temperature measurements showed two distinct thermal behaviors which are endothermic and exothermic reactions in order. Numerical investigation of these endo-/exothermic reactions using pyrolysis models was conducted to determine thermal mechanisms of wood pyrolysis. From the numerical results, the following findings were made: (i) The contributions of secondary tar decomposition and lignin decomposition to the center temperature peak are small. (ii) Exothermic intermediate solid decomposition is responsible for the center temperature peak. (iii) The center temperature plateau is caused by the endothermic cellulose decomposition. Based on the experimental and numerical results, a novel wood pyrolysis model is proposed. The model consists of three endothermic parallel reactions producing tar, gas and intermediate solid, subsequent exothermic intermediate solid conversion to char and exothermic tar decomposition to char and gas. The proposed pyrolysis model showed good agreement with experiment. 4.1 Introduction Recently, biomass has increasingly gained interest as a source of renewable energy to cope with the problems of global warming and fossil fuel depletion. Extensive research 66
86 has been conducted to develop technologies to obtain liquid bio-fuel through the pyroysis of lignocellulosic material which is mainly represented by wood. In order to achieve industrial scale production of liquid bio-fuel from wood pyrolysis, it is necessary to optimize various parameters such as wood feed stock, reactor design and process conditions with the help of wood pyrolysis model. A number of models have been developed for this purpose. Most of them focus on pyrolysis rate represented by mass loss rate and products yield rather than thermal behavior, because temperature controlled thermally thin particle pyrolysis experiment results such as TGA have been used for the development of these models in many cases. Since pyrolysis rate and product yields largely depend on temperature, thermal characteristics of wood pyrolysis have importance for detailed wood pyrolysis modeling. Experimental observations have shown both endothermic and exothermic reactions appearing during wood pyrolysis. (Koufopanos et al. 1991; Bilbao et al. 1996; Milosavlevic et al. 1996; Di Blasi et al. 001; Strezov et al. 003) Nonetheless, a couple of models have dealt with endo-/exothermic reactions of wood pyrolysis. (Koufopanos et al. 1991; Bilbao et al. 1996). For most models, wood pyrolysis reaction is regarded as a simple endothermic or exothermic process represented by averaged heat of pyrolysis. The obective of this chapter is to provide better understanding of wood pyrolysis with emphasis on its thermal characteristics employing both experimental and theoretical methods and to develop a novel wood pyrolysis model useful for liquid bio-fuel research Problem description and literature review Wood pyrolysis is a complex process involving many aspects of physical and chemical processes such as heat transfer, pressure built up in the solid, decomposition kinetics, moisture drying, heat of pyrolysis, material properties, etc. During moisture free wood sphere pyrolysis experiments, a distinct center temperature plateau appears at around 610 ~ 640K owing to endothermic reaction. Immediately after the endothermic reaction, the center temperature rises rapidly and exceeds the surface temperature due to the exothermic reaction. These experimental observations indicate that, from a thermal perspective, wood pyrolysis is apparently the combination of endothermic and 67
87 exothermic reactions in successive order. Similar observations have been reported in several literatures. (Koufopanos et al. 1991; Bilbao et al. 1996; Milosavlevic et al. 1996; Di Blasi et al. 001; Strezov et al. 003). Nonetheless, the wood pyrolysis models currently available do not account for this phenomenon well. The heat of pyrolysis, h of lignocellulosic materials found in the literature varies largely, depending on the type of material, experimental setup and conditions. In general, h values are found in the range from 0 to +/-1500 kj/kg. (Koufopanos et al. 1991) Bilbao et al. measured h of Pinus Pinaster using DSC (differential scanning calorimeter) in order to use it as an input data for their wet wood pyrolysis model (Bilbao et al. 1996). Their results appeared for the first endothermic reaction stage of h= 74 kj / kg up to 60% conversion and the second exothermic reaction stage of h= 353 kj / kg during the remaining 40% reaction. They presumed that the first endothermic reaction corresponds to cellulose and hemicelluloses decomposition and lignin decomposition accounts for the second exothermic reaction. Di Blasi and colleagues reported that the inner core of the wood cylinder decomposition showed endo-/exothermic reactions. (Di Blasi et al. 001) The two reactions are more distinguished for the lower heating rate cases. For the higher heating rate cases, more portions of the endothermic and exothermic reactions seem to be overlapped. Consequently, a smaller temperature peak at the center is observed during the exothermic reaction. They explained the thermal behaviors by the endothermic decompositions of holocellulose and extractives and the exothermic lignin decomposition. Koufopanos et al. also measured the center temperature of a dry wood cylinder during pyrolysis and obtained similar results with Di Blasi et al s. (Koufopanos et al. 1991) However, they attributed the center temperature peak to the exothermic secondary reaction between volatiles and char. Strezov et al. measured h of cellulose, hemicellulose, lignin and four different sawdust biomass samples in an IR furnace. (Strezov et al. 003) They reported that all sawdust samples showed a similar thermal behavior pattern. Endothermic reaction begins at around 150 C 470 C and then it shifted to predominantly exothermic from 50 C with a single endothermic peak at 30 C to 360 C up to. In the experiment of maor biomass components, hemicellulose, cellulose and lignin decompositions began as endothermic up to 00 C. Hemicellulose and lignin decompositions showed two trough 68
88 exotherms, while cellulose decomposition showed a distinct endotherm at 330 C followed by an exotherm at 370 C. They attributed the exothermic behavior to the exothermic tar cracking (Gronli et al. 000) and the decomposition of dehydrocellulose. (Milosavlevic et al. 1995; Milosavlevic et al. 1996). 4. Experiment setup Wood sphere pyrolysis experiments were conducted to measure weight and temperature changes of the sample during the process of thermal decomposition using the apparatus developed by the author. The schematic diagrams and picture of the apparatus are shown in Figures 4.1 ~ 4.3. A moisture free maple sphere of 5.4 mm diameter was heated in the vertical tube furnace at a temperature range of 638 ~ 879 K. The wood sphere sample before and after pyrolysis is shown in Figure 4.4. The tube furnace (model: Carbolite GVA 1/300) consists of a mullite tube (length: 558mm, inner diameter: 106mm, outer diameter: 114 mm), two electric heaters (total heating length: 300 mm, maximum operating temperature: 100 C, total maximum power:,340 W), a temperature controller (model: Carbolite type 301), insulators and a stainless steel outer casing. Weight loss of the sample was measured by a scale (model: Sartorius 1409, maximum capacity: 610g, readability: 0.01g, measuring frequency:.5 Hz) positioned above the furnace. The weight data measured by the scale was transmitted to and recorded by a computer. Sample surface temperature was measured by a K-type thermocouple bead of ~ 0.mm diameter. The bead was made by welding thin thermocouple wires of OMEGA CHROMEGA CH-00 (0.051mm diameter) and ALOMEGA AL-00 (0.051mm diameter). The thermocouple bead was positioned in a tiny slit on the surface of the sample and fixed by glue, Elmer s Glue Multi-purpose. Temperatures inside the sample were measured at two locations, center ( r = 0) and middle ( r = r0 /) by two thin sheathed K-type thermocouple probes (OMEGA KMQXL-M05G-450, 0.5mm sheath diameter, 450mm length) inserted though holes drilled in the sample. The positioning of thermocouples in the wood sphere is shown in Figure
89 Furnace temperatures were monitored by eight thermocouples on the tube inside surface and two thermocouples on the top and bottom end insulating caps. The thermocouple wires used for the furnace temperature measurement were OMEGA CHROMEGA CH-005 (0.17mm diameter) & ALOMEGA AL-005 (0.17mm diameter). The thermocouple unctions were made by welding. The resulting thermocouple unction bead size (diameter) was 4~5 times larger than thermocouple wire diameter. The thermocouples were fixed on the furnace tube surface by cement. From temperature measurements at ten locations on the furnace, the effective furnace temperature T fn is calculated by the following equation. ( FT ) T =, i = 1~10 (4-1) fn i i where, F i is the view factor between the i th section area of furnace inside surface and the sample surface. (Siegel et al. 00) Gas temperature near the sample was measured by a thermocouple of the same type as the surface thermocouple. Electric voltage signals from all thermocouples were processed to temperature data by two NI-SCXI-111 (8 channels) boards installed in a PXI-1011 chassis. Temperature data was recorded at 1 Hz frequency. Argon at ambient temperature was used to purge the furnace at a flow rate of 0.1 g/s to displace oxygen and carry away volatiles. The flow rate was controlled by a sonic orifice (hole diameter: 0.5mm) and pressure gauge (Omega DPG , pressure range: kpa, readability:1 kpa). The argon mass flow rate was calibrated using a bubble flow meter for the absolute pressure range of 00 ~ 40 kpa. (Figure 4.6) The wood species of the sphere used in the experiment is maple. The wood spheres were dried at a temperature of 115 C for at least 3 hours before pyrolysis experiments to remove moisture. In order to avoid interference in the mass loss measurement due to the installation of temperature probes on the sample, mass measurements and temperature measurements were conducted separately for the same conditions. 70
90 scale exhaust computer insulating top cap insulation sample holder heating elements temperature measurement biomass sample heater controller thermocouple insulating bottom cap argon tank sonic orifice pressure gauge valve Figure 4.1 Schematic diagram of the experimental apparatus 71

91 Figure 4. Photography of the apparatus insulating end cap 90 mulite tube screen heating coi 300 insulation 90 argon tube insulating end cover Figure 4.3 Schematic diagram of the tube furnace 7
 before pyrolysis, (b) after")

92 (a) Figure 4.4 Wood sphere sample, (a) before pyrolysis, (b) after pyrolysis (b) middle center surface thermocouple d/ surface thermocouple probe d/4 d/4 d = 5.4 mm Figure 4.5 Thermocouples of wood sphere sample 73
93 argon flow rate (g/s) absolute pressure (Pa) Figure 4.6 Argon mass flow rate; sonic orifice hole diameter: 0.5 mm 4.3 Experimental result Wood sphere pyrolysis experiments were conducted at six different furnace temperatures ranging from 638K to 879K. Weight measuring experiments were conducted twice for all furnace temperature conditions. Temperature measurement tests were conducted from one to five times depending on furnace temperature conditions. The number of experiment repetition are listed in Table 4.1. Table 4.1 Number of experiment repetitions 638K 688K 736K 783K 831K 879K weight temperature Solid mass fraction (Y = sample weight / initial sample weight) is plotted in Figure 4.7. As the furnace temperature increases from 638K to 879K, the final char yield decreases from 31% to 17% of the initial sample mass, whereas mass loss rate increases. The wood sphere pyrolysis begins with low temperature hemicellulose decomposition showing mild 74
94 weight loss rate. As the temperature increases, cellulose starts to decompose and the solid mass fraction decreases rapidly. The maority of weight loss occurs during this period. After the completion of cellulose decomposition, the leftover lignin continues to decompose showing gradual weight loss rate again K 0.7 solid mass (Y) K 688K 736K K 879K time (s) Figure 4.7 Solid mass fraction measurements, temperature indicates the furnace temperature. Temperature measurements at the surface and the center of the sample are shown in Figure 4.8. The surface temperature rises quickly to a thermal equilibrium state between the sample surface and the furnace. Distinct center temperature plateaus appear in the temperature range of 610K ~ 640K, indicating an endothermic reaction. Immediately after completion of endothermic reaction, the center temperatures rise steeply owing to the subsequent exothermic reaction. During the exothermic reaction, the center temperatures exceed the surface temperature by 10 ~ 70K except for 879K case. Interestingly, the center temperature peaks appear more distinguished for low temperature cases; 688K and 736K. For high temperature cases, the center temperature peaks were small or even not observed for the 879K case. The endo- and exothermic 75
95 reactions seem to be overlapped for high temperature cases as Di Blasi et al. reported. As a result, the center temperature plateau and peak become less distinct and smaller than those of lower temperature cases surface 879K 831K 783K temperature (K) K 688K 638K center 400 Figure 4.8 Temperature measurements at center and surface Figure 4.9 shows sample temperatures at center, middle and surface locations for different furnace temperature conditions. Temperature plateau and peak of middle temperatures appear for low temperature cases, whereas they are not observed for high temperature cases. Temperature plateau and peak caused by endo-/exothermic reactions appear distinctly for the thick pyrolysis zone which occurs at the center location ( r = 0) for all temperatures. The pyrolysis zone becomes thinner at higher heating rates. Therefore, monotonic temperature rises were observed at the surface for all cases and at the middle ( r r / 0 ) time (s) = for high furnace temperature cases. 76
96 surface surface temperature(k) 500 middle center (a) temperature (K) middle center (b) time (s) time (s) surface 800 surface temperature (K) middle center (c) temperature (K) middle center (d) time (s) time (s) surface 800 surface temperature (K) middle center (e) temperature (K) middle center (f) time (s) Figure 4.9 Temperature measurements at center ( r = 0), middle ( r = r / 0 ) and surface ( r = r 0 ); (a) T fn = 638K, (b) T fn = 688K, (c) T fn = 736K, (d) T fn = 783K, (e) T fn = 831K, (f) T fn = 879K time (s) 77
97 Comparison between mass loss and temperature for the 688K case indicates that the temperature plateau corresponds to the second half of active mass loss period and gradual or negligible mass loss appears during the center temperature peak (Figure 4.10) This observation is consistent with the wood cylinder pyrolysis experiment of Koufopanos et al. shown in Figure (Koufopanos et al. 1991) It is generally accepted that endothermicity of biomass pyrolysis is caused by the forming process of tar or volatiles. Meanwhile, several mechanisms have been reported to be responsible for the exothermcity of biomass pyrolysis such as exothermic lignin decomposition, secondary tar cracking reaction, dehydrocellulose decomposition to gas and char. These exothermic reaction mechanisms will be discussed in the next part of this chapter surface temperature temperature(k) middle temperature center temperature solid mass solid mass (Y) time (s) Figure 4.10 Solid mass fraction and temperatures of wood sphere pyrolysis at 688K 0 78
98 (a) (b) Figure 4.11 Solid mass fraction of wood cylinders (d=0mm) and normalized temperature along the axis during isothermal pyrolysis of (a) 63K and (b) 773K. Solid line: model prediction; dashed line and solid squares: experimental. (Koufopanos et al. 1991) 4.4 Thermal mechanism of wood pyrolysis Various exothermic mechanisms were investigated numerically to determine their effects on thermal characteristicss of wood pyrolysis and the main cause of the center temperature peak using three different types of models Model description Kinetics model Model-1 Kinetics of model-1 is the same as the three-way parallel finite rate reaction model in chapter. The wood is simply decomposed to three maor products, i.e., tar, char and gas, by three competitive parallel 1 st orderr Arrhenius type reactions. As the kinetic parameters of model-1 were obtained from wood pyrolysis experiments, model-1 accounts for apparent wood pyrolysiss process well. For this reason, model-1 type wood pyrolysis models have been widely used. (Di Blasi 1996; Gronli et al. 000; Di Blasi et al. 001; Mousques et al. 001; Bryden et al. 00; Di Blasi 00; Park et al. 007) 79
99 wood k g k t k c gas tar char Reaction rate k is assumed to follow a 1 st order Arrhenius type reaction with activation energy E and pre-exponential constant A as below: E i RT i i a k = Ae ρ i = t, g, c (4-) where, ρ a is the density of virgin wood. Model- Wood consists of three maor components: hemicellulose (5~35%), cellulose (40~50%) and lignin (16~33%). Each component shows different characteristics during its thermal decomposition. Hemicellulose decomposition occurs at 00 C 60 C and produces acetic acid. Cellulose decomposes to levoglucosan and dehydrocellulose at 40 C 350 C. Lignin decomposes exothermally over a broad temperature range of 80 C 500 C and produces more char than the other two components (Mohan et al. 006). Model- regards wood as the mixture of three maor components. Mixture type wood pyrolysis models have been used for various applications. (Orfao et al. 1999; Svenson et al. 004; Boonmee et al. 005) This model is useful to analyze the effect of individual component decomposition. In model-, pyrolysis model and kinetic parameters of each component were chosen from the literature showing good agreement with the experiment of this work; hemicellulose (Varhegyi et al. 1989); cellulose (Capart et al. 004); lignin (Chan 1981). Kinetics and other model parameters are listed in Table 4. ~ 4.4. Unlike model-1, the wood in model- decomposes to two products; char and volatiles accounting for the sum of gas and tar, because a three-product model is not available for hemicellulose and lignin. Also, the char yield γ of model- is predetermined. The mass fractions among hemicelluloses (30%), cellulose (43.6% ) and lignin (6.4%) are taken from literature. (Sostrom 1981) The portion of extractives is included in hemicelluloses. 80
100 Hemicellulose Hemicellulose decomposition occurs in two steps. (Varhegyi et al. 1989) First, hemicellulose decomposes to volatiles and intermediate solid. Second, the intermediate solid decomposes to volatiles and char in the subsequent reaction. hemicellulose k 1 (1- γ 1 ) volatiles γ 1 intermediate solid + (1- γ ) volatiles k + γ char Table 4. Model- hemicellulose pyrolysis model parameters Reaction 1 i i 1 ( ) A s 7.94 x x 10 7 ( / ) E J mol 195,000 96,000 γ Cellulose Cellulose is modeled as the mixture of two components, cellulose-a and cellulose-b which are decomposed by different reactions which have more complicated form than 1 st order Arrhenius type reaction. (Capart et al. 004) Initial mass fractions of them are predetermined as ρcla,0 = f Aρcl,0, ρclb,0 = fbρcl,0. h s of the two reactions are assumed to be the same. cellulose A cellulose B A B (1- γ A ) volatiles + γ A char (1- γ B ) volatiles + γ B char Ei dω i m RT ni i = Ae i ωi ( ωi) (4-3) dt ρcla ρclb where, ωa =, ωb =. ρ ρ clb,0 clb,0 81
101 Table 4.3 Model- cellulose pyrolysis model parameters Reaction A B i i 1 ( ) A s 7.94 x x 10 7 ( / ) E J mol 0,650 55,000 f γ n 1 m Lignin Lignin decomposes to volatiles and char by single Arrhenius type reaction. (Chan 1981) lignin k L (1 - γ L ) volatiles + γ L char Table 4.4 Model- lignin pyrolysis model parameters Reaction L i i 1 ( ) A s 5.09 x 10 5 ( / ) E J mol 95,000 γ Model-3 Model-3 is an extended version of the Kilzer-Broido cellulose pyrolysis model to wood pyrolysis.(kilzer et al. 1965) Originally, the Kilzer-Broido model was postulated for three reactions of cellulose decomposition; the slightly endothermic reaction from cellulose to dehydrocellulose, the strong endothermic tar (mainly levoglucosan) formation from cellulose and the exothermic decomposition of dehydrocellulose to char and gas. Milosavlevic and colleagues reported that the enthalpy of cellulose pyrolysis becomes more endothermic as char yield decreases, based on their experiment and the literature. (Mok et al. 1983; Milosavlevic et al. 1996) Their experimental results support 8
102 the exothermic char formation mechanism of the Kilzer-Broido model. Wood pyrolysis experiments in this work showed similar thermal behavior with the cellulose pyrolysis experiment by Milosavlevic et al. One reason is that approximately half of the wood by mass consists of cellulose. Hence, it is plausible to apply the Kilzer-Broido type model to wood pyrolysis. In model-3, wood is pyrolyzed through two paths similar to Kilzer- Broido model. One is an endothermic tar producing reaction and the other is an intermediate solid producing reaction which is assumed as an isothermal process. The intermediate solid, corresponding to dehydrocellulose in the Kilzer-Broido model, is decomposed into char and gas by exothermic reaction. Each reaction rate is assumed to follow a 1 st order Arrhenius reaction. The activation energy of reaction 1 is taken from the tar producing reaction of model-1. wood k 1 tar k 3 k intermediate solid γ char + (1 - γ) gas Where, char yield of reaction 3 and gas is estimated as γ = Mass conservation Mass conservation of each component is governed by diffusive and convective mass flux in gaseous phase and production or destruction owing to decomposition reaction. It is assumed that volume shrinkage does not occur. Material properties and reaction parameters used in equations are listed in Table ) Solid phase components The mass change per unit volume of each solid phase component depends on pyrolysis reactions. 83
103 Model-1 ρ t a Virgin wood: = S = ( k + k + k ) Char: ρc t = S = k ρ c c a ρ a t g c a (4-4) (4-5) Model- ρhcl Hemicellulose: = Shcl = k1ρ t ρis Intermediate solid: = Sis = γ1k1ρhcl kρis t ρcla dωa Cellulose: = SclA = ρcla,0 t dt where, ρcl = ρcla + ρclb ρl Lignin: = Sl = klρl t hcl ρ t clb, = SclB = ρclb,0 ρc Char: = S = γ kρ + γ S + γ S + γ S t c is A cla B clb L l dωb dt (4-6) (4-7) (4-8) (4-9) (4-10) Model-3 ρ t a Virgin wood: = S = ( k + k ) a 1 ρis Intermediate solid: = Sis = kρa k3ρis t ρc Char: = Sc = γ k3ρis t ρ a (4-11) (4-1) (4-13) ) Gaseous phase components Mass change per unit volume of each gaseous phase component can be expressed as the sum of mass flux through the control volume boundaries and mass generation in the volume due to pyrolysis reaction. The mass flux of each gaseous species consists of convective flux due to gas flow and diffusive flux due to diffusion among the gaseous 84
104 species. However, as the effect of the diffusion is very small compared to the convection, only the convective mass flux is considered here. Model-1 ( ) ερt 1 Tar: + ( rvρt) = St = ktρa t r r ( ερg ) 1 Gas: + ( rvρg) = Sg = kgρa t r r where, ε is porosity calculated by ε 1 s ( 1 ε ) w (4-14) (4-15) ρ = w. ρ s is total solid mass per unit ρ volume, ε w is initial wood porosity, ε = 0.4. (Galgano et al. 003) w Model- Volatiles: ( ερ ) v 1 + ( rvρv) = Sv t r r = γ k ρ + γ k ρ + γ k ρ + γ k ρ + γ k ρ ( 1 ) ( 1 ) ( 1 ) ( 1 ) ( 1 ) 1 1 hcl is A A cla B B clb L L l (4-16) Model-3 ( ) ερt 1 Tar: + ( rvρt) = St = k1ρ a t r r ( ερg ) 1 Gas: + ( rvρg) = Sg = ( 1 γ) k3ρis t r r (4-17) (4-18) 3) Pressure equation As the wood and char structure is composed of numerous tiny pores, the internal gaseous components flow is dominated by the viscous force. By neglecting inertial force, Navier- Stokes equations are reduced to the balance between pressure gradient and viscous force. Therefore, the gaseous components flow velocity V is calculated by Darcy s law. B P V = (4-19) µ r 85
105 where, µ is viscosity. Permeability B of partially pyrolyzed solid is linearly interpolated between char and virgin wood. ( η ) B= B + B (4-0) 1 w η c ρa ρa + ρis where, the degree of pyrolysis is η = 1 for model-1 and η = 1 for model- ρ ρ and model-3. Pressure of model-1 and model-3 is the sum of the partial pressures of tar and gas. t g w P = P + P (4-1) Gaseous components are assumed to behave as ideal gas. ρrt P = (4-) M where, M and R are molecular weight and universal gas constant. Combining equations (4-14) - (4-18) and (4-) gives pressure equations. w Model-1 & -3 Tar Partial Pressure: ε Pt 1 BPt P R = r + t T r r µ T r Mt S t (4-3) Gas Partial Pressure: ε Pg 1 BP g P R = r + t T r r µ T r M g S g (4-4) Model- Pressure: ε P 1 BP P R = r + t T r r µ T r M v S v (4-5) The pressure boundary condition at the surface is set to ambient pressure. PS = P (4-6) 0 86
106 Energy conservation The conservation of energy is governed by the change of energy stored in a volume, thermal conduction, convective flow of gaseous phase components and heat generation by pyrolysis reaction. In order to setup the energy equation, local thermal equilibrium between gaseous phase and solid phase components is assumed. The energy equations of three models are listed as follows. Model-1 C ρ + C ρ + εc ρ + εc ρ T T 1 C C V T ρ ρ r λ T + + = Q + t r r r r (4-7) ( w a c c pg g pt t ) ( pg g pt t ) where, heat generation is calculated as Q ( St ht Sg hg Sc hc) = + + and h is the heat of pyrolysis at decomposition temperature. As a result, unlike ht ( ) in chapter and 3, h in this chapter is not a function of temperature. Model- 1 w( hcl is cl l) T T T T C ρ + ρ + ρ + ρ + Ccρc + εcpvρv + CpvρvV = r λ Q + t r r r r Q= S + S h + S + S h + S h. where, ( ) ( ) hcl is hcl cla clb cl l l (4-8) Model-3 C ρ + C ρ + C ρ + εc ρ + εc ρ T T 1 C C V T ρ ρ r λ T + + = Q + t r r r r (4-9) ( w a w is c c pt t pg g) ( pt t pg g) where, ( ) Q = k h + k h ρ k ρ h 1 1 a 3 is 3 Specific heat capacity for solid components C and constant pressure specific heat capacity C p for gaseous components are functions of temperature. Effective thermal conductivity λ is calculated as the sum of solid and volatiles conductivity and radiation heat transfer through the pore. (Di Blasi 1996) 87
107 3 13.5σ Td λ = ( 1 η) λw + ηλc + ελv + (4-30) e where, σ, e and d are the Stefan-Boltzmann constant, emissivity and pore size. Since heat is conducted in all three directions (radial, tangential and grain) in the sample, the thermal conductivity used for the 1-D model is found as the average value of three directions. λ = ( λ, + λ, + λ, )/3 (4-31) w w radial w tangential w grain λ = ( λ + λ + λ )/3 (4-3) c c, radial c, tangential c, grain Thermal energy flux through the wood sphere boundary surface is determined by external convective and radiative heat transfer conditions. T = ht T + e T T r 4 4 ( g ) σ S ( f ) ( r = r ) (4-33) ; 0 Surface emissivity is calculated as: (Galgano et al. 003) es = ew TS < 450K TS 450 es = ew + ( ec ew) 450 K TS 550K es = ec 550 K < T S (4-34) The surface heat transfer coefficient is estimated as h= 0 ( W / m K) based on the temperatures of the sample surface, gas near the sample and the furnace. 88
108 Table 4.5 Material properties and kinetics parameters property value source 3 ρw 630 ( kg / m ) measured C T ( J / kgk) (Gronli et al. 000) w -4 Cc pv T T ( J / kgk) (Gronli et al. 000) C pt T T ( J / kgk) (Gronli et al. 000) C pg T T ( J / kgk) (Gronli et al. 000) C 0.85c c estimated T d ( 1 η) η ( m) G + (Gronli et al. 000) e 1 (Chan et al. 1985) 8 4 σ ( W/ m K ) λ wradial, ( / ) λ wgrain, 0.55 ( / ) λ w, tangential 0.55 ( / ) λ c, radial ( / ) λ cgrain, ( / ) λ c, tangential ( / ) 16 Bw m 13 Bc m W mk (Lee et al. 1976) W mk (Lee et al. 1976) W mk estimated W mk (Lee et al. 1976) W mk (Lee et al. 1976) W mk estimated 5 10 ( ) (Di Blasi 000) 1 10 ( ) (Di Blasi 000) e 0.7 (Gronli et al. 000) w e 0.9 (Gronli et al. 000) c h µ M g M t M v 0 ( W / m K) ( kg / m s) estimated (Kansa et al. 1977) kg / mol (Gronli et al. 000) 0.11 kg / mol (Gronli et al. 000) kg / mol (Fredlund 1988) R J / mol K 89
109 4.4. Results Heat of pyrolysis and pyrolysis rate Solid mass fraction and center temperature of model-1 are plotted in Figure 4.1. h= 64 kj / kg case shows good agreement with experiment for both mass loss and center temperature. In order to investigate the effect of h variation, h= 136 kj / kg and 64 kj / kg cases are compared. In addition, h= 40 kj / kg case is also compared because h 40 kj / kg has been used several times in the literature: 430 kj/kg (Chan et al. 1985) and 418 kj/kg (Di Blasi 1993). The kinetics parameters used in model-1 are listed in Table 4.6. (Di Blasi et al. 001). h of all three reactions is assumed to be the same, as h= ht = hg = hc. The slightly endothermic h= 64 kj / kg case agrees best among the four cases. More endothermic h= 64 kj / kg and 40 kj / kg cases show slower mass loss and longer center temperature plateaus below 600K. The exothermic h= 136 kj / kg case shows rapid mass loss and sharp center temperature peak without showing a temperature plateau. Time to 60% mass loss is compared in Table 4.7. A 00 kj/kg increase of h from the base case ( h= 64 kj / kg) causes 30.7% longer time to 60% mass loss and a 00 kj/kg decrease of h from the reference case results in 5.5% shorter time. The range of h used for pyrolysis modeling found in the literature is 0 ~ 430 kj/kg which is considerably wide. As shown above, h has significant influence on pyrolysis rate. Therefore, the choice of appropriate heat of pyrolysis is important in a wood pyrolysis model. Table 4.6 Model-1 kinetics parameters Reaction c t g i 1 ( ) A s 3.7 x x x 10 9 ( / ) E J mol 111, ,000 15,700 i 90
110 solid mass (Y) temperature (K) time (s) (a) time (s) Figure 4.1 Solid mass fraction (a) and center temperature (b) of model-1 (solid line) with various Δh; -136, 64, 64 and 40 kj/kg and experiment (dotted line). Furnace temperature: 688K (b) ( / ) Table 4.7 Time to 60% mass loss (Y = 0.6) h kj kg experiment time (s) difference* (%) * Time difference from h= 64 kj / kg case Exothermic reactions Exothermic reaction mechanisms presumed to cause exothermic thermal behavior of lignocellulosic material pyrolysis are the exothermic reactions of tar cracking, lignin pyrolysis and dehydrocellulose decomposition. Their effects were investigated to determine the mechanism of exothermic thermal behavior during wood pyrolysis. Secondary tar decomposition The exothermic effect of secondary tar decomposition has been investigated by the comparison between without secondary tar decomposition (case A) and with secondary tar decomposition (case B). This comparison was made based on model-1 with endothermic h= 64 kj / kg for primary virgin wood decomposition. h of secondary 91
111 tar decomposition found in the literature varies in the range of -0 ~ -50 kj/kg. (Liden et al. 1988; Koufopanos et al. 1991; Gronli et al. 000). Here, h= 4 kj / kg was chosen for secondary tar decomposition of case B. The kinetics parameters of secondary tar decomposition (Liden et al. 1988; Di Blasi 1993) are listed in Table 4.8. wood k g k t gas tar wood k g k t gas tar k g k c char k c char k c (A) Case A: primary decompositions (B) Case B: primary and secondary decompositions By adding the secondary tar decomposition mechanism, equations (4-5), (4-14) and (4-15) are modified for case B as shown below: ρc t = S = k ρ + k ( ερ ) ρ c c a c t 1 + ρ = = ρ + ρ t t r r ( rv ) S k ( k k ) t t t a c g t (4-35) (4-36) ( ερg ) 1 + ( rvρg) = Sg = kgρa + kgρt t r r (4-37) Also Q of equation (4-7) is modified as ( ) ρ ( ) Q = k h + k h + k h k h + k h ρ. t t g g c c a c c g g t Table 4.8 Kinetics parameters of secondary tar decomposition for case B Reaction c g i i 1 ( ) A s 1.00 x x 10 6 ( / ) E J mol 108, ,000 Temperatures at the center, middle and surface for case A and B are compared in Figure The temperature difference between case A and case B is hardly noticed, which 9
112 implies that the exothermicity of the secondary tar decomposition is not significant enough to cause a center temperature peak exceeding the surface temperature as observed in the experiment. Therefore, the center temperature peak in the experiment is caused by exothermic reactions other than secondary tar decomposition surface temperature(k) middle center case A case B time (s) Figure 4.13 Temperature comparison between case A and case B of model-1 at center, middle and surface; furnace temperature: 831K Lignin decomposition The exothermic lignin decomposition has been presumed to be responsible for the exothermic thermal behavior in the final stage of wood pyrolysis in several cases found in the literature (Bilbao et al. 1996). The effect of exothermic lignin decomposition has been studied using model- which consists of hemicellulose, cellulose and lignin pyrolysis models. The kinetics parameters of each model came from the literature as described in the previous section. On the other hand, the heat of pyrolysis, h of hemicellulose, cellulose and lignin decompositions were found as 100, 80 and -350 kj/kg by fitting with the experimental result. Figure 4.14 shows solid mass fraction comparison between the experiment and model- for different temperature conditions. Since pre-determined fixed char yield ratios are used for all three components pyrolysis models, the final char 93
113 of model- does not account for the final char yield variation for different temperature conditions. As a result, except for the 688K case, the final char of model- is considerably different from the experiment. Model- predicts faster solid mass loss rate in the beginning stage due to the hemicellulose pyrolysis model. Slow lignin decomposition results in a gradual slope in the final stage. In general, model- shows poor agreement of mass loss with the experiment. This discrepancy is believed to come from the following reasons. Pure cellulose, hemicellulose and lignin used to determine the kinetics model in literature do not have the same chemical structure with those existing in wood. The interaction among components would affect the individual pyrolysis of each component, which is not considered in model-. However, the model- results depict the characteristics of experimental solid mass loss in the beginning and the final stage better than model-1 owing to separate modeling of hemicellulose, cellulose and lignin solid mass (Y) K 879K 736K 688K 638K K time (s) Figure 4.14 Solid mass fraction comparison between model- and experiment (solid line: model-, dotted line: experiment) 94
114 K 831K 783K temperature(k) K 688K 638K time (s) Figure 4.15 Center temperature comparison between model- and experiment (solid line: model-, dotted line: experiment) Figure 4.15 shows center temperature comparison between model- and the experiment. The center ( r = 0 ) temperature plateau of model- agrees well with the experiment for both temperature and time duration. Individual modeling of each component, especially cellulose decomposition which is strongly endothermic, enables good prediction of the center temperature plateau. On the other hand, the temperature rise after the plateau is gradual and the magnitude of the center temperature peak exceeding surface temperature is smaller compared with the experiment. Decomposition rates of three components at the center of the sphere are plotted in Figure Hemicellulose and cellulose decompositions appear as two distinct peaks in order. The cellulose decomposition peak corresponds to the center temperature plateau in Figure The result indicates the first half and second half of the main mass loss period corresponds to hemicellulose decomposition and cellulose decomposition. In the experiment, the center temperature plateau corresponds to the second half of main mass loss period. Therefore, the center temperature plateau is caused by endothermic cellulose decomposition and hemicelluloses decomposition is less endothermic than that of cellulose. 95
115 Lignin decomposition begins earlier and lasts longer than the other two components as it occurs over a wide temperature range. Since the lignin decomposition rate is less sensitive to temperature than other components, more lignin is left after the completion of endothermic cellulose decomposition for the 831K case than the 688K case. As a result, more exothermic effect appears for 831K than 688K, which is not consistent with the experiment which showed a more distinct center temperature peak for 688K. The center temperature rise after temperature plateau is gradual, owing to steady exothermic lignin decomposition. Since the center temperature rise pattern of model- is different from that of the experiment, it is concluded that the exothermic behavior of the experiment is not mainly caused by exothermic lignin decomposition. decomposition rate (kg/m 3 s) hemicellulose cellulose lignin decomposition rate (kg/m 3 s) hemicellulose cellulose lignin time (s) (a) time (s) Figure 4.16 Decomposition rate of three components at the center of the wood sphere; Furnace temperature (a) 688K, (b) 83K, Model- (b) Intermediate solid decomposition Regarding cellulose pyrolysis, exothermic reaction after the endothermic reaction has been reported, with the exothermic reaction being attributed to the exothermic decomposition of dehydrocellulose to char and gas by several researchers. (Milosavlevic et al. 1996; Strezov et al. 003) Since cellulose comprises as approximately half of the wood mass, it is plausible to assume wood pyrolysis process as similar to cellulose pyrolysis. The effect of the exothermic intermediate solid (corresponding to dehydrocellulose in cellulose pyrolysis) decomposition to char and gas was studied using 96
116 model-3 to determine its role in the exothermic behavior of the wood pyrolysis. Kinetic parameters used in model-3 are listed in Table 4.9. Activation energy E 1 is taken from the tar producing reaction of model-1. Other kinetic parameters and h are found by fitting with the experimental result. Table 4.9 Model-3 kinetic parameters and h Reaction 1 3 i i 1 ( ) A s.00 x x x ( / ) ( / ) E J mol 148, , ,000 h kj kg solid mass (Y) K 879K 688K 736K 638K K time (s) Figure 4.17 Solid mass fraction comparison between model-3 and experiment (solid line: model, dotted line: experiment) Solid mass fraction of model-3 shows good agreement with the experiment in Figure 4.17, except for the 638K case. The center temperature peak of model-3 agrees well with the experiment (Figure 4.18). In addition, model-3 shows a decrease of the temperature peak magnitude with higher temperature as shown in the experiment. 97
117 The idea of the exothermic secondary decomposition of primary solid product is plausible for the following reasons. (i) The center temperature peak appears after the active mass loss process and only small or negligible mass loss occurs during the exothermic reaction period. This indicates that the reactant of the exothermic reaction is in solid phase and the product of exothermic reaction is also mainly in solid phase, i.e. char. (ii) Exothermicity increases with the increase of char yield. (iii) The endothermic reaction and the exothermic reaction occur in consecutive order K 831K 783K temperature(k) K 688K 638K time (s) Figure 4.18 Center temperature comparison between model-3 and experiment (solid line: model, dotted line: experiment) From the relationship between char yield and furnace temperature, it is indicated that the char producing process prefers lower temperature, whereas volatiles generation is promoted at higher temperature. Thus, the char producing reaction begins earlier than the volatiles generation. However, the exothermic reaction related to char occurs in the final stage of pyrolysis. Therefore, the exothermic reaction cannot be the primary char forming reaction which is competing with the volatiles producing reaction from virgin wood. Therefore, it is concluded that the char forming process satisfying the experimental 98
118 observations should be two step reactions whereby an intermediate solid is introduced. The first reaction is virgin solid to intermediate solid conversion which is competing with volatiles forming reaction and prefers lower temperature. This non-exothermic reaction determines char yield. The second reaction is the exothermic conversion from intermediate solid to char or both char and gas as in model-3. On the other hand, the center temperature plateau of model-3 is not as distinct as that of model-, because wood is modeled as a single material as in model-1. In general, satisfactory model prediction for both thermal behavior and mass loss was achieved by model-3. Koufopanos and colleagues developed a wood pyrolysis model which has two competing endothermic primary reactions generating first products and a secondary exothermic reaction converting first char and volatiles to second char and volatiles. In Figure 4.11, their model showed good agreement of center temperature peak with wood cylinder experiment owing to endothermic primary reactions and exothermic secondary reaction mechanism which is similar to model-3. (Koufopanos et al. 1991) Biomass k 1 k (Volatile + Gases) 1 + (Char) 1 k3 (Volatile + Gases) + (Char) From the results of model-3 and the model of Koufopanos et al., it was shown that the exothermicity appearing after the endothermic reaction of wood pyrolysis is attributed to exothermic intermediate solid decomposition to char and gas, corresponding to the reaction of first char to second char in Koufopanos s model. 4.5 Modeling of endo-/exothermic wood pyrolysis A novel wood pyrolysis model was proposed based on the experimental and theoretical results of this work. This model should account for endo-/exothermic thermal behavior 99
119 and solid mass loss measured in the experiment. In addition, the model should predict products yield well for the application of liquid bio-fuel research. It has been known that gas yield increases at higher temperature, which is the opposite to char yield. In model-3, since both char and gas are produced from the intermediate solid at a fixed ratio between them, its gas yield is not realistic. Thus, it is more plausible that the gas producing reaction is one of the primary competing reactions rather than the secondary decomposition of the intermediate solid. The proposed wood pyrolysis model has a similar form as model-1 except for two-step char producing reactions which is similar to model-3. Primary (or first step) reactions are endothermic and second step reaction producing char is exothermic. Though a mixture type model (model-) can depict thermal characteristics of wood pyrolysis better than a single reactant model, especially for solid mass loss at the beginning and final stages and center temperature plateau, it is not considered in the proposed model due to lack of its quantitative accuracy. Model-A Model-A is a modified form of model-1 which employs a two-step char producing reaction similar to model-3. However, unlike model-3, intermediate solid is converted into char only and gas is produced directly from virgin wood by a primary reaction. Kinetics parameters of primary reactions t, g and is come from model-1 except for A is which is adusted by experimental mass loss data from this work. Kinetic parameters of reaction c come from reaction 3 of model-3. Kinetic parameters of model-a are listed in Table k t tar wood k g gas k is intermediate solid k c char By introducing intermediate solid to char producing reaction, mass equations of virgin wood, intermediate solid, char and gas are modified as shown below: 100
120 ρ t a Virgin wood: = S = ( k + k + k ) ρis Intermediate solid : t Char: ρc t = S = k ρ c c is ρ a t g is a = S = k ρ k ρ is is a c is (4-37) (4-38) (4-39) The tar and gas partial pressure equations are the same as those of model-1. Energy equation is the same as that of model-3. However, Q of equation (4-9) is modified as: ( ) Q = k h + k h + k h ρ k ρ h t t g g is is a c is c Table 4.10 Model-A kinetic parameters and h Reaction t g is c i i 1 ( ) A s 1.08 x x x x ( / ) E J mol 148,000 15, , ,000 i ( / ) h kj kg The primary reactions t, g and is have the same endothermic heat of pyrolysis, h = 80 kj / kg and the second step exothermic reaction c has h of 300 kj / kg. These values were determined for the best match with the experiment. Solid mass fraction is compared between model-a and the experiment in Figure In general, good agreement of solid mass loss was achieved between model-a and the experiment except for the 638K case. 736K and higher temperature cases show better agreement with the experiment than lower temperature cases. However, the solid mass loss characteristics of the beginning and the final stages shown in the experiment are not predicted well in model-a. Solid mass of model-a remains constant until the initial mass loss begins, whereas slight solid mass loss was observed from the beginning of the experiment. In the final stage of wood sphere pyrolysis, model-a shows obvious very distinct end of solid mass loss, whereas gradual solid mass loss lasted for a while in the experiment. This discrepancy is attributed to the limitation of the 1 st order Arrhenius type kinetics scheme focusing on the main portion of the pyrolysis. (Di Blasi et al. 001) 101
121 Consequently, the kinetics scheme better represents the cellulose decomposition which is the main part of the wood pyrolysis. On the other hand, low temperature hemicellulose decomposition in the beginning stage and high temperature lignin decomposition in the final stage are not taken into account well in model-a. Large solid mass discrepancy between model-a and 638K case of the experiment is attributed to incapability of model- A for low temperature pyrolysis. Final product fractions of model-a are listed in Table As temperature increases, more tar and gas and less char are produced. Table 4.11 Final product fractions of model-a 638K 688K 736K 783K 831K 879K Tar Char Gas Center temperature comparison between model-a and experiment shows good agreement in Figure 4.0. The center temperature peaks are well predicted by employing the twostep char producing reactions. The center temperature plateaus of model-a are not as distinct as shown in the experiment. The approximation of single wood reactant lead to the gradual center temperature change during endothermic pyrolysis rather than distinct plateau shape observed during the experiment. 10
122 solid mass (Y) K 879K 688K 736K 638K K time (s) Figure 4.19 Solid mass fraction comparison among model-a, model-b and experiment (circle: model-a, solid line: model-b, dotted line: experiment) K 831K 783K temperature (K) K 688K 638K time (s) Figure 4.0 Center temperature comparison among model-a, model-b and experiment (circle: model-a, solid line: model-b, dotted line: experiment) 103
123 Model-B Model-B is a modified form of model-a which adda secondary tar decomposition reactions to char and gas to account for tar cracking. As shown in the previous section, secondary tar decomposition has little effect on the thermal behavior of the wood pyrolysis; however, it has considerable influence on products yield, especially for tar and gas yields at high temperature. The kinetic parameters and h of tar cracking reactions of model-b are the same as those used in model-1 case (B). They are listed in Table 4.1. Since the reaction rate of g is 43 times larger than that of c, secondary tar cracking produces mainly gas and little amount of char. As a result, secondary tar cracking is important in determining the ratio between tar and gas and has little effect on char yield. k g gas wood k t tar k g k c k is intermediate solid k c char The energy equation is the same as that of model-a. By two-step char producing reaction, Q of equation (4-9) is modified as: ( ) ( ) Q = k h + k h + k h ρ k ρ h k h + k h ρ t t g g is is a c is c c c g g t Table 4.1 Model-B kinetic parameters and h Reaction t g is c c g i i 1 ( ) A s 1.08 x x x x x x 10 6 ( / ) ( / ) E J mol 148,000 15, , , , ,000 h kj kg i Table 4.13 Final product fractions of model-b 638K 688K 736K 783K 831K 879K Tar Char Gas
124 Solid mass fraction and center temperature of model-b are compared with model-a and the experiment in Figure 4.19 and 4.0. Model-A and model-b show nearly the same results for both solid mass fraction and center temperature. Thus, the secondary tar decomposition has little effect on temperature and solid mass loss of wood pyrolysis. Final product fractions of model-b are listed in Table Final product fractions of model A and B are also plotted in Figure 4.1. For furnace temperatures higher than 750K, secondary tar decomposition influences tar and gas yields. Tar yield of model-b decreases for temperature higher than 800K due to secondary tar decomposition. For the same reason, the gas yield of model-b increases at high temperatures. Models A and B show nearly the same char yields which indicates the negligible effect of secondary tar decomposition reaction on the char yield Tar Final Products Fraction Char Model-A Model-B 0.1 Gas Furnace Temperature (K) Figure 4.1 Final product fractions of model A and B 105
125 4.6 Summary Pyrolysis of a wood sphere has been studied both experimentally and theoretically. Temperature measurements showed two distinct thermal behaviors during wood pyrolysis. First, endothermic reaction causes a center temperature plateau. During this period, a large amount of solid mass loss occurs. Second, a steep temperature rise and a center temperature peak exceeding surface temperature occur after the center temperature plateau. A small or negligible amount of solid mass loss occurs during this exothermic reaction period. Therefore, the endothermic period corresponds to primary reactions of active volatiles generation, especially cellulose decomposition, and the exothermic period corresponds to intermediate solid conversion to final char. Numerical study of various exothermic mechanisms revealed that exothermic intermediate solid decomposition is responsible for the center temperature peak. The contribution of secondary tar decomposition and lignin decomposition to the center temperature peak is small. The results of the mixture model (model-) indicate that endothermic cellulose decomposition is responsible for the center temperature plateau. A novel wood pyrolysis model is proposed based on the experimental and theoretical study of this work. The model consists of three endothermic parallel reactions for tar, gas and intermediate solid and a subsequent exothermic reaction of the intermediate solid to char conversion. Comparison between the model and experiment showed good agreement with both the thermal behavior and the solid mass loss. Adding the secondary tar decomposition mechanism to the model showed significant difference in gas and tar yields for high temperature. For the applications focusing on products yield such as liquid bio-fuel research, a secondary tar decomposition mechanism should be included. 106
126 Chapter 5 Three Dimensional Arbitrary Geometry Pyrolysis Model A three dimensional pyrolysis model for charring material was developed based on model-b of chapter 4. The governing equations are numerically solved by finite difference method. Detailed discretization of the governing equations is explained in Appendix E. The front tracking method of chapter was used to define the arbitrary geometry external boundary surface. Since a finite rate kinetics model is used, there is no need to track char / virgin solid interface. The front tracking method is used to solve governing equations at boundary adacent nodes and to impose boundary conditions at the boundary nodes. As an application of this model, the wood sphere pyrolysis of chapter 4 was solved and compared with the one dimensional model. Analysis conditions were the same as model- B in chapter 4. Furnace temperature was 688K. Grid size was 31 x 31 x 31. In order to reduce computational load, one eighth volume of the sphere was solved using symmetry conditions as shown in Figure 5.1. Iso-pressure surface of P/P 0 = at time = 300 seconds is shown in Figure 5.1. Since the pressure is slightly higher than ambient pressure P 0, the iso-pressure surface is close to the boundary surface of the wood sphere. Figure 5. and 5.3 show temperature and pressure distribution inside the sphere at time = 300 seconds. Comparison between 1-D model and 3-D model for temperature and pressure are presented in Figure 5.4 and Figure 5.5. Excellent agreement was achieved between them. 107
; time = 300 seconds, T fn = 688K x Figure 5.")
127 Z X Y z y Figure 5.1 Iso-pressure surface (P/P 0 = 1.007, P 0 = 101,300 Pa); time = 300 seconds, T fn = 688K x Figure 5. Temperature contours inside the wood sphere; unit: K, time: 300 seconds, T fn = 688K 108
 600 500 r=r 0 / r=0 400 300 0 00 400 600 800")
128 Figure 5.3 Pressure contours inside the wood sphere; unit: Pa, time = 300 seconds, T fn = 688K r=r 0 temperature (K) r=r 0 / r= time (s) Figure 5.4 Temperature comparison between 1-D model and 3-D model at surface, middle and center (circle: 1-D, line: 3-D), T fn = 688K 109
GLOWING AND FLAMING AUTOIGNITION OF WOOD
 Proceedings of the Combustion Institute, Volume 29, 2002/pp. 289 296 GLOWING AND FLAMING AUTOIGNITION OF WOOD N. BOONMEE and J. G. QUINTIERE Department of Fire Protection Engineering University of Maryland
ONE-DIMENSIONAL MODEL OF PYROLYSIS AND IGNITION OF MEDIUM DENSITY FIBERBOARD SUBJECTED TO TRANSIENT IRRADIATION
 ONE-DIMENSIONAL MODEL OF PYROLYSIS AND IGNITION OF MEDIUM DENSITY FIBERBOARD SUBJECTED TO TRANSIENT IRRADIATION Izabella Vermesi, Gaurav Agarwal, Marcos Chaos, and Guillermo Rein 1 Imperial College London
A mathematical description of thermal decomposition and spontaneous ignition of wood slab under a truncated-cone heater
 Korean J. Chem. Eng., 30(3), 613-619 (2013) DOI: 10.1007/s11814-012-0181-2 INVITED REVIEW PAPER A mathematical description of thermal decomposition and spontaneous ignition of wood slab under a truncated-cone
EXPERIMENTAL AND NUMERICAL STUDIES FOR FLAME SPREAD OVER A FINITE-LENGTH PMMA WITH RADIATION EFFECT
 ISTP-16, 2005, PRAGUE 16 TH INTERNATIONAL SYMPOSIUM ON TRANSPORT PHENOMENA EXPERIMENTAL AND NUMERICAL STUDIES FOR FLAME SPREAD OVER A FINITE-LENGTH PMMA WITH RADIATION EFFECT Wen-Kuei Chang and Chiun-Hsun
Modeling of the pyrolysis of plywood exposed to heat fluxes under cone calorimeter
 Modeling of the pyrolysis of plywood exposed to heat fluxes under cone calorimeter TALAL FATEH, FRANCK RICHARD, and THOMAS ROGAUME Institut Pprime / Département FTC Téléport 2-1, avenue Clément Ader, 86961
Transactions on Engineering Sciences vol 5, 1994 WIT Press, ISSN
 Smolder spread through thin horizontal fuel layers C. Di Blasi Dipartimento di Ingegneria Chimica, Universitd degli Studi di Napoli Federico II, PmzWe 7. Tecc/wo, (90^^5 Mzpo/z, 7(a/?/ ABSTRACT Two-dimensional
A Numerical Study of Solid Fuel Pyrolysis under Time Dependent Radiant Heat Flux Conditions
 7FR-75 Topic: Fire 8 th U. S. National Combustion Meeting Organized by the Western States Section of the Combustion Institute and hosted by the University of Utah May 19-, 13 Numerical Study of Solid Fuel
A FLAMELET MODEL FOR DIFFUSION FLAMES IN POROUS MEDIA. Max Akira Endo Kokubun. Fernando Filho Fachini
 A FLAMELET MODEL FOR DIFFUSION FLAMES IN POROUS MEDIA Max Akira Endo Kokubun Instituto Nacional de Pesquisas Espaciais, Rod. Presidente Dutra, km 40 - Cachoeira Paulista/SP, max@lcp.inpe.br Fernando Filho
If there is convective heat transfer from outer surface to fluid maintained at T W.
 Heat Transfer 1. What are the different modes of heat transfer? Explain with examples. 2. State Fourier s Law of heat conduction? Write some of their applications. 3. State the effect of variation of temperature
Flame Spread and Extinction over Thermally Thick PMMA in Low Oxygen Concentration Flow
 Flame Spread and Extinction over Thermally Thick PMMA in Low Oxygen Concentration Flow Y. KUDO, M. ITAKURA, Y. FUJITA, and A. ITO Faculty of Science and Technology Hirosaki University 3 Bunkyo-cho Hirosaki,
Lecture 9 Laminar Diffusion Flame Configurations
 Lecture 9 Laminar Diffusion Flame Configurations 9.-1 Different Flame Geometries and Single Droplet Burning Solutions for the velocities and the mixture fraction fields for some typical laminar flame configurations.
Prediction of the Heat Release Rate of Douglas Fir
 Prediction of the Heat Release Rate of Douglas Fir WIlliAM J. PARKER Center for Fire Research National Bureau of Standards 1 Gaithersburg, Maryland 20899, USA ABSTRACT Measurements have been made on the
Estimation of Temperature Transients for Biomass Pretreatment in Tubular Batch Reactors and Impact on Xylan Hydrolysis Kinetics
 Copyright Transients 2003 in Hydrolysis by Humana Press Kinetics Inc. 101 All rights of any nature whatsoever reserved. 0273-2289/03/105-108/0101/$20.00 Estimation of Temperature Transients for Biomass
Time-Temperature Profile across a Lumber Section Exposed to Pyrolytic Temperatures
 FIRE AND MATERIALS, VOL. 18, 211-220 (1994) Time-Temperature Profile across a Lumber Section Exposed to Pyrolytic Temperatures D. Shrestha Robbins Engineering, Inc., PO Box 280055, Tampa, FL 33682-0055,
Lecture 8 Laminar Diffusion Flames: Diffusion Flamelet Theory
 Lecture 8 Laminar Diffusion Flames: Diffusion Flamelet Theory 8.-1 Systems, where fuel and oxidizer enter separately into the combustion chamber. Mixing takes place by convection and diffusion. Only where
Experimental and Theoretical Study of the Ignition and Smoldering of Wood Including Convective Effects
 Experimental and Theoretical Study of the Ignition and Smoldering of Wood Including Convective Effects R. BILBAO,* J. F. MASTRAL, M. E. ALDEA, J. CEAMANOS and M. BETRÁN Department of Chemical and Environmental
Biological Process Engineering An Analogical Approach to Fluid Flow, Heat Transfer, and Mass Transfer Applied to Biological Systems
 Biological Process Engineering An Analogical Approach to Fluid Flow, Heat Transfer, and Mass Transfer Applied to Biological Systems Arthur T. Johnson, PhD, PE Biological Resources Engineering Department
MATHEMATICAL MODELING OF DISBONDED COATING AND CATHODIC DELAMINATION SYSTEMS KERRY N. ALLAHAR
 MATHEMATICAL MODELING OF DISBONDED COATING AND CATHODIC DELAMINATION SYSTEMS By KERRY N. ALLAHAR A DISSERTATION PRESENTED TO THE GRADUATE SCHOOL OF THE UNIVERSITY OF FLORIDA IN PARTIAL FULFILLMENT OF THE
Department of Mechanical Engineering, University Visvesvaraya College of Engineering, Bangalore University, Bangalore, Karnataka, India
 EXPERIMENTAL INVESTIGATION ON EFFECTS OF HEAT FLUX AND DENSITY ON SMOLDERING OF COTTON Ramesh D K *1, Manjunath S O #1, Sanjay R #2, Sai Naveen S #3, Jayantha #4 * Associate professor, # BE Scholar Department
Comparison of competitive and non-competitive char formation in polymer combustion
 Comparison of competitive and non-competitive char formation in polymer combustion S.D.WATT*, J.E.J. STAGGS*, A.C. MCINTOSH* and J. BRINDLEY +, *Department of Fuel and Energy, University of Leeds, Leeds
Pyrolysis modeling, thermal decomposition, and transport processes in combustible solids
 CHAPTER 6 Pyrolysis modeling, thermal decomposition, and transport processes in combustible solids C. Lautenberger & C. Fernandez-Pello University of California, Berkeley, USA. Abstract In a fire, combustion
Investigation of CNT Growth Regimes in a Tubular CVD Reactor Considering Growth Temperature
 ICHMT2014-XXXX Investigation of CNT Growth Regimes in a Tubular CVD Reactor Considering Growth Temperature B. Zahed 1, T. Fanaei Sheikholeslami 2,*, A. Behzadmehr 3, H. Atashi 4 1 PhD Student, Mechanical
C ONTENTS CHAPTER TWO HEAT CONDUCTION EQUATION 61 CHAPTER ONE BASICS OF HEAT TRANSFER 1 CHAPTER THREE STEADY HEAT CONDUCTION 127
 C ONTENTS Preface xviii Nomenclature xxvi CHAPTER ONE BASICS OF HEAT TRANSFER 1 1-1 Thermodynamics and Heat Transfer 2 Application Areas of Heat Transfer 3 Historical Background 3 1-2 Engineering Heat
Florida Institute of Technology College of Engineering Department of Chemical Engineering
 Florida Institute of Technology College of Engineering Department of Chemical Engineering CHE 4115 ChE Process Laboratory II Team Report # 1 Experiment # 3 Experimental Design - Heat Transfer by Convection
Critical Conditions for Water-based Suppression of Plastic Pool Fires. H. Li 1, A. S. Rangwala 1 and J.L. Torero 2
 Paper # 070FR-0069 Topic: Fire 8 th U. S. National Combustion Meeting Organized by the Western States Section of the Combustion Institute and hosted by the University of Utah May 19-22, 2013 Critical Conditions
Table of Contents. Foreword... Introduction...
 Table of Contents Foreword.... Introduction.... xi xiii Chapter 1. Fundamentals of Heat Transfer... 1 1.1. Introduction... 1 1.2. A review of the principal modes of heat transfer... 1 1.2.1. Diffusion...
Application of genetic algorithm in pyrolysis model parameter estimation. Anna Matala 60968U
 Application of genetic algorithm in pyrolysis model parameter estimation Anna Matala 60968U 1 Contents 1 Introduction 3 2 Small scale experiments 3 3 Pyrolysis Modeling 7 4 Genetic Algorithm 7 4.1 Basic
Context and fundamental issues
 Context and fundamental issues Fire behaviour of composite materials Multi-scale problem X-ray µtomography, Panerai @NASA Length scale Condensed matter [mg - mm] Laser-induced decomposition of a composite
Multiphase CFD Model of Wildland Fire Initiation and Spread
 The 5th International Fire Behavior and Fuels Conference April 11-15, 2016, Portland, Oregon, USA Multiphase CFD Model of Wildland Fire Initiation and Spread 1 Vladimir Agranat, Ph.D. President & Senior
Documentation of the Solutions to the SFPE Heat Transfer Verification Cases
 Documentation of the Solutions to the SFPE Heat Transfer Verification Cases Prepared by a Task Group of the SFPE Standards Making Committee on Predicting the Thermal Performance of Fire Resistive Assemblies
INTRODUCTION TO CATALYTIC COMBUSTION
 INTRODUCTION TO CATALYTIC COMBUSTION R.E. Hayes Professor of Chemical Engineering Department of Chemical and Materials Engineering University of Alberta, Canada and S.T. Kolaczkowski Professor of Chemical
THERMAL ANALYSIS OF A SPENT FUEL TRANSPORTATION CASK
 Excerpt from the Proceedings of the COMSOL Conference 2009 Bangalore THERMAL ANALYSIS OF A SPENT FUEL TRANSPORTATION CASK P. Goyal*, Vishnu Verma, R.K. Singh & A.K. Ghosh Reactor Safety Division Bhabha
Chapter Seven. For ideal gases, the ideal gas law provides a precise relationship between density and pressure:
 Chapter Seven Horizontal, steady-state flow of an ideal gas This case is presented for compressible gases, and their properties, especially density, vary appreciably with pressure. The conditions of the
THERMAL DEGRADATION AND IGNITION OF WOOD BY THERMAL RADIATION
 THERMAL DEGRADATION AND IGNITION OF WOOD BY THERMAL RADIATION D.K. Shen, M.X. Fang, Z.Y. Luo and K.F. Cen State Key Laboratory of Clean Energy Utilization, Institute for Thermal Poer Engineering Zhejiang
Thermal Systems. What and How? Physical Mechanisms and Rate Equations Conservation of Energy Requirement Control Volume Surface Energy Balance
 Introduction to Heat Transfer What and How? Physical Mechanisms and Rate Equations Conservation of Energy Requirement Control Volume Surface Energy Balance Thermal Resistance Thermal Capacitance Thermal
Laminar Premixed Flames: Flame Structure
 Laminar Premixed Flames: Flame Structure Combustion Summer School 2018 Prof. Dr.-Ing. Heinz Pitsch Course Overview Part I: Fundamentals and Laminar Flames Introduction Fundamentals and mass balances of
TankExampleNov2016. Table of contents. Layout
 Table of contents Task... 2 Calculation of heat loss of storage tanks... 3 Properties ambient air Properties of air... 7 Heat transfer outside, roof Heat transfer in flow past a plane wall... 8 Properties
Development of an evaporation boundary condition for DSMC method with application to meteoroid entry
 Development of an evaporation boundary condition for DSMC method with application to meteoroid entry F. Bariselli, S. Boccelli, A. Frezzotti, A. Hubin, T. Magin Annual METRO meeting 29th November 2016
Influence of chemical reaction and thermal radiation effects on MHD boundary layer flow over a moving vertical porous plate
 International Research Journal of Engineering and Technology (IRJET) e-issn: 2395-56 Volume: 2 Issue: 7 Oct-25 www.irjet.net p-issn: 2395-72 Influence of chemical reaction and thermal radiation effects
Overview of Turbulent Reacting Flows
 Overview of Turbulent Reacting Flows Outline Various Applications Overview of available reacting flow models LES Latest additions Example Cases Summary Reacting Flows Applications in STAR-CCM+ Ever-Expanding
Convective Heat and Mass Transfer Prof. A.W. Date Department of Mechanical Engineering Indian Institute of Technology, Bombay
 Convective Heat and Mass Transfer Prof. A.W. Date Department of Mechanical Engineering Indian Institute of Technology, Bombay Module No. # 01 Lecture No. # 32 Stefan Flow Model We are now familiar with
International Journal of ChemTech Research CODEN (USA): IJCRGG ISSN: Vol.8, No.6, pp , 2015
: IJCRGG ISSN: Vol.8, No.6, pp , 2015") International Journal of ChemTech Research CODEN (USA): IJCRGG ISSN: 0974-490 Vol.8, No.6, pp 750-758, 015 Simulation of Fcc Riser Reactor using Five Lump Model Debashri Paul 1, Raghavendra Singh Thakur,
International Journal of ChemTech Research CODEN (USA): IJCRGG ISSN: 0974-490 Vol.8, No.6, pp 750-758, 015 Simulation of Fcc Riser Reactor using Five Lump Model Debashri Paul 1, Raghavendra Singh Thakur,
Mir Md. Maruf Morshed
 Investigation of External Acoustic Loadings on a Launch Vehicle Fairing During Lift-off Supervisors: Professor Colin H. Hansen Associate Professor Anthony C. Zander School of Mechanical Engineering South
Definition of Ablation Test-case series #3
 Tom van Eekelen Alexandre Martin Jean Lachaud Daniele Bianchi Samtech, A Siemens Industry Software Company, Belgium University of Kentucky, USA UARC/Univ. of California Santa Cruz, USA La Sapienza Rome,
Mathematical Modeling of Oil Shale Pyrolysis
 October, 19 th, 2011 Mathematical Modeling of Oil Shale Pyrolysis Pankaj Tiwari Jacob Bauman Milind Deo Department of Chemical Engineering University of Utah, Salt Lake City, Utah http://from50000feet.wordpress.com
ABSTRACT. Mark B. McKinnon, Master of Science, Department of Fire Protection Engineering
 ABSTRACT Title of dissertation: DEVELOPMENT OF A MODEL FOR FLAMING COMBUSTION OF DOUBLE-WALL CORRUGATED CARDBOARD Mark B. McKinnon, Master of Science, 2012 Dissertation directed by: Professor Stanislav
Theoretical Developments in Group Combustion of Droplets and Sprays
 Theoretical Developments in Group Combustion of Droplets and Sprays William A. Sirignano University of California, Irvine Collaborations: Guang Wu, current student; Randall Imaoka, former student, US Navy;
IGNITABILITY ANALYSIS USING THE CONE CALORIMETER AND LIFT APPARATUS
 189 IGNITABILITY ANALYSIS USING THE CONE CALORIMETER AND LIFT APPARATUS Mark A. Dietenberger USDA Forest Service Forest Products Laboratory* Madison, WI 53705-2398 ABSTRACT The irradiance plotted as function
CONVECTION HEAT TRANSFER
 CONVECTION HEAT TRANSFER THIRD EDITION Adrian Bejan J. A. Jones Professor of Mechanical Engineering Duke University Durham, North Carolina WILEY JOHN WILEY & SONS, INC. CONTENTS Preface Preface to the
CONVECTION HEAT TRANSFER
 CONVECTION HEAT TRANSFER SECOND EDITION Adrian Bejan J. A. Jones Professor of Mechanical Engineering Duke University Durham, North Carolina A WILEY-INTERSCIENCE PUBUCATION JOHN WILEY & SONS, INC. New York
ELEC9712 High Voltage Systems. 1.2 Heat transfer from electrical equipment
 ELEC9712 High Voltage Systems 1.2 Heat transfer from electrical equipment The basic equation governing heat transfer in an item of electrical equipment is the following incremental balance equation, with
RATE OF FLUID FLOW THROUGH POROUS MEDIA
 RATE OF FLUID FLOW THROUGH POROUS MEDIA Submitted by Xu Ming Xin Kiong Min Yi Kimberly Yip Juen Chen Nicole A project presented to the Singapore Mathematical Society Essay Competition 2013 1 Abstract Fluid
c 2011 JOSHUA DAVID JOHNSTON ALL RIGHTS RESERVED
 c 211 JOSHUA DAVID JOHNSTON ALL RIGHTS RESERVED ANALYTICALLY AND NUMERICALLY MODELING RESERVOIR-EXTENDED POROUS SLIDER AND JOURNAL BEARINGS INCORPORATING CAVITATION EFFECTS A Dissertation Presented to
A First Course on Kinetics and Reaction Engineering Unit D and 3-D Tubular Reactor Models
 Unit 34. 2-D and 3-D Tubular Reactor Models Overview Unit 34 describes two- and three-dimensional models for tubular reactors. One limitation of the ideal PFR model is that the temperature and composition
EAS327 Environmental Instrumentation Mid-term 13 Feb,2003
 EAS327 Environmental Instrumentation Mid-term 13 Feb,2003 Professor: J.D. Wilson Time available: 80 mins Value: 15% Instructions: Closed book exam. Please record your answers in the exam booklet. Pertinent
Transactions on Engineering Sciences vol 5, 1994 WIT Press, ISSN
 Numerical temperature calculation for composite deck slabs exposed to fire J.M. Davies & H.B. Wang Telford Institute of Structures and Materials Engineering, University of Salford, Salford ABSTRACT Large
Greenhouse Steady State Energy Balance Model
 Greenhouse Steady State Energy Balance Model The energy balance for the greenhouse was obtained by applying energy conservation to the greenhouse system as a control volume and identifying the energy terms.
Studies on flow through and around a porous permeable sphere: II. Heat Transfer
 Studies on flow through and around a porous permeable sphere: II. Heat Transfer A. K. Jain and S. Basu 1 Department of Chemical Engineering Indian Institute of Technology Delhi New Delhi 110016, India
Fire scenarios modelling for the safe design of a passenger rail carriage
 Fire scenarios modelling for the safe design of a passenger rail carriage Andreini A., Da Soghe R., Facchini B., Giusti A. 1, L. Caruso ; G. Luconi 2, (2)- Troiano D. 3, 1, Engineering Department Sergio
Heat and Mass Transfer Prof. S.P. Sukhatme Department of Mechanical Engineering Indian Institute of Technology, Bombay
 Heat and Mass Transfer Prof. S.P. Sukhatme Department of Mechanical Engineering Indian Institute of Technology, Bombay Lecture No. 18 Forced Convection-1 Welcome. We now begin our study of forced convection
FORMULA SHEET. General formulas:
 FORMULA SHEET You may use this formula sheet during the Advanced Transport Phenomena course and it should contain all formulas you need during this course. Note that the weeks are numbered from 1.1 to
CHAPTER 5 MASS AND ENERGY ANALYSIS OF CONTROL VOLUMES
 Thermodynamics: An Engineering Approach 8th Edition in SI Units Yunus A. Çengel, Michael A. Boles McGraw-Hill, 2015 CHAPTER 5 MASS AND ENERGY ANALYSIS OF CONTROL VOLUMES Lecture slides by Dr. Fawzi Elfghi
Liquid water is one of the
 Formanski 71 1/07/09 8:57 Page 71 V olume 5 - Number 7 - May 2009 (71-75) Abstract Liquid water is one of the agents responsible for damage of building materials. Therefore determination of its content
Statistical Physics. Problem Set 4: Kinetic Theory
 Statistical Physics xford hysics Second year physics course Dr A. A. Schekochihin and Prof. A. Boothroyd (with thanks to Prof. S. J. Blundell) Problem Set 4: Kinetic Theory PROBLEM SET 4: Collisions and
MECH 375, Heat Transfer Handout #5: Unsteady Conduction
 1 MECH 375, Heat Transfer Handout #5: Unsteady Conduction Amir Maleki, Fall 2018 2 T H I S PA P E R P R O P O S E D A C A N C E R T R E AT M E N T T H AT U S E S N A N O PA R T I - C L E S W I T H T U
Combustion. Indian Institute of Science Bangalore
 Combustion Indian Institute of Science Bangalore Combustion Applies to a large variety of natural and artificial processes Source of energy for most of the applications today Involves exothermic chemical
Finite Difference Solution of the Heat Equation
 Finite Difference Solution of the Heat Equation Adam Powell 22.091 March 13 15, 2002 In example 4.3 (p. 10) of his lecture notes for March 11, Rodolfo Rosales gives the constant-density heat equation as:
Engineering and. Tapio Salmi Abo Akademi Abo-Turku, Finland. Jyri-Pekka Mikkola. Umea University, Umea, Sweden. Johan Warna.
 Chemical Reaction Engineering and Reactor Technology Tapio Salmi Abo Akademi Abo-Turku, Finland Jyri-Pekka Mikkola Umea University, Umea, Sweden Johan Warna Abo Akademi Abo-Turku, Finland CRC Press is
Applied Thermodynamics HEAT TRANSFER. Introduction What and How?
 LANDMARK UNIVERSITY, OMU-ARAN LECTURE NOTE: 3 COLLEGE: COLLEGE OF SCIENCE AND ENGINEERING DEPARTMENT: MECHANICAL ENGINEERING PROGRAMME: ENGR. ALIYU, S.J Course code: MCE 311 Course title: Applied Thermodynamics
Thermo-Kinetic Model of Burning for Polymeric Materials
 Thermo-Kinetic Model of Burning for Polymeric Materials Stanislav I. Stoliarov a, Sean Crowley b, Richard Lyon b a University of Maryland, Fire Protection Engineering, College Park, MD 20742 b FAA W. J.
Sandwich Propellant Combustion
 Sandwich Propellant Combustion P. A. Ramakrishna, P. J. Paul and H. S. Mukunda Combustion Gasification and Propulsion Laboratory Department of Aerospace Engineering Indian Institute of Science Bangalore
NUMERICAL INVESTIGATION OF STEADY STATE AND TRANSIENT THERMAL PERFORMANCE OF A MULTI-CHIP VAPOR CHAMBER MOHAMMAD PARHIZI
 NUMERICAL INVESTIGATION OF STEADY STATE AND TRANSIENT THERMAL PERFORMANCE OF A MULTI-CHIP VAPOR CHAMBER by MOHAMMAD PARHIZI Presented to the Faculty of the Graduate School of The University of Texas at
Diffusional Growth of Liquid Phase Hydrometeros.
 Diffusional Growth of Liquid Phase Hydrometeros. I. Diffusional Growth of Liquid Phase Hydrometeors A. Basic concepts of diffusional growth. 1. To understand the diffusional growth of a droplet, we must
Mechanical Engineering. Postal Correspondence Course HEAT TRANSFER. GATE, IES & PSUs
 Heat Transfer-ME GATE, IES, PSU 1 SAMPLE STUDY MATERIAL Mechanical Engineering ME Postal Correspondence Course HEAT TRANSFER GATE, IES & PSUs Heat Transfer-ME GATE, IES, PSU 2 C O N T E N T 1. INTRODUCTION
Free convection modeling over a vertical flat plate embedded in saturated porous medium with a variable heat source and radiation flux
 ISSN 1 746-7233, England, UK World Journal of Modelling and Simulation Vol. 9 (2013) No. 3, pp. 163-172 Free convection modeling over a vertical flat plate embedded in saturated porous medium with a variable
AME 513. " Lecture 7 Conservation equations
 AME 51 Principles of Combustion Lecture 7 Conservation equations Outline Conservation equations Mass Energy Chemical species Momentum 1 Conservation of mass Cubic control volume with sides dx, dy, dz u,
Department of Mechanical Engineering BM 7103 FUELS AND COMBUSTION QUESTION BANK UNIT-1-FUELS
 Department of Mechanical Engineering BM 7103 FUELS AND COMBUSTION QUESTION BANK UNIT-1-FUELS 1. Define the term fuels. 2. What are fossil fuels? Give examples. 3. Define primary fuels. Give examples. 4.
CATALYTIC STEAM REFORMING OF TOLUENE POST- GASIFICATION USING AS MODEL COMPOUND OF TAR PRODUCED BY BIOMASS GASIFICATION
 CATALYTIC STEAM REFORMING OF TOLUENE POST- GASIFICATION USING AS MODEL COMPOUND OF TAR PRODUCED BY BIOMASS GASIFICATION J. D. SILVA, C.C.B. OLIVEIRA AND C. A. M. ABREU 1 Polytechnic School UPE, Laboratory
Part I.
 Part I bblee@unimp . Introduction to Mass Transfer and Diffusion 2. Molecular Diffusion in Gasses 3. Molecular Diffusion in Liquids Part I 4. Molecular Diffusion in Biological Solutions and Gels 5. Molecular
ME 315 Final Examination Solution 8:00-10:00 AM Friday, May 8, 2009 CIRCLE YOUR DIVISION
 ME 315 Final Examination Solution 8:00-10:00 AM Friday, May 8, 009 This is a closed-book, closed-notes examination. There is a formula sheet at the back. You must turn off all communications devices before
EXECUTIVE SUMMARY. especially in last 50 years. Industries, especially power industry, are the large anthropogenic
 EXECUTIVE SUMMARY Introduction The concentration of CO 2 in atmosphere has increased considerably in last 100 years, especially in last 50 years. Industries, especially power industry, are the large anthropogenic
12.009/ Problem Set 2
 12.009/18.352 Problem Set 2 Due Thursday, 26 February 2015 100 points total Problem 1: 15 pts (a,b)=(10,5) Problem 2: 45 pts (a,b,c,d,e,f)=(5,5,5,10,10,10) Problem 3: 40 pts (a,b,c,d,e,f)=(5,5,5,5,10,10)
Notes on reaction-diffusion cases with effectiveness factors greater than one! Richard K. Herz,
 Notes on reaction-diffusion cases with effectiveness factors greater than one! Richard K. Herz, rherz@ucsd.edu For isothermal n-th order reactions where n >= 0, the catalyst effectiveness factor value
Matter exchange - type of wall Yes - permeable - absence of wall. Energy exchange - type of wall. - diathermic - moving wall. Yes
 I. The concept of work, expansion and additional (useful) work. II. The concept of heat. III. Definition of internal energy and its molecular interpretation. I. Different forms of the first law of thermodynamics..
Carbon Cycling Internal
 Carbon Cycling Internal The 4 subcycles Atmosphere The Earth s Atmosphere The Earth has a radius of some 6400 km. Ninety-nine percent of the earth's atmosphere is contained within a layer approximately
An Introduction to Chemical Kinetics
 An Introduction to Chemical Kinetics Michel Soustelle WWILEY Table of Contents Preface xvii PART 1. BASIC CONCEPTS OF CHEMICAL KINETICS 1 Chapter 1. Chemical Reaction and Kinetic Quantities 3 1.1. The
Opposed-Flow Flame Spread Over Polymeric Materials: Influence of Phase Change
 Opposed-Flow Flame Spread Over Polymeric Materials: Influence of Phase Change GUANYU ZHENG, INDREK S. WICHMAN,* and ANDRÉ BÉNARD Department of Mechanical Engineering, Michigan State University, East Lansing,
A MODEL AND FINITE ELEMENT IMPLEMENTATION FOR THE THERMO-MECHANICAL ANALYSIS OF POLYMER COMPOSITES EXPOSED TO FIRE
 A MODEL AND FINITE ELEMENT IMPLEMENTATION FOR THE THERMO-MECHANICAL ANALYSIS OF POLYMER COMPOSITES EXPOSED TO FIRE Z. Zhang and S.W. Case Materials Response Group, Department of Engineering Science & Mechanics
Comparison of Averaging Methods for Interface Conductivities in One-dimensional Unsaturated Flow in Layered Soils
 Comparison of Averaging Methods for Interface Conductivities in One-dimensional Unsaturated Flow in Layered Soils Ruowen Liu, Bruno Welfert and Sandra Houston School of Mathematical & Statistical Sciences,
A FINITE VOLUME-BASED NETWORK METHOD FOR THE PREDICTION OF HEAT, MASS AND MOMENTUM TRANSFER IN A PEBBLE BED REACTOR
 A FINITE VOLUME-BASED NETWORK METHOD FOR THE PREDICTION OF HEAT, MASS AND MOMENTUM TRANSFER IN A PEBBLE BED REACTOR GP Greyvenstein and HJ van Antwerpen Energy Systems Research North-West University, Private
Numerical Methods for Problems with Moving Fronts Orthogonal Collocation on Finite Elements
 Electronic Text Provided with the Book Numerical Methods for Problems with Moving Fronts by Bruce A. Finlayson Ravenna Park Publishing, Inc., 635 22nd Ave. N. E., Seattle, WA 985-699 26-524-3375; ravenna@halcyon.com;www.halcyon.com/ravenna
INFLUENCE OF VARIABLE PERMEABILITY ON FREE CONVECTION OVER VERTICAL FLAT PLATE EMBEDDED IN A POROUS MEDIUM
 INFLUENCE OF VARIABLE PERMEABILITY ON FREE CONVECTION OVER VERTICAL FLAT PLATE EMBEDDED IN A POROUS MEDIUM S. M. M. EL-Kabeir and A. M. Rashad Department of Mathematics, South Valley University, Faculty
Chapter 1 INTRODUCTION AND BASIC CONCEPTS
 Heat and Mass Transfer: Fundamentals & Applications 5th Edition in SI Units Yunus A. Çengel, Afshin J. Ghajar McGraw-Hill, 2015 Chapter 1 INTRODUCTION AND BASIC CONCEPTS Mehmet Kanoglu University of Gaziantep
Lecture Outline. 5.1 The Nature of Energy. Kinetic Energy and Potential Energy. 1 mv
 Chapter 5. Thermochemistry Common Student Misconceptions Students confuse power and energy. Students confuse heat with temperature. Students fail to note that the first law of thermodynamics is the law
Sustainability in Civil Engineering. II. Power & Heat: Thermodynamics
 Sustainability in Civil Engineering II. Power & Heat: Thermodynamics What is sustainability? What are some manifestations of unsustainability? How does engineering practice need to change? A useful starting
International Fire Safety Symposium 2015
 Proceedings of the International Fire Safety Symposium 2015 Organizers: cib - International Council for Research and Innovation in Building Construction UC - University of Coimbra albrasci - Luso-Brazilian
A numerical model for biomass pyrolysis
 Retrospective Theses and Dissertations 2005 A numerical model for biomass pyrolysis Mathew John Hagge Iowa State University Follow this and additional works at: http://lib.dr.iastate.edu/rtd Part of the
MODELING THE EFFECTIVE ELASTIC MODULUS OF RC BEAMS EXPOSED TO FIRE
 Journal of Marine Science and Technology, Vol., No., pp. -8 () MODELING THE EFFECTIVE ELASTIC MODULUS OF RC BEAMS EXPOSED TO FIRE Jui-Hsiang Hsu*, ***, Cherng-Shing Lin**, and Chang-Bin Huang*** Key words:
Influence of the Order of Chemical Reaction and Soret Effect on Mass Transfer of a Binary Fluid Mixture in Porous Media
 Influence of the Order of Chemical Reaction and Soret Effect on Mass Transfer of a Binary Fluid Mixture in Porous Media B.R.Sharma, Debozani Borgohain Department of Mathematics, Dibrugarh University, Dibrugarh-786004,
Industrial Rotating Kiln Simulation
 Industrial Rotating Kiln Simulation This thesis is presented for the degree of Doctor of Philosophy Faculty of Science University of Technology, Sydney 1999 Submitted by Dennis Van Puyvelde, B. Chem. Eng.