Chapter 6. Random-Number Generation 6.1. Prof. Dr. Mesut Güneş Ch. 6 Random-Number Generation
|
|
|
- Martin Hall
- 6 years ago
- Views:
Transcription


1 Chapter 6 Random-Number Generaton 6.1
2 Contents Propertes of Random Numbers Pseudo-Random Numbers Generatng Random Numbers Lnear Congruental Method Combned Lnear Congruental Method Tests for Random Numbers Real Random Numbers 6.2


3 Overvew Dscuss characterstcs and the generaton of random numbers. Subsequently, ntroduce tests for randomness: Frequency test Autocorrelaton test 6.3
 Electrc crcuts Electronc Random Number Indcator (ERNIE) Countng gamma rays In combnaton wth a computer Hook up an electronc devce to the computer")
4 Overvew Hstorcally Throw dces Deal out cards Draw numbered balls Use dgts of π Mechancal devces (spnnng dsc, etc.) Electrc crcuts Electronc Random Number Indcator (ERNIE) Countng gamma rays In combnaton wth a computer Hook up an electronc devce to the computer Read-n a table of random numbers 6.4
5 Pseudo-Random Numbers 6.5
6 Pseudo-Random Numbers Approach: Arthmetcally generaton (calculaton) of random numbers Pseudo, because generatng numbers usng a known method removes the potental for true randomness. Any one who consders arthmetcal methods of producng random dgts s, of course, n a state of sn. For, as has been ponted out several tmes, there s no such thng as a random number there are only methods to produce random numbers, and a strct arthmetc procedure of course s not such a method. John von Neumann,
7 Pseudo-Random Numbers probably can not be justfed, but should merely be judged by ther results. Some statstcal study of the dgts generated by a gven recpe should be made, but exhaustve tests are mpractcal. If the dgts work well on one problem, they seem usually to be successful wth others of the same type. John von Neumann, 1951 Goal: To produce a sequence of numbers n [0,1] that smulates, or mtates, the deal propertes of random numbers (RN). 6.7
8 Pseudo-Random Numbers Important propertes of good random number routnes: Fast Portable to dfferent computers Have suffcently long cycle Replcable Verfcaton and debuggng Use dentcal stream of random numbers for dfferent systems Closely approxmate the deal statstcal propertes of unformty and ndependence 6.8
9 Pseudo-Random Numbers: Propertes Two mportant statstcal propertes: Unformty Independence Random number R must be ndependently drawn from a unform dstrbuton wth PDF: f ( x) = 1, 0, 0 x 1 otherwse f(x) E( R) = 1 0 xdx = x = 1 2 x 0 1 PDF for random numbers 6.9
10 Pseudo-Random Numbers Problems when generatng pseudo-random numbers The generated numbers mght not be unformly dstrbuted The generated numbers mght be dscrete-valued nstead of contnuous-valued The mean of the generated numbers mght be too hgh or too low The varance of the generated numbers mght be too hgh or too low There mght be dependence: Autocorrelaton between numbers Numbers successvely hgher or lower than adjacent numbers Several numbers above the mean followed by several numbers below the mean 6.10
11 Generatng Random Numbers 6.11
12 Generatng Random Numbers Mdsquare method Lnear Congruental Method (LCM) Combned Lnear Congruental Generators (CLCG) Random-Number Streams 6.12
13 Generatng Random Numbers Mdsquare method 6.13
14 Mdsquare method Frst arthmetc generator: Mdsquare method von Neumann and Metropols n 1940s The Mdsquare method: Start wth a four-dgt postve nteger Z 0 2 Compute: Z = Z0 dgts 0 Z0 to obtan an nteger wth up to eght Take the mddle four dgts for the next four-dgt number Z U Z Z
15 Mdsquare method Problem: Generated numbers tend to 0 Z U Z Z
16 random numbers should not be generated wth a method chosen at random. Some theory should be used. Donald E. Knuth, The Art of Computer Programmng, Vol
17 Generatng Random Numbers Lnear Congruental Method 6.17
18 Lnear Congruental Method To produce a sequence of ntegers 1, 2, between 0 and m-1 by followng a recursve relatonshp: = ( a + c) mod m, = + 1 0,1,2,... The multpler The ncrement The modulus Assumpton: m > 0 and a < m, c < m, 0 < m The selecton of the values for a, c, m, and 0 drastcally affects the statstcal propertes and the cycle length The random ntegers are beng generated n [0, m-1] 6.18
19 Lnear Congruental Method Convert the ntegers to random numbers R =, =1,2,... m Note: {0, 1,..., m-1} R [0, (m-1)/m] 6.19
20 Lnear Congruental Method: Example Use 0 = 27, a = 17, c = 43, and m = 100. The and R values are: 1 = ( ) mod 100 = 502 mod 100 = 2 Æ R 1 = = ( ) mod 100 = 77 Æ R 2 = = ( ) mod 100 = 52 Æ R 3 = = ( ) mod 100 = 27 Æ R 3 =
21 Lnear Congruental Method: Example Use a = 13, c = 0, and m = 64 The perod of the generator s very low Seed 0 nfluences the sequence 0 =1 0 =2 0 =3 0 =
22 Lnear Congruental Method: Characterstcs of a good Generator Maxmum Densty The values assumed by R, =1,2, leave no large gaps on [0,1] Problem: Instead of contnuous, each R s dscrete Soluton: a very large nteger for modulus m Approxmaton appears to be of lttle consequence Maxmum Perod To acheve maxmum densty and avod cyclng Acheved by proper choce of a, c, m, and 0 Most dgtal computers use a bnary representaton of numbers Speed and effcency are aded by a modulus, m, to be (or close to) a power of
23 Lnear Congruental Method: Characterstcs of a good Generator The LCG has full perod f and only f the followng three condtons hold (Hull and Dobell, 1962): 1. The only postve nteger that (exactly) dvdes both m and c s 1 2. If q s a prme number that dvdes m, then q dvdes a-1 3. If 4 dvdes m, then 4 dvdes a
24 Lnear Congruental Method: Proper choce of parameters For m a power 2, m=2 b, and c 0 Longest possble perod P=m=2 b s acheved f c s relatve prme to m and a=1+4k, where k s an nteger For m a power 2, m=2 b, and c=0 Longest possble perod P=m/4=2 b-2 s acheved f the seed 0 s odd and a=3+8k or a=5+8k, for k=0,1,... For m a prme and c=0 Longest possble perod P=m-1 s acheved f the multpler a has property that smallest nteger k such that a k -1 s dvsble by m s k = m
25 Characterstcs of a Good Generator 6.25

26 Characterstcs of a Good Generator 6.26
27 Random-Numbers n Java Defned n java.utl.random prvate fnal statc long multpler = 0x5DEECE66DL; // prvate fnal statc long addend = 0xBL; // 11 prvate fnal statc long mask = (1L << 48) - 1; // = protected nt next(nt bts) { long oldseed, nextseed;... oldseed = seed.get(); nextseed = (oldseed * multpler + addend) & mask;... return (nt)(nextseed >>> (48 - bts)); // >>> Unsgned rght shft } 6.27
28 General Congruental Generators Lnear Congruental Generators are a specal case of generators defned by: 1 g(, 1, ) mod + = where g() s a functon of prevous s [0, m-1], R = /m m Quadratc congruental generator Defned by: g (, ) 2 1 a + b Multple recursve generators Defned by: g(, 1, ) a1 + Fbonacc generator Defned by: g = 1 + = a (, ) 1 = + 1 c a k k 6.28
29 Combned Lnear Congruental Generators Reason: Longer perod generator s needed because of the ncreasng complexty of smulated systems. Approach: Combne two or more multplcatve congruental generators. Let,1,,2,,,k be the -th output from k dfferent multplcatve congruental generators. The j-th generator,j : + 1, j = ( a j + c j ) mod m j has prme modulus m j, multpler a j, and perod m j -1 produces ntegers,j approx ~ Unform on [0, m j 1] W,j =,j - 1 s approx ~ Unform on ntegers on [0, m j - 2] 6.29
30 6.30 Combned Lnear Congruental Generators Suggested form: The maxmum possble perod s: ) 1)...( 1)( ( = k m k m m P 1 mod 1) ( 1 1, 1 = = m k j j j = > = 0, 1 0, Hence, m m m R
31 Combned Lnear Congruental Generators Example: For 32-bt computers, combnng k = 2 generators wth m 1 = , a 1 = 40014, m 2 = and a 2 = The algorthm becomes: Step 1: Select seeds 0,1 n the range [1, ] for the 1 st generator 0,2 n the range [1, ] for the 2 nd generator Step 2: For each ndvdual generator, +1,1 = 40014,1 mod ,2 = 40692,2 mod Step 3: +1 = ( +1,1 - +1,2 ) mod Step 4: Return R , = , > 0 = 0 Step 5: Set = +1, go back to step 2. Combned generator has perod: (m 1 1)(m 2 1)/2 ~ 2 x
32 Random-Numbers n Excel 2003 In Excel 2003 and 2007 new Random Number Generator, Y, Z {1,...,30000} = 171mod Y = Y 172 mod Z = Z 170 mod R = Y Z mod 1.0 It s stated that ths method produces more than numbers For more nfo:
33 Random-Numbers Streams The seed for a lnear congruental random-number generator: Is the nteger value 0 that ntalzes the random-number sequence Any value n the sequence ( 0, 1,, P ) can be used to seed the generator A random-number stream: Refers to a startng seed taken from the sequence ( 0, 1,, P ). If the streams are b values apart, then stream s defned by startng seed: Older generators: b = 10 5 Newer generators: b = S, = b( 1) = 1,2, A sngle random-number generator wth k streams can act lke k dstnct vrtual random-number generators To compare two or more alternatve systems. Advantageous to dedcate portons of the pseudo-random number sequence to the same purpose n each of the smulated systems. P b 6.33
34 Mersenne Twster Generator Mersenne Twster RNG (MT) by M. Matsumoto and T. Nshmura, 1998 MT propertes perod of dmensonal equdstrbuton 6.34
35 Random Numbers n OMNeT++ OMNeT++ releases pror to 3.0 used a lnear congruental generator (LCG) wth a cycle length of By default, OMNeT++ uses the Mersenne Twster RNG (MT) by M. Matsumoto and T. Nshmura. Ths RNG can be selected from omnetpp.n OMNeT++ allows pluggng n your own RNGs as well. Ths mechansm, based on the crng nterface. 6.35
36 Tests for Random Numbers 6.36
37 Tests for Random Numbers Two categores: Testng for unformty: H 0 : R ~ U[0,1] H 1 : R U[0,1] Falure to reject the null hypothess, H 0, means that evdence of nonunformty has not been detected. Testng for ndependence: H 0 : R ~ ndependent H 1 : R ndependent Falure to reject the null hypothess, H 0, means that evdence of dependence has not been detected. Level of sgnfcance α, the probablty of rejectng H 0 when t s true: α = P(reject H 0 H 0 s true) 6.37
38 Tests for Random Numbers When to use these tests: If a well-known smulaton language or random-number generator s used, t s probably unnecessary to test If the generator s not explctly known or documented, e.g., spreadsheet programs, symbolc/numercal calculators, tests should be appled to many sample numbers. Types of tests: Theoretcal tests: evaluate the choces of m, a, and c wthout actually generatng any numbers Emprcal tests: appled to actual sequences of numbers produced. Our emphass. 6.38
39 Tests for Random Numbers Frequency tests: Kolmogorov-Smrnov Test 6.39
40 Kolmogorov-Smrnov Test Compares the contnuous CDF, F(x), of the unform dstrbuton wth the emprcal CDF, S N (x), of the N sample observatons. We know: F( x) = x, 0 x 1 F(x) If the sample from the RNG s R 1, R 2,, R N, then the emprcal CDF, S N (x) s: 0 1 x S N ( x) = Number of R where N R x Based on the statstc: D = max F(x) - S N (x) Samplng dstrbuton of D s known 6.40
41 Kolmogorov-Smrnov Test The test conssts of the followng steps Step 1: Rank the data from smallest to largest R (1) R (2)... R (N) Kolmogorov-Smrnov Crtcal Values Step 2: Compute + D = max R( ) 1 N N 1 D = max R( ) 1 N N Step 3: Compute D = max(d +, D - ) Step 4: Get D α for the sgnfcance level α Step 5: If D D α accept, otherwse reject H
42 Kolmogorov-Smrnov Test Example: Suppose N=5 numbers: 0.44, 0.81, 0.14, 0.05, Step 1: Step 2: R () /N /N R () R () (-1)/N Arrange R () from smallest to largest D + = max{/n R () } D - = max{r () - (-1)/N} Step 3: D = max(d +, D - ) = 0.26 Step 4: For α = 0.05, D α = > D = 0.26 Hence, H 0 s not rejected. 6.42
43 Tests for Random Numbers Frequency tests: Ch-square Test 6.43
44 Ch-square Test Ch-square test uses the sample statstc: n s the # of classes O s the observed # n the -th class E s the expected # n the -th class χ 2 0 = n = 1 ( O E E ) 2 Approxmately the ch-square dstrbuton wth n-1 degrees of freedom For the unform dstrbuton, E, the expected number n each class s: N E =, where N s the total number of observatons n Vald only for large samples, e.g., N
45 Ch-square Test: Example Example wth 100 numbers from [0,1], α= ntervals χ ,9 = 16.9 Accept, snce 2 0 =11.2 < χ ,9 Interval Upper Lmt O E O -E (O -E )^2 (O -E )^2/E Sum χ 2 0 = n = 1 ( O E ) E =
46 Tests for Random Numbers Tests for autocorrelaton 6.46
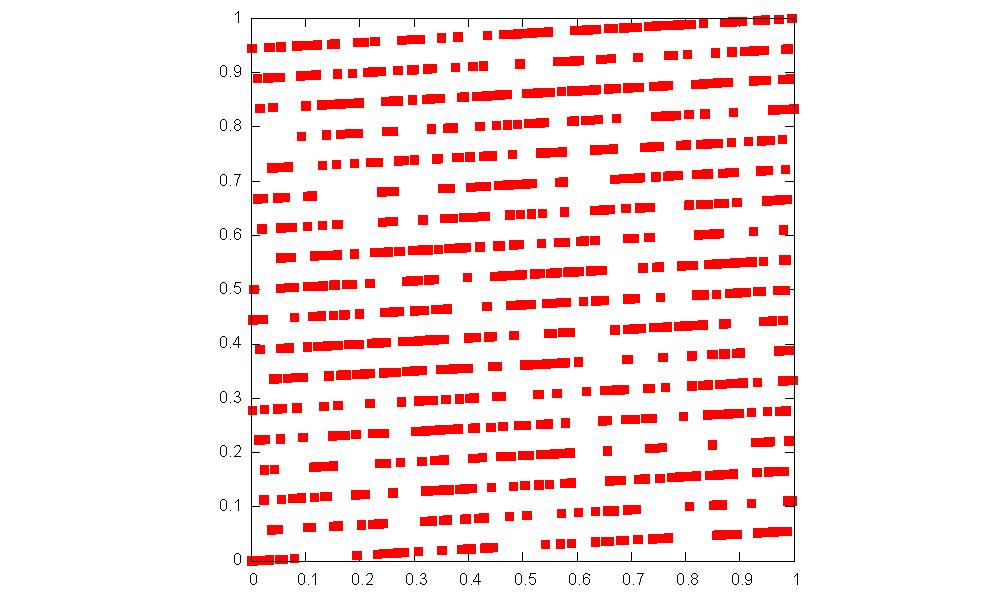
47 Tests for Autocorrelaton Autocorrelaton s concerned wth dependence between numbers n a sequence Example: Numbers at 5-th, 10-th, 15-th,... are very smlar Numbers can be Low Hgh Alternatng 6.47
48 Tests for Autocorrelaton Testng the autocorrelaton between every m numbers (m s a.k.a. the lag), startng wth the -th number The autocorrelaton ρ,m between numbers: R, R +m, R +2m, R +(M+1)m M s the largest nteger such that + ( M + 1) m N Hypothess: H H 0 1 : : ρ ρ, m, m = 0, 0, f f numbers are ndependent numbers are dependent If the values are uncorrelated: For large values of M, the dstrbuton of the estmator of ρ,m, denoted s approxmately normal. ˆρ,m 6.48
49 6.49 Tests for Autocorrelaton Correlaton at lag j Assume = U ) ( ) ( ) ( ) ( ) ( )] ( [ ) ( ) ( ) ( ) ( ), ( ) ( ) ( ) ( ), ( j j j j j j j j j Var E E E Var E E E E E Cov C E E E Cov C C C = = = = = = = = ρ ρ 3 ) ( ) ( 12 1 ) ( and 2 1 ) ( = = = = + + j j j U U E U U E U Var U E ρ
50 Tests for Autocorrelaton Test statstcs s: Z 0 = ˆ ρ ˆ σ ˆ ρ, m, m Z 0 s dstrbuted normally wth mean = 0 and varance = 1, and: ρˆ σˆ, m ρ, m = 1 1 M R M + k = 0 = 13M ( M + 1) + km R + (k + 1 )m After computng Z 0 do not reject the hypothess of ndependence f z α/2 Z 0 z α/2 6.50
51 Tests for Autocorrelaton If ρ,m > 0, the subsequence has postve autocorrelaton Hgh random numbers tend to be followed by hgh ones, and vce versa. If ρ,m < 0, the subsequence has negatve autocorrelaton Low random numbers tend to be followed by hgh ones, and vce versa. 6.51
52 Example Test whether the 3 rd, 8 th, 13 th, and so on, for the numbers on Slde 46. Hence, α = 0.05, = 3, m = 5, N = 30, and M = 4 ρˆ σ 35 ρˆ Z (0.23)(0.28) + (0.28)(0.33) + (0.33)(0.27) = (0.27)(0.05) (0.05)(0.36) = = = 13(4) ( 4 + 1) = = z = 1.96 Snce Z 0 = , the hypothess s not rejected. 6.52
53 Shortcomngs The test s not very senstve for small values of M, partcularly when the numbers beng tested are on the low sde. Problem when fshng for autocorrelaton by performng numerous tests: If α = 0.05, there s a probablty of 0.05 of rejectng a true hypothess. If 10 ndependence sequences are examned: The probablty of fndng no sgnfcant autocorrelaton, by chance alone, s = Hence, the probablty of detectng sgnfcant autocorrelaton when t does not exst = 40% 6.53
54 Real Random Numbers 6.54

55 Real Random Numbers There are also sources for real random numbers n the Internet RANDOM.ORG offers true random numbers to anyone on the Internet. The randomness comes from atmospherc nose, whch for many purposes s better than the pseudo-random number algorthms typcally used n computer programs. People use the numbers to run lotteres, draws and sweepstakes and for ther games and gamblng stes
56 Real Random Numbers It offers the possblty to download true random numbers generated usng a quantum random number generator upon demand. 6.56


57 Real Random Numbers Hardware based generaton of random numbers
58 Summary In ths chapter, we descrbed: Generaton of random numbers Testng for unformty and ndependence Sources of real random numbers Cauton: Even wth generators that have been used for years, some of whch stll n use, are found to be nadequate. Ths chapter provdes only the bascs. Also, even f generated numbers pass all the tests, some underlyng pattern mght have gone undetected. 6.58
Modeling and Simulation NETW 707
 Modelng and Smulaton NETW 707 Lecture 5 Tests for Random Numbers Course Instructor: Dr.-Ing. Magge Mashaly magge.ezzat@guc.edu.eg C3.220 1 Propertes of Random Numbers Random Number Generators (RNGs) must
3.1 Expectation of Functions of Several Random Variables. )' be a k-dimensional discrete or continuous random vector, with joint PMF p (, E X E X1 E X
' be a k-dimensional discrete or continuous random vector, with joint PMF p (, E X E X1 E X") Statstcs 1: Probablty Theory II 37 3 EPECTATION OF SEVERAL RANDOM VARIABLES As n Probablty Theory I, the nterest n most stuatons les not on the actual dstrbuton of a random vector, but rather on a number
Statstcs 1: Probablty Theory II 37 3 EPECTATION OF SEVERAL RANDOM VARIABLES As n Probablty Theory I, the nterest n most stuatons les not on the actual dstrbuton of a random vector, but rather on a number
x i1 =1 for all i (the constant ).
.") Chapter 5 The Multple Regresson Model Consder an economc model where the dependent varable s a functon of K explanatory varables. The economc model has the form: y = f ( x,x,..., ) xk Approxmate ths by
Chapter 5 The Multple Regresson Model Consder an economc model where the dependent varable s a functon of K explanatory varables. The economc model has the form: y = f ( x,x,..., ) xk Approxmate ths by
Statistics for Economics & Business
 Statstcs for Economcs & Busness Smple Lnear Regresson Learnng Objectves In ths chapter, you learn: How to use regresson analyss to predct the value of a dependent varable based on an ndependent varable
Chapter 11: Simple Linear Regression and Correlation
 Chapter 11: Smple Lnear Regresson and Correlaton 11-1 Emprcal Models 11-2 Smple Lnear Regresson 11-3 Propertes of the Least Squares Estmators 11-4 Hypothess Test n Smple Lnear Regresson 11-4.1 Use of t-tests
Econ107 Applied Econometrics Topic 3: Classical Model (Studenmund, Chapter 4)
") I. Classcal Assumptons Econ7 Appled Econometrcs Topc 3: Classcal Model (Studenmund, Chapter 4) We have defned OLS and studed some algebrac propertes of OLS. In ths topc we wll study statstcal propertes
I. Classcal Assumptons Econ7 Appled Econometrcs Topc 3: Classcal Model (Studenmund, Chapter 4) We have defned OLS and studed some algebrac propertes of OLS. In ths topc we wll study statstcal propertes
Lecture 6 More on Complete Randomized Block Design (RBD)
") Lecture 6 More on Complete Randomzed Block Desgn (RBD) Multple test Multple test The multple comparsons or multple testng problem occurs when one consders a set of statstcal nferences smultaneously. For
Lecture 6 More on Complete Randomzed Block Desgn (RBD) Multple test Multple test The multple comparsons or multple testng problem occurs when one consders a set of statstcal nferences smultaneously. For
Simulated Power of the Discrete Cramér-von Mises Goodness-of-Fit Tests
 Smulated of the Cramér-von Mses Goodness-of-Ft Tests Steele, M., Chaselng, J. and 3 Hurst, C. School of Mathematcal and Physcal Scences, James Cook Unversty, Australan School of Envronmental Studes, Grffth
Simulation and Random Number Generation
 Smulaton and Random Number Generaton Summary Dscrete Tme vs Dscrete Event Smulaton Random number generaton Generatng a random sequence Generatng random varates from a Unform dstrbuton Testng the qualty
/ n ) are compared. The logic is: if the two
 are compared. The logic is: if the two") STAT C141, Sprng 2005 Lecture 13 Two sample tests One sample tests: examples of goodness of ft tests, where we are testng whether our data supports predctons. Two sample tests: called as tests of ndependence
STAT C141, Sprng 2005 Lecture 13 Two sample tests One sample tests: examples of goodness of ft tests, where we are testng whether our data supports predctons. Two sample tests: called as tests of ndependence
See Book Chapter 11 2 nd Edition (Chapter 10 1 st Edition)
") Count Data Models See Book Chapter 11 2 nd Edton (Chapter 10 1 st Edton) Count data consst of non-negatve nteger values Examples: number of drver route changes per week, the number of trp departure changes
Count Data Models See Book Chapter 11 2 nd Edton (Chapter 10 1 st Edton) Count data consst of non-negatve nteger values Examples: number of drver route changes per week, the number of trp departure changes
Predictive Analytics : QM901.1x Prof U Dinesh Kumar, IIMB. All Rights Reserved, Indian Institute of Management Bangalore
 Sesson Outlne Introducton to classfcaton problems and dscrete choce models. Introducton to Logstcs Regresson. Logstc functon and Logt functon. Maxmum Lkelhood Estmator (MLE) for estmaton of LR parameters.
Department of Quantitative Methods & Information Systems. Time Series and Their Components QMIS 320. Chapter 6
 Department of Quanttatve Methods & Informaton Systems Tme Seres and Ther Components QMIS 30 Chapter 6 Fall 00 Dr. Mohammad Zanal These sldes were modfed from ther orgnal source for educatonal purpose only.
Lecture 4 Hypothesis Testing
 Lecture 4 Hypothess Testng We may wsh to test pror hypotheses about the coeffcents we estmate. We can use the estmates to test whether the data rejects our hypothess. An example mght be that we wsh to
Linear Approximation with Regularization and Moving Least Squares
 Lnear Approxmaton wth Regularzaton and Movng Least Squares Igor Grešovn May 007 Revson 4.6 (Revson : March 004). 5 4 3 0.5 3 3.5 4 Contents: Lnear Fttng...4. Weghted Least Squares n Functon Approxmaton...
j) = 1 (note sigma notation) ii. Continuous random variable (e.g. Normal distribution) 1. density function: f ( x) 0 and f ( x) dx = 1
 = 1 (note sigma notation) ii. Continuous random variable (e.g. Normal distribution) 1. density function: f ( x) 0 and f ( x) dx = 1") Random varables Measure of central tendences and varablty (means and varances) Jont densty functons and ndependence Measures of assocaton (covarance and correlaton) Interestng result Condtonal dstrbutons
Random varables Measure of central tendences and varablty (means and varances) Jont densty functons and ndependence Measures of assocaton (covarance and correlaton) Interestng result Condtonal dstrbutons
Negative Binomial Regression
 STATGRAPHICS Rev. 9/16/2013 Negatve Bnomal Regresson Summary... 1 Data Input... 3 Statstcal Model... 3 Analyss Summary... 4 Analyss Optons... 7 Plot of Ftted Model... 8 Observed Versus Predcted... 10 Predctons...
Chapter 15 Student Lecture Notes 15-1
 Chapter 15 Student Lecture Notes 15-1 Basc Busness Statstcs (9 th Edton) Chapter 15 Multple Regresson Model Buldng 004 Prentce-Hall, Inc. Chap 15-1 Chapter Topcs The Quadratc Regresson Model Usng Transformatons
Economics 130. Lecture 4 Simple Linear Regression Continued
 Economcs 130 Lecture 4 Contnued Readngs for Week 4 Text, Chapter and 3. We contnue wth addressng our second ssue + add n how we evaluate these relatonshps: Where do we get data to do ths analyss? How do
Statistics for Business and Economics
 Statstcs for Busness and Economcs Chapter 11 Smple Regresson Copyrght 010 Pearson Educaton, Inc. Publshng as Prentce Hall Ch. 11-1 11.1 Overvew of Lnear Models n An equaton can be ft to show the best lnear
Basic Business Statistics, 10/e
 Chapter 13 13-1 Basc Busness Statstcs 11 th Edton Chapter 13 Smple Lnear Regresson Basc Busness Statstcs, 11e 009 Prentce-Hall, Inc. Chap 13-1 Learnng Objectves In ths chapter, you learn: How to use regresson
Comparison of Regression Lines
 STATGRAPHICS Rev. 9/13/2013 Comparson of Regresson Lnes Summary... 1 Data Input... 3 Analyss Summary... 4 Plot of Ftted Model... 6 Condtonal Sums of Squares... 6 Analyss Optons... 7 Forecasts... 8 Confdence
2E Pattern Recognition Solutions to Introduction to Pattern Recognition, Chapter 2: Bayesian pattern classification
 E395 - Pattern Recognton Solutons to Introducton to Pattern Recognton, Chapter : Bayesan pattern classfcaton Preface Ths document s a soluton manual for selected exercses from Introducton to Pattern Recognton
Statistical Inference. 2.3 Summary Statistics Measures of Center and Spread. parameters ( population characteristics )
") Ismor Fscher, 8//008 Stat 54 / -8.3 Summary Statstcs Measures of Center and Spread Dstrbuton of dscrete contnuous POPULATION Random Varable, numercal True center =??? True spread =???? parameters ( populaton
Ismor Fscher, 8//008 Stat 54 / -8.3 Summary Statstcs Measures of Center and Spread Dstrbuton of dscrete contnuous POPULATION Random Varable, numercal True center =??? True spread =???? parameters ( populaton
1. Inference on Regression Parameters a. Finding Mean, s.d and covariance amongst estimates. 2. Confidence Intervals and Working Hotelling Bands
 Content. Inference on Regresson Parameters a. Fndng Mean, s.d and covarance amongst estmates.. Confdence Intervals and Workng Hotellng Bands 3. Cochran s Theorem 4. General Lnear Testng 5. Measures of
ANSWERS. Problem 1. and the moment generating function (mgf) by. defined for any real t. Use this to show that E( U) var( U)
 by. defined for any real t. Use this to show that E( U) var( U)") Econ 413 Exam 13 H ANSWERS Settet er nndelt 9 deloppgaver, A,B,C, som alle anbefales å telle lkt for å gøre det ltt lettere å stå. Svar er gtt . Unfortunately, there s a prntng error n the hnt of
Econ 413 Exam 13 H ANSWERS Settet er nndelt 9 deloppgaver, A,B,C, som alle anbefales å telle lkt for å gøre det ltt lettere å stå. Svar er gtt . Unfortunately, there s a prntng error n the hnt of
Expected Value and Variance
 MATH 38 Expected Value and Varance Dr. Neal, WKU We now shall dscuss how to fnd the average and standard devaton of a random varable X. Expected Value Defnton. The expected value (or average value, or
Composite Hypotheses testing
 Composte ypotheses testng In many hypothess testng problems there are many possble dstrbutons that can occur under each of the hypotheses. The output of the source s a set of parameters (ponts n a parameter
First Year Examination Department of Statistics, University of Florida
 Frst Year Examnaton Department of Statstcs, Unversty of Florda May 7, 010, 8:00 am - 1:00 noon Instructons: 1. You have four hours to answer questons n ths examnaton.. You must show your work to receve
Slides 3: Random Numbers
 Slides 3: Random Numbers We previously considered a few examples of simulating real processes. In order to mimic real randomness of events such as arrival times we considered the use of random numbers
Chapter 13: Multiple Regression
 Chapter 13: Multple Regresson 13.1 Developng the multple-regresson Model The general model can be descrbed as: It smplfes for two ndependent varables: The sample ft parameter b 0, b 1, and b are used to
IRO0140 Advanced space time-frequency signal processing
 IRO4 Advanced space tme-frequency sgnal processng Lecture Toomas Ruuben Takng nto account propertes of the sgnals, we can group these as followng: Regular and random sgnals (are all sgnal parameters determned
4 Analysis of Variance (ANOVA) 5 ANOVA. 5.1 Introduction. 5.2 Fixed Effects ANOVA
 5 ANOVA. 5.1 Introduction. 5.2 Fixed Effects ANOVA") 4 Analyss of Varance (ANOVA) 5 ANOVA 51 Introducton ANOVA ANOVA s a way to estmate and test the means of multple populatons We wll start wth one-way ANOVA If the populatons ncluded n the study are selected
4 Analyss of Varance (ANOVA) 5 ANOVA 51 Introducton ANOVA ANOVA s a way to estmate and test the means of multple populatons We wll start wth one-way ANOVA If the populatons ncluded n the study are selected
THE CHINESE REMAINDER THEOREM. We should thank the Chinese for their wonderful remainder theorem. Glenn Stevens
 THE CHINESE REMAINDER THEOREM KEITH CONRAD We should thank the Chnese for ther wonderful remander theorem. Glenn Stevens 1. Introducton The Chnese remander theorem says we can unquely solve any par of
Probability and Random Variable Primer
 B. Maddah ENMG 622 Smulaton 2/22/ Probablty and Random Varable Prmer Sample space and Events Suppose that an eperment wth an uncertan outcome s performed (e.g., rollng a de). Whle the outcome of the eperment
Durban Watson for Testing the Lack-of-Fit of Polynomial Regression Models without Replications
 Durban Watson for Testng the Lack-of-Ft of Polynomal Regresson Models wthout Replcatons Ruba A. Alyaf, Maha A. Omar, Abdullah A. Al-Shha ralyaf@ksu.edu.sa, maomar@ksu.edu.sa, aalshha@ksu.edu.sa Department
Chapter 14 Simple Linear Regression
 Chapter 4 Smple Lnear Regresson Chapter 4 - Smple Lnear Regresson Manageral decsons often are based on the relatonshp between two or more varables. Regresson analss can be used to develop an equaton showng
Resource Allocation and Decision Analysis (ECON 8010) Spring 2014 Foundations of Regression Analysis
 Spring 2014 Foundations of Regression Analysis") Resource Allocaton and Decson Analss (ECON 800) Sprng 04 Foundatons of Regresson Analss Readng: Regresson Analss (ECON 800 Coursepak, Page 3) Defntons and Concepts: Regresson Analss statstcal technques
Resource Allocaton and Decson Analss (ECON 800) Sprng 04 Foundatons of Regresson Analss Readng: Regresson Analss (ECON 800 Coursepak, Page 3) Defntons and Concepts: Regresson Analss statstcal technques
CHAPTER 5 NUMERICAL EVALUATION OF DYNAMIC RESPONSE
 CHAPTER 5 NUMERICAL EVALUATION OF DYNAMIC RESPONSE Analytcal soluton s usually not possble when exctaton vares arbtrarly wth tme or f the system s nonlnear. Such problems can be solved by numercal tmesteppng
Department of Statistics University of Toronto STA305H1S / 1004 HS Design and Analysis of Experiments Term Test - Winter Solution
 Department of Statstcs Unversty of Toronto STA35HS / HS Desgn and Analyss of Experments Term Test - Wnter - Soluton February, Last Name: Frst Name: Student Number: Instructons: Tme: hours. Ads: a non-programmable
January Examinations 2015
 24/5 Canddates Only January Examnatons 25 DO NOT OPEN THE QUESTION PAPER UNTIL INSTRUCTED TO DO SO BY THE CHIEF INVIGILATOR STUDENT CANDIDATE NO.. Department Module Code Module Ttle Exam Duraton (n words)
[The following data appear in Wooldridge Q2.3.] The table below contains the ACT score and college GPA for eight college students.
![[The following data appear in Wooldridge Q2.3.] The table below contains the ACT score and college GPA for eight college students.](/thumbs/87/96001374.jpg "[The following data appear in Wooldridge Q2.3.] The table below contains the ACT score and college GPA for eight college students.") PPOL 59-3 Problem Set Exercses n Smple Regresson Due n class /8/7 In ths problem set, you are asked to compute varous statstcs by hand to gve you a better sense of the mechancs of the Pearson correlaton
PPOL 59-3 Problem Set Exercses n Smple Regresson Due n class /8/7 In ths problem set, you are asked to compute varous statstcs by hand to gve you a better sense of the mechancs of the Pearson correlaton
Here is the rationale: If X and y have a strong positive relationship to one another, then ( x x) will tend to be positive when ( y y)
 will tend to be positive when ( y y)") Secton 1.5 Correlaton In the prevous sectons, we looked at regresson and the value r was a measurement of how much of the varaton n y can be attrbuted to the lnear relatonshp between y and x. In ths secton,
Secton 1.5 Correlaton In the prevous sectons, we looked at regresson and the value r was a measurement of how much of the varaton n y can be attrbuted to the lnear relatonshp between y and x. In ths secton,
2016 Wiley. Study Session 2: Ethical and Professional Standards Application
 6 Wley Study Sesson : Ethcal and Professonal Standards Applcaton LESSON : CORRECTION ANALYSIS Readng 9: Correlaton and Regresson LOS 9a: Calculate and nterpret a sample covarance and a sample correlaton
UNIVERSITY OF TORONTO Faculty of Arts and Science. December 2005 Examinations STA437H1F/STA1005HF. Duration - 3 hours
 UNIVERSITY OF TORONTO Faculty of Arts and Scence December 005 Examnatons STA47HF/STA005HF Duraton - hours AIDS ALLOWED: (to be suppled by the student) Non-programmable calculator One handwrtten 8.5'' x
Week3, Chapter 4. Position and Displacement. Motion in Two Dimensions. Instantaneous Velocity. Average Velocity
 Week3, Chapter 4 Moton n Two Dmensons Lecture Quz A partcle confned to moton along the x axs moves wth constant acceleraton from x =.0 m to x = 8.0 m durng a 1-s tme nterval. The velocty of the partcle
CIS526: Machine Learning Lecture 3 (Sept 16, 2003) Linear Regression. Preparation help: Xiaoying Huang. x 1 θ 1 output... θ M x M
 Linear Regression. Preparation help: Xiaoying Huang. x 1 θ 1 output... θ M x M") CIS56: achne Learnng Lecture 3 (Sept 6, 003) Preparaton help: Xaoyng Huang Lnear Regresson Lnear regresson can be represented by a functonal form: f(; θ) = θ 0 0 +θ + + θ = θ = 0 ote: 0 s a dummy attrbute
CIS56: achne Learnng Lecture 3 (Sept 6, 003) Preparaton help: Xaoyng Huang Lnear Regresson Lnear regresson can be represented by a functonal form: f(; θ) = θ 0 0 +θ + + θ = θ = 0 ote: 0 s a dummy attrbute
Basic Statistical Analysis and Yield Calculations
 October 17, 007 Basc Statstcal Analyss and Yeld Calculatons Dr. José Ernesto Rayas Sánchez 1 Outlne Sources of desgn-performance uncertanty Desgn and development processes Desgn for manufacturablty A general
Monte Carlo Simulation and Generation of Random Numbers
 S-7.333 Postgraduate Course n Radocommuncatons Sprng 000 Monte Carlo Smulaton and Generaton of Random umbers Dmtr Foursov Dmtr.Foursov@noka.com Contents. Introducton. Prncple of Monte Carlo Smulaton 3.
Chapter 5 Multilevel Models
 Chapter 5 Multlevel Models 5.1 Cross-sectonal multlevel models 5.1.1 Two-level models 5.1.2 Multple level models 5.1.3 Multple level modelng n other felds 5.2 Longtudnal multlevel models 5.2.1 Two-level
CHAPTER 6 GOODNESS OF FIT AND CONTINGENCY TABLE PREPARED BY: DR SITI ZANARIAH SATARI & FARAHANIM MISNI
 CHAPTER 6 GOODNESS OF FIT AND CONTINGENCY TABLE Expected Outcomes Able to test the goodness of ft for categorcal data. Able to test whether the categorcal data ft to the certan dstrbuton such as Bnomal,
Answers Problem Set 2 Chem 314A Williamsen Spring 2000
 Answers Problem Set Chem 314A Wllamsen Sprng 000 1) Gve me the followng crtcal values from the statstcal tables. a) z-statstc,-sded test, 99.7% confdence lmt ±3 b) t-statstc (Case I), 1-sded test, 95%
Global Sensitivity. Tuesday 20 th February, 2018
 Global Senstvty Tuesday 2 th February, 28 ) Local Senstvty Most senstvty analyses [] are based on local estmates of senstvty, typcally by expandng the response n a Taylor seres about some specfc values
4.1. Lecture 4: Fitting distributions: goodness of fit. Goodness of fit: the underlying principle
 Lecture 4: Fttng dstrbutons: goodness of ft Goodness of ft Testng goodness of ft Testng normalty An mportant note on testng normalty! L4.1 Goodness of ft measures the extent to whch some emprcal dstrbuton
Markov Chain Monte Carlo (MCMC), Gibbs Sampling, Metropolis Algorithms, and Simulated Annealing Bioinformatics Course Supplement
, Gibbs Sampling, Metropolis Algorithms, and Simulated Annealing Bioinformatics Course Supplement") Markov Chan Monte Carlo MCMC, Gbbs Samplng, Metropols Algorthms, and Smulated Annealng 2001 Bonformatcs Course Supplement SNU Bontellgence Lab http://bsnuackr/ Outlne! Markov Chan Monte Carlo MCMC! Metropols-Hastngs
Markov Chan Monte Carlo MCMC, Gbbs Samplng, Metropols Algorthms, and Smulated Annealng 2001 Bonformatcs Course Supplement SNU Bontellgence Lab http://bsnuackr/ Outlne! Markov Chan Monte Carlo MCMC! Metropols-Hastngs
Module 3 LOSSY IMAGE COMPRESSION SYSTEMS. Version 2 ECE IIT, Kharagpur
 Module 3 LOSSY IMAGE COMPRESSION SYSTEMS Verson ECE IIT, Kharagpur Lesson 6 Theory of Quantzaton Verson ECE IIT, Kharagpur Instructonal Objectves At the end of ths lesson, the students should be able to:
Errors for Linear Systems
 Errors for Lnear Systems When we solve a lnear system Ax b we often do not know A and b exactly, but have only approxmatons  and ˆb avalable. Then the best thng we can do s to solve ˆx ˆb exactly whch
Simulation and Probability Distribution
 CHAPTER Probablty, Statstcs, and Relablty for Engneers and Scentsts Second Edton PROBABILIT DISTRIBUTION FOR CONTINUOUS RANDOM VARIABLES A. J. Clark School of Engneerng Department of Cvl and Envronmental
ANSWERS CHAPTER 9. TIO 9.2: If the values are the same, the difference is 0, therefore the null hypothesis cannot be rejected.
 ANSWERS CHAPTER 9 THINK IT OVER thnk t over TIO 9.: χ 2 k = ( f e ) = 0 e Breakng the equaton down: the test statstc for the ch-squared dstrbuton s equal to the sum over all categores of the expected frequency
Vapnik-Chervonenkis theory
 Vapnk-Chervonenks theory Rs Kondor June 13, 2008 For the purposes of ths lecture, we restrct ourselves to the bnary supervsed batch learnng settng. We assume that we have an nput space X, and an unknown
As is less than , there is insufficient evidence to reject H 0 at the 5% level. The data may be modelled by Po(2).
.") Ch-squared tests 6D 1 a H 0 : The data can be modelled by a Po() dstrbuton. H 1 : The data cannot be modelled by Po() dstrbuton. The observed and expected results are shown n the table. The last two columns
Ch-squared tests 6D 1 a H 0 : The data can be modelled by a Po() dstrbuton. H 1 : The data cannot be modelled by Po() dstrbuton. The observed and expected results are shown n the table. The last two columns
A Robust Method for Calculating the Correlation Coefficient
 A Robust Method for Calculatng the Correlaton Coeffcent E.B. Nven and C. V. Deutsch Relatonshps between prmary and secondary data are frequently quantfed usng the correlaton coeffcent; however, the tradtonal
ISQS 6348 Final Open notes, no books. Points out of 100 in parentheses. Y 1 ε 2
 ISQS 6348 Fnal Open notes, no books. Ponts out of 100 n parentheses. 1. The followng path dagram s gven: ε 1 Y 1 ε F Y 1.A. (10) Wrte down the usual model and assumptons that are mpled by ths dagram. Soluton:
Chapter 1. Probability
 Chapter. Probablty Mcroscopc propertes of matter: quantum mechancs, atomc and molecular propertes Macroscopc propertes of matter: thermodynamcs, E, H, C V, C p, S, A, G How do we relate these two propertes?
Notes on Frequency Estimation in Data Streams
 Notes on Frequency Estmaton n Data Streams In (one of) the data streamng model(s), the data s a sequence of arrvals a 1, a 2,..., a m of the form a j = (, v) where s the dentty of the tem and belongs to
Statistics II Final Exam 26/6/18
 Statstcs II Fnal Exam 26/6/18 Academc Year 2017/18 Solutons Exam duraton: 2 h 30 mn 1. (3 ponts) A town hall s conductng a study to determne the amount of leftover food produced by the restaurants n the
DETERMINATION OF UNCERTAINTY ASSOCIATED WITH QUANTIZATION ERRORS USING THE BAYESIAN APPROACH
 Proceedngs, XVII IMEKO World Congress, June 7, 3, Dubrovn, Croata Proceedngs, XVII IMEKO World Congress, June 7, 3, Dubrovn, Croata TC XVII IMEKO World Congress Metrology n the 3rd Mllennum June 7, 3,
BOOTSTRAP METHOD FOR TESTING OF EQUALITY OF SEVERAL MEANS. M. Krishna Reddy, B. Naveen Kumar and Y. Ramu
 BOOTSTRAP METHOD FOR TESTING OF EQUALITY OF SEVERAL MEANS M. Krshna Reddy, B. Naveen Kumar and Y. Ramu Department of Statstcs, Osmana Unversty, Hyderabad -500 007, Inda. nanbyrozu@gmal.com, ramu0@gmal.com
Statistical Hypothesis Testing for Returns to Scale Using Data Envelopment Analysis
 Statstcal Hypothess Testng for Returns to Scale Usng Data nvelopment nalyss M. ukushge a and I. Myara b a Graduate School of conomcs, Osaka Unversty, Osaka 560-0043, apan (mfuku@econ.osaka-u.ac.p) b Graduate
The Multiple Classical Linear Regression Model (CLRM): Specification and Assumptions. 1. Introduction
: Specification and Assumptions. 1. Introduction") ECONOMICS 5* -- NOTE (Summary) ECON 5* -- NOTE The Multple Classcal Lnear Regresson Model (CLRM): Specfcaton and Assumptons. Introducton CLRM stands for the Classcal Lnear Regresson Model. The CLRM s also
ECONOMICS 5* -- NOTE (Summary) ECON 5* -- NOTE The Multple Classcal Lnear Regresson Model (CLRM): Specfcaton and Assumptons. Introducton CLRM stands for the Classcal Lnear Regresson Model. The CLRM s also
Copyright 2017 by Taylor Enterprises, Inc., All Rights Reserved. Adjusted Control Limits for P Charts. Dr. Wayne A. Taylor
 Taylor Enterprses, Inc. Control Lmts for P Charts Copyrght 2017 by Taylor Enterprses, Inc., All Rghts Reserved. Control Lmts for P Charts Dr. Wayne A. Taylor Abstract: P charts are used for count data
Limited Dependent Variables
 Lmted Dependent Varables. What f the left-hand sde varable s not a contnuous thng spread from mnus nfnty to plus nfnty? That s, gven a model = f (, β, ε, where a. s bounded below at zero, such as wages
Statistics for Managers Using Microsoft Excel/SPSS Chapter 13 The Simple Linear Regression Model and Correlation
 Statstcs for Managers Usng Mcrosoft Excel/SPSS Chapter 13 The Smple Lnear Regresson Model and Correlaton 1999 Prentce-Hall, Inc. Chap. 13-1 Chapter Topcs Types of Regresson Models Determnng the Smple Lnear
Chapter 5. Solution of System of Linear Equations. Module No. 6. Solution of Inconsistent and Ill Conditioned Systems
 Numercal Analyss by Dr. Anta Pal Assstant Professor Department of Mathematcs Natonal Insttute of Technology Durgapur Durgapur-713209 emal: anta.bue@gmal.com 1 . Chapter 5 Soluton of System of Lnear Equatons
Testing for seasonal unit roots in heterogeneous panels
 Testng for seasonal unt roots n heterogeneous panels Jesus Otero * Facultad de Economía Unversdad del Rosaro, Colomba Jeremy Smth Department of Economcs Unversty of arwck Monca Gulett Aston Busness School
Quantifying Uncertainty
 Partcle Flters Quantfyng Uncertanty Sa Ravela M. I. T Last Updated: Sprng 2013 1 Quantfyng Uncertanty Partcle Flters Partcle Flters Appled to Sequental flterng problems Can also be appled to smoothng problems
Section 8.3 Polar Form of Complex Numbers
 80 Chapter 8 Secton 8 Polar Form of Complex Numbers From prevous classes, you may have encountered magnary numbers the square roots of negatve numbers and, more generally, complex numbers whch are the
Introduction to Generalized Linear Models
 INTRODUCTION TO STATISTICAL MODELLING TRINITY 00 Introducton to Generalzed Lnear Models I. Motvaton In ths lecture we extend the deas of lnear regresson to the more general dea of a generalzed lnear model
Basically, if you have a dummy dependent variable you will be estimating a probability.
 ECON 497: Lecture Notes 13 Page 1 of 1 Metropoltan State Unversty ECON 497: Research and Forecastng Lecture Notes 13 Dummy Dependent Varable Technques Studenmund Chapter 13 Bascally, f you have a dummy
Psychology 282 Lecture #24 Outline Regression Diagnostics: Outliers
 Psychology 282 Lecture #24 Outlne Regresson Dagnostcs: Outlers In an earler lecture we studed the statstcal assumptons underlyng the regresson model, ncludng the followng ponts: Formal statement of assumptons.
Numerical Heat and Mass Transfer
 Master degree n Mechancal Engneerng Numercal Heat and Mass Transfer 06-Fnte-Dfference Method (One-dmensonal, steady state heat conducton) Fausto Arpno f.arpno@uncas.t Introducton Why we use models and
Interval Estimation in the Classical Normal Linear Regression Model. 1. Introduction
 ECONOMICS 35* -- NOTE 7 ECON 35* -- NOTE 7 Interval Estmaton n the Classcal Normal Lnear Regresson Model Ths note outlnes the basc elements of nterval estmaton n the Classcal Normal Lnear Regresson Model
Introduction to Algorithms
 Introducton to Algorthms 6.046J/8.40J Lecture 7 Prof. Potr Indyk Data Structures Role of data structures: Encapsulate data Support certan operatons (e.g., INSERT, DELETE, SEARCH) Our focus: effcency of
Feature Selection: Part 1
 CSE 546: Machne Learnng Lecture 5 Feature Selecton: Part 1 Instructor: Sham Kakade 1 Regresson n the hgh dmensonal settng How do we learn when the number of features d s greater than the sample sze n?
Online Appendix to: Axiomatization and measurement of Quasi-hyperbolic Discounting
 Onlne Appendx to: Axomatzaton and measurement of Quas-hyperbolc Dscountng José Lus Montel Olea Tomasz Strzaleck 1 Sample Selecton As dscussed before our ntal sample conssts of two groups of subjects. Group
Lectures - Week 4 Matrix norms, Conditioning, Vector Spaces, Linear Independence, Spanning sets and Basis, Null space and Range of a Matrix
 Lectures - Week 4 Matrx norms, Condtonng, Vector Spaces, Lnear Independence, Spannng sets and Bass, Null space and Range of a Matrx Matrx Norms Now we turn to assocatng a number to each matrx. We could
DO NOT OPEN THE QUESTION PAPER UNTIL INSTRUCTED TO DO SO BY THE CHIEF INVIGILATOR. Introductory Econometrics 1 hour 30 minutes
 25/6 Canddates Only January Examnatons 26 Student Number: Desk Number:...... DO NOT OPEN THE QUESTION PAPER UNTIL INSTRUCTED TO DO SO BY THE CHIEF INVIGILATOR Department Module Code Module Ttle Exam Duraton
Problem Set 9 Solutions
 Desgn and Analyss of Algorthms May 4, 2015 Massachusetts Insttute of Technology 6.046J/18.410J Profs. Erk Demane, Srn Devadas, and Nancy Lynch Problem Set 9 Solutons Problem Set 9 Solutons Ths problem
STAT 405 BIOSTATISTICS (Fall 2016) Handout 15 Introduction to Logistic Regression
 Handout 15 Introduction to Logistic Regression") STAT 45 BIOSTATISTICS (Fall 26) Handout 5 Introducton to Logstc Regresson Ths handout covers materal found n Secton 3.7 of your text. You may also want to revew regresson technques n Chapter. In ths handout,
STAT 45 BIOSTATISTICS (Fall 26) Handout 5 Introducton to Logstc Regresson Ths handout covers materal found n Secton 3.7 of your text. You may also want to revew regresson technques n Chapter. In ths handout,
Notes prepared by Prof Mrs) M.J. Gholba Class M.Sc Part(I) Information Technology
 M.J. Gholba Class M.Sc Part(I) Information Technology") Inverse transformatons Generaton of random observatons from gven dstrbutons Assume that random numbers,,, are readly avalable, where each tself s a random varable whch s unformly dstrbuted over the range(,).
Inverse transformatons Generaton of random observatons from gven dstrbutons Assume that random numbers,,, are readly avalable, where each tself s a random varable whch s unformly dstrbuted over the range(,).
Exam. Econometrics - Exam 1
 Econometrcs - Exam 1 Exam Problem 1: (15 ponts) Suppose that the classcal regresson model apples but that the true value of the constant s zero. In order to answer the followng questons assume just one
Foundations of Arithmetic
 Foundatons of Arthmetc Notaton We shall denote the sum and product of numbers n the usual notaton as a 2 + a 2 + a 3 + + a = a, a 1 a 2 a 3 a = a The notaton a b means a dvdes b,.e. ac = b where c s an
ECONOMETRICS - FINAL EXAM, 3rd YEAR (GECO & GADE)
") ECONOMETRICS - FINAL EXAM, 3rd YEAR (GECO & GADE) June 7, 016 15:30 Frst famly name: Name: DNI/ID: Moble: Second famly Name: GECO/GADE: Instructor: E-mal: Queston 1 A B C Blank Queston A B C Blank Queston
ECONOMETRICS - FINAL EXAM, 3rd YEAR (GECO & GADE) June 7, 016 15:30 Frst famly name: Name: DNI/ID: Moble: Second famly Name: GECO/GADE: Instructor: E-mal: Queston 1 A B C Blank Queston A B C Blank Queston
Grover s Algorithm + Quantum Zeno Effect + Vaidman
 Grover s Algorthm + Quantum Zeno Effect + Vadman CS 294-2 Bomb 10/12/04 Fall 2004 Lecture 11 Grover s algorthm Recall that Grover s algorthm for searchng over a space of sze wors as follows: consder the
Chapter 8 Indicator Variables
 Chapter 8 Indcator Varables In general, e explanatory varables n any regresson analyss are assumed to be quanttatve n nature. For example, e varables lke temperature, dstance, age etc. are quanttatve n
Kernel Methods and SVMs Extension
 Kernel Methods and SVMs Extenson The purpose of ths document s to revew materal covered n Machne Learnng 1 Supervsed Learnng regardng support vector machnes (SVMs). Ths document also provdes a general
Uncertainty in measurements of power and energy on power networks
 Uncertanty n measurements of power and energy on power networks E. Manov, N. Kolev Department of Measurement and Instrumentaton, Techncal Unversty Sofa, bul. Klment Ohrdsk No8, bl., 000 Sofa, Bulgara Tel./fax:
Inference from Data Partitions
 Inference from Data Parttons Rcardo Bórquez and Melvn Hnch May 18, 2010 1 Introducton Consder a statonary process X = {X t, t = 1, 2,..., T } defned on (Ω, F, {F t }, P ) where F denotes the Borel sets,
Exercises. 18 Algorithms
 18 Algorthms Exercses 0.1. In each of the followng stuatons, ndcate whether f = O(g), or f = Ω(g), or both (n whch case f = Θ(g)). f(n) g(n) (a) n 100 n 200 (b) n 1/2 n 2/3 (c) 100n + log n n + (log n)
Convergence of random processes
 DS-GA 12 Lecture notes 6 Fall 216 Convergence of random processes 1 Introducton In these notes we study convergence of dscrete random processes. Ths allows to characterze phenomena such as the law of large