Temporal eigenfunction methods for multiscale analysis of community composition and other multivariate data
|
|
|
- Erica Wilkerson
- 6 years ago
- Views:
Transcription
1 Temporal eigenfunction methods for multiscale analysis of community composition and other multivariate data Pierre Legendre Département de sciences biologiques Université de Montréal Time-series in marine science and applications for industry A Europole Mer Gordon-like conference at the crossroad of marine sciences Centre nautique de Moulin Mer, Brittany, September 17-21, 2012
2 Outline of the talk 1. Motivation 2. Variation partitioning 3. Multi-scale analysis The dbmem method Simulation study (summary) 4. Applications to real ecological data 5. Recent developments: MEM, AEM 6. R packages and functions
3 Setting the stage Ecologists want to understand and model temporal community structures through the analysis of species assemblages. Species assemblages are the best response variable available to estimate the impact of [anthropogenic] changes in ecosystems. Difficulty: species assemblages form multivariate data tables (sites x species).
4 Setting the stage Ecologists want to understand and model temporal community structures through the analysis of species assemblages. Species assemblages are the best response variable available to estimate the impact of [anthropogenic] changes in ecosystems. Difficulty: species assemblages form multivariate data tables (sites x species). Temporal structures in communities indicate that some process has been at work to create them. Two families of mechanisms can generate temporal structures in response data, e.g. communities. Illustration =>
5
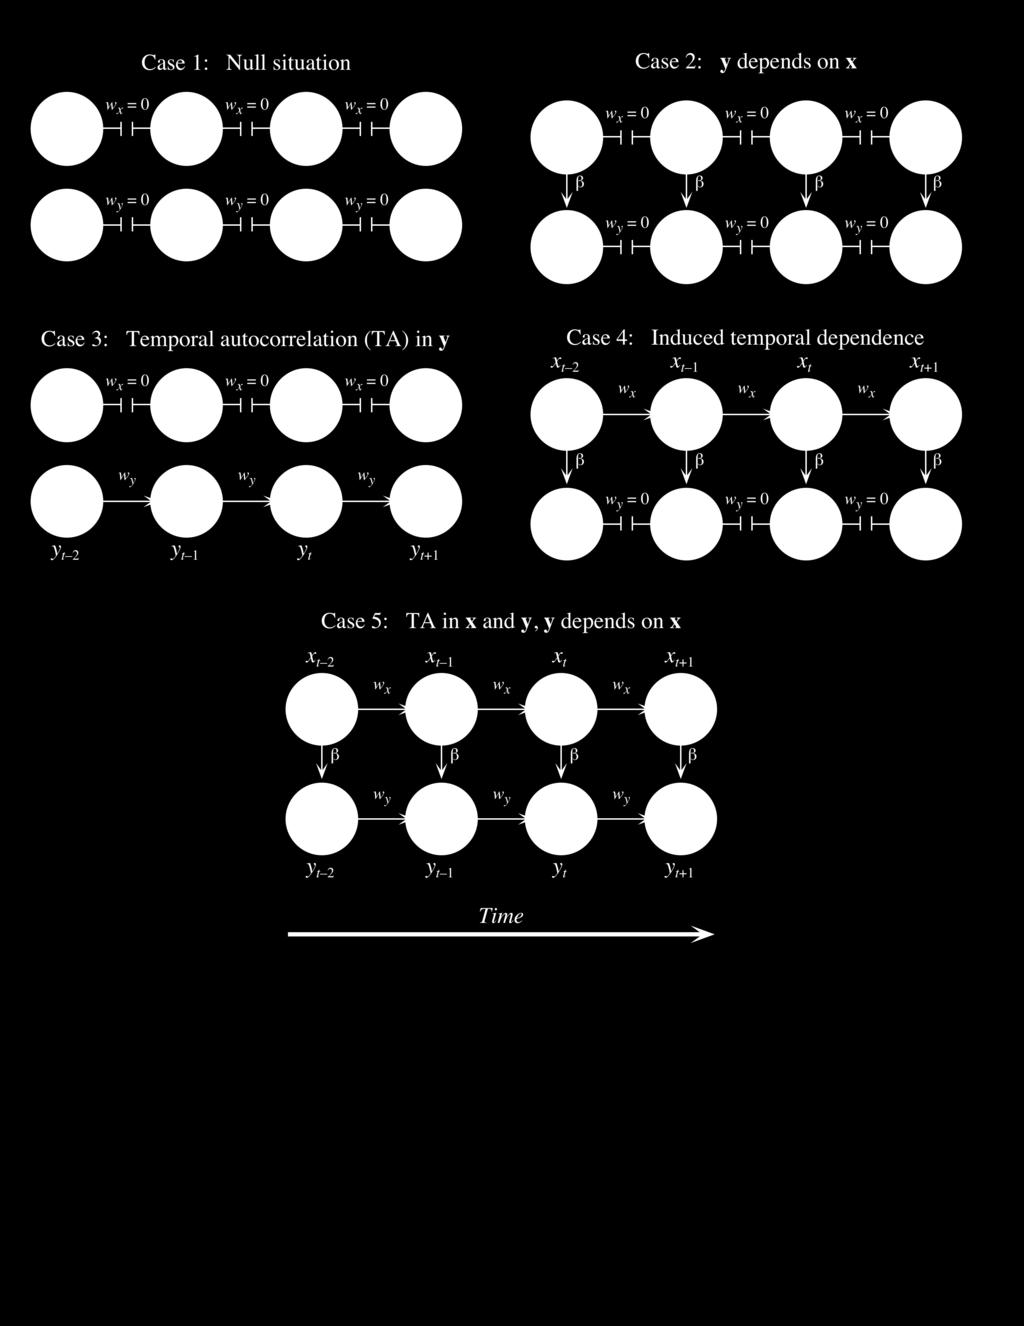
6 Temporal structures in communities indicate that some process has been at work to create them. Two families of mechanisms can generate temporal structures in communities: Induced time dependence: forcing (explanatory) variables are responsible for the temporal structures found in the species assemblage. They represent environmental or biotic control of the assemblages. Generally broad-scaled. Community dynamics: the temporal structures are generated by the species assemblage themselves, creating autocorrelation 1 in the response variables (species). Mechanisms: neutral processes such as reproductive dynamics, interactions among species, and random events. Temporal structures are generally fine-scaled. 1 Temporal autocorrelation (SA) is technically defined as the dependence, due to temporal proximity, present in the residuals of a [regression-type] model of a response variable y that takes into account all deterministic effects due to forcing variables. Model: y i = f(x i ) + SA i + ε i.

7 Multivariate variation partitioning Borcard & Legendre 1992 [1367 citations] Borcard & Legendre 1994 and many published application papers
8 Environmental data matrix X Spatial data matrix W Community composition data table Y = [a] [b] [c] [d] = Residuals Figure Venn diagram illustrating a partition of the variation of a response matrix Y (e.g., community composition data) between environmental (matrix X) and spatial (matrix W) explanatory variables. The rectangle represents 100% of the variation of Y. Method described in: Borcard, Legendre & Drapeau 1992, Borcard & Legendre 1994; Legendre & Legendre 2012.
9 How to combine environmental and spatial variables in modeling community composition data? A single response variable: partial multiple regression. Response variable Explanatory table Explanatory table Environmental data matrix X Spatial data matrix W y X Environmental variables W Spatial base functions [a] [b] [c] [d] = Residuals Partial multiple regression is computed as follows: 1. Compute the residuals X res of the regression of X on W: X res = X [W [W'W] 1 W' X] 2. Regress y on X res
10 How to combine environmental and spatial variables in modelling community composition data? Multivariate data: partial canonical analysis (RDA or CCA). Response table Explanatory table Explanatory table Environmental data matrix X Spatial data matrix W Y Community composition data X Environmental variables W Spatial base functions [a] [b] [c] [d] = Residuals Partial canonical analysis is computed as follows: 1. Compute the residuals X res of the regression of X on W: X res = X [W [W'W] 1 W' X] 2. Regress Y on X res to obtain Y fit. Compute PCA of Y fit.
11 Geographic base functions First (simple) representation: Polynomial function of geographic coordinates (polynomial trend-surface analysis). Example 1: 20 sampling sites in the Thau lagoon, southern France. ^ z = f(x,y) = b 0 + b 1 X + b 2 Y + b 3 X 2 + b 4 XY + b 5 Y 2 + b 6 X 3 + b 7 X 2 Y + b 8 XY 2 + b 9 Y 3
12 Small textbook example: 20 sampling sites in the Thau lagoon, southern France. Response (Y): 2 types of aquatic heterotrophic bacteria (log-transf.) Environmental (X): NH 4, phaeopigments, bacterial production Spatial (W): selected geographic monomials X 2, X 3, X 2 Y, XY 2, Y 3 In real-life studies, partitioning is carried out on larger data sets.
13 Environmental matrix X Spatial matrix W [b] [c] [a] [d]=0.373 Fractions Proportion of Probability Adjusted of variation variation of Y (R 2 ) (999 perm.) R 2 [a+b] * [b+c] * [a+b+c] * [a] !! [b] Cannot be tested [c] * Residuals = [d] [a+b+c+d]
14
15 Temporal eigenfunctions Second representation: Distance-based Moran s eigenvector maps (dbmem) alias Principal Coordinates of Neighbor Matrices (PCNM) leading to multiscale analysis in variation partitioning Borcard & Legendre 2002, 2004 Dray, Legendre & Peres-Neto 2006
16 PCOORD PCOORD !0.4! ! !0.4!0.8 PCOORD !0.4 PCOORD !0.4!0.8 PCOORD !0.05!0.10 PCOORD PCOORD PCOORD ! !0.04!1.0!0.08 Figure Eight of the 67 orthogonal PCNM eigenfunctions obtained for 100 equallyspaced points along a transect or time series. Truncation at first-neighbour distance.
17 Observed variable y Data x (spatial coordinates) Euclidean distances n Truncated matrix of Euclidean distances = neighbor matrix 1...max 1...max 1...max 1...max Max x max 1...max 1...max 1...max 1...max 1...max 1 Multiple regression or canonical analysis Principal coordinate analysis Y X(+) + 0 Eigenvectors with positive eigenvalues = PCNM variables Eigenvectors Figure Schematic description of dbmem analysis. The descriptors of spatial or temporal relationships (dbmem eigenfunctions) are obtained by principal coordinate analysis of a truncated matrix of Euclidean distances among the sampling units.
18 dbmem eigenfunctions display autocorrelation An autocorrelation coefficient (Moran s I) can be computed for each dbmem. They indicate the sign of the autocorrelation (+ or ) modelled by the dbmems. Ex.100-point transect, 67 dbmems shown:
19 How to find the truncation distance in 2-dimensional spatial problems?
20 Spatial data: compute a minimum spanning tree Truncation distance length of the longest edge. Longest edge here: D(7, 8) = Irregular time series: truncation distance length of longest edge.
21 Technical notes on dbmem eigenfunctions dbmem variables represent a spectral decomposition of the spatial/ temporal relationships among the study sites. They can be computed for regular or irregular sets of points in space or time. dbmem eigenfunctions are orthogonal. If the sampling design is regular, they look like sine waves; this is a property of the eigendecomposition of the centred form of a distance matrix. If the design is irregular, the sine waves are distorted.
22 Simulation study Type I error study Simulations showed that the procedure is honest. It does not generate more significant results that it should for a given significance level α. Power study Simulations showed that dbmem analysis is capable of detecting spatial structures of many kinds: random autocorrelated data, bumps and sine waves of various sizes, without or with random noise, representing deterministic structures, as long as the structures are larger than the truncation value used to create the dbmem eigenfunctions. Detailed results are found in Borcard & Legendre 2002.
23 A difficult test case Dependent variable !2 02!4! Transect coordinates
24 A difficult test case 3 a) Linear trend (12.1%) b) Normal patch (6.3%) !1!2!3 c) 4 waves (13.9%) e) Random autocorrelated deviates (8.9%) +!1!2 2 d) 17 waves (8.0%) f) Random normal deviates (50.8%) 4 2!2 0!4!6!8 Dependent variable g) Data (100.0%)!2 02!4!6 = Transect coordinates
25 Dependent variable!2 02!4!6 A difficult test case g) Data (100%) Simulated data 4 0!4!8 8 h) Detrended data Step 1: detrending 6 i) Spatial model with 8 PCNM base functions 4 (R 2 = 0.433) 2 0!2!4 PCNM analysis of detrended data 1,5 j) Broad-scale submodel (R 2 = 0.058) PCNM #2 1,0 0,5 0,0!0,5!1,0 4 3 k) Intermediate-scale submodel (R 2 = 0.246) 2 PCNM #6, 8, !1!2 3 l) Fine-scale submodel (R 2 = 0.128) 2 PCNM #28, 33, 35, !1!2!3
26 !2!4 Data a) 1 patch + 4 waves + 17 waves + rand. autocorr. + A difficult test case 6 b) Spatial model of detrended data 4 2 0!2!4 r = Model c) Random normal variate 4!2 0 2!4!6!8 r = d) Residuals of spatial model 4!2 0 2!4!6!8 = = 8 e) Detrended data 4 0!4!8
27 Selection of explanatory variables? Significance of the adjustment of a dbmem model can be tested using the full set of dbmem variables modelling positive spatial/temporal correlation, without selection of any kind. The adjusted R 2 gives a correct estimate of the variation explained by the dbmems by correcting for the number of sampling units (n) and the number of explanatory variables in the model. 1 Before constructing submodels, forward selection of dbmems can be carried out by combining two criteria during model selection: the alpha significance level and the adjusted R 2 of the model containing all dbmem eigenfunctions. 2 1 Peres-Neto, P. R., P. Legendre, S. Dray and D. Borcard Variation partitioning of species data matrices: estimation and comparison of fractions. Ecology 87: Blanchet F. G., P. Legendre and D. Borcard Forward selection of explanatory variables. Ecology 89:
28 Example 1 Regular one-dimensional transect in upper Amazonia 1 Data: abundance of the fern Adiantum tomentosum in quadrats. Sampling design: 260 adjacent, square (5 m x 5 m) subplots forming a transect in the region of Nauta, Peru. Questions At what spatial scales is the abundance of this species structured? Are these scales related to those of the environmental variables? Pre-treatment The abundances were square-root transformed and detrended (significant linear trend: R 2 = 0.102, p = 0.001) 1 Data from Tuomisto & Poulsen 2000, reanalysed in Borcard, Legendre, Avois-Jacquet & Tuomisto 2004.
29 Forward selection 50 PCNM eigenfunctions were selected out of 176 (permutation test, 999 permutations). The PCNMs were arbitrarily divided into 4 submodels. The submodels are orthogonal to one another. Significant wavelengths (periodogram analysis): V-br-scale: 250, m Broad-scale: 180 m Medium-scale: 90 m Fine-scale: 50, 65 m 3 (a) R 2 Data = PCNM model (50 significant PCNMs out of 176) ,5 (b) Very-broad-scale submodel, 10 PCNMs, R2 = ,5 0-0,5-1 -1, ,5 1 (c) Medium-scale submodel, 12 PCNMs, R2 = ,5 0-0,5-1 -1, ,5 1 0,5 0-0,5-1 -1,5 Broad-scale submodel, 8 PCNMs, R2 = (d) Fine-scale submodel, 20 PCNMs, R2 =
30 Interpretation: regression on the environmental variables Adiantum tomentosum Very broad Broad Medium Fine R 2 of PCNM submodel on A. tomentosum R 2 of envir. on submodel R 2 of envir. on A. tomentosum Elevation (m) Thickness of soil organic horizon (cm) Waterlogging Canopy height (m) Canopy coverage (%) Shrub coverage (%) Herb coverage (%) Trees cm DBH Lianas cm diameter Lianas 8-15 cm diameter < < < < <
31 Use PCNM in variation partitioning: Adiantum tomentosum at Nauta, Peru (R 2 a ).
32 Example 2 Temporal structure in a multivariate sediment core 1 Data: the Round Loch of Glenhead (RLGH) fossil data. 139 Holocene diatom taxa in 101 levels of a sediment core from a small lake in Galloway, S-W Scotland. The data series covers the past years. Level no. 1 is the top (most recent), no. 101 is the oldest. 1 Legendre, P. and H. J. B. Birks From classical to canonical ordination. Chapter 8 in: Tracking Environmental Change using Lake Sediments, Volume 5: Data handling and numerical techniques. Birks, Lotter, Juggins and Smol [eds.]. Springer, The Netherlands.
33 Analysis of RLGH data Linear trend in the multivariate data: R 2 = Temporal model of detrended data: 50 dbmem variables; 30 were selected for modelling. Broad-scale submodel (dbmem #1-10): R 2 = 0.530, 3 significant axes Medium-scale submodel (dbmem #11-20): R 2 = 0.182, 1 significant axis Fine-scale submodel (10 dbmem from #28-45): R 2 = 0.079, model not significant => The diatom species that were positively or negatively correlated with each canonical axis are identified in the publication.
34 Submodel 1 Can. axis 1 Submodel 1 Can. axis 2 Submodel 1 Can. axis 3 Submodel 2 Can. axis (a) Canonical axis 1 of submodel 1: 24.9% of detrended diatom variance (P = 0.001, 999 perm.) Core sections (b) Canonical axis 2 of submodel 1: 16.2% of detrended diatom variance (P = 0.001, 999 perm.) Core sections (c) Canonical axis 3 of submodel 1: 6.1% of detrended diatom variance (P = 0.001, 999 perm.) Core sections (d) Canonical axis 1 of submodel 2: 13.0% of detrended diatom variance (P = 0.001, 999 perm.) Core sections
35 How to use dbmem eigenfunctions? a) We proceeded as follows in the first example: dbmem analysis of the response table Y; Division of the significant eigenfunctions into submodels; Interpretation of the submodels using explanatory variables. The objective was to divide the variation of Y into submodels and relate those to explanatory environmental variables. b) dbmem eigenfunctions can also be used in the framework of variation partitioning. The variation of Y is then partitioned with respect to a table of explanatory variables X and (for example) several tables W 1, W 2, W 3, containing dbmem submodels.
36 How to use dbmem eigenfunctions? c) dbmems can efficiently model spatial/temporal structures in data. They can be used to control for autocorrelation in tests of significance of the species-environment relationship (fraction [a]). Peres-Neto, P. R. and P. Legendre Estimating and controlling for spatial structure in the study of ecological communities. Global Ecology and Biogeography 19:

37 Stéphane Dray: generalized MEM analysis The Moran s eigenvector maps (MEM) method is a generalization of dbmems to different types of spatial weights. The result is a set of spatial eigenfunctions, as in dbmem analysis. Eigen-decomposition of a spatial/temporal weighting matrix (SWM) 0/1 connectivity matrix among sampling units Hadamard product Weights applied to link edges 1 Dray, S., P. Legendre, and P. R. Peres-Neto Spatial modelling: a comprehensive framework for principal coordinate analysis of neighbour matrices (PCNM). Ecological Modelling 196:
38 0 d 12 4t 4t D PCNM = d 21 4t 0 0 4t 0 4t d 12 4t 4t D MEM = d 21 4t 4t 4t 4t 4t In classical PCNM, a point is at distance 0 of itself (diagonal values), meaning that it is connected to itself. In MEM, a point is not connected to itself, as in spatial/temporal correlation analysis. The eigenvalues are proportional to Moran s I (the proportionality factor is the sum of the eigenvalues).
39 Other forms of Moran s Eigenvector Maps (MEM) can be created besides dbmem (Dray et al. 2006): Binary MEMs: double-centre matrix A, then compute its eigenvalues and eigenvectors. Replace matrix D by some function of the distances. Replace D by some other weights, e.g. resistance of the landscape in landscape ecology. 0/1 connectivity matrix among sampling units Hadamard product D = Weights applied to link edges

40 Guillaume Blanchet: AEM analysis Asymmetric eigenvector maps (AEM) is a spatial eigenfunction method developed to model multivariate (e.g. species) spatial distributions generated by an asymmetric, directional physical process. 1 AEM can also be applied to time series. 1 Blanchet, F.G., P. Legendre and D. Borcard Modelling directional spatial processes in ecological data. Ecological Modelling 215:
41 Edges (a) N6 N7 N8 (b) E1 E2 E3 E4 E5 E6 E7 A8 N3 E3 E6 N1 N4 E4 E1 N4 Node 0 (origin) E7 N5 E2 N2 E5 E8 Nodes Nodes-by-edges matrix E N N2 (Lake 6) N3 (Lake 3) N4 (Lake 2) N N6 (Lake 1) N7 (Lake 4) N8 (Lake 5) w = vector of weights PCA, SVD or PCoA (c) Y AEM Figures from Legendre & Legendre 2012 Response data Spatial eigenfunctions
42 For 8 nodes, 7 AEM eigenfunctions are produced. Shades of grey represent the values in each eigenvector, from white (largest negative value) to black (largest positive value). Signs are arbitrary; they may be reverted with no consequence for the analysis. AEM 2 AEM 1 AEM 3 Node 0 AEM 4 AEM 5 Node 0 AEM 6 Node 0 Node 0 Node 0 Node 0
43 Three applications of AEM analysis to spatial data Blanchet, F. G., P. Legendre, R. Maranger, D. Monti, and P. Pepin Modeling the effect of directional spatial ecological processes at different scales. Oecologia 166:

44 AEM analysis for a time series Example: 10 sampling units along time, equal spacing Nodes-by-edges matrix E: Nine AEM eigenfunctions are produced by PCA of matrix E 4 AEM model positive temporal correlation 5 AEM model negative temporal correlation
45 Time series represent a form of directional stochastic process. To emphasize the directional nature of the process influencing the data, AEM analysis, which was designed to take trends into account, should be applied to the non-detrended series. MEM analysis can be applied to data series that were detrended to remove the directional component. => By applying both methods to a time series, one can differentiate the directional and non-directional components of variation in a [multivariate] series. => Detrended palaeoecological sediment core data, for example, could be studied by dbmem analysis, and undetrended by AEM analysis.
46 Computer programs in the R statistical language On R-Forge: PCNM package for classical PCNM and dbmem (P. Legendre) AEM package (F. G. Blanchet) spacemaker: an R package to compute dbmem and generalized MEM (D. Dray) packfor: R package for forward selection of explanatory variables (S. Dray) On the CRAN page: vegan package : function varpart for multivariate variation partitioning; pcnm(): construction of classical PCNM eigenfunctions for RDA and CCA; ordistep() and ordir2step(): forward selection of explanatory variables.
47 References, p. 1 Legendre, P. and L. Legendre Multiscale analysis: spatial eigenfunctions. Chapter 14 in: Numerical ecology, 3rd English edition. Elsevier Science BV, Amsterdam. Borcard, D., F. Gillet, and P. Legendre Numerical ecology with R. Use R! series, Springer Science, New York. Papers available in PDF at Blanchet, F. G., P. Legendre, and D. Borcard Modelling directional spatial processes in ecological data. Ecological Modelling 215: Blanchet, F. G., P. Legendre, R. Maranger, D. Monti, and P. Pepin Modelling the effect of directional spatial ecological processes at different scales. Oecologia 166: Borcard, D., P. Legendre, and P. Drapeau Partialling out the spatial component of ecological variation. Ecology 73: Borcard, D., and P. Legendre Environmental control and spatial structure in ecological communities: an example using Oribatid mites (Acari, Oribatei). Environmental and Ecological Statistics 1:
48 References, p. 2 Available in PDF at Borcard, D., and P. Legendre All-scale spatial analysis of ecological data by means of principal coordinates of neighbour matrices. Ecological Modelling 153: Borcard, D., P. Legendre, C. Avois-Jacquet, and H. Tuomisto Dissecting the spatial structure of ecological data at multiple scales. Ecology 85: Dray, S., P. Legendre, and P. Peres-Neto Spatial modelling: a comprehensive framework for principal coordinate analysis of neighbour matrices (PCNM). Ecological Modelling 196: Guénard, G., P. Legendre, D. Boisclair, and M. Bilodeau Assessment of scale-dependent correlations between variables. Ecology 91: Peres-Neto, P. R., and P. Legendre Estimating and controlling for spatial structure in the study of ecological communities. Global Ecology and Biogeography 19: Peres-Neto, P. R., P. Legendre, S. Dray, and D. Borcard Variation partitioning of species data matrices: estimation and comparison of fractions. Ecology 87:
49 The End
Spatial eigenfunction modelling: recent developments
 Spatial eigenfunction modelling: recent developments Pierre Legendre Département de sciences biologiques Université de Montréal http://www.numericalecology.com/ Pierre Legendre 2018 Outline of the presentation
What are the important spatial scales in an ecosystem?
 What are the important spatial scales in an ecosystem? Pierre Legendre Département de sciences biologiques Université de Montréal Pierre.Legendre@umontreal.ca http://www.bio.umontreal.ca/legendre/ Seminar,
Analysis of Multivariate Ecological Data
 Analysis of Multivariate Ecological Data School on Recent Advances in Analysis of Multivariate Ecological Data 24-28 October 2016 Prof. Pierre Legendre Dr. Daniel Borcard Département de sciences biologiques
Community surveys through space and time: testing the space time interaction
 Suivi spatio-temporel des écosystèmes : tester l'interaction espace-temps pour identifier les impacts sur les communautés Community surveys through space and time: testing the space time interaction Pierre
Figure 43 - The three components of spatial variation
 Université Laval Analyse multivariable - mars-avril 2008 1 6.3 Modeling spatial structures 6.3.1 Introduction: the 3 components of spatial structure For a good understanding of the nature of spatial variation,
Community surveys through space and time: testing the space-time interaction in the absence of replication
 Community surveys through space and time: testing the space-time interaction in the absence of replication Pierre Legendre, Miquel De Cáceres & Daniel Borcard Département de sciences biologiques, Université
Partial regression and variation partitioning
 Partial regression and variation partitioning Pierre Legendre Département de sciences biologiques Université de Montréal http://www.numericalecology.com/ Pierre Legendre 2017 Outline of the presentation
Community surveys through space and time: testing the space-time interaction in the absence of replication
 Community surveys through space and time: testing the space-time interaction in the absence of replication Pierre Legendre Département de sciences biologiques Université de Montréal http://www.numericalecology.com/
Supplementary Material
 Supplementary Material The impact of logging and forest conversion to oil palm on soil bacterial communities in Borneo Larisa Lee-Cruz 1, David P. Edwards 2,3, Binu Tripathi 1, Jonathan M. Adams 1* 1 Department
Appendix A : rational of the spatial Principal Component Analysis
 Appendix A : rational of the spatial Principal Component Analysis In this appendix, the following notations are used : X is the n-by-p table of centred allelic frequencies, where rows are observations
VarCan (version 1): Variation Estimation and Partitioning in Canonical Analysis
: Variation Estimation and Partitioning in Canonical Analysis") VarCan (version 1): Variation Estimation and Partitioning in Canonical Analysis Pedro R. Peres-Neto March 2005 Department of Biology University of Regina Regina, SK S4S 0A2, Canada E-mail: Pedro.Peres-Neto@uregina.ca
VarCan (version 1): Variation Estimation and Partitioning in Canonical Analysis Pedro R. Peres-Neto March 2005 Department of Biology University of Regina Regina, SK S4S 0A2, Canada E-mail: Pedro.Peres-Neto@uregina.ca
Should the Mantel test be used in spatial analysis?
 1 1 Accepted for publication in Methods in Ecology and Evolution Should the Mantel test be used in spatial analysis? 3 Pierre Legendre 1 *, Marie-Josée Fortin and Daniel Borcard 1 4 5 1 Département de
Modelling directional spatial processes in ecological data
 ecological modelling 215 (2008) 325 336 available at www.sciencedirect.com journal homepage: www.elsevier.com/locate/ecolmodel Modelling directional spatial processes in ecological data F. Guillaume Blanchet
Estimating and controlling for spatial structure in the study of ecological communitiesgeb_
 Global Ecology and Biogeography, (Global Ecol. Biogeogr.) (2010) 19, 174 184 MACROECOLOGICAL METHODS Estimating and controlling for spatial structure in the study of ecological communitiesgeb_506 174..184
8. FROM CLASSICAL TO CANONICAL ORDINATION
 Manuscript of Legendre, P. and H. J. B. Birks. 2012. From classical to canonical ordination. Chapter 8, pp. 201-248 in: Tracking Environmental Change using Lake Sediments, Volume 5: Data handling and numerical
Use R! Series Editors:
 Use R! Series Editors: Robert Gentleman Kurt Hornik Giovanni G. Parmigiani Use R! Albert: Bayesian Computation with R Bivand/Pebesma/Gómez-Rubio: Applied Spatial Data Analysis with R Cook/Swayne: Interactive
1.3. Principal coordinate analysis. Pierre Legendre Département de sciences biologiques Université de Montréal
 1.3. Pierre Legendre Département de sciences biologiques Université de Montréal http://www.numericalecology.com/ Pierre Legendre 2018 Definition of principal coordinate analysis (PCoA) An ordination method
Analysis of Multivariate Ecological Data
 Analysis of Multivariate Ecological Data School on Recent Advances in Analysis of Multivariate Ecological Data 24-28 October 2016 Prof. Pierre Legendre Dr. Daniel Borcard Département de sciences biologiques
Chapter 11 Canonical analysis
 Chapter 11 Canonical analysis 11.0 Principles of canonical analysis Canonical analysis is the simultaneous analysis of two, or possibly several data tables. Canonical analyses allow ecologists to perform
Bringing multivariate support to multiscale codependence analysis: Assessing the drivers of community structure across spatial scales
 Received: February 7 Accepted: July 7 DOI:./-X. RESEARCH ARTICLE Bringing multivariate support to multiscale codependence analysis: Assessing the drivers of community structure across spatial scales Guillaume
Spatial modelling: a comprehensive framework for principal coordinate analysis of neighbour matrices (PCNM)
") ecological modelling 196 (2006) 483 493 available at www.sciencedirect.com journal homepage: www.elsevier.com/locate/ecolmodel Spatial modelling: a comprehensive framework for principal coordinate analysis
ecological modelling 196 (2006) 483 493 available at www.sciencedirect.com journal homepage: www.elsevier.com/locate/ecolmodel Spatial modelling: a comprehensive framework for principal coordinate analysis
Should the Mantel test be used in spatial analysis?
 Methods in Ecology and Evolution 2015, 6, 1239 1247 doi: 10.1111/2041-210X.12425 Should the Mantel test be used in spatial analysis? Pierre Legendre 1 *, Marie-Josee Fortin 2 and Daniel Borcard 1 1 Departement
Dissimilarity and transformations. Pierre Legendre Département de sciences biologiques Université de Montréal
 and transformations Pierre Legendre Département de sciences biologiques Université de Montréal http://www.numericalecology.com/ Pierre Legendre 2017 Definitions An association coefficient is a function
Modelling the effect of directional spatial ecological processes at different scales
 Oecologia (2011) 166:357 368 DOI 10.1007/s00442-010-1867-y POPULATION ECOLOGY - ORIGINAL PAPER Modelling the effect of directional spatial ecological processes at different scales F. Guillaume Blanchet
Canonical analysis. Pierre Legendre Département de sciences biologiques Université de Montréal
 Canonical analysis Pierre Legendre Département de sciences biologiques Université de Montréal http://www.numericalecology.com/ Pierre Legendre 2017 Outline of the presentation 1. Canonical analysis: definition
Species Associations: The Kendall Coefficient of Concordance Revisited
 Species Associations: The Kendall Coefficient of Concordance Revisited Pierre LEGENDRE The search for species associations is one of the classical problems of community ecology. This article proposes to
Testing the significance of canonical axes in redundancy analysis
 Methods in Ecology and Evolution 2011, 2, 269 277 doi: 10.1111/j.2041-210X.2010.00078.x Testing the significance of canonical axes in redundancy analysis Pierre Legendre 1 *, Jari Oksanen 2 and Cajo J.
MEMGENE package for R: Tutorials
 MEMGENE package for R: Tutorials Paul Galpern 1,2 and Pedro Peres-Neto 3 1 Faculty of Environmental Design, University of Calgary 2 Natural Resources Institute, University of Manitoba 3 Département des
4/2/2018. Canonical Analyses Analysis aimed at identifying the relationship between two multivariate datasets. Cannonical Correlation.
 GAL50.44 0 7 becki 2 0 chatamensis 0 darwini 0 ephyppium 0 guntheri 3 0 hoodensis 0 microphyles 0 porteri 2 0 vandenburghi 0 vicina 4 0 Multiple Response Variables? Univariate Statistics Questions Individual
Multivariate Statistical Analysis
 Multivariate Statistical Analysis Fall 2011 C. L. Williams, Ph.D. Lecture 4 for Applied Multivariate Analysis Outline 1 Eigen values and eigen vectors Characteristic equation Some properties of eigendecompositions
PROJECT PARTNER: PROJECT PARTNER:
 PROJECT TITLE: Development of a Statewide Freshwater Mussel Monitoring Program in Arkansas PROJECT SUMMARY: A large data set exists for Arkansas' large river mussel fauna that is maintained in the Arkansas
-Principal components analysis is by far the oldest multivariate technique, dating back to the early 1900's; ecologists have used PCA since the
 1 2 3 -Principal components analysis is by far the oldest multivariate technique, dating back to the early 1900's; ecologists have used PCA since the 1950's. -PCA is based on covariance or correlation
Algebra of Principal Component Analysis
 Algebra of Principal Component Analysis 3 Data: Y = 5 Centre each column on its mean: Y c = 7 6 9 y y = 3..6....6.8 3. 3.8.6 Covariance matrix ( variables): S = -----------Y n c ' Y 8..6 c =.6 5.8 Equation
REVIEWS. Villeurbanne, France. des Plantes (AMAP), Boulevard de la Lironde, TA A-51/PS2, F Montpellier cedex 5, France. Que bec H3C 3P8 Canada
, Boulevard de la Lironde, TA A-51/PS2, F Montpellier cedex 5, France. Que bec H3C 3P8 Canada") Ecological Monographs, 82(3), 2012, pp. 257 275 Ó 2012 by the Ecological Society of America Community ecology in the age of multivariate multiscale spatial analysis S. DRAY, 1,16 R. PE LISSIER, 2,3 P.
Ecological Monographs, 82(3), 2012, pp. 257 275 Ó 2012 by the Ecological Society of America Community ecology in the age of multivariate multiscale spatial analysis S. DRAY, 1,16 R. PE LISSIER, 2,3 P.
Spatial-scale partitioning of in situ turbulent flow data over a pebble cluster in a gravel-bed river
 WATER RESOURCES RESEARCH, VOL. 43, W03416, doi:10.109/006wr005044, 007 Spatial-scale partitioning of in situ turbulent flow data over a pebble cluster in a gravel-bed river R. W. Jay Lacey, 1 Pierre Legendre,
The discussion Analyzing beta diversity contains the following papers:
 The discussion Analyzing beta diversity contains the following papers: Legendre, P., D. Borcard, and P. Peres-Neto. 2005. Analyzing beta diversity: partitioning the spatial variation of community composition
Analysis of community ecology data in R
 Analysis of community ecology data in R Jinliang Liu ( 刘金亮 ) Institute of Ecology, College of Life Science Zhejiang University Email: jinliang.liu@foxmail.com http://jinliang.weebly.com R packages ###
NONLINEAR REDUNDANCY ANALYSIS AND CANONICAL CORRESPONDENCE ANALYSIS BASED ON POLYNOMIAL REGRESSION
 Ecology, 8(4),, pp. 4 by the Ecological Society of America NONLINEAR REDUNDANCY ANALYSIS AND CANONICAL CORRESPONDENCE ANALYSIS BASED ON POLYNOMIAL REGRESSION VLADIMIR MAKARENKOV, AND PIERRE LEGENDRE, Département
Analyse canonique, partition de la variation et analyse CPMV
 Analyse canonique, partition de la variation et analyse CPMV Legendre, P. 2005. Analyse canonique, partition de la variation et analyse CPMV. Sémin-R, atelier conjoint GREFi-CRBF d initiation au langage
Linear Algebra review Powers of a diagonalizable matrix Spectral decomposition
 Linear Algebra review Powers of a diagonalizable matrix Spectral decomposition Prof. Tesler Math 283 Fall 2016 Also see the separate version of this with Matlab and R commands. Prof. Tesler Diagonalizing
QUANTIFYING PHYLOGENETICALLY STRUCTURED ENVIRONMENTAL VARIATION
 BRIEF COMMUNICATIONS 2647 Evolution, 57(11), 2003, pp. 2647 2652 QUANTIFYING PHYLOGENETICALLY STRUCTURED ENVIRONMENTAL VARIATION YVES DESDEVISES, 1,2 PIERRE LEGENDRE, 3,4 LAMIA AZOUZI, 5,6 AND SERGE MORAND
Community ecology in the age of multivariate multiscale spatial analysis
 TSPACE RESEARCH REPOSITORY tspace.library.utoronto.ca 2012 Community ecology in the age of multivariate multiscale spatial analysis Published version Stéphane Dray Raphaël Pélissier Pierre Couteron Marie-Josée
Multivariate analysis of genetic data: an introduction
 Multivariate analysis of genetic data: an introduction Thibaut Jombart MRC Centre for Outbreak Analysis and Modelling Imperial College London XXIV Simposio Internacional De Estadística Bogotá, 25th July
Species associations
 Species associations Pierre Legendre 1 and F. Guillaume Blanchet 2 1 Département de sciences biologiques, Université de Montréal 2 Department of Renewable Resources, University of Alberta Introduction
VARIATION PARTITIONING OF SPECIES DATA MATRICES: ESTIMATION AND COMPARISON OF FRACTIONS
 Ecology, 87(10), 2006, pp. 2614 2625 Ó 2006 by the Ecological Society of America VARIATION PARTITIONING OF SPECIES DATA MATRICES: ESTIMATION AND COMPARISON OF FRACTIONS PEDRO R. PERES-NETO, 1 PIERRE LEGENDRE,
Linear Algebra review Powers of a diagonalizable matrix Spectral decomposition
 Linear Algebra review Powers of a diagonalizable matrix Spectral decomposition Prof. Tesler Math 283 Fall 2018 Also see the separate version of this with Matlab and R commands. Prof. Tesler Diagonalizing
Ecography. Supplementary material
 Ecography ECOG-02663 Dambros, C. S., Moraris, J. W., Azevedo, R. A. and Gotelli, N. J. 2016. Isolation by distance, not rivers, control the distribution of termite species in the Amazonian rain forest.
4. Ordination in reduced space
 Université Laval Analyse multivariable - mars-avril 2008 1 4.1. Generalities 4. Ordination in reduced space Contrary to most clustering techniques, which aim at revealing discontinuities in the data, ordination
Hierarchical, Multi-scale decomposition of species-environment relationships
 Landscape Ecology 17: 637 646, 2002. 2002 Kluwer Academic Publishers. Printed in the Netherlands. 637 Hierarchical, Multi-scale decomposition of species-environment relationships Samuel A. Cushman* and
Functional Analysis Review
 Outline 9.520: Statistical Learning Theory and Applications February 8, 2010 Outline 1 2 3 4 Vector Space Outline A vector space is a set V with binary operations +: V V V and : R V V such that for all
Mean Ellenberg indicator values as explanatory variables in constrained ordination. David Zelený
 Mean Ellenberg indicator values as explanatory variables in constrained ordination David Zelený Heinz Ellenberg Use of mean Ellenberg indicator values in vegetation analysis species composition observed
Experimental Design and Data Analysis for Biologists
 Experimental Design and Data Analysis for Biologists Gerry P. Quinn Monash University Michael J. Keough University of Melbourne CAMBRIDGE UNIVERSITY PRESS Contents Preface page xv I I Introduction 1 1.1
Comparison of two samples
 Comparison of two samples Pierre Legendre, Université de Montréal August 009 - Introduction This lecture will describe how to compare two groups of observations (samples) to determine if they may possibly
Diversity and composition of termites in Amazonia CSDambros 09 January, 2015
 Diversity and composition of termites in Amazonia CSDambros 09 January, 2015 Put the abstract here Missing code is being cleaned. Abstract Contents 1 Intro 3 2 Load required packages 3 3 Import data 3
1.2. Correspondence analysis. Pierre Legendre Département de sciences biologiques Université de Montréal
 1.2. Pierre Legendre Département de sciences biologiques Université de Montréal http://www.numericalecology.com/ Pierre Legendre 2018 Definition of correspondence analysis (CA) An ordination method preserving
Introduction to ordination. Gary Bradfield Botany Dept.
 Introduction to ordination Gary Bradfield Botany Dept. Ordination there appears to be no word in English which one can use as an antonym to classification ; I would like to propose the term ordination.
Multivariate Statistics 101. Ordination (PCA, NMDS, CA) Cluster Analysis (UPGMA, Ward s) Canonical Correspondence Analysis
 Cluster Analysis (UPGMA, Ward s) Canonical Correspondence Analysis") Multivariate Statistics 101 Ordination (PCA, NMDS, CA) Cluster Analysis (UPGMA, Ward s) Canonical Correspondence Analysis Multivariate Statistics 101 Copy of slides and exercises PAST software download
Multivariate Statistics 101 Ordination (PCA, NMDS, CA) Cluster Analysis (UPGMA, Ward s) Canonical Correspondence Analysis Multivariate Statistics 101 Copy of slides and exercises PAST software download
Unconstrained Ordination
 Unconstrained Ordination Sites Species A Species B Species C Species D Species E 1 0 (1) 5 (1) 1 (1) 10 (4) 10 (4) 2 2 (3) 8 (3) 4 (3) 12 (6) 20 (6) 3 8 (6) 20 (6) 10 (6) 1 (2) 3 (2) 4 4 (5) 11 (5) 8 (5)
Multivariate Analysis of Ecological Data using CANOCO
 Multivariate Analysis of Ecological Data using CANOCO JAN LEPS University of South Bohemia, and Czech Academy of Sciences, Czech Republic Universitats- uric! Lanttesbibiiothek Darmstadt Bibliothek Biologie
Focus was on solving matrix inversion problems Now we look at other properties of matrices Useful when A represents a transformations.
 Previously Focus was on solving matrix inversion problems Now we look at other properties of matrices Useful when A represents a transformations y = Ax Or A simply represents data Notion of eigenvectors,
Hands-on Matrix Algebra Using R
 Preface vii 1. R Preliminaries 1 1.1 Matrix Defined, Deeper Understanding Using Software.. 1 1.2 Introduction, Why R?.................... 2 1.3 Obtaining R.......................... 4 1.4 Reference Manuals
INTRODUCTION TO MULTIVARIATE ANALYSIS OF ECOLOGICAL DATA
 INTRODUCTION TO MULTIVARIATE ANALYSIS OF ECOLOGICAL DATA David Zelený & Ching-Feng Li INTRODUCTION TO MULTIVARIATE ANALYSIS Ecologial similarity similarity and distance indices Gradient analysis regression,
Lecture 2: Diversity, Distances, adonis. Lecture 2: Diversity, Distances, adonis. Alpha- Diversity. Alpha diversity definition(s)
") Lecture 2: Diversity, Distances, adonis Lecture 2: Diversity, Distances, adonis Diversity - alpha, beta (, gamma) Beta- Diversity in practice: Ecological Distances Unsupervised Learning: Clustering, etc
Lecture 2: Diversity, Distances, adonis Lecture 2: Diversity, Distances, adonis Diversity - alpha, beta (, gamma) Beta- Diversity in practice: Ecological Distances Unsupervised Learning: Clustering, etc
Computation. For QDA we need to calculate: Lets first consider the case that
 Computation For QDA we need to calculate: δ (x) = 1 2 log( Σ ) 1 2 (x µ ) Σ 1 (x µ ) + log(π ) Lets first consider the case that Σ = I,. This is the case where each distribution is spherical, around the
4/4/2018. Stepwise model fitting. CCA with first three variables only Call: cca(formula = community ~ env1 + env2 + env3, data = envdata)
") 0 Correlation matrix for ironmental matrix 1 2 3 4 5 6 7 8 9 10 11 12 0.087451 0.113264 0.225049-0.13835 0.338366-0.01485 0.166309-0.11046 0.088327-0.41099-0.19944 1 1 2 0.087451 1 0.13723-0.27979 0.062584
0 Correlation matrix for ironmental matrix 1 2 3 4 5 6 7 8 9 10 11 12 0.087451 0.113264 0.225049-0.13835 0.338366-0.01485 0.166309-0.11046 0.088327-0.41099-0.19944 1 1 2 0.087451 1 0.13723-0.27979 0.062584
Package PVR. February 15, 2013
 Package PVR February 15, 2013 Type Package Title Computes phylogenetic eigenvectors regression (PVR) and phylogenetic signal-representation curve (PSR) (with null and Brownian expectations) Version 0.2.1
Data Mining Techniques
 Data Mining Techniques CS 6220 - Section 3 - Fall 2016 Lecture 12 Jan-Willem van de Meent (credit: Yijun Zhao, Percy Liang) DIMENSIONALITY REDUCTION Borrowing from: Percy Liang (Stanford) Linear Dimensionality
Fuzzy coding in constrained ordinations
 Fuzzy coding in constrained ordinations Michael Greenacre Department of Economics and Business Faculty of Biological Sciences, Fisheries & Economics Universitat Pompeu Fabra University of Tromsø 08005
Dimension Reduction Techniques. Presented by Jie (Jerry) Yu
 Yu") Dimension Reduction Techniques Presented by Jie (Jerry) Yu Outline Problem Modeling Review of PCA and MDS Isomap Local Linear Embedding (LLE) Charting Background Advances in data collection and storage
Dimension Reduction Techniques Presented by Jie (Jerry) Yu Outline Problem Modeling Review of PCA and MDS Isomap Local Linear Embedding (LLE) Charting Background Advances in data collection and storage
6. Spatial analysis of multivariate ecological data
 Université Laval Analyse multivariable - mars-avril 2008 1 6. Spatial analysis of multivariate ecological data 6.1 Introduction 6.1.1 Conceptual importance Ecological models have long assumed, for simplicity,
15 Singular Value Decomposition
 15 Singular Value Decomposition For any high-dimensional data analysis, one s first thought should often be: can I use an SVD? The singular value decomposition is an invaluable analysis tool for dealing
Package mpmcorrelogram
 Type Package Package mpmcorrelogram Title Multivariate Partial Mantel Correlogram Version 0.1-4 Depends vegan Date 2017-11-17 Author Marcelino de la Cruz November 17, 2017 Maintainer Marcelino de la Cruz
Package codep. R topics documented: May 16, Version Date Type Package Title Multiscale Codependence Analysis
 Version 0.9-1 Date 2018-05-16 Type Package Title Multiscale Codependence Analysis Package codep May 16, 2018 Author Guillaume Guenard and Pierre Legendre, Bertrand Pages Maintainer Guillaume Guenard
Structure in Data. A major objective in data analysis is to identify interesting features or structure in the data.
 Structure in Data A major objective in data analysis is to identify interesting features or structure in the data. The graphical methods are very useful in discovering structure. There are basically two
Multivariate Statistics Fundamentals Part 1: Rotation-based Techniques
 Multivariate Statistics Fundamentals Part 1: Rotation-based Techniques A reminded from a univariate statistics courses Population Class of things (What you want to learn about) Sample group representing
Multivariate Statistics Summary and Comparison of Techniques. Multivariate Techniques
 Multivariate Statistics Summary and Comparison of Techniques P The key to multivariate statistics is understanding conceptually the relationship among techniques with regards to: < The kinds of problems
Unsupervised Machine Learning and Data Mining. DS 5230 / DS Fall Lecture 7. Jan-Willem van de Meent
 Unsupervised Machine Learning and Data Mining DS 5230 / DS 4420 - Fall 2018 Lecture 7 Jan-Willem van de Meent DIMENSIONALITY REDUCTION Borrowing from: Percy Liang (Stanford) Dimensionality Reduction Goal:
Pollution Sources Detection via Principal Component Analysis and Rotation
 Pollution Sources Detection via Principal Component Analysis and Rotation Vanessa Kuentz 1 in collaboration with : Marie Chavent 1 Hervé Guégan 2 Brigitte Patouille 1 Jérôme Saracco 1,3 1 IMB, Université
Lecture 5: Ecological distance metrics; Principal Coordinates Analysis. Univariate testing vs. community analysis
 Lecture 5: Ecological distance metrics; Principal Coordinates Analysis Univariate testing vs. community analysis Univariate testing deals with hypotheses concerning individual taxa Is this taxon differentially
MEMGENE: Spatial pattern detection in genetic distance data
 Methods in Ecology and Evolution 2014, 5, 1116 1120 doi: 10.1111/2041-210X.12240 APPLICATION MEMGENE: Spatial pattern detection in genetic distance data Paul Galpern 1,2 *, Pedro R. Peres-Neto 3, Jean
Data Mining Lecture 4: Covariance, EVD, PCA & SVD
 Data Mining Lecture 4: Covariance, EVD, PCA & SVD Jo Houghton ECS Southampton February 25, 2019 1 / 28 Variance and Covariance - Expectation A random variable takes on different values due to chance The
DOA Estimation using MUSIC and Root MUSIC Methods
 DOA Estimation using MUSIC and Root MUSIC Methods EE602 Statistical signal Processing 4/13/2009 Presented By: Chhavipreet Singh(Y515) Siddharth Sahoo(Y5827447) 2 Table of Contents 1 Introduction... 3 2
VAR Model. (k-variate) VAR(p) model (in the Reduced Form): Y t-2. Y t-1 = A + B 1. Y t + B 2. Y t-p. + ε t. + + B p. where:
 VAR(p) model (in the Reduced Form): Y t-2. Y t-1 = A + B 1. Y t + B 2. Y t-p. + ε t. + + B p. where:") VAR Model (k-variate VAR(p model (in the Reduced Form: where: Y t = A + B 1 Y t-1 + B 2 Y t-2 + + B p Y t-p + ε t Y t = (y 1t, y 2t,, y kt : a (k x 1 vector of time series variables A: a (k x 1 vector
VAR Model (k-variate VAR(p model (in the Reduced Form: where: Y t = A + B 1 Y t-1 + B 2 Y t-2 + + B p Y t-p + ε t Y t = (y 1t, y 2t,, y kt : a (k x 1 vector of time series variables A: a (k x 1 vector
Statistics 910, #5 1. Regression Methods
 Statistics 910, #5 1 Overview Regression Methods 1. Idea: effects of dependence 2. Examples of estimation (in R) 3. Review of regression 4. Comparisons and relative efficiencies Idea Decomposition Well-known
Regression. Oscar García
 Regression Oscar García Regression methods are fundamental in Forest Mensuration For a more concise and general presentation, we shall first review some matrix concepts 1 Matrices An order n m matrix is
Analysis of Multivariate Ecological Data
 Analysis of Multivariate Ecological Data School on Recent Advances in Analysis of Multivariate Ecological Data 24-28 October 2016 Prof. Pierre Legendre Dr. Daniel Borcard Département de sciences biologiques
 https://goo.gl/kfxweg KYOTO UNIVERSITY Statistical Machine Learning Theory Sparsity Hisashi Kashima kashima@i.kyoto-u.ac.jp DEPARTMENT OF INTELLIGENCE SCIENCE AND TECHNOLOGY 1 KYOTO UNIVERSITY Topics:
Announcements (repeat) Principal Components Analysis
 Principal Components Analysis") 4/7/7 Announcements repeat Principal Components Analysis CS 5 Lecture #9 April 4 th, 7 PA4 is due Monday, April 7 th Test # will be Wednesday, April 9 th Test #3 is Monday, May 8 th at 8AM Just hour long
4/7/7 Announcements repeat Principal Components Analysis CS 5 Lecture #9 April 4 th, 7 PA4 is due Monday, April 7 th Test # will be Wednesday, April 9 th Test #3 is Monday, May 8 th at 8AM Just hour long
Lecture 5: Ecological distance metrics; Principal Coordinates Analysis. Univariate testing vs. community analysis
 Lecture 5: Ecological distance metrics; Principal Coordinates Analysis Univariate testing vs. community analysis Univariate testing deals with hypotheses concerning individual taxa Is this taxon differentially
14 Singular Value Decomposition
 14 Singular Value Decomposition For any high-dimensional data analysis, one s first thought should often be: can I use an SVD? The singular value decomposition is an invaluable analysis tool for dealing
Forecasting 1 to h steps ahead using partial least squares
 Forecasting 1 to h steps ahead using partial least squares Philip Hans Franses Econometric Institute, Erasmus University Rotterdam November 10, 2006 Econometric Institute Report 2006-47 I thank Dick van
Principal Component Analysis-I Geog 210C Introduction to Spatial Data Analysis. Chris Funk. Lecture 17
 Principal Component Analysis-I Geog 210C Introduction to Spatial Data Analysis Chris Funk Lecture 17 Outline Filters and Rotations Generating co-varying random fields Translating co-varying fields into
CS168: The Modern Algorithmic Toolbox Lecture #8: How PCA Works
 CS68: The Modern Algorithmic Toolbox Lecture #8: How PCA Works Tim Roughgarden & Gregory Valiant April 20, 206 Introduction Last lecture introduced the idea of principal components analysis (PCA). The
Introduction. Spatial Processes & Spatial Patterns
 Introduction Spatial data: set of geo-referenced attribute measurements: each measurement is associated with a location (point) or an entity (area/region/object) in geographical (or other) space; the domain
Natureza & Conservação Brazilian Journal of Nature Conservation
 NAT CONSERVACAO. 2014; 12(1):42-46 Natureza & Conservação Brazilian Journal of Nature Conservation Supported by O Boticário Foundation for Nature Protection Research Letters Spatial and environmental patterns
Clusters. Unsupervised Learning. Luc Anselin. Copyright 2017 by Luc Anselin, All Rights Reserved
 Clusters Unsupervised Learning Luc Anselin http://spatial.uchicago.edu 1 curse of dimensionality principal components multidimensional scaling classical clustering methods 2 Curse of Dimensionality 3 Curse
Vectors and Matrices Statistics with Vectors and Matrices
 Vectors and Matrices Statistics with Vectors and Matrices Lecture 3 September 7, 005 Analysis Lecture #3-9/7/005 Slide 1 of 55 Today s Lecture Vectors and Matrices (Supplement A - augmented with SAS proc
From spatial ecology to spatial epidemiology: modeling spatial distributions of different cancer types with principal coordinates of neighbor matrices
 Voutilainen et al. Emerging Themes in Epidemiology 2014, 11:11 EMERGING THEMES IN EPIDEMIOLOGY METHODOLOGY Open Access From spatial ecology to spatial epidemiology: modeling spatial distributions of different
A UNIFIED STRATEGY FOR ESTIMATING AND CONTROLLING SPATIAL, TEMPORAL AND PHYLOGENETIC AUTOCORRELATION IN ECOLOGICAL MODELS
 A UNIFIED STRATEGY FOR ESTIMATING AND CONTROLLING SPATIAL, TEMPORAL AND PHYLOGENETIC AUTOCORRELATION IN ECOLOGICAL MODELS Pedro R. Peres-Neto Université du Québec à Montréal. Case postale 8888, succursale
Spectral Methods for Subgraph Detection
 Spectral Methods for Subgraph Detection Nadya T. Bliss & Benjamin A. Miller Embedded and High Performance Computing Patrick J. Wolfe Statistics and Information Laboratory Harvard University 12 July 2010