Guided Wave Structural Health Monitoring using CLoVER Transducer in Composite Plates
|
|
|
- Edgar King
- 6 years ago
- Views:
Transcription
1 5th AIAA/ASME/ASCE/AHS/ASC Structures, Structural Dynamics, and Materials Conference<br>7th 4-7 May 29, Palm Springs, California AIAA th AIAA/ASME/AHS Adaptive Structures Conference, 4-7 May 29, Palm Springs, CA Guided Wave Structural Health Monitoring using CLoVER Transducer in Composite Plates Ken I. Salas and Carlos E. S. Cesnik Department of Aerospace Engineering, The University of Michigan, Ann Arbor, MI, 489, USA The guided wave (GW) field excited by piezoelectric wafers and piezocomposite transducers in carbon-fiber composite materials is experimentally investigated with applications to structural health monitoring. This investigation supports the characterization of the Composite Long-range Variable-direction Emitting Radar (CLoVER) transducer introduced by the authors. A systematic approach is followed where composite configurations with different levels of anisotropy are analyzed. In particular, unidirectional, cross-ply [/9] 6S, and quasi-isotropic [/45/-45/9] 4S IM7-based composite plates are employed. A combination of laser vibrometry and finite element analysis is used to determine the inplane wave speed and peak-to-peak amplitude distribution in each substrate considered. The results illustrate the effect of the material anisotropy on GW propagation through the steering effect where the wave packets do not generally travel along the direction in which they are launched. After characterizing the effect of substrate anisotropy on the GW field, the performance of the CLoVER transducer to detect damage in various composite configurations is explored. It is found that the directionality and geometry of the device is effective in detecting the presence and identifying the location of simulated defects in different composite layups. Nomenclature B Matrix representing the Christoffel equation for anisotropic materials c Matrix of stiffness coefficients for anisotropic material C Constant c g Group velocity E Diagonal matrix E k Axial stiffness along the k th direction f Center frequency of excitation G Shear modulus G Global matrix of wavenumbers h Substrate thickness i n Number of half-cycles in Hann-modulated toneburst signal Q Matrix of eigenvectors r Radial position R p Radius of circular piezoceramic transducer t Time u Displacement vector x, y Cartesian coordinates ɛ kj Strain components (k, j = x, y or r, θ) θ Azimuthal position Graduate Research Assistant, Student Member, AIAA; ksalas@umich.edu; Ph: Professor and Associate Fellow, AIAA; Corresponding Author; cesnik@umich.edu; Ph: ; Fax: of 28 Copyright 29 by Ken I. Salas and Carlos E. S. Cesnik. Published by the, Inc., with permission.
2 ξ ν ρ σ kj φ ω Ω ζ Radial wavenumber Poisson ratio Substrate material density Stress components Azimuthal wavenumber Angular frequency Displacement amplitude vector Through-thickness wavenumbers I. Introduction Composite and multi-layered materials are being increasingly used in engineering applications due to their multiple advantages over traditional metallic materials. Their light weight, directional stiffness, and high specific strength, among other benefits, are being exploited for applications in the aerospace, mechanical, and civil engineering fields. The wider use of these materials has increased the need for effective methodologies to inspect their structural condition in a non-intrusive manner and in a real-time basis. The objective of structural health monitoring (SHM) is to fulfill this need by using an on-board network of transducers to record information on the structure s condition and inform the user of the presence of any damage as well as its location, type, and severity. Among the multiple approaches considered for SHM, guided-wave (GW) methods have received significant attention due to their ability to travel long distances over the surface as well as through the thickness of a material, and their active nature which enables them to be used for inspection on demand. A key feature of this approach is the ability to tailor the sensitivity of the inspection pulse to different defect types, dimensions, and through-thickness location by careful selection of the excitation frequency and transduction mechanism. In typical GW-based SHM systems an inspection pulse is generated using a surface-bonded transducer and the response is recorded using sensors distributed on the structure. By processing these signals with suitable post-processing algorithms, information about the location and severity of any defects can be inferred. Extensive information on this GW approach can be found in the review article by Raghavan and Cesnik. Guo and Cawley 2 were among the first to demonstrate the potential of GW methods for damage detection in composite materials. Their numerical and experimental investigations concentrated on the S mode in cross-plies ([/9] ns ) and determined its effectiveness in detecting interface delaminations. An important finding of their study was the large sensitivity of the reflections on the defect s location through the thickness of the specimens. This highlighted the potential of GW to selectively inspect specific interfaces in multilayered materials by careful control of its through-thickness profile. Several subsequent studies have focused on verifying the viability of the GW approach to detect defects in different configurations using piezoelectric transducers. For instance, Díaz-Valdés and Soutis 3 used piezoelectric elements to detect delaminations in thick composite plate-like structures. In their study they demonstrated the ability of the GW inspection pulses to propagate over two meters and to detect delaminations as small as cm 2. Similarly, Kessler et al. 4 considered the use of Lamb waves for damage detection in quasi-isotropic composites. Their work identified how different inspection parameters such as frequency, pulse shape, and number of cycles affect GW-based damage detection in composites. More recently, Diamanti et al. 5 characterized the effect of defect size on the interaction of the incident GW field with damage in the form of delaminations. The inspection pulse used consisted of a nearly uniform A mode wavefront generated by using a line of piezoceramic wafer transducers aligned along one direction of their specimens. Their results showed that the presence of the defects could be detected, but its extent along the width of their specimens could not be determined. Several studies have also been directed towards assessing the performance of GW methods in damage detection of complex engineering structures in varying environments. For instance, Matt et al. 6 used Macro-Fiber Composite (MFC) transducers for the inspection of bonded composite joints using coupled carrier modes and identified a consistent increase in the energy transmitted through the bond as its strength degraded. Similarly, Bottai et al. 7 successfully used piezoelectric active wafers for damage detection in various composite structures under ambient and cryogenic conditions. Yoo et al. 8 developed new damage metrics based on the Hilbert-Huang transform and successfully applied it in damage detection of curved cylindrical composite panels. A more involved configuration was considered by Castaings and Hosten, 9 who used GW methods to detect moisture content and micro-cracking of carbon-fiber composites wound around 2 of 28
3 titanium liners in high-pressure tanks using air-coupled transducers. From the literature survey conducted it has been observed that most studies have employed simple piezoelectric wafers as the transduction mechanism for online inspection. While these devices are inexpensive and non-intrusive, their brittleness makes them highly susceptible to damage during operation and complicates their attachment to curved surfaces. Similarly, these transducers are only able to induce omnidirectional GW fields. A majority of the studies reported in the literature have employed this type of wavefront, which may be sufficient in cases where one in-plane dimension of the structure is dominant, and only the distance between the defect and the GW source is required. However, for damage detection in two-dimensional structures, more sophisticated methodologies are needed. In the past, these approaches have involved the use of phased array of transducers where virtual scanning beams are generated through post-processing algorithms. For instance, Vishnuvardhan et al. employed a single-transmitter-multiple-receiver transducer array in the inspection of quasi-isotropic plate-like composite structures. The array employed consisted of one emitter and thirty receivers all of which were circular piezoelectric wafers. Their approach utilized a phased addition algorithm accounting for different dispersion characteristics along different material directions, and was successfully used in the detection of delaminations using the S mode. While these methods are able to detect defects, the large number of separate transducers needed could complicate their deployment in actual structures. A second important observation from the literature survey is that most studies have employed a single representative composite lay-up in the numerical and experimental analyses. While this choice is typically sufficient to verify the feasibility of GW-based approaches, it is likely that the complexities of GW propagation in composites will play a critical role in the development of robust algorithms for damage detection and localization. Prominent among these complexities is the steering angle existing between the group and phase velocities for most composite configurations. This phenomenon results in a non-uniform distribution of energy along the propagation direction which, if unaccounted for, could result in an incorrect prediction of damage location. The first objective of this study is to conduct a systematic experimental investigation of the GW propagation characteristics in composite plate-like structures with different levels of material anisotropy. This is accomplished by employing axisymmetric sources in the form of circular piezoelectric wafers. In particular, the wave speed and wave amplitude distribution are measured as a function of in-plane azimuthal position to determine the directionality introduced in the GW field as a result of the composite lay-up. The second objective is to characterize the GW excitation properties of the Composite Long-range Variable-direction Emitting Radar (CLoVER) transducer in composite plates. The CLoVER transducer has been introduced by the authors as an alternative transduction concept for damage interrogation using GW. The device is composed independent wedge-shaped sectors arranged in a ring configuration, and is able to interrogate a complete structural surface for damage from a central location. The directionality of these transducers and their effectiveness in damage detection has been previously shown in metallic structures. 4 The paper begins with a brief review of the theory of GW in composite materials, to illustrate how the changing elastic properties introduce a directional dependence on the wave propagation parameters. The GW field excited by circular piezoelectric wafers is then analyzed through laser vibrometry and finite element simulations to provide a baseline for comparison with the CLoVER transducers. The GW excitation properties of these devices is then analyzed, followed by sample damage detection experiments that illustrate the ability of these transducers to locate defects in plates with various composite lay-ups. II. Theoretical Background This section provides a brief theoretical background of GW propagation in composite plates to illustrate how the varying material properties influence the GW propagation parameters. A key feature of GW is that they are dispersive as different frequency components can travel at different speeds. The most basic analysis of GW propagation, therefore, consists of finding the variation of wave speed with frequency for different modes. In the case of isotropic materials this is a relatively straightforward procedure as the well-known Rayleigh-Lamb dispersion equation can be solved numerically to find the wave speeds. In that case, the dispersion equation is only a function of the material properties, frequency, and plate thickness. In the case of composites, this procedure is significantly more complicated as an explicit relationship cannot be found for all possible laminates. This section will illustrate this procedure for a unidirectional laminate. This part of the analysis is adapted from Auld 5 and Raghavan and Cesnik. 6 The analysis of GW propagation in composites begins using the equilibrium equations in displacement form for a transversely isotropic material: 3 of 28
4 c T u = ρü () where c corresponds to the stiffness matrix for a transversely isotropic material, u corresponds to the displacement vector, ρ represents the material density, and the double dot over a variable indicates the second derivative with respect to time. In this case, the operator is defined as: 6 = x x 3 x 2 x 2 x 3 x 3 x 2 x x (2) In this analysis, x and x 2 represent the in-plane coordinates and x 3 corresponds to the out-of-plane coordinate. At this point a harmonic displacement wave field is assumed in the form: u = Ωe i(ξ x +ξ 2 x 2 +ζx 3 ωt) where Ω corresponds to a 3 x vector of constants, ω represents the frequency, t corresponds to time, and ξ, ξ 2, and ζ correspond to the wavenumbers along the x, x 2, and x 3 directions respectively. The substitution of the assumed displacement field into the equilibrium equations yields an eigenvalue problem where the relationship between the through-thickness wavenumbers, ζ, and the in-plane wavenumbers and frequency is found. The eigenvalue problem is of the form: (3) where the 3 x 3 matrix B is given as: BΩ = (4) B = c ξ 2 + c 55 (ξ2 2 + ζ 2 ) ρω 2 (c 2 + c 55 )ξξ (c 2 + c 55 )ξ ζ (c 2 + c 55 )ξ ξ 2 c 55 ξ 2 + c 22 ξ2 2 + c 44 ζ 2 ρω 2 (c 23 + c 44 )ξ 2 ζ (c 2 + c 55 )ξ ζ (c 23 + c 44 )ξ 2 ζ c 55 ξ 2 + c 44 ξ2 2 + c 22 ζ 2 ρω 2 (5) and where c mn corresponds to the elastic constants for a transversely isotropic material. The matrix given by Eq. (5) is generally referred to as the Christoffel equation for anisotropic materials. By seeking nontrivial solutions to Eq. (5), three pairs of eigenvalues are found for ζ which correspond to quasi-longitudinal, quasi-shear, and pure shear waves. The expressions for these eigenvalues can be found in Raghavan and Cesnik. 6 These eigenvalues, along with the resulting eigenvectors, are used to expand the displacement field in the following manner: u = [ C u e u e iζ x 3 + C2 u e u 2e iζ 2x 3 + C3 u e u 3e iζ 3x 3 + C d e d e iζ x 3 + C2 d e d 2e iζ 2x 3 + C3 d e d 3e iζ 3x 3 ] e i(ξ x +ξ 2 x 2 ωt) (6) The terms Ck u can be thought of as constants associated with upward traveling (through-the-thickness) waves while Ck d are associated with downward traveling waves. The terms e k for k = to 3 correspond to the eigenvectors obtained from the solution of Eq. (5), and the superscripts u and d can also be associated with upward and downward traveling waves, respectively. The specific definition of these values can be found in the work of Raghavan and Cesnik. 6 The displacement field given by Eq. (6) corresponds to a bulk transversely isotropic material of infinite dimensions. In order to seek Lamb-type modes in plate-like structures, the boundary conditions corresponding to free tractions on the upper and lower surface must be enforced. For brevity, only the case of a unidirectional laminate will be shown here. For this case, the origin of the coordinate system will be taken at the top surface of the plate. The displacement field can be written in the form: [ ] [ ] [ ] E u = u C u Q Q 2 e i(ξx+ξ2x2 ωt) (7) E d where the following variables have been defined: [ Q = e u e u 2 e u 3 C d ] [ ; Q 2 = e d e d 2 e d 3 ] (8) 4 of 28
5 E u = e iζ x 3 e iζ2x3 e iζ 3x 3 ; E d = e iζ x 3 e iζ2x3 e iζ 3x 3 (9) The stresses in the material can be found from using a linear strain displacement relationship of the form: ɛ mn = ( um + u ) n () 2 x n x m so that the stresses with out-of-plane components can be expressed as: σ m3 = Q 2 E u C u + Q 22 E d C d () where Q 2 and Q 22 are matrices that depend on the wavenumbers, frequency, and material properties. 6 The traction free conditions on the upper and lower surfaces of the plate can then be enforced as: to produce a system of equations of the following form: [ Q 2 Q 22 Q 2 E u (x 3 = h) Q 22 E d (x 3 = h) σ m3 (x 3 = ) = σ m3 (x 3 = h) = (2) ] [ C u C d ] = (3) In order to avoid obtaining exponential terms with positive real parts, the constant vector C d is premultiplied by E u (x 3 = h) and a restriction is placed on the wavenumbers ζ so that the imaginary part of each of them is always positive. This results in a system of the form: [ ] [ ] [ ] Q 2 Q 22 E u (x 3 = h) C u C = G u = (4) Q 2 E u (x 3 = h) Q 22 from which the in-plane wavenumbers ξ and ξ 2 can be found by imposing the condition: C d C d det G = (5) This procedure is implemented by using a transformation between Cartesian and polar wavenumbers (ξ and φ) of the form ξ = ξ cos φ and ξ 2 = ξ sin φ. In contrast to the isotropic case, the solution of Eq. (5) will be a function of both the radial and azimuthal wavenumbers, which reflects the dependence of the wavenumber on azimuthal position in the plane of the plate. The procedure to determine the wavenumbers for different composite lay-ups is more complicated as interface continuity conditions must be enforced among the different layers. There are different methods to address this as, for example, the global matrix method introduced by Mal. 7 Sample slowness diagrams (inverse of phase velocity) for a unidirectional and cross-ply [/9] 6S laminates are shown in Fig., where the directionality of the wave speeds can be appreciated. These results were generated using the global matrix approach implemented in the software Disperse originally developed at Imperial College, UK. 8 In GW propagation of composites, the slowness diagram, as opposed to the phase velocity diagram, is typically of interest as it indicates the direction in which a GW pulse will propagate. It is well known that in anisotropic materials the phase velocity vector does not generally coincide with the direction along which the energy propagates, which is determined by the group velocity vector. The direction of this vector is always normal to the phase slowness at any given angle. The experimental results presented in subsequent sections will clearly show how this phenomenon affects the propagation of inspection pulses in composite plates with various orientations. III. Experimental Procedures This section describes the details of the experimental procedures followed in the course of this study. In particular, the material system used and the fabrication procedure employed are described. Subsequently, the laser vibrometer system used for the experimental measurements is described and the surface preparation techniques considered to obtain consistent signal-to-noise ratio at all points on the surface of the specimens are discussed. 5 of 28
6 Phase Slowness [s/m] Phase Slowness [s/m] Figure. Phase slowness diagrams for the fundamental antisymmetric (A ) mode for 2-layer unidirectional plate and 2-layer cross-ply [/9] 6S plate at 75 khz. A. Composite Specimens The material system used in this work consists of a unidirectional pre-impregnated composite tape with IM7 fibers and Cycom resin from Cytec Engineered Materials. The tape thickness prior to cure is.25 mm and the fiber volume fraction is.56. As one of the main drivers of the present study is the characterization of GW propagation phenomena as a function of substrate anisotropy, three different composite lay-ups are considered. The first corresponds to a 2-layer unidirectional plate which will be used as the case with the largest anisotropy. The second and third lay-ups correspond to a 2-layer cross-ply [/9] 6S and a 6-layer quasi-isotropic [/45/-45/9] 4S plate which are chosen as they are representative of configurations used in practice. Table. Material properties for IM7/Cycom composite used in the present study. Property Value E 46.9 GPa E GPa G GPa G GPa ν 2.27 The composite plate specimens used were fabricated in-house following the fabrication procedure and cure cycle specified by the manufacturer. In particular, individual layers were placed on a supporting metallic base plate and aligned according to the desired lay-up. Once this process was completed, a second metallic plate was placed on top of the composite layers to ensure a uniform pressure distribution on the surface of the material. Both plates were coated with three to five layers of release agent in advance to prevent the cured composite from permanently attaching to the metallic surface. The entire assembly was covered in a vacuum bag and cured in an autoclave at a pressure of 62 kpa (9 psi) and a temperature of 35 F (77 C) for six hours. In addition, a vacuum of -25 in Hg was maintained while heating and released once the final curing temperature had been reached. The resulting plates had a square in-plane geometry with a side length of.5 m. The unidirectional and cross-ply plates had a post-cured thickness of.5 mm, while the quasi-isotropic specimens had a thickness of 2. mm. In order to generate phase and group velocity diagrams the material properties of the composite are necessary. The mechanical properties provided by the manufacturer were used as a starting point in the analysis, and the values for the modulus along and transverse to the fiber direction were refined with the results obtained through mechanical tests on unidirectional coupon specimens. The material properties used in the present study are summarized in Table. 6 of 28
7 B. Laser Vibrometer The key instrument used in these studies was a Polytec PSV-4 scanning laser vibrometer. This system is composed of the PSV-I-4 scanning head, the OFV-5 controller, the PSV-E-4 junction box, and a data management system. The light source used in the PSV-4 is a helium neon laser that provides a linear polarized beam. 9 The vibrometer system is able to measure the out-of-plane velocities by measuring the difference in path lengths between a reference beam and an object beam that is backscattered from the surface under inspection. The PSV-I-4 scanning head houses a high sensitivity vibrometer sensor, a high precision scan unit, and a color video camera used to manipulate the laser and scan points in the PSV software. The OFV-5 controller is able to decode the interference signal of the object and reference beams, while the PSV-E-4 junction box provides an interface for the scanning head, controller, and data management system as well as several input channels for triggering and signal generator output. Finally, the data management system houses the PSV software used to operate the laser vibrometer. The scanning head was supported using a tripod and maintained at a distance of 95 mm from the scanning surface for most of the experimental tests conducted. This distance was selected to operate at a laser visibility maximum. 9 Wave Speed [m/s] Specimen Specimen 2 No tape Figure 2. Comparison of GW speed measured with and without retro-reflective tape on the surface of a cross-ply [/9] 6S laminate. In order to obtain consistent measurements using laser vibrometry, the surface under inspection must have an adequate finish so as to optimize the laser visibility. During initial tests it was found that it was, in general, possible to measure GW signals with high signal to noise ratios without any preparation on the surface of the composite. However, very small differences in the surface finish from point to point caused the amplitudes and signal to noise ratios to vary significantly, thereby introducing artificial variations in the results measured. Several surface preparation techniques were tested to resolve this problem including sanding and painting the surface using white spray paint, coloring the surface using metallic ink markers, applying retro-reflective glass beads on the surface, and using permanently bonded retro-reflective tape. The first two options did not provide a satisfactory solution to the problem as they were unable to remove minute (less than one mm) thickness variations on the surface of the specimens. The retro-reflective glass beads were obtained from the laser manufacturer and were found to significantly enhance the visibility of the laser at non-cooperative points. However, their uniform application on the surface proved problematic thereby preventing parts of the surface from being fixed. In addition, it was observed that non-uniformities in the thickness of the layer of glass beads applied influenced the amplitude of the signals measured. The retroreflective tape was found to be the best option to resolve the non-cooperative points problem. This tape ( microns in thickness) is specifically designed with the appropriate surface reflectivity and roughness to optimize the visibility of the laser vibrometer. In order to verify that the presence of the tape did not introduce unwanted effects into the propagating GW field, the measured wave velocities were compared before and after the application of the tape for one of the experimental specimens. This result summarized in Fig. 2 shows that the presence of the tape does not influence the GW field at cooperative points. 7 of 28
8 IV. GW Excitation by piezoelectric wafers in composite plates Piezoelectric wafers are the most commonly used transduction devices for GW SHM of both metallic and composite structures, and their GW excitation properties in various composite lay-ups are explored in this section. The main objective is to characterize the GW field induced by a single circular piezoelectric wafer in terms of the azimuthal distribution of the induced wave velocity and amplitude on the surface of the specimens through a combination of laser vibrometry and finite element analysis. These results are complemented with full field visualizations of the radiation patterns which provide important insight into the GW excitation of these devices. At the same time, the axisymmetric nature of the source will provide the necessary wave speed distribution that will be needed for future damage detection experiments. A. Experimental Setup and Data Processing The azimuthal distribution of wave speed and amplitude was obtained as a function of position for several specimens with the three layups under consideration. The scanning grids defined in the laser vibrometer system were composed of four circles located between four and seven centimeters from the origin of the coordinate system (taken to be at the center of the transducer) in intervals of one centimeter, in order to assess the evolution of the speed and amplitude distribution with propagation distance. A total of 2 azimuthal points were used in each grid to provide sufficient resolution of the waves. The values reported correspond to the average of 4 measurements. A schematic of the transducer and laser scan point configuration used in these studies is shown in Fig m side length r θ = Piezoelectric wafer d = 2.7 mm h =.2 mm Composite Substrate Laser scan circles located at r = 4, 5, 6, 7 cm Figure 3. Schematic illustrating the scanning grid used with the laser vibrometer to determine the azimuthal variation of wave speed and peak-to-peak amplitude. The transducer used in this part of the study was a circular piezoelectric wafer with a diameter of 2.7 mm and a thickness (h) of.2 mm bonded at the geometric center of the composite plates. In order to insulate the piezoceramic from the composite material and to provide access to its top and bottom electrodes, two pieces of copper-clad kapton were bonded on its top and bottom surfaces using Loctite E-2HP adhesive system, which was also employed to bond the insulated transducer onto the surface of the composite plate. In order to ensure uniform bonding conditions among all specimens, the cure of the adhesive between the transducer and the plates was performed in an autoclave at a temperature of 8 C and a pressure of 345 kpa (5 psi) for 45 minutes. The excitation input used in all cases throughout this study was a 3.5 Hannmodulated toneburst signal with a center frequency of 75 khz resulting predominantly in the excitation of the fundamental antisymmetric mode, but also exciting antisymmetric components of additional shear modes. Due to the anisotropy of the composite substrate it is possible that more than one mode will contribute to the out of plane velocities recorded by the laser vibrometer at frequencies where only one mode is observed in the isotropic case. As a result, in order to identify each propagating mode the Hilbert transform of the obtained time-domain signals was calculated. This transform takes a real time-domain signal and generates its complex conjugate, such that upon calculation of its absolute value, an envelope of the signal amplitude 8 of 28
9 Signal Amplitude [V] 4 x Time [s] x 4 Hilbert amplitude Raw data Smoothed data Time [s] x 4 Figure 4. Typical time-domain signal collected through laser vibrometer; Hilbert amplitude of the time domain signal both before and after smoothing is applied. is obtained. A sample time-domain signal with the amplitude of its corresponding Hilbert transform is shown in Fig. 4. This method is successful in separating modes traveling at different speeds if a sufficient time difference exists among them. In order to identify the wave speeds, the Hilbert envelope of the signals was passed through a peak-finding algorithm which recorded the value of each peak as well as the times of arrival. The peaks in the Hilbert envelope correspond to the center of the propagating wave packets. The actual wave speed, c g, was found through Eq. (6) by using the location of the measurement point, r, and assuming that the source of the waves occur at the edge of the transducer, R p. Finally, the time of arrival must be adjusted to compensate for one half the period of the excitation pulse as the point being tracked in the signal corresponds to the center of the wave packet. The period of the signal can be found from the number of half-cycles, n, and the center frequency of excitation, f. c g = r R p t peak n 2f (6) While the presence of the retro-reflective tape resulted in signals with high signal to noise ratios, the peak finding algorithm was still sensitive to small variations in the amplitudes of the time-domain signal thereby identifying artificial peaks, as shown in Fig. 4. In order to resolve this, the Hilbert envelope signals were passed through a signal smoothing algorithm where these features were attenuated, while preserving the features associated with the propagating modes. This choice was selected instead of filtering as the latter results in the introduction of a time delay which affects the value of the measured wave velocity. B. Finite Element Simulations A set of finite element simulations was conducted to verify several of the results obtained from laser vibrometry. The material properties in Table were used in this analysis. Due to the geometry of the transducer employed, a combination of wedge-shaped three-dimensional brick (C3D8) and tetrahedron elements (C3D6) were used in the commercial solver Abaqus. 2 The combination of in-plane dimensions of the elements and time step were selected so as to resolve the fastest traveling wave speed in the material, which typically corresponds to the dilatational wave speed along the fiber direction. In particular, the radial dimension of the elements was selected at.25 mm while the azimuthal dimension used was one degree. This radial dimension provided approximately 5 nodes along the smallest wavelength, which was obtained normal to the fiber direction. Similarly, the time step was selected as 7 s which also provided sufficient resolution of the excitation input. In the case of the unidirectional plate, only one eight of the plate was modeled due to in-plane and through-the-thickness symmetry conditions. In particular, antisymmetric conditions were enforced through the thickness to capture only antisymmetric modes. Modeling of the cross-ply plate required a quarter of the plate to be used as antisymmetric conditions cannot be enforced through the thickness due to the symmetry of the layup. Initial convergence studies indicated that using six elements through the thickness 9 of 28
![Wave speed [m/s] 5 2 2 9 2 6 5 5 3 8 33 FEM SH FEM A Laser A Laser SH Peak to peak amplitude 5 2 2 9.6.4.2.8 6 3 8 33 FEM Laser 24 27 3 24 27 3 (c) (d) Figure 5.](/docs-images/72/67040406/images/10-0.jpg "Azimuthal distribution of wave velocity for a 2-layer unidirectional plate at 75 khz; Azimuthal distribution of peak-to-peak amplitude in a 2-layer unidirectional plate")


10 Wave speed [m/s] FEM SH FEM A Laser A Laser SH Peak to peak amplitude FEM Laser (c) (d) Figure 5. Azimuthal distribution of wave velocity for a 2-layer unidirectional plate at 75 khz; Azimuthal distribution of peak-to-peak amplitude in a 2-layer unidirectional plate at 75 khz; Full field visualization of GW excited by a circular piezoelectric wafer in a unidirectional plate at (c) 58 µs (d) 68 µs as measured using laser vibrometry. of the unidirectional plate provided converged results for the wave speed normal to the fiber direction while the rate of change of the speed normal to the fiber direction with increasing elements was nearly constant indicating that convergence had almost being reached. Consequently, this number of elements was selected for the unidirectional plate. In the case of the cross-ply plate, one element was used per layer in the laminate resulting in 2 elements through the thickness of the model. Note that no effective properties were used in the analysis as the engineering constant properties were defined for each material along with the corresponding orientations. The effect of the transducer on the substrate was represented as shear tractions of equal magnitude applied on the surface of the substrate in the radial direction. An implicit dynamic analysis was conducted in Abaqus 2 to ensure the stability of the solution with the parameters indicated above. C. Results and Discussion The results for the wave speed distribution in the unidirectional plate are shown in Fig. 5 in the form of polar plots, where the wave speed is represented by the radial distance from the origin to each point. A comparison between the experimental and numerical results is also provided in the figure. The fiber direction coincides with the -degree direction in the figure. Clearly, the largest wave velocity is observed along the fiber direction for the antisymmetric mode which reduces to approximately half of its value along of 28


 (d) Figure 6.")
11 the direction normal to the fibers. Note also that a second mode is present in the result, which has been identified as the out-of-plane component of a horizontally polarized quasi-shear wave. Note that this coupled mode is not observed along the fiber direction, which corresponds to a principal material direction. The agreement between the numerical simulations and the experimental results is satisfactory along certain azimuthal directions. In particular, the speed of both modes is adequately captured for an azimuthal span of approximately 6 degrees center along 9-degree direction. The agreement between both results deteriorates for azimuthal positions between - and 3-degrees with the numerical simulations significantly over-predicting the wave speeds. The reason for the disagreement along these directions is attributed to differences in the material properties used in the simulations and the actual properties of the specimens tested. As previously indicated, the moduli along and normal to the fiber direction were measured from tension tests, while the shear moduli were taken from the manufacturer data. This hypothesis is supported by the findings reported in Vishnuvardhan et al. where it was shown that the wave speed of the antisymmetric mode was most sensitive to changes in the shear moduli while the symmetric mode was most sensitive to the normal moduli. Therefore, it is possible that small disagreements between the experimental and simulated values would produce noticeable differences in the wave speeds. Wave velocity [m/s] FEM Laser Laser 2 Peak to peak amplitude FEM Laser Laser (c) (d) Figure 6. Azimuthal distribution of wave velocity for a cross-ply [/9] 6S plate at 75 khz; Azimuthal distribution of peak-to-peak amplitude in cross-ply [/9] 6S plate at 75 khz; Full field visualization of GW excited by a circular piezoelectric wafer in a cross-ply [/9] 6S plate at (c) 54 µs (d) 73 µs as measured through laser vibrometry. A similar result for the distribution of peak-to-peak amplitude is presented in Fig. 5, where it can be observed that the largest amplitudes occur along the fiber direction, with the waves propagating along the of 28
12 normal direction being significantly weaker in comparison (smaller by a factor of approximately eight). The agreement of the amplitude distribution between the experimental and numerical results is acceptable, and the simulations confirm that the largest amplitudes are in fact observed along the fiber direction. Note that this has important implications for GW-based inspection as any damage features present along the 9-degree direction, which in this type of laminate is the one most susceptible to damage, will likely be overshadowed by the large amplitude of the waves along the fiber direction. The results also show that the directionality observed for the wave speed is maintained as the waves propagate away from the source. A two-dimensional view of these phenomena is shown in Fig. 5(c)-(d) which shows the radiation pattern of the induced GW field on the surface of the unidirectional plate at different time instants. The piezoelectric wafer used as the source is represented as the light blue circle placed at the origin. Note that, as expected, the wavelength along the zero degree direction is larger than that along the 9-degree direction as a result of the larger wave speed. A similar result for the wave velocity distribution is shown in Fig. 6 for the cross-ply [/9] 6S plates. Note that in this case only one mode is identified using the laser vibrometer, and that the directionality of the wave speed is very small relative to that of the unidirectional plate. Close examination of the distribution shows that the largest speeds are observed along and normal to the fiber direction (a small difference in the order of % was observed between both directions with the larger value along the fiber direction of the top layer), while the lowest speed is observed along the 45-degree direction (the difference is approximately % ). These observations are consistent with the distribution of moduli in the plane of the specimen which has a minimum along the 45-degree direction. Note that there is good qualitative agreement between the laser and numerical results, but the simulations over-predict the wave speeds for all azimuthal positions in this case. Due to the shear moduli affecting other directions once the cross-ply lay-up is assembled, it is likely that the disagreement observed for the unidirectional plate along certain directions has wider effect in this case. The peak-to-peak amplitude distribution is shown in Fig. 6. Based on the distribution of elastic moduli, the largest amplitude would be expected to occur along and normal to the fiber direction. However, the result shows that the largest amplitude occurs normal to the fiber direction on the top layer, being 2% larger than that observed along the fiber direction of the top layer. This indicates that the orientation of the surface on which the transducer is bonded is not likely to bias the group velocity distribution, but will have an effect on the distribution of peak-to-peak amplitude which would in turn be related to the maximum inspection distance attainable. The directionality of the radiation pattern for this composite layup can be observed in Fig. 6(c)-(d) for different time instants. Once again, note that the pattern is not as directional as that observed for the unidirectional plate. The results for the quasi-isotropic [/+45/-45/9] 4S plate are shown in Fig. 7. As in the case of the cross-ply plate, only one mode is observed. Note that the wave velocity distribution shows some degree of directionality, and that no in-plane symmetries are observed. This observation is a result of the configuration of the substrate which provides no in-plane symmetries. Note that the largest speeds are observed near the fiber direction, as expected. The peak-to-peak amplitude distribution is shown in Fig. 7(c)-(d) which again shows some degree of directionality and highlights the lack of symmetry along the ninety- and -degree directions. Note that this propagation pattern is the closest to that observed in isotropic plates when excited by axisymmetric sources. V. GW Excitation by CLoVER Transducers in Composite Plates A. The CLoVER Transducer The CLoVER transducer has been introduced by the authors, 3, 4, 2 as an alternative concept for damage interrogation in GW-based SHM systems. The device is composed of independent anisotropic piezocomposite sectors that induce directional GW fields on the surface where they are bonded. Due to their geometric arrangement, the complete array is able to scan a complete structural surface from a central location. Furthermore, each sector in the CLoVER array may be divided into independent segments, defined as radial subdivisions within any given sector. These subdivisions may be used for modal selectivity or to use both segments within a sector as an actuator and sensor pair. Due to their piezocomposite construction, the CLoVER transducers may also be used as directional sensors as their sensitivity to strains transverse to the piezo-fiber direction is very small. The directionality and ability of the device to detect simulated defects 2, 4 in metallic plates has been previously demonstrated. As previously indicated, the present study aims at experimentally characterizing the GW excitation properties of these devices in composite plates with 2 of 28
![Wave Speed [m/s] 5 2 2 9 5 6 5 3 8 33 Specimen Specimen 2 Peak to Peak Amplitude 5 2 2 9.6.4.2.8 6 3 8 33 Specimen Specimen 2 24 27 3 24 27 3 (c) (d) Figure 7.](/docs-images/72/67040406/images/13-0.jpg "Azimuthal distribution of wave velocity and peak-to-peak amplitude in quasi-isotropic [/45/- 45/9] 4S plates; Full field visualization of GW excited by a circular piezoelectric wafer in a")
![quasi-isotropic [/45/-45/9] 4S plate at (c) 58 µs (d) 78 µs as measured using laser vibrometry. different levels of anisotropy, as determined by the laminate layup.](/docs-images/72/67040406/images/13-1.jpg "The CLoVER transducers used in this study were fabricated in-house following the manufacturing procedure presented earlier by the authors.")


13 Wave Speed [m/s] Specimen Specimen 2 Peak to Peak Amplitude Specimen Specimen (c) (d) Figure 7. Azimuthal distribution of wave velocity and peak-to-peak amplitude in quasi-isotropic [/45/- 45/9] 4S plates; Full field visualization of GW excited by a circular piezoelectric wafer in a quasi-isotropic [/45/-45/9] 4S plate at (c) 58 µs (d) 78 µs as measured using laser vibrometry. different levels of anisotropy, as determined by the laminate layup. The CLoVER transducers used in this study were fabricated in-house following the manufacturing procedure presented earlier by the authors. Two different electrode designs were employed, which will be, 3 referred to as CLoVER and CLoVER 2 and are illustrated in Fig. 8. The electrode design in CLoVER yielded devices with an azimuthal span of 45 degrees, an inner radius of mm, and outer radius of 25 mm. Each sector in this array was divided into two segments, one with an active radius of 5 mm and a second one with an active radius of mm, as shown in Fig. 8. In the experiments that use this device, the active segment with a radial dimension of mm was employed. The electrode design in CLoVER 2 yielded devices with an azimuthal span of 22.5 degrees, an inner radius of 7.5 mm and an outer radius of 25 mm. In this case, the active sectors were also divided into two radial segments with active radii of 2.5 mm and 5 mm, respectively. Similar to the case of CLoVER, only the active segment with a radial dimension of 5 mm was used in this study. In both cases the electrode fingers had a width of. mm and an interdigital finger spacing of.5 mm. The electrode patterns were transferred onto a copper-clad kapton film (Pyralux LF762R) by using a transparency mask and following a standard photolithography process at the Lurie Nanofabrication Facility at the University of Michigan. The final electrodes were obtained by wet etching of the copper in the resulting films. The piezoceramic material employed was PZT-5A which was obtained in rings with inner and outer radii consistent with the electrode designs described previously. These rings were diced into radial fibers with a cut angle of two degrees for CLoVER and one degree for CLoVER 2. 3 of 28


14 Figure 8. CLoVER transducer designs used in the present study CLoVER and CLoVER 2. These angles were chosen so that the width of the fibers at the inner radius position is similar to that used 3, 22 in the prismatic rectangular fibers used in conventional piezoceramic devices. The cure of the device was conducted following a procedure similar to the one described previously by the authors., 3 The poling of the finalized transducers was conducted at a temperature of 5 C and an electric field of 2.92 kv/mm for 3 minutes. B. Experimental results Through the baseline measurements using piezoelectric wafers, the wave velocities corresponding to the fundamental antisymmetric mode were calculated for each composite layup under consideration. Therefore, the characterization of the GW field induced by the CLoVER sectors was conducted based on full field visualizations of the GW radiation pattern induced by each device. The results presented in this section clearly show the steering phenomenon characteristic of GW propagation in anisotropic materials. The unidirectional plate used in this study was instrumented with a CLoVER transducer fabricated with the electrode design defined as CLoVER. Therefore, three sectors with an azimuthal span of 45 degrees each were used to cover only one quarter of the plate due to material in-plane symmetries. The measurement grid used in the laser vibrometer system consisted of 32 circles, each with 8 azimuthal points, centered at the origin of the CLoVER array. The spacing between consecutive circles was selected at two millimeters which was expected to sufficiently resolve the minimum wavelength of the antisymmetric mode at 75 khz ( 9 mm) in the unidirectional plate, which occurs normal to the fiber direction. Note that this also corresponds to the smallest wavelength in all the specimens tested as the normal to the fiber direction in the unidirectional plate has the lowest phase velocity. A total of four averages were taken at each measurement point. In addition, as no wave velocity information was necessary, the resulting time-domain data were passed through a third order band-pass Butterworth filter. Its limits were selected as.7 and.3 times the center frequency. Figure 9 shows the GW field excited by a sector aligned with the fiber direction. Note that the CLoVER transducer has been included in the figure, where the active sector has been highlighted. Note that in this case there is no steering present. This is consistent with the phase slowness diagram which is nearly constant with azimuthal position along the fiber direction, and the phase of the waves is aligned with the fiber direction (the phase of the waves connects the origin with the centerline of the active CLoVER sector), as shown in Fig. 9. Therefore, all waves launched in this region will tend to propagate strictly along the fiber direction. A similar result for the sector aligned with the 45-degree direction is shown in Fig.. Note that in this case the steering phenomenon is clearly visible, and can be explained by considering the phase slowness diagram shown in Fig.. Along the 45-degree direction, the normal vector to the slowness surface points nearly along the horizontal direction indicating that this is the direction in which the wave packet will propagate. However, the phase of the waves is now parallel to the 45-degree direction so that relative to the phase of the wave its propagation direction is steered. Finally, the radiation pattern obtained when the sector aligned with the 9-degree direction is used is 4 of 28
![2 9.2.5 6 5. 3 Phase Slowness [s/m].](/docs-images/72/67040406/images/15-0.jpg "5 Group 8 Phase 2 33 24 27 3 Figure 9.")


15 Phase Slowness [s/m].5 Group 8 Phase Figure 9. Steering expected when using a CLoVER sector aligned with the fiber direction in a unidirectional plate based on its phase slowness diagram; Surface radiation at 68 µs. 2 Steering angle 5 Phase Slowness [s/m] Group Phase (c) (d) Figure. Steering expected when using a CLoVER sector aligned 45 degrees from the fiber direction in a unidirectional plate based on its phase slowness diagram; Surface radiation at 68 µs; (c) 78 µs; (d) 88 µs. shown in Fig.. Note that along this direction, the phase slowness diagram is also nearly constant with azimuthal position, but its radius of curvature is significantly larger indicating that as the waves propagate 5 of 28
![2 Group 9.2.5 6 Phase Slowness [s/m] 5. 3 Phase.5 8 2 33 24 27 3 (c) (d) Figure.](/docs-images/72/67040406/images/16-1.jpg "Steering expected when using a CLoVER sector aligned 9 degrees from the fiber direction in a unidirectional plate based on its phase slowness diagram; Surface radiation at 88 µs; (c) 97 µs; (d) 7 µs.")

-(d), as it allows for damage interrogation specifically along this direction. The larger attenuation observed transverse to the fiber direction in Fig. 5(c)-(d), will also occur in this case.")


16 2 Group Phase Slowness [s/m] 5. 3 Phase (c) (d) Figure. Steering expected when using a CLoVER sector aligned 9 degrees from the fiber direction in a unidirectional plate based on its phase slowness diagram; Surface radiation at 88 µs; (c) 97 µs; (d) 7 µs. away from the source, there will be a tendency to steer towards the fiber direction. This behavior is observed in the experimental results as the directionality of the propagating pulse is not as strong as it is along the 9-degree direction. The directionality of the GW field obtained with the CLoVER transducer along this direction is an improvement over that obtained using conventional wafers, as seen in Fig. 5(c)-(d), as it allows for damage interrogation specifically along this direction. The larger attenuation observed transverse to the fiber direction in Fig. 5(c)-(d), will also occur in this case. Moreover, the directionality of the inspection pulse is likely to increase the coherent signal to noise ratio of the reflections from any damage identified along this direction. The cross-ply plate was instrumented with a CLoVER transducer fabricated with the electrode pattern previously defined as CLoVER 2. In this case, due to in-plane symmetries only five of the 6 sectors available were employed for the characterization studies. A similar scanning grid as in the case of the unidirectional plate was used in this case with similar radial and azimuthal steps. The results are shown in Figs. 2 through 6. Figure 2 shows the GW propagation pattern observed when sector, aligned with the horizontal direction, is used. As expected from the phase slowness diagram shown in Fig. 2, there is no steering in this case as the phase and the group velocity vectors are parallel. The induced GW field therefore is highly directional and propagating along the fiber direction. Figure 3 shows similar results when CLoVER sector 2 is activated. From the phase slowness diagram shown in Fig. 3 it can be seen that the group velocity will be steered towards the fiber direction relative to the phase velocity vector. This behavior is evident in Figs. 3-(d) where the pulse propagates primarily towards the horizontal direction. Figure 4 shows the propagation pattern when sector 3 is activated. In this case, the normal to the phase slowness 6 of 28


 (d) Figure 3.")


 97 µs. 7 of 28")
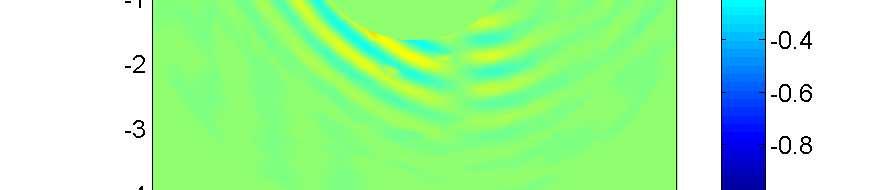
17 Phase Slowness [s/m] Phase Group Figure 2. Steering expected when using a CLoVER sector along the fiber direction in a cross-ply plate based on its phase slowness diagram; Surface radiation at 78 µs Phase Slowness [s/m] Group Phase Steering angle (c) (d) Figure 3. Steering expected when using a CLoVER sector aligned 22.5 degrees (counterclockwise) from the fiber direction in a cross-ply plate based on its phase slowness diagram; Surface radiation at 78 µs; (c) 88 µs; (d) 97 µs. 7 of 28


![propagates directionally along the direction in which it was launched as can be seen in Fig. 6. Phase Slowness [s/m] 9.5 2 6. Group Steering angle 5 3.](/docs-images/72/67040406/images/18-4.jpg "5 Phase 8 2 33 24 27 3 (c) (d) Figure 4.")


)is activated the propagating pattern is quite directional and stays within the bounds of the active CLoVER sector.")
18 and the phase velocity vector are nearly parallel and therefore very little steering is observed. Nevertheless, it can be appreciated that a small steering angle towards the horizontal direction is also present in this case. The behavior observed when CLoVER sector 4 is used is markedly different as shown in Fig. 5-(d). In this case, the normal to the phase slowness is nearly aligned with the vertical direction and therefore a very strong steering towards that direction is observed. Finally, when sector 5 is activated the normal to the phase slowness and the phase velocity are once again aligned and therefore the wave packet propagates directionally along the direction in which it was launched as can be seen in Fig. 6. Phase Slowness [s/m] Group Steering angle Phase (c) (d) Figure 4. Steering expected when using a CLoVER sector aligned 45 degrees (counterclockwise) from the fiber direction in a cross-ply plate based on its phase slowness diagram; Surface radiation at 78 µs; (c) 88 µs; (d) 97 µs. Sample results are shown for the quasi-isotropic plate in Fig. 7. In this case, the steering phenomenon is also present, but the results presented highlight the fact that for this composite configuration there are local regions where the waves propagate as if the substrate were an isotropic material. Note for instance that when CLoVER sector 4 (Fig. 7(c))is activated the propagating pattern is quite directional and stays within the bounds of the active CLoVER sector. This can be explained by the accompanying phase slowness diagram which shows that in that region, the curve is nearly circular and therefore no steering will occur. VI. Damage Interrogation using CLoVER Transducers in Composite Plates Sample results that illustrate the ability of the CLoVER transducer to detect damage in composite structures are presented in this section. The cross-ply and quasi-isotropic layups were selected for these studies as they are representative of actual configurations used in practice. In this case, the CLoVER transducers were used as directional sensors, while the GW excitation pulse was generated by a circular 8 of 28
![Phase Slowness [s/m] 9.5 2 6 Group Steering angle. 5 Phase 3.5 8 2 33 24 27 3 (c) (d) Figure 5. Steering expected when using a CLoVER sector aligned 67.](/docs-images/72/67040406/images/19-0.jpg "5 degrees (counterclockwise) from the fiber direction in a cross-ply plate based on its phase slowness diagram; Surface radiation at 68 µs; (c) 78 µs; (d) 88 µs.")


 with a sampling frequency of MHz.")

19 Phase Slowness [s/m] Group Steering angle. 5 Phase (c) (d) Figure 5. Steering expected when using a CLoVER sector aligned 67.5 degrees (counterclockwise) from the fiber direction in a cross-ply plate based on its phase slowness diagram; Surface radiation at 68 µs; (c) 78 µs; (d) 88 µs. piezoelectric disc bonded at the center of the CLoVER array. This piezoceramic disc has similar dimensions to those used in testing of the pristine plates. Due to its piezocomposite construction, a CLoVER sector is significantly more sensitive to strains along the piezo-fiber direction than along its transverse direction. The simulated defect used in this study was a concentrated mass provided by a metallic bar with a mass of.65 kg and a square cross section with a side length of two centimeters. This simulated defect was selected so as to avoid introducing permanent damage to the specimens (such as delaminations due to impact damage) during the early stages of testing. The concentrated mass was placed at a radial position of cm from the outer edge of the CLoVER sensors which corresponded to approximately 9 times the outer radius of the emitting piezoelectric transducer. The excitation input to the piezoelectric wafer was a 3.5 Hann-modulated toneburst at a frequency of 75 khz as used in the testing of the pristine plates, but with a peak-to-peak amplitude of 5 V. The GW signals were recorded using a digital oscilloscope (Infinuum 5483B) with a sampling frequency of MHz. In an effort to prevent the damage detection results from being influenced by different sensitivities of individual CLoVER sectors, the pristine and damaged signals for each sensor was normalized by the amplitude of the incoming GW pulse, so that the maximum in each data set was equal to one. A standard pulse-echo method was employed in these experiments whereby a signal corresponding to the pristine condition of the structure is compared to one obtained after the introduction of damage. The difference from these two measurements is then used to expose the reflections from any existing damage sites. To assess the effectiveness of the CLoVER interrogation approach in sensing, the simulated defect was aligned with the centerlines of different sectors, one at a time, and the response was recorded using all active 9 of 28
![Phase Slowness [s/m] 9.5 2 6 Group. 5 3 Phase.5 8 2 33 24 27 3 Figure 6.](/docs-images/72/67040406/images/20-0.jpg "Steering expected when using a CLoVER sector normal to the fiber direction in a cross-ply plate based on its phase slowness diagram; Surface radiation at 78 µs. CLoVER sectors.")


20 Phase Slowness [s/m] Group. 5 3 Phase Figure 6. Steering expected when using a CLoVER sector normal to the fiber direction in a cross-ply plate based on its phase slowness diagram; Surface radiation at 78 µs. CLoVER sectors. The first set of experiments were conducted on the cross-ply plate, where two different damage configurations were considered. First, the bar was aligned so that its flat edge faced a specific CLoVER sector, while the second configuration consisted of placing the bar so that its corner was aligned with the centerline of any given sensor in the array. These configurations, shown in Fig. 8, will be referred to as flat and sharp from this point onwards, respectively. As the emphasis of the present investigation is in verifying the effectiveness of the transducer in azimuthally localizing defects, its distance from the array was assumed to be known a priori and the wavespeeds measured previously using laser vibrometry were used to identify the region where damage reflections were expected. A total of nine CLoVER sectors spanning a continuous range of 8 degrees were used in this case. These sectors are illustrated in Fig. 9. Figure 2- shows sample difference signals between the pristine and damaged conditions of the plate when the damage is aligned with different sectors. Figure 2 shows the difference signal when sector 5 is used as a sensor and the simulated damage is aligned with sectors 2 through 7. Similarly, Fig. 2 shows the difference signals when sector is used as a sensor and the defect is aligned with sectors through 6. Note that in both cases, the reflection from the defect is easily discerned and its time of arrival is consistent with the expected time calculated based on the wave velocity and the distance between the defect and the CLoVER array. One objective of the damage interrogation tests is to determine whether the steering phenomenon observed in the previous sections has a significant influence on the transducer s ability to determine the azimuthal location of the defect site. Due to the material symmetry of the substrate, the response of sectors through 4 should be qualitatively similar to that of sectors 6 through 9 as they are placed in separate quadrants of the plate. Therefore, any effect associated with steering should become apparent in both measurements. The results from these experiments are illustrated in Figs. 2 through 23 where the response for both damage configurations (flat and sharp edge respectively) have been superimposed. Note that the results reported in the figures correspond to average values collected from three independent measurements with each measurement consisting of over averages. Similarly, the error bars correspond to the standard deviation calculated from the three independent data sets. Furthermore, the results obtained for sensors whose responses are expected to be symmetric have been placed side by side for easier comparison. The first clear observation from these results is that the transducers are effective in identifying the azimuthal location of the defect site. In particular, the amplitude of the response for the sectors that are aligned with the damage is consistently larger than those around it. Note that, in general, large responses are observed for the CLoVER sector aligned with the damage as well as an adjacent one. The fact that this pattern is observed for both damage configurations (flat and sharp edge) indicates that this is likely associated with the cross-sectional size of the simulated defect and not with the details of its shape at the point where it first interacts with the incident GW pulse. A comparison of the response from symmetric sensors is therefore 2 of 28
![Phase Slowness [s/m] 9.5 2 6. 5 3.5 Phase Group 8 2 33 24 27 3 Phase Slowness [s/m] 9.5 2 Group 6. 5 Phase 3.5 8 2 33 24 27 3 (c) (d) Figure 7.](/docs-images/72/67040406/images/21-0.jpg "Steering expected when using a CLoVER sector along the fiber direction in a quasi-isotropic [/45/-45/9] 4S plate based on its phase slowness diagram; Surface radiation at 88 µs; (c) Steering expected")
 from the fiber direction in a quasiisotropic [/45/-45/9] 4S plate based on its phase slowness diagram; (d) Surface radiation at 78 µs.")


21 Phase Slowness [s/m] Phase Group Phase Slowness [s/m] Group 6. 5 Phase (c) (d) Figure 7. Steering expected when using a CLoVER sector along the fiber direction in a quasi-isotropic [/45/-45/9] 4S plate based on its phase slowness diagram; Surface radiation at 88 µs; (c) Steering expected when using a CLoVER sector aligned 67.5 degrees (counterclockwise) from the fiber direction in a quasiisotropic [/45/-45/9] 4S plate based on its phase slowness diagram; (d) Surface radiation at 78 µs. used to determine whether this effect is the result of any steering phenomenon arising from the material anisotropy of the substrate. If the simulated defect is idealized as an omnidirectional source of GW, then any steering or azimuthal variation of amplitude would affect symmetric sectors in a similar manner. For instance, consider the result observed when the simulated defect is aligned with sector 4. In this case the maximum amplitude is observed for sensor number 4, but a reflection of similar amplitude is also recorded by sector number 5. If this observation were due to steering of the reflected pulse or variations in its amplitude, it would indicate that the propagating pulse is steering or has a larger amplitude contribution towards the horizontal direction. Therefore, the reflected pulse recorded when the damage is aligned with sector 6 should also be steering towards the horizontal direction so that both sectors 5 and 6 would record large reflection amplitudes. However, this is not the observed result as when the damage is aligned with sector 6, a large amplitude is recorded by both sector 6 and sector 7. This observation is confirmed by the measurement recorded with sensor 5. Based on the slowness diagram illustrated in Fig. and the peak-to-peak amplitude distribution reported in Fig. 6, no steering due to material anisotropy is expected along this direction. However, it is observed that a large reflection amplitude is recorded by both sectors 4 and 5. Therefore, it can be concluded that the large amplitudes observed by adjacent sectors is not due to steering effects or material anisotropy, but could rather be attributed to the size of the defect, imperfect alignment 2 of 28


22 Flat edge aligned with CLoVER sector Simulated defect: 2 cm cross-section Sharp edge aligned with CLoVER sector Simulated defect: 2 cm cross-section cm cm CLoVER transducer CLoVER transducer Figure 8. Detail of CLoVER transducer and simulated defect used in damage detection experiments: Flat side aligned with CLoVER sector; Sharp side aligned with CLoVER sector. CLoVER sector 9 Fiber direction on top layer CLoVER sector Piezoelectric wafer used as GW source Figure 9. Detail of the CLoVER and piezoelectric wafer transducers used in the damage detection experiments in cross-ply plate. relative to the CLoVER sectors, or to the spread in energy of the reflected GW pulse as it propagates in the plane of the plate. Nevertheless, the results indicate the effectiveness of the CLoVER transducer in correctly identifying the azimuthal location of the defect site. Note also that this is accomplished using a smaller number of transducers than alternative concepts. Similar experiments were conducted on the quasi-isotropic plate to verify the performance of the transducer in different composite configurations. As in the case of the cross-ply plate, eight CLoVER sectors spanning a continuous range of 8 degrees were used. In this case, however, only the sharp damage configuration was considered as it was found in the experiments with the cross-ply plate that the specific alignment of the defect did not have a significant role in the reflection amplitude of the sectors aligned with it. The transducer arrangement used is shown in Fig. 24 where the active sensors are highlighted. As previously indicated, these sectors correspond to the electrode design defined earlier as CLoVER 2. As in the previous case, the simulated defect was aligned with different sectors, one at a time, and the response recorded with all eight sectors. The results for this case are shown in Fig. 25 where the damage was aligned with sectors 3, 4, 5 and 7. Note that as in the case of the cross-ply plate the directionality of the CLoVER sectors allows the device to correctly identify the azimuthal location of the simulated defects. While in this case there are no in-plane material symmetries as in the cross-ply case, steering effects are also not apparent as the 22 of 28
23 Normalized Reflection Damage 2 Damage 3 Damage 4 Damage 5 Damage 6 Damage 7 Expected time of arrival based on wave speed Normalized Reflection Damage Damage 2 Damage 3 Damage 4 Damage 5 Damage 6 Expected time of arrival based on wave speed Time [s] x Time [s] x 4 Figure 2. Difference signals between pristine and damaged condition of the 2-layer cross-ply [/9] 6S plate when Sector 5 is used as a sensor and the defect is aligned with sectors 2 through 7 and Sector is used as a sensor and the defect is aligned with sectors through 6. reflection amplitude is always largest for the sectors directly aligned with the defect. Note that as in the previous case, this is often accompanied by an adjacent sector having a large reflection amplitude as well. As previously indicated, however, this is likely due to the in-plane energy spread of the reflected GW pulse as it reaches the CLoVER transducer. VII. Summary and Conclusions The guided-wave (GW) field excited by piezoelectric wafers and CLoVER transducers in composite plates was experimentally analyzed with applications to structural health monitoring. A combination of laser vibrometry and finite element simulations were used to characterize the in-plane variation of wave speed and peak-to-peak amplitude distribution in unidirectional, cross-ply [/9] 6S and quasi-isotropic [/45/-45/9] 4S IM7-based plates. The steering phenomenon was experimentally observed where the propagation direction of a wave packet is not parallel to its phase velocity vector. The GW excitation properties of the CLoVER transducer were characterized and its effectiveness in localizing simulated defects in various composite plates was demonstrated. The following conclusions can be drawn from this study: The unidirectional composite plates were observed to have the most directional GW propagation pattern with the energy directed towards the fiber direction. The amplitude of the GW pulse towards the matrix-dominated regions was significantly weaker than along the fiber direction (by a factor of eight) which may complicate its inspection using omnidirectional sources. The cross-ply [/9] 6S and quasi-isotropic [/45/-45/9] 4S plates display weaker directionality relative to the unidirectional case, but the GW energy is still directed towards regions with the largest stiffness as indicated by their phase slowness diagrams. The azimuthally-varying stiffness ratio between the axisymmetric piezoelectric source and the composite substrate has a secondary effect on the GW amplitude distribution observed within the plane of the substrate. The steering effect is the predominant driver behind the directionality observed both in the wave speeds and in the peak-to-peak amplitude distribution. This can be concluded as simulations using a constant distribution of traction amplitudes along the azimuthal direction resulted in directional GW fields consistent with those observed experimentally. The material anisotropy and steering effects influence the GW field excited by CLoVER sectors as the propagating pulses progressively move towards regions with the largest in-plane stiffness as determined 23 of 28
24 Normalized Reflection Amplitude Sharp edge Flat edge Normalized Reflection Amplitude Sharp edge Flat edge Sensor Index Sensor Index Normalized Reflection Amplitude Sharp edge Flat edge Normalized Reflection Amplitude Sharp edge Flat edge Sensor Index Sensor Index (c) (d) Figure 2. Normalized peak-to-peak reflection amplitude recorded with the CLoVER transducer in the 2- layer cross-ply [/9] 6S plate when the damage is aligned with sector sector 9 sector 2 sector 8. by the phase slowness curve. This effect could be compensated for by decreasing the azimuthal dimension of the CLoVER sectors. Using sectors with azimuthal spans in the order of 2 was shown to be sufficient to cover all directions in the plane of the plates. The CLoVER transducer can be used to successfully detect and locate defects in composite materials. Based on testing on cross-ply [/9] 6S and quasi-isotropic [/45/-45/9] 4S plates, it was found that when axisymmetric GW sources are employed, the steering associated with the material anisotropy does not significantly affect the damage localization capability of the CLoVER transducers. Acknowledgements This work was supported by the Air Force Office of Scientific Research under grants FA and FA with Dr. Victor Giurgiutiu as the technical monitor. This research was also supported by the NASA Constellation Universities Institute Project/Advanced Composites Technologies Program under grant Z634, with Ms. Claudia Meyer and Dr. Mark J. Shuart as the program managers. The assistance of Mr. Amit Salvi (Advanced Composites Structures Laboratory, University of Michigan) in conducting the tensile tests of composite coupons is gratefully appreciated. The authors also thank Mr. Edward Tang (Lurie Nanofabrication Facility, University of Michigan) for his help in the photolithography process. The 24 of 28
25 Normalized Reflection Amplitude Sharp edge Flat edge Normalized Reflection Amplitude Sharp edge Flat edge Sensor Index Sensor Index Normalized Reflection Amplitude Sharp edge Flat edge Normalized Reflection Amplitude Sharp edge Flat edge Sensor Index Sensor Index (c) (d) Figure 22. Normalized peak-to-peak reflection amplitude recorded with the CLoVER transducer in the 2- layer cross-ply [/9] 6S plate when the damage is aligned with sector 3 sector 7 sector 4 sector 6. assistance of Mr. Kalyan Nadella (University of Michigan) in fabricating the composite specimens used in this study is also gratefully acknowledged. Finally, the authors thank Mr. Joel Smith, Cytec Engineered Materials, for providing the composite pre-preg used in this study. 25 of 28

26 Normalized Reflection Amplitude Sharp edge Flat edge Sensor Index Figure 23. Normalized peak-to-peak reflection amplitude recorded with the CLoVER transducer in the 2- layer cross-ply [/9] 6S plate when the damage is aligned with sector 5. Fiber direction on top layer CLoVER sector CLoVER sector 8 Piezoelectric wafer used as GW source Figure 24. Detail of the CLoVER and piezoelectric wafer transducers used in the damage detection experiments in quasi-isotropic plate. 26 of 28
Guided wave structural health monitoring using CLoVER transducers in composite materials
 Home Search Collections Journals About Contact us My IOPscience Guided wave structural health monitoring using CLoVER transducers in composite materials This article has been downloaded from IOPscience.
Guided Wave Experimentation using CLoVER Transducers for Structural Health Monitoring
 49th AIAA/ASME/ASCE/AHS/ASC Structures, Structural Dynamics, and Materials Conference 16t 7-10 April 2008, Schaumburg, IL AIAA 2008-1970 Guided Wave Experimentation using CLoVER Transducers for Structural
INTERNAL STRAIN MEASUREMENTS IN CFRP PLATES SUBJECTED TO IMPACT LOAD USING FBG SENSORS
 INTERNAL STRAIN MEASUREMENTS IN CFRP PLATES SUBJECTED TO IMPACT LOAD USING FBG SENSORS J. Frieden, J. Cugnoni, J. Botsis, Th. Gmür, D. Coric Laboratoire de Mécanique appliquée et d Analyse de Fiabilité
Lamb Waves in Plate Girder Geometries
 Lamb Waves in Plate Girder Geometries D.W. Greve, 1 N. L. Tyson 2, and I.J. Oppenheim 2 1 Electrical and Computer Engineering, Carnegie Mellon University, Pittsburgh, PA, 15213 2 Civil and Environmental
CFRP Bonds Evaluation Using Piezoelectric Transducer
 4th International Symposium on NDT in Aerospace 2012 - Th.1.B.2 CFRP Bonds Evaluation Using Piezoelectric Transducer Paweł MALINOWSKI*, Łukasz SKARBEK*, Tomasz WANDOWSKI*, Wiesław OSTACHOWICZ* * Institute
Size Effects In the Crushing of Honeycomb Structures
 45th AIAA/ASME/ASCE/AHS/ASC Structures, Structural Dynamics & Materials Conference 19-22 April 2004, Palm Springs, California AIAA 2004-1640 Size Effects In the Crushing of Honeycomb Structures Erik C.
Modeling of Wedge-shaped Anisotropic Piezocomposite Transducer for Guided Wave-based Structural Health Monitoring
 48th AIAA/ASME/ASCE/AHS/ASC Structures, Structural Dynamics, and Materials Conference5th 3-6 April 7, Honolulu, Hawaii AIAA 7-73 Modeling of Wedge-shaped Anisotropic Piezocomposite Transducer for Guided
Methods Based on the Phenomenon of Elastic Wave Propagation (Guided Waves) Interaction with Damage
 Interaction with Damage") Propagation (Guided Waves) Interaction with Damage Wieslaw Ostachowicz Polish Academy of Sciences Institute of Fluid Flow Machinery Department of Mechanics of Intelligent Structures 14 Fiszera Street 80231
Propagation (Guided Waves) Interaction with Damage Wieslaw Ostachowicz Polish Academy of Sciences Institute of Fluid Flow Machinery Department of Mechanics of Intelligent Structures 14 Fiszera Street 80231
Analytically based time-reversal technique for damage localization and characterization in laminate composite structures
 8th European Workshop On Structural Health Monitoring (EWSHM 2016), 5-8 July 2016, Spain, Bilbao www.ndt.net/app.ewshm2016 Analytically based time-reversal technique for damage localization and characterization
Lamb Wave Behavior in Bridge Girder Geometries
 Lamb Wave Behavior in Bridge Girder Geometries I. J. Oppenheim a*, D. W. Greve b, N. L. Tyson a a Dept. of Civil and Environmental Engineering, Carnegie Mellon University, Pittsburgh, PA 15213 b Dept.
Finite Element and Plate Theory Modeling of Acoustic Emission Waveforms. NASA Langley Research Center. Hampton, VA *University of Denver
 Finite Element and Plate Theory Modeling of Acoustic Emission Waveforms W. H. Prosser, M. A. Hamstad + *, J. Gary +, and A. O Gallagher + NASA Langley Research Center Hampton, VA 23681-1 *University of
6th NDT in Progress Lamb waves in an anisotropic plate of a single crystal silicon wafer
 6th NDT in Progress 2011 International Workshop of NDT Experts, Prague, 10-12 Oct 2011 Lamb waves in an anisotropic plate of a single crystal silicon wafer Young-Kyu PARK 1, Young H. KIM 1 1 Applied Acoustics
Composite Structures- Modeling, FEA, Optimization and Diagnostics
 Composite Structures- Modeling, FEA, Optimization and Diagnostics Ratan Jha Mechanical and Aeronautical Engineering Clarkson University, Potsdam, NY Composite Laminate Modeling Refined Higher Order Displacement
Available online at ScienceDirect. Physics Procedia 63 (2015 ) 54 60
 54 60") Available online at www.sciencedirect.com ScienceDirect Physics Procedia 63 (2015 ) 54 60 43 rd Annual Symposium of the Ultrasonic Industry Association, UIA Symposium 2014 Phase velocity method for guided
Available online at www.sciencedirect.com ScienceDirect Physics Procedia 63 (2015 ) 54 60 43 rd Annual Symposium of the Ultrasonic Industry Association, UIA Symposium 2014 Phase velocity method for guided
SPECTRAL FINITE ELEMENT METHOD
 SPECTRAL FINITE ELEMENT METHOD Originally proposed by Patera in 1984 for problems in fluid dynamics Adopted for problems of propagation of acoustic and seismic waves Snapshot of the propagation of seismic
DYNAMIC ROTARY TORQUE MEASUREMENT USING SURFACE ACOUSTIC WAVES
 DYNAMIC ROTARY TORQUE MEASUREMENT USING SURFACE ACOUSTIC WAVES Abstract A. Lonsdale Technical Director Sensor Technology Ltd The subject of torque measurement has previously been addressed extensively.
Damage Inspection of Fiber Reinforced Polymer-Concrete Systems using a Distant Acoustic-Laser NDE Technique
 SPIE Smart Structures/NDE March 11, 2010, San Diego, CA Session 10: Civil Infrastructure Health Monitoring I Damage Inspection of Fiber Reinforced Polymer-Concrete Systems using a Distant Acoustic-Laser
VIBRATION CONTROL OF RECTANGULAR CROSS-PLY FRP PLATES USING PZT MATERIALS
 Journal of Engineering Science and Technology Vol. 12, No. 12 (217) 3398-3411 School of Engineering, Taylor s University VIBRATION CONTROL OF RECTANGULAR CROSS-PLY FRP PLATES USING PZT MATERIALS DILEEP
ULTRASONIC MEASUREMENT OF IN-PLANE MODULI OF PULTRUDED COMPOSITES
 ULTRASONIC MEASUREMENT OF IN-PLANE MODULI OF PULTRUDED COMPOSITES R. Prabhakaran 1, M. Saha 2, and T. Galloway 3 1,2 Department of Mechanical Engineering, Old Dominion University Norfolk, Virginia 23529,
ACOUSTIC EMISSION SOURCE DETECTION USING THE TIME REVERSAL PRINCIPLE ON DISPERSIVE WAVES IN BEAMS
 ACOUSTIC EMISSION SOURCE DETECTION USING THE TIME REVERSAL PRINCIPLE ON DISPERSIVE WAVES IN BEAMS ERNST ROBERT 1,DUAL JURG 1 1 Institute of Mechanical Systems, Swiss Federal Institute of Technology, ETH
LAMB WAVES GENERATION USING A TRANSDUCER EMBEDDED IN A COMPOSITE PLATE
 LAMB WAVES GENERATION USING A TRANSDUCER EMBEDDED IN A COMPOSITE PLATE Emmanuel Moulin 1, Jamal Assaad 1, Christophe Delebarre 1 and Daniel Osmont 2 1 IEMN, UMR CNRS 9929, OAE Department, Université de
Michelson Interferometer
 Michelson Interferometer Objective Determination of the wave length of the light of the helium-neon laser by means of Michelson interferometer subsectionprinciple and Task Light is made to produce interference
Piecewise semi-analytical modeling of guided wave generation by piezoelectric transducers
 International Workshop on MRT MTERIL, TRUCTURE NDT in Canada 13Conference & NDT for the Energy Industry October 7-1, 13 Calgary, lberta, CND Piecewise semi-analytical modeling of guided wave generation
Validation of High Displacement Piezoelectric Actuator Finite Element Models
 Validation of High Displacement Piezoelectric Actuator Finite Element Models Barmac Taleghani * Army Research Laboratory Vehicle Technology Directorate NASA Langley Research Center Hampton, VA ABSTRACT
Structural Health Monitoring Using Peak Of Frequency Response
 Proceedings of the 9th WSEAS International Conference on Automatic Control, Modeling & Simulation, Istanbul, Turkey, May 27-29, 2007 258 Structural Health Monitoring Using Peak Of Frequency Response ARASH
4. EXPERIMENTS AND RESULTS
 4. EXPERIMENTS AND RESULTS 4.1 Three-dimensional vibrometer To perform a TRNS from an experiment, it is necessary to know the radial, tangential, and axial displacement histories in the recording points
Simulation of Piezoelectric Induced Lamb Waves in Plates
 Simulation of Piezoelectric Induced Lamb Waves in Plates C. WILLBERG, J. M. VIVAR-PEREZ, Z. AHMAD and U. GABBERT ABSTRACT The use of Lamb waves for damage detection and non-destructive evaluation have
Computational Analysis for Composites
 Computational Analysis for Composites Professor Johann Sienz and Dr. Tony Murmu Swansea University July, 011 The topics covered include: OUTLINE Overview of composites and their applications Micromechanics
BIAXIAL STRENGTH INVESTIGATION OF CFRP COMPOSITE LAMINATES BY USING CRUCIFORM SPECIMENS
 BIAXIAL STRENGTH INVESTIGATION OF CFRP COMPOSITE LAMINATES BY USING CRUCIFORM SPECIMENS H. Kumazawa and T. Takatoya Airframes and Structures Group, Japan Aerospace Exploration Agency 6-13-1, Ohsawa, Mitaka,
Modeling and analysis of the electromechanical behavior of surface-bonded piezoelectric actuators using finite element method
 Modeling and analysis of the electromechanical behavior of surface-bonded piezoelectric actuators using finite element method Huangchao Yu and Xiaodong Wang Abstract Piezoelectric actuators have been widely
FROM NEAR FIELD TO FAR FIELD AND BEYOND
 More info about this article: h Czech Society for Nondestructive Testing 32 nd European Conference on Acoustic Emission Testing Prague, Czech Republic, September 07-09, 2016 FROM NEAR FIELD TO FAR FIELD
COMPRESSIVE BEHAVIOR OF IMPACT DAMAGED COMPOSITE LAMINATES
 16 TH INTERNATIONAL CONFERENCE ON COMPOSITE MATERIALS COMPRESSIVE BEHAVIOR OF IMPACT DAMAGED COMPOSITE LAMINATES Hiroshi Suemasu*, Wataru Sasaki**, Yuuichiro Aoki***, Takashi Ishikawa**** *Department of
THE ROLE OF DELAMINATION IN NOTCHED AND UNNOTCHED TENSILE STRENGTH
 THE ROLE OF DELAMINATION IN NOTCHED AND UNNOTCHED TENSILE STRENGTH M. R. Wisnom University of Bristol Advanced Composites Centre for Innovation and Science University Walk, Bristol BS8 1TR, UK M.Wisnom@bristol.ac.uk
LASER GENERATED THERMOELASTIC WAVES IN AN ANISOTROPIC INFINITE PLATE
 LASER GENERATED THERMOELASTIC WAVES IN AN ANISOTROPIC INFINITE PLATE H. M. Al-Qahtani and S. K. Datta University of Colorado Boulder CO 839-7 ABSTRACT. An analysis of the propagation of thermoelastic waves
Phased Array Beamsteering in Composite Laminates for Guided Wave Structural Health Monitoring
 Dissertations and Theses 5-2015 Phased Array Beamsteering in Composite Laminates for Guided Wave Structural Health Monitoring Peter Osterc Follow this and additional works at: http://commons.erau.edu/edt
Finite Element Modeling of Ultrasonic Transducers for Polymer Characterization
 Excerpt from the Proceedings of the COMSOL Conference 2009 Milan Finite Element Modeling of Ultrasonic Transducers for Polymer Characterization Serena De Paolis *, Francesca Lionetto and Alfonso Maffezzoli
Structural Health Monitoring Using Smart Piezoelectric Material
 Structural Health Monitoring Using Smart Piezoelectric Material Kevin K Tseng and Liangsheng Wang Department of Civil and Environmental Engineering, Vanderbilt University Nashville, TN 37235, USA Abstract
Extensional and Flexural Waves in a Thin-Walled Graphite/Epoxy Tube * William H. Prosser NASA Langley Research Center Hampton, VA 23665
 Extensional and Flexural Waves in a Thin-Walled Graphite/Epoxy Tube * William H. Prosser NASA Langley Research Center Hampton, VA 23665 Michael R. Gorman Aeronautics and Astronautics Naval Postgraduate
Modal Analysis Technique for Anisotropic Composite Laminates
 Copyright c 2008 ICCES ICCES, vol.7, no.2, pp.95-100 Modal Analysis Technique for Anisotropic Composite Laminates G.M. Mota 1, P. Sollero 1, F.B. Batista 1, E.L. Albuquerque 1 Summary Nowadays, the experimental
A coupled field finite element model to predict actuation properties of piezoelectrically actuated bistable composites.
 A coupled field finite element model to predict actuation properties of piezoelectrically actuated bistable composites. P.F.Giddings, C.R.Bowen, H.A.Kim University of Bath, UK Dept. Mech. ng, University
Numerical study on scanning radiation acoustic field in formations generated from a borehole
 Science in China Ser. G Physics, Mechanics & Astronomy 5 Vol.48 No. 47 56 47 Numerical study on scanning radiation acoustic field in formations generated from a borehole CHE Xiaohua 1, ZHANG Hailan 1,
Module III - Macro-mechanics of Lamina. Lecture 23. Macro-Mechanics of Lamina
 Module III - Macro-mechanics of Lamina Lecture 23 Macro-Mechanics of Lamina For better understanding of the macromechanics of lamina, the knowledge of the material properties in essential. Therefore, the
1587. A spatial filter and two linear PZT arrays based composite structure imaging method
 587. A spatial filter and two linear PZT arrays based composite structure imaging method Lei Qiu, Bin Liu 2, Shenfang Yuan 3, Qiao Bao 4, 2, 3, 4 State Key Laboratory of Mechanics and Control of Mechanical
ISSN: ISO 9001:2008 Certified International Journal of Engineering Science and Innovative Technology (IJESIT) Volume 2, Issue 4, July 2013
 Volume 2, Issue 4, July 2013") Delamination Studies in Fibre-Reinforced Polymer Composites K.Kantha Rao, Dr P. Shailesh, K. Vijay Kumar 1 Associate Professor, Narasimha Reddy Engineering College Hyderabad. 2 Professor, St. Peter s Engineering
Delamination Studies in Fibre-Reinforced Polymer Composites K.Kantha Rao, Dr P. Shailesh, K. Vijay Kumar 1 Associate Professor, Narasimha Reddy Engineering College Hyderabad. 2 Professor, St. Peter s Engineering
A RESEARCH ON NONLINEAR STABILITY AND FAILURE OF THIN- WALLED COMPOSITE COLUMNS WITH OPEN CROSS-SECTION
 A RESEARCH ON NONLINEAR STABILITY AND FAILURE OF THIN- WALLED COMPOSITE COLUMNS WITH OPEN CROSS-SECTION H. Debski a*, J. Bienias b, P. Jakubczak b a Faculty of Mechanical Engineering, Department of Machine
PEAT SEISMOLOGY Lecture 9: Anisotropy, attenuation and anelasticity
 PEAT8002 - SEISMOLOGY Lecture 9: Anisotropy, attenuation and anelasticity Nick Rawlinson Research School of Earth Sciences Australian National University Anisotropy Introduction Most of the theoretical
Comparison of Ply-wise Stress-Strain results for graphite/epoxy laminated plate subjected to in-plane normal loads using CLT and ANSYS ACP PrepPost
 Comparison of Ply-wise Stress-Strain results for graphite/epoxy laminated plate subjected to in-plane normal loads using CLT and ANSYS ACP PrepPost 1 Mihir A. Mehta, 2 Satyen D. Ramani 1 PG Student, Department
Numerical Vibration Analysis of Impacted CFRP Specimens Using COMSOL Multiphysics
 Numerical Vibration Analysis of Impacted CFRP Specimens Using COMSOL Multiphysics Philipp Jatzlau 1, Florian Seybold 1 1 Technical University of Munich, Center for Building Materials, Chair of Non-destructive
AEROELASTIC ANALYSIS OF SPHERICAL SHELLS
 11th World Congress on Computational Mechanics (WCCM XI) 5th European Conference on Computational Mechanics (ECCM V) 6th European Conference on Computational Fluid Dynamics (ECFD VI) E. Oñate, J. Oliver
Non-Linear Finite Element Modeling of THUNDER Piezoelectric Actuators
 Non-Linear Finite Element Modeling of THUNDER Piezoelectric Actuators Barmac K. Taleghani 1, Joel F. Campbell 2 1 Army Research Laboratory, Vehicle Technology Center, MS 230 NASA Langley Research Center,
Strain Measurement. Prof. Yu Qiao. Department of Structural Engineering, UCSD. Strain Measurement
 Strain Measurement Prof. Yu Qiao Department of Structural Engineering, UCSD Strain Measurement The design of load-carrying components for machines and structures requires information about the distribution
Fundamentals of Photoelasticity
 Fundamentals of Photoelasticity Some Useful Definitions How Stress Is Calculated Principles of Photoelasticity Stress Measurement Techniques Strainoptic Technologies, Inc. Some Useful Definitions Residual
Theoretical Manual Theoretical background to the Strand7 finite element analysis system
 Theoretical Manual Theoretical background to the Strand7 finite element analysis system Edition 1 January 2005 Strand7 Release 2.3 2004-2005 Strand7 Pty Limited All rights reserved Contents Preface Chapter
INTERNATIONAL JOURNAL OF APPLIED ENGINEERING RESEARCH, DINDIGUL Volume 2, No 1, 2011
 Interlaminar failure analysis of FRP cross ply laminate with elliptical cutout Venkateswara Rao.S 1, Sd. Abdul Kalam 1, Srilakshmi.S 1, Bala Krishna Murthy.V 2 1 Mechanical Engineering Department, P. V.
A SELF-INDICATING MODE I INTERLAMINAR TOUGHNESS TEST
 A SELF-INDICATING MODE I INTERLAMINAR TOUGHNESS TEST P. Robinson The Composites Centre, Department of Aeronautics, Imperial College London South Kensington, London, SW7 2AZ, UK p.robinson@imperial.ac.uk
A Novel Sensor Design for Generation and Detection of Shear-Horizontal Waves Based on Piezoelectric Fibres
 11th European Conference on Non-Destructive Testing (ECNDT 2014), October 6-10, 2014, Prague, Czech Republic A Novel Sensor Design for Generation and Detection of Shear-Horizontal Waves Based on Piezoelectric
Dynamic Response Of Laminated Composite Shells Subjected To Impulsive Loads
 IOSR Journal of Mechanical and Civil Engineering (IOSR-JMCE) e-issn: 2278-1684,p-ISSN: 2320-334X, Volume 14, Issue 3 Ver. I (May. - June. 2017), PP 108-123 www.iosrjournals.org Dynamic Response Of Laminated
MODELING DYNAMIC FRACTURE AND DAMAGE IN A FIBER-REINFORCED COMPOSITE LAMINA WITH PERIDYNAMICS
 University of Nebraska - Lincoln DigitalCommons@University of Nebraska - Lincoln Mechanical & Materials Engineering Faculty Publications Mechanical & Materials Engineering, Department of 011 MODELING DYNAMIC
Structural Health Monitoring using Shaped Sensors
 Structural Health Monitoring using Shaped Sensors Michael I. Friswell and Sondipon Adhikari Swansea University, UK This paper is concerned with distributed sensors to measure the response of beam and plate
Part 7. Nonlinearity
 Part 7 Nonlinearity Linear System Superposition, Convolution re ( ) re ( ) = r 1 1 = r re ( 1 + e) = r1 + r e excitation r = r() e response In the time domain: t rt () = et () ht () = e( τ) ht ( τ) dτ
Lamb Wave Propagation Modeling Using Cellular Automata
 6th European Workshop on Structural Health Monitoring - We.3.E.2 More info about this article: http://www.ndt.net/?id=14171 Lamb Wave Propagation Modeling Using Cellular Automata P. KLUSKA 1, W. J. STASZEWSKI
Acoustic Emission in Wide Composite Specimens
 Advanced Materials Research Vols. 13-14 (2006) pp. 325-332 online at http://www.scientific.net (2006) Trans Tech Publications, Switzerland Acoustic Emission in Wide Composite Specimens 1 Scholey, J. J.,
Numerical Modelling of Dynamic Earth Force Transmission to Underground Structures
 Numerical Modelling of Dynamic Earth Force Transmission to Underground Structures N. Kodama Waseda Institute for Advanced Study, Waseda University, Japan K. Komiya Chiba Institute of Technology, Japan
EXPERIMENTAL AND NUMERICAL ANALYSIS OF A TRANSDUCER FOR THE GENERATION OF GUIDED WAVES
 October 9 11, 2017, Prague, Czech Republic EXPERIMENTAL AND NUMERICAL ANALYSIS OF A TRANSDUCER FOR THE GENERATION OF GUIDED WAVES Marco ZENNARO 1, Alex HAIG 2, Dan J. O BOY 3, Stephen J. WALSH 4 1 National
Damage Detection of Composite Plate using Finite Element Analysis based on Structural Health Monitoring
 Damage Detection of Composite Plate using Finite Element Analysis based on Structural Health Monitoring K-T. Kang 1, H-J. Chun 1, J-H. Son 1, J-H. Byun, M-K. Um, S-K. Lee 1) School of Mechanical Engineering,
PIEZOELECTRIC TECHNOLOGY PRIMER
 PIEZOELECTRIC TECHNOLOGY PRIMER James R. Phillips Sr. Member of Technical Staff CTS Wireless Components 4800 Alameda Blvd. N.E. Albuquerque, New Mexico 87113 Piezoelectricity The piezoelectric effect is
Let us consider a typical Michelson interferometer, where a broadband source is used for illumination (Fig. 1a).
.") 7.1. Low-Coherence Interferometry (LCI) Let us consider a typical Michelson interferometer, where a broadband source is used for illumination (Fig. 1a). The light is split by the beam splitter (BS) and
7.1. Low-Coherence Interferometry (LCI) Let us consider a typical Michelson interferometer, where a broadband source is used for illumination (Fig. 1a). The light is split by the beam splitter (BS) and
MEMS Tuning-Fork Gyroscope Mid-Term Report Amanda Bristow Travis Barton Stephen Nary
 MEMS Tuning-Fork Gyroscope Mid-Term Report Amanda Bristow Travis Barton Stephen Nary Abstract MEMS based gyroscopes have gained in popularity for use as rotation rate sensors in commercial products like
UNIVERSITY OF SOUTHAMPTON
 UNIVERSITY OF SOUTHAMPTON PHYS2023W1 SEMESTER 1 EXAMINATION 2016-2017 WAVE PHYSICS Duration: 120 MINS (2 hours) This paper contains 9 questions. Answers to Section A and Section B must be in separate answer
NON-DESTRUCTIVE EVALUATION METHODS FOR COMPOSITE PILES
 NON-DESTRUCTIVE EVALUATION METHODS FOR COMPOSITE PILES John F. Davila Graduate Research Assistant 2006 URI-UPRM SUMMER INTERNSHIP RESEARCH PROGRAM Kingstown, RI July 29 of 2006 PRESENTATION OUTLINE Introduction
Dispersion Relations in Plate Structures Studied with a Scanning Laser Vibrometer
 ECNDT 2006 - Mo.2.1.4 Dispersion Relations in Plate Structures Studied with a Scanning Laser Vibrometer Bernd KÖHLER, Fraunhofer Institute for Non-Destructive Testing, Dresden, Germany Abstract. Scanning
COMELD TM JOINTS: A NOVEL TECHNIQUE FOR BONDING COMPOSITES AND METAL
 COMELD TM JOINTS: A NOVEL TECHNIQUE FOR BONDING COMPOSITES AND METAL F.J. Guild *, P.J. Hogg + and W. Tu School of Engineering and Materials Science, Queen Mary, University of London, London E1 4NS, UK
Finite Element Simulation of Piezoelectric Wafer Active Sensors for Structural Health Monitoring with Coupled-Filed Elements
 Finite Element Simulation of Piezoelectric Wafer Active Sensors for Structural Health Monitoring with Coupled-Filed Elements Weiping Liu, Victor Giurgiutiu Department of Mechanical Engineering, Univ. of
Lamb modes are commonly used for ultrasonic, nondestructive
 Guided waves propagating in sandwich structures made of anisotropic, viscoelastic, composite materials Michel Castaings a) and Bernard Hosten b) Laboratoire de Mécanique Physique, Université Bordeaux 1,
Eddy Current Modeling in Composite Materials
 PIERS ONLINE, VOL. 5, NO. 6, 2009 59 Eddy Current Modeling in Composite Materials M. Cacciola, S. Calcagno, G. Megali, D. Pellicanó, M. Versaci, and F. C. Morabito University Mediterranea of Reggio Calabria,
Giola S. Bottai 1a, Nikos A. Chrysochoidis b ; Victor Giurgiutiu a ; and Dimitris A. Saravanos b USA. Greece
 Analytical and Experimental Evaluation of Piezoelectric Wafer Active Sensors Performances for Lamb Waves based Structural Health Monitoring in Composite Laminates Giola S. Bottai a, ios A. Chrysochoidis
FEM Simulation of Generation of Bulk Acoustic Waves and Their Effects in SAW Devices
 Excerpt from the Proceedings of the COMSOL Conference 2010 India FEM Simulation of Generation of ulk Acoustic Waves and Their Effects in SAW Devices Ashish Kumar Namdeo 1, Harshal. Nemade* 1, 2 and N.
Proceedings Effect of Electrode Configuration on High Temperature Thickness Shear Gallium Phosphate Transducer
 Proceedings Effect of Electrode Configuration on High Temperature Thickness Shear Gallium Phosphate Transducer Anurag Dhutti, Tat-Hean Gan,2, *, Abbas Mohimi 2, Wamadeva Balachandran and Jamil Kanfoud
46th AIAA/ASME/ASCE/AHS/ASC Structures, Structural Dynamics, and Materials Conference April 2005 Austin, Texas
 th AIAA/ASME/ASCE/AHS/ASC Structures, Structural Dynamics & Materials Conference - April, Austin, Texas AIAA - AIAA - Bi-stable Cylindrical Space Frames H Ye and S Pellegrino University of Cambridge, Cambridge,
Borehole Geophysics. Acoustic logging measurements
 Acoustic logging measurements - Review of basic physics background - Concept of P- and S-wave measurements and logging tools - Tube waves - Seismic imaging - Synthetic seismograms - Field application examples
Keywords: Adhesively bonded joint, laminates, CFRP, stacking sequence
 THE 19 TH INTERNATIONAL CONFERENCE ON COMPOSITE MATERIALS GLOBAL AND LOCAL INFLUENCE OF STACKING SEQUENCE ON THE STRENGTH OF ADHESIVELY BONDED JOINTS OF CFRP LAMINATES J. Rousseau*, P. Satthamnuwong DRIVE,
Measurements of Radial In-plane Vibration Characteristics of Piezoelectric Disk Transducers
 Trans. Korean Soc. Noise Vib. Eng., 25(1) : 13~23, 2015 한국소음진동공학회논문집제 25 권제 1 호, pp. 13~23, 2015 http://dx.doi.org/10.5050/ksnve.2015.25.1.013 ISSN 1598-2785(Print), ISSN 2287-5476(Online) Measurements
Strain Measurement Techniques for Composite Coupon Testing
 Strain Measurement Techniques for Composite Coupon Testing Introduction Characterization of the properties of anisotropic and inhomogeneous composite materials for use in demanding structural applications
Radiated Sound Power from a Curved Honeycomb Panel
 Radiated Sound Power from a Curved Honeycomb Panel Jay H. Robinson Ralph D. Buehrle Jacob Klos NASA Langley Research Center, Hampton, VA 23681-2199 Ferdinand W. Grosveld Lockheed Martin Engineering and
EVALUATION OF THE COEFFICIENTS OF MOISTURE EXPANSION USING TRANSIENT SIMULATED LAMINATES METHODOLOGY (TSL)
") EVALUATION OF THE COEFFICIENTS OF MOISTURE EXPANSION USING TRANSIENT SIMULATED LAMINATES METHODOLOGY (TSL) Takeshi Takatoya, Kimo Chung, Yi-Jui Wu, and James C. Seferis Polymeric Composites Laboratory,
EVALUATION OF THE COEFFICIENTS OF MOISTURE EXPANSION USING TRANSIENT SIMULATED LAMINATES METHODOLOGY (TSL) Takeshi Takatoya, Kimo Chung, Yi-Jui Wu, and James C. Seferis Polymeric Composites Laboratory,
Compensation-based non-destructive automatic quality control using acoustic methods
 Compensation-based non-destructive automatic quality control using acoustic methods Abstract Keywords Ingolf Hertlin RTE Akustik + Prüftechnik GmbH Gewerbestr. 26, D-76327 Pfinztal, Germany www.rte.de
Open-hole compressive strength prediction of CFRP composite laminates
 Open-hole compressive strength prediction of CFRP composite laminates O. İnal 1, A. Ataş 2,* 1 Department of Mechanical Engineering, Balikesir University, Balikesir, 10145, Turkey, inal@balikesir.edu.tr
Elasticity: Term Paper. Danielle Harper. University of Central Florida
 Elasticity: Term Paper Danielle Harper University of Central Florida I. Abstract This research was conducted in order to experimentally test certain components of the theory of elasticity. The theory was
Piezoelectric wafer active sensors for in situ ultrasonic-guided wave SHM
 Fatigue & Fracture of Engineering Materials & Structures doi: 10.1111/j.1460-2695.2008.01256.x Piezoelectric wafer active sensors for in situ ultrasonic-guided wave SHM L. YU, G. SANTONI-BOTTAI, B. XU,
ELASTICITY AND FRACTURE MECHANICS. Vijay G. Ukadgaonker
 THEORY OF ELASTICITY AND FRACTURE MECHANICS y x Vijay G. Ukadgaonker Theory of Elasticity and Fracture Mechanics VIJAY G. UKADGAONKER Former Professor Indian Institute of Technology Bombay Delhi-110092
POLARIZATION OF LIGHT
 POLARIZATION OF LIGHT OVERALL GOALS The Polarization of Light lab strongly emphasizes connecting mathematical formalism with measurable results. It is not your job to understand every aspect of the theory,
IMPERIAL COLLEGE LONDON UNIVERSITY OF LONDON TOWARDS HIGHER RESOLUTION GUIDED WAVE INSPECTION: SCATTERING STUDIES.
 IMPERIAL COLLEGE LONDON UNIVERSITY OF LONDON TOWARDS HIGHER RESOLUTION GUIDED WAVE INSPECTION: SCATTERING STUDIES by Prabhu Rajagopal A thesis submitted to the University of London for the degree of Doctor
A New Ultrasonic Immersion Technique to Retrieve Anisotropic Stiffness Matrix for Dispersion Curves Algorithms
 A New Ultrasonic Immersion Technique to Retrieve Anisotropic Stiffness Matrix for Dispersion Curves Algorithms DARUN BARAZANCHY 1, WILLIAM ROTH 2 and VICTOR GIURGIUTIU 3 ABSTRACT Dispersion curve algorithms
ASSESMENT OF THE EFFECT OF BOUNDARY CONDITIONS ON CYLINDRICAL SHELL MODAL RESPONSES
 ASSESMENT OF THE EFFECT OF BOUNDARY CONDITIONS ON CYLINDRICAL SHELL MODAL RESPONSES ABSTRACT Eduards Skukis, Kaspars Kalnins, Olgerts Ozolinsh Riga Technical University Institute of Materials and Structures
7.2.1 Seismic waves. Waves in a mass- spring system
 7..1 Seismic waves Waves in a mass- spring system Acoustic waves in a liquid or gas Seismic waves in a solid Surface waves Wavefronts, rays and geometrical attenuation Amplitude and energy Waves in a mass-
DEVELOPMENT OF THERMOELASTIC STRESS ANALYSIS AS A NON-DESTRUCTIVE EVALUATION TOOL
 DEVELOPMENT OF THERMOELASTIC STRESS ANALYSIS AS A NON-DESTRUCTIVE EVALUATION TOOL S. Quinn*, R.K. Fruehmann and J.M. Dulieu-Barton School of Engineering Sciences University of Southampton Southampton SO17
Finite Element-Based Failure Models for Carbon/Epoxy Tape Composites
 Finite Element-Based Failure Models for Carbon/Epoxy Tape Composites A Master Thesis Presented to The Academic Faculty by Guillaume Seon In Partial Fulfillment of the Requirements for the Degree Master
Determination of group velocity of propagation of Lamb waves in aluminium plate using piezoelectric transducers
 ARTICLE IN PRESS Applied and Computational Mechanics 11 (2017) XXX YYY Determination of group velocity of propagation of Lamb waves in aluminium plate using piezoelectric transducers Z. Lašová a,,r.zemčík
The application of Eulerian laser Doppler vibrometry to the on-line condition monitoring of axial-flow turbomachinery blades
 UNIVERSITY OF PRETORIA The application of Eulerian laser Doppler vibrometry to the on-line condition monitoring of axial-flow turbomachinery blades by Abrie Oberholster Supervisor: Professor Stephan Heyns
CHAPTER 5 SIMULATION OF A PAYLOAD FAIRING
 CHAPTER 5 SIMULATION OF A PAYLOAD FAIRING In the preceding chapters, a model of a PZT actuator exciting a SS cylinder has been presented. The structural model is based on a modal expansion formulation