Question 1: Exercise 8.2
|
|
|
- Junior Wiggins
- 6 years ago
- Views:
Transcription
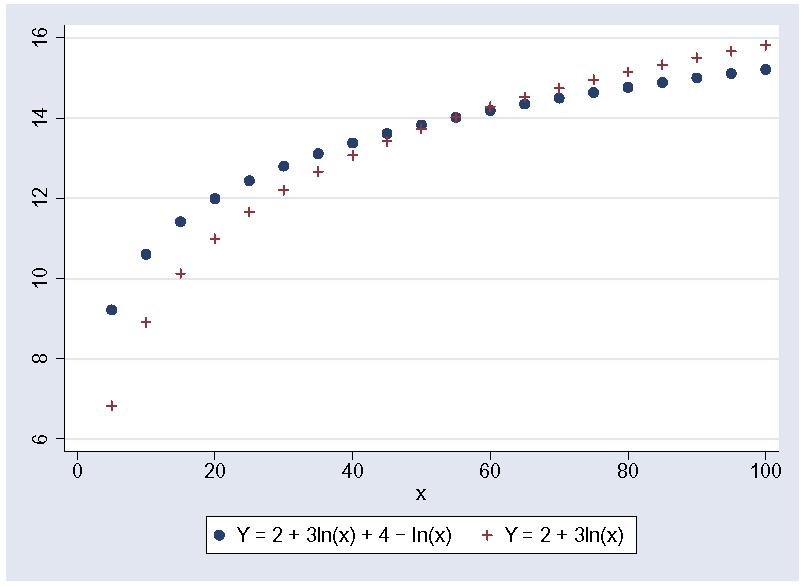
1 Questio 1: Exercise 8. (a) Accordig to the regressio results i colum (1), the house price is expected to icrease by 1% ( 100% ) with a additioal 500 square feet ad other factors held costat. The 95% cofidece iterval for the percetage chage is 100% 500 ( ) [17.76% to 4.74%]. (b) Because the regressios i colums (1) ad () have the same depedet variable, R ca be used to compare the fit of these two regressios. The log-log regressio i colum () has the higher R, so it is better so use l(size) to explai house prices. (c) The house price is expected to icrease by 7.1% ( 100% ). The 95% cofidece iterval for this effect is 100% ( ) [0.436% to %]. (d) The house price is expected to icrease by 0.36% (100% %) with a additioal bedroom while other factors are held costat. The effect is ot statistically sigificat at a 5% sigificace level: t Note that this coefficiet measures the effect of a additioal bedroom holdig the size of the house costat. Thus, it measures the effect of covertig existig space (from, say a family room) ito a bedroom. (e) The quadratic term l(size) is ot importat. The coefficiet estimate is ot statistically sigificat at a 5% sigificace level: t (f) The house price is expected to icrease by 7.1% ( 100% ) whe a swimmig pool is added to a house without a view ad other factors are held costat. The house price is expected to icrease by 7.3% ( 100% ( )) whe a swimmig pool is added to a house with a view ad other factors are held costat. The differece i the expected percetage chage i price is 0.%. The differece is ot statistically sigificat at 0.00 a 5% sigificace level: t

")
2 Questio : Exercise 8.8 (a) ad (b) (c)
3 (d) (e)
4 Questio 3: Exercise 8.11 de( Y X ) X 1X Liear model: E(Y X) 0 1 X, so that 1 ad the elasticity is 1 dx E( Y X ) X Log-Log Model: E(Y X) l( X ) u 0 1 l( X ) u 0 1 l( X ) E e X e E( e X ) ce, where c E(e u X), which does ot deped o X because u ad X are assumed to be idepedet. de( Y X ) ( ) 0 1 Thus 1 l( X E Y X ce ) 1, ad the elasticity is 1. dx X X Questio 4: Exercise 10.1 (a) With a $1 icrease i the beer tax, the expected umber of lives that would be saved is 0.45 per 10,000 people. Sice New Jersey has a populatio of 8.1 millio, the expected umber of lives saved is The 95% cofidece iterval is ( ) 810 [15.8, ]. (b) Whe New Jersey lowers its drikig age from 1 to 18, the expected fatality rate icreases by 0.08 deaths per 10,000. The 95% cofidece iterval for the chage i death rate is [ , ]. With a populatio of 8.1 millio, the umber of fatalities will icrease by with a 95% cofidece iterval [0.1014, ] 810 [8.134, 17.49]. (c) Whe real icome per capita i New Jersey icreases by 1%, the expected fatality rate icreases by 1.81 deaths per 10,000. The 90% cofidece iterval for the chage i death rate is [1.04,.58]. With a populatio of 8.1 millio, the umber of fatalities will icrease by with a 90% cofidece iterval [1.04,.58] 810 [840, 09]. (d) The low p-value (or high F-statistic) associated with the F-test o the assumptio that time effects are zero suggests that the time effects should be icluded i the regressio. (e) Defie a biary variable west which equals 1 for the wester states ad 0 for the other states. Iclude the iteractio term betwee the biary variable west ad the uemploymet rate, west (uemploymet rate), i the regressio equatio correspodig to colum (4). Suppose the coefficiet associated with uemploymet rate is ad the coefficiet associated with west (uemploymet rate) is. The captures the effect of the uemploymet rate i the easter states, ad captures the effect of the uemploymet rate i the wester states. The differece i the effect of the uemploymet rate i the wester ad easter states is. Usig the coefficiet estimate ( ˆ ) ad the stadard error SE( ˆ ), you ca calculate the t-statistic to test whether is statistically sigificat at a give sigificace level. Questio 5: Exercise T (a) ˆ Y which has variace. Because T is ot growig, the variace is ot gettig i T t1 it small. ˆi is ot cosistet. u T (b) The average i (a) is computed over T observatios. I this case T is small (T 4), so the ormal approximatio from the CLT is ot likely to be very good.
5 Questio 6: Exercise Usig the hit, equatio (10.) ca be writte as ˆ DM 1 i1 i i1 4 4 X X Y Y X X Y Y i i1 i i1 i i1 i i1 X X 1 Y Y 1 X X X X X X i i1 i i1 i i i i BA 1 i1 i i1 ˆ
Regression, Inference, and Model Building
 Regressio, Iferece, ad Model Buildig Scatter Plots ad Correlatio Correlatio coefficiet, r -1 r 1 If r is positive, the the scatter plot has a positive slope ad variables are said to have a positive relatioship
Dr. Maddah ENMG 617 EM Statistics 11/26/12. Multiple Regression (2) (Chapter 15, Hines)
 (Chapter 15, Hines)") Dr Maddah NMG 617 M Statistics 11/6/1 Multiple egressio () (Chapter 15, Hies) Test for sigificace of regressio This is a test to determie whether there is a liear relatioship betwee the depedet variable
Dr Maddah NMG 617 M Statistics 11/6/1 Multiple egressio () (Chapter 15, Hies) Test for sigificace of regressio This is a test to determie whether there is a liear relatioship betwee the depedet variable
Properties and Hypothesis Testing
 Chapter 3 Properties ad Hypothesis Testig 3.1 Types of data The regressio techiques developed i previous chapters ca be applied to three differet kids of data. 1. Cross-sectioal data. 2. Time series data.
Expectation and Variance of a random variable
 Chapter 11 Expectatio ad Variace of a radom variable The aim of this lecture is to defie ad itroduce mathematical Expectatio ad variace of a fuctio of discrete & cotiuous radom variables ad the distributio
Open book and notes. 120 minutes. Cover page and six pages of exam. No calculators.
 IE 330 Seat # Ope book ad otes 120 miutes Cover page ad six pages of exam No calculators Score Fial Exam (example) Schmeiser Ope book ad otes No calculator 120 miutes 1 True or false (for each, 2 poits
(all terms are scalars).the minimization is clearer in sum notation:
.the minimization is clearer in sum notation:") 7 Multiple liear regressio: with predictors) Depedet data set: y i i = 1, oe predictad, predictors x i,k i = 1,, k = 1, ' The forecast equatio is ŷ i = b + Use matrix otatio: k =1 b k x ik Y = y 1 y 1
7 Multiple liear regressio: with predictors) Depedet data set: y i i = 1, oe predictad, predictors x i,k i = 1,, k = 1, ' The forecast equatio is ŷ i = b + Use matrix otatio: k =1 b k x ik Y = y 1 y 1
Algebra of Least Squares
 October 19, 2018 Algebra of Least Squares Geometry of Least Squares Recall that out data is like a table [Y X] where Y collects observatios o the depedet variable Y ad X collects observatios o the k-dimesioal
Midterm 2 ECO3151. Winter 2012
 Name: Studet Number: Midterm 2 ECO3151 Witer 2012 Istructios: 1. Prit your ame ad studet umber at the top of this midterm 2. No programmable calculators 3. You ca aswer i pecil or pe 4. This midterm cosists
Stat 200 -Testing Summary Page 1
 Stat 00 -Testig Summary Page 1 Mathematicias are like Frechme; whatever you say to them, they traslate it ito their ow laguage ad forthwith it is somethig etirely differet Goethe 1 Large Sample Cofidece
Assessment and Modeling of Forests. FR 4218 Spring Assignment 1 Solutions
 Assessmet ad Modelig of Forests FR 48 Sprig Assigmet Solutios. The first part of the questio asked that you calculate the average, stadard deviatio, coefficiet of variatio, ad 9% cofidece iterval of the
1 Inferential Methods for Correlation and Regression Analysis
 1 Iferetial Methods for Correlatio ad Regressio Aalysis I the chapter o Correlatio ad Regressio Aalysis tools for describig bivariate cotiuous data were itroduced. The sample Pearso Correlatio Coefficiet
Overview. p 2. Chapter 9. Pooled Estimate of. q = 1 p. Notation for Two Proportions. Inferences about Two Proportions. Assumptions
 Chapter 9 Slide Ifereces from Two Samples 9- Overview 9- Ifereces about Two Proportios 9- Ifereces about Two Meas: Idepedet Samples 9-4 Ifereces about Matched Pairs 9-5 Comparig Variatio i Two Samples
UNIVERSITY OF TORONTO Faculty of Arts and Science APRIL/MAY 2009 EXAMINATIONS ECO220Y1Y PART 1 OF 2 SOLUTIONS
 PART of UNIVERSITY OF TORONTO Faculty of Arts ad Sciece APRIL/MAY 009 EAMINATIONS ECO0YY PART OF () The sample media is greater tha the sample mea whe there is. (B) () A radom variable is ormally distributed
Topic 9: Sampling Distributions of Estimators
 Topic 9: Samplig Distributios of Estimators Course 003, 2016 Page 0 Samplig distributios of estimators Sice our estimators are statistics (particular fuctios of radom variables), their distributio ca be
TMA4245 Statistics. Corrected 30 May and 4 June Norwegian University of Science and Technology Department of Mathematical Sciences.
 Norwegia Uiversity of Sciece ad Techology Departmet of Mathematical Scieces Corrected 3 May ad 4 Jue Solutios TMA445 Statistics Saturday 6 May 9: 3: Problem Sow desity a The probability is.9.5 6x x dx
Comparing Two Populations. Topic 15 - Two Sample Inference I. Comparing Two Means. Comparing Two Pop Means. Background Reading
 Topic 15 - Two Sample Iferece I STAT 511 Professor Bruce Craig Comparig Two Populatios Research ofte ivolves the compariso of two or more samples from differet populatios Graphical summaries provide visual
Agenda: Recap. Lecture. Chapter 12. Homework. Chapt 12 #1, 2, 3 SAS Problems 3 & 4 by hand. Marquette University MATH 4740/MSCS 5740
 Ageda: Recap. Lecture. Chapter Homework. Chapt #,, 3 SAS Problems 3 & 4 by had. Copyright 06 by D.B. Rowe Recap. 6: Statistical Iferece: Procedures for μ -μ 6. Statistical Iferece Cocerig μ -μ Recall yes
FACULTY OF MATHEMATICAL STUDIES MATHEMATICS FOR PART I ENGINEERING. Lectures
 FACULTY OF MATHEMATICAL STUDIES MATHEMATICS FOR PART I ENGINEERING Lectures MODULE 5 STATISTICS II. Mea ad stadard error of sample data. Biomial distributio. Normal distributio 4. Samplig 5. Cofidece itervals
3/3/2014. CDS M Phil Econometrics. Types of Relationships. Types of Relationships. Types of Relationships. Vijayamohanan Pillai N.
 3/3/04 CDS M Phil Old Least Squares (OLS) Vijayamohaa Pillai N CDS M Phil Vijayamoha CDS M Phil Vijayamoha Types of Relatioships Oly oe idepedet variable, Relatioship betwee ad is Liear relatioships Curviliear
Linear Regression Models
 Liear Regressio Models Dr. Joh Mellor-Crummey Departmet of Computer Sciece Rice Uiversity johmc@cs.rice.edu COMP 528 Lecture 9 15 February 2005 Goals for Today Uderstad how to Use scatter diagrams to ispect
Chapter 22. Comparing Two Proportions. Copyright 2010 Pearson Education, Inc.
 Chapter 22 Comparig Two Proportios Copyright 2010 Pearso Educatio, Ic. Comparig Two Proportios Comparisos betwee two percetages are much more commo tha questios about isolated percetages. Ad they are more
Simple Regression. Acknowledgement. These slides are based on presentations created and copyrighted by Prof. Daniel Menasce (GMU) CS 700
 CS 700") Simple Regressio CS 7 Ackowledgemet These slides are based o presetatios created ad copyrighted by Prof. Daiel Measce (GMU) Basics Purpose of regressio aalysis: predict the value of a depedet or respose
Simple Regressio CS 7 Ackowledgemet These slides are based o presetatios created ad copyrighted by Prof. Daiel Measce (GMU) Basics Purpose of regressio aalysis: predict the value of a depedet or respose
Circle the single best answer for each multiple choice question. Your choice should be made clearly.
 TEST #1 STA 4853 March 6, 2017 Name: Please read the followig directios. DO NOT TURN THE PAGE UNTIL INSTRUCTED TO DO SO Directios This exam is closed book ad closed otes. There are 32 multiple choice questios.
Refresher course Regression Analysis
 Refresher course Regressio Aalysis http://www.swisspael.ch Ursia Kuh Swiss Household Pael (SHP), FORS 3.6.9, Uiversity of ausae Aim ad cotet of the course Refresher course o liear regressio What is a regressio?
ENGI 4421 Confidence Intervals (Two Samples) Page 12-01
 Page 12-01") ENGI 44 Cofidece Itervals (Two Samples) Page -0 Two Sample Cofidece Iterval for a Differece i Populatio Meas [Navidi sectios 5.4-5.7; Devore chapter 9] From the cetral limit theorem, we kow that, for sufficietly
ENGI 44 Cofidece Itervals (Two Samples) Page -0 Two Sample Cofidece Iterval for a Differece i Populatio Meas [Navidi sectios 5.4-5.7; Devore chapter 9] From the cetral limit theorem, we kow that, for sufficietly
CEU Department of Economics Econometrics 1, Problem Set 1 - Solutions
 CEU Departmet of Ecoomics Ecoometrics, Problem Set - Solutios Part A. Exogeeity - edogeeity The liear coditioal expectatio (CE) model has the followig form: We would like to estimate the effect of some
Statistics 20: Final Exam Solutions Summer Session 2007
 1. 20 poits Testig for Diabetes. Statistics 20: Fial Exam Solutios Summer Sessio 2007 (a) 3 poits Give estimates for the sesitivity of Test I ad of Test II. Solutio: 156 patiets out of total 223 patiets
Regression. Correlation vs. regression. The parameters of linear regression. Regression assumes... Random sample. Y = α + β X.
 Regressio Correlatio vs. regressio Predicts Y from X Liear regressio assumes that the relatioship betwee X ad Y ca be described by a lie Regressio assumes... Radom sample Y is ormally distributed with
Geometry of LS. LECTURE 3 GEOMETRY OF LS, PROPERTIES OF σ 2, PARTITIONED REGRESSION, GOODNESS OF FIT
 OCTOBER 7, 2016 LECTURE 3 GEOMETRY OF LS, PROPERTIES OF σ 2, PARTITIONED REGRESSION, GOODNESS OF FIT Geometry of LS We ca thik of y ad the colums of X as members of the -dimesioal Euclidea space R Oe ca
1 Review of Probability & Statistics
 1 Review of Probability & Statistics a. I a group of 000 people, it has bee reported that there are: 61 smokers 670 over 5 960 people who imbibe (drik alcohol) 86 smokers who imbibe 90 imbibers over 5
Chapter 22. Comparing Two Proportions. Copyright 2010, 2007, 2004 Pearson Education, Inc.
 Chapter 22 Comparig Two Proportios Copyright 2010, 2007, 2004 Pearso Educatio, Ic. Comparig Two Proportios Read the first two paragraphs of pg 504. Comparisos betwee two percetages are much more commo
ST 305: Exam 3 ( ) = P(A)P(B A) ( ) = P(A) + P(B) ( ) = 1 P( A) ( ) = P(A) P(B) σ X 2 = σ a+bx. σ ˆp. σ X +Y. σ X Y. σ X. σ Y. σ n.
 = P(A)P(B A) ( ) = P(A) + P(B) ( ) = 1 P( A) ( ) = P(A) P(B) σ X 2 = σ a+bx. σ ˆp. σ X +Y. σ X Y. σ X. σ Y. σ n.") ST 305: Exam 3 By hadig i this completed exam, I state that I have either give or received assistace from aother perso durig the exam period. I have used o resources other tha the exam itself ad the basic
ST 305: Exam 3 By hadig i this completed exam, I state that I have either give or received assistace from aother perso durig the exam period. I have used o resources other tha the exam itself ad the basic
Statistics 511 Additional Materials
 Cofidece Itervals o mu Statistics 511 Additioal Materials This topic officially moves us from probability to statistics. We begi to discuss makig ifereces about the populatio. Oe way to differetiate probability
INTRODUCTORY MATHEMATICS AND STATISTICS FOR ECONOMISTS
 UNIVERSITY OF EAST ANGLIA School of Ecoomics Mai Series UG Examiatio 04-5 INTRODUCTORY MATHEMATICS AND STATISTICS FOR ECONOMISTS ECO-400Y Time allowed: 3 hours Aswer ALL questios. Show all workig icludig
SIMPLE LINEAR REGRESSION AND CORRELATION ANALYSIS
 SIMPLE LINEAR REGRESSION AND CORRELATION ANALSIS INTRODUCTION There are lot of statistical ivestigatio to kow whether there is a relatioship amog variables Two aalyses: (1) regressio aalysis; () correlatio
CHAPTER SUMMARIES MAT102 Dr J Lubowsky Page 1 of 13 Chapter 1: Introduction to Statistics
 CHAPTER SUMMARIES MAT102 Dr J Lubowsky Page 1 of 13 Chapter 1: Itroductio to Statistics Misleadig Iformatio: Surveys ad advertisig claims ca be biased by urepresetative samples, biased questios, iappropriate
Simple Linear Regression
 Chapter 2 Simple Liear Regressio 2.1 Simple liear model The simple liear regressio model shows how oe kow depedet variable is determied by a sigle explaatory variable (regressor). Is is writte as: Y i
Solutions to Odd-Numbered End-of-Chapter Exercises: Chapter 10
 Introduction to Econometrics (3 rd Updated Edition) by James H. Stock and Mark W. Watson Solutions to Odd-Numbered End-of-Chapter Exercises: Chapter 10 (This version July 20, 2014) Stock/Watson - Introduction
TAMS24: Notations and Formulas
 TAMS4: Notatios ad Formulas Basic otatios ad defiitios X: radom variable stokastiska variabel Mea Vätevärde: µ = X = by Xiagfeg Yag kpx k, if X is discrete, xf Xxdx, if X is cotiuous Variace Varias: =
t distribution [34] : used to test a mean against an hypothesized value (H 0 : µ = µ 0 ) or the difference
![t distribution [34] : used to test a mean against an hypothesized value (H 0 : µ = µ 0 ) or the difference](/thumbs/95/125833971.jpg "t distribution [34] : used to test a mean against an hypothesized value (H 0 : µ = µ 0 ) or the difference") EXST30 Backgroud material Page From the textbook The Statistical Sleuth Mea [0]: I your text the word mea deotes a populatio mea (µ) while the work average deotes a sample average ( ). Variace [0]: The
EXST30 Backgroud material Page From the textbook The Statistical Sleuth Mea [0]: I your text the word mea deotes a populatio mea (µ) while the work average deotes a sample average ( ). Variace [0]: The
Stat 225 Lecture Notes Week 7, Chapter 8 and 11
 Normal Distributio Stat 5 Lecture Notes Week 7, Chapter 8 ad Please also prit out the ormal radom variable table from the Stat 5 homepage. The ormal distributio is by far the most importat distributio
[ ] ( ) ( ) [ ] ( ) 1 [ ] [ ] Sums of Random Variables Y = a 1 X 1 + a 2 X 2 + +a n X n The expected value of Y is:
![[ ] ( ) ( ) [ ] ( ) 1 [ ] [ ] Sums of Random Variables Y = a 1 X 1 + a 2 X 2 + +a n X n The expected value of Y is:](/thumbs/89/98900182.jpg "[ ] ( ) ( ) [ ] ( ) 1 [ ] [ ] Sums of Random Variables Y = a 1 X 1 + a 2 X 2 + +a n X n The expected value of Y is:") PROBABILITY FUNCTIONS A radom variable X has a probabilit associated with each of its possible values. The probabilit is termed a discrete probabilit if X ca assume ol discrete values, or X = x, x, x 3,,
PROBABILITY FUNCTIONS A radom variable X has a probabilit associated with each of its possible values. The probabilit is termed a discrete probabilit if X ca assume ol discrete values, or X = x, x, x 3,,
Response Variable denoted by y it is the variable that is to be predicted measure of the outcome of an experiment also called the dependent variable
 Statistics Chapter 4 Correlatio ad Regressio If we have two (or more) variables we are usually iterested i the relatioship betwee the variables. Associatio betwee Variables Two variables are associated
Mathematical Notation Math Introduction to Applied Statistics
 Mathematical Notatio Math 113 - Itroductio to Applied Statistics Name : Use Word or WordPerfect to recreate the followig documets. Each article is worth 10 poits ad ca be prited ad give to the istructor
BHW #13 1/ Cooper. ENGR 323 Probabilistic Analysis Beautiful Homework # 13
 BHW # /5 ENGR Probabilistic Aalysis Beautiful Homework # Three differet roads feed ito a particular freeway etrace. Suppose that durig a fixed time period, the umber of cars comig from each road oto the
MA Advanced Econometrics: Properties of Least Squares Estimators
 MA Advaced Ecoometrics: Properties of Least Squares Estimators Karl Whela School of Ecoomics, UCD February 5, 20 Karl Whela UCD Least Squares Estimators February 5, 20 / 5 Part I Least Squares: Some Fiite-Sample
Statistics Lecture 27. Final review. Administrative Notes. Outline. Experiments. Sampling and Surveys. Administrative Notes
 Admiistrative Notes s - Lecture 7 Fial review Fial Exam is Tuesday, May 0th (3-5pm Covers Chapters -8 ad 0 i textbook Brig ID cards to fial! Allowed: Calculators, double-sided 8.5 x cheat sheet Exam Rooms:
Lecture 22: Review for Exam 2. 1 Basic Model Assumptions (without Gaussian Noise)
") Lecture 22: Review for Exam 2 Basic Model Assumptios (without Gaussia Noise) We model oe cotiuous respose variable Y, as a liear fuctio of p umerical predictors, plus oise: Y = β 0 + β X +... β p X p +
Lecture 22: Review for Exam 2 Basic Model Assumptios (without Gaussia Noise) We model oe cotiuous respose variable Y, as a liear fuctio of p umerical predictors, plus oise: Y = β 0 + β X +... β p X p +
Hypothesis Testing. Evaluation of Performance of Learned h. Issues. Trade-off Between Bias and Variance
 Hypothesis Testig Empirically evaluatig accuracy of hypotheses: importat activity i ML. Three questios: Give observed accuracy over a sample set, how well does this estimate apply over additioal samples?
Exam II Covers. STA 291 Lecture 19. Exam II Next Tuesday 5-7pm Memorial Hall (Same place as exam I) Makeup Exam 7:15pm 9:15pm Location CB 234
 Makeup Exam 7:15pm 9:15pm Location CB 234") STA 291 Lecture 19 Exam II Next Tuesday 5-7pm Memorial Hall (Same place as exam I) Makeup Exam 7:15pm 9:15pm Locatio CB 234 STA 291 - Lecture 19 1 Exam II Covers Chapter 9 10.1; 10.2; 10.3; 10.4; 10.6
STA 291 Lecture 19 Exam II Next Tuesday 5-7pm Memorial Hall (Same place as exam I) Makeup Exam 7:15pm 9:15pm Locatio CB 234 STA 291 - Lecture 19 1 Exam II Covers Chapter 9 10.1; 10.2; 10.3; 10.4; 10.6
April 18, 2017 CONFIDENCE INTERVALS AND HYPOTHESIS TESTING, UNDERGRADUATE MATH 526 STYLE
 April 18, 2017 CONFIDENCE INTERVALS AND HYPOTHESIS TESTING, UNDERGRADUATE MATH 526 STYLE TERRY SOO Abstract These otes are adapted from whe I taught Math 526 ad meat to give a quick itroductio to cofidece
ECONOMETRIC THEORY. MODULE XIII Lecture - 34 Asymptotic Theory and Stochastic Regressors
 ECONOMETRIC THEORY MODULE XIII Lecture - 34 Asymptotic Theory ad Stochastic Regressors Dr. Shalabh Departmet of Mathematics ad Statistics Idia Istitute of Techology Kapur Asymptotic theory The asymptotic
CONFIDENCE INTERVALS STUDY GUIDE
 CONFIDENCE INTERVALS STUDY UIDE Last uit, we discussed how sample statistics vary. Uder the right coditios, sample statistics like meas ad proportios follow a Normal distributio, which allows us to calculate
Chapter Vectors
 Chapter 4. Vectors fter readig this chapter you should be able to:. defie a vector. add ad subtract vectors. fid liear combiatios of vectors ad their relatioship to a set of equatios 4. explai what it
October 25, 2018 BIM 105 Probability and Statistics for Biomedical Engineers 1
 October 25, 2018 BIM 105 Probability ad Statistics for Biomedical Egieers 1 Populatio parameters ad Sample Statistics October 25, 2018 BIM 105 Probability ad Statistics for Biomedical Egieers 2 Ifereces
Solutions to Odd Numbered End of Chapter Exercises: Chapter 4
 Itroductio to Ecoometrics (3 rd Updated Editio) by James H. Stock ad Mark W. Watso Solutios to Odd Numbered Ed of Chapter Exercises: Chapter 4 (This versio July 2, 24) Stock/Watso - Itroductio to Ecoometrics
Homework 5 Solutions
 Homework 5 Solutios p329 # 12 No. To estimate the chace you eed the expected value ad stadard error. To do get the expected value you eed the average of the box ad to get the stadard error you eed the
EXAMINATIONS OF THE ROYAL STATISTICAL SOCIETY
 EXAMINATIONS OF THE ROYAL STATISTICAL SOCIETY HIGHER CERTIFICATE IN STATISTICS, 017 MODULE 4 : Liear models Time allowed: Oe ad a half hours Cadidates should aswer THREE questios. Each questio carries
Successful HE applicants. Information sheet A Number of applicants. Gender Applicants Accepts Applicants Accepts. Age. Domicile
 Successful HE applicats Sigificace tests use data from samples to test hypotheses. You will use data o successful applicatios for courses i higher educatio to aswer questios about proportios, for example,
S Y Y = ΣY 2 n. Using the above expressions, the correlation coefficient is. r = SXX S Y Y
 1 Sociology 405/805 Revised February 4, 004 Summary of Formulae for Bivariate Regressio ad Correlatio Let X be a idepedet variable ad Y a depedet variable, with observatios for each of the values of these
Class 27. Daniel B. Rowe, Ph.D. Department of Mathematics, Statistics, and Computer Science. Marquette University MATH 1700
 Class 7 Daiel B. Rowe, Ph.D. Departmet of Mathematics, Statistics, ad Computer Sciece Copyright 013 by D.B. Rowe 1 Ageda: Skip Recap Chapter 10.5 ad 10.6 Lecture Chapter 11.1-11. Review Chapters 9 ad 10
First, note that the LS residuals are orthogonal to the regressors. X Xb X y = 0 ( normal equations ; (k 1) ) So,
 ) So,") 0 2. OLS Part II The OLS residuals are orthogoal to the regressors. If the model icludes a itercept, the orthogoality of the residuals ad regressors gives rise to three results, which have limited practical
0 2. OLS Part II The OLS residuals are orthogoal to the regressors. If the model icludes a itercept, the orthogoality of the residuals ad regressors gives rise to three results, which have limited practical
Introduction to Econometrics (3 rd Updated Edition) Solutions to Odd- Numbered End- of- Chapter Exercises: Chapter 3
 Solutions to Odd- Numbered End- of- Chapter Exercises: Chapter 3") Itroductio to Ecoometrics (3 rd Updated Editio) by James H. Stock ad Mark W. Watso Solutios to Odd- Numbered Ed- of- Chapter Exercises: Chapter 3 (This versio August 17, 014) 015 Pearso Educatio, Ic. Stock/Watso
Itroductio to Ecoometrics (3 rd Updated Editio) by James H. Stock ad Mark W. Watso Solutios to Odd- Numbered Ed- of- Chapter Exercises: Chapter 3 (This versio August 17, 014) 015 Pearso Educatio, Ic. Stock/Watso
Topic 9: Sampling Distributions of Estimators
 Topic 9: Samplig Distributios of Estimators Course 003, 2018 Page 0 Samplig distributios of estimators Sice our estimators are statistics (particular fuctios of radom variables), their distributio ca be
Background Information
 Egieerig 33 Gayheart 5-63 1 Beautif ul Homework 5-63 Suppose t h a t whe t h e ph of a c e r t a i c h e m i c a l compoud i s 5.00, t h e ph measured by a radomly s e l e c t e d begiig chemistry studet
UNIT 11 MULTIPLE LINEAR REGRESSION
 UNIT MULTIPLE LINEAR REGRESSION Structure. Itroductio release relies Obectives. Multiple Liear Regressio Model.3 Estimatio of Model Parameters Use of Matrix Notatio Properties of Least Squares Estimates.4
MidtermII Review. Sta Fall Office Hours Wednesday 12:30-2:30pm Watch linear regression videos before lab on Thursday
 Aoucemets MidtermII Review Sta 101 - Fall 2016 Duke Uiversity, Departmet of Statistical Sciece Office Hours Wedesday 12:30-2:30pm Watch liear regressio videos before lab o Thursday Dr. Abrahamse Slides
The variance of a sum of independent variables is the sum of their variances, since covariances are zero. Therefore. V (xi )= n n 2 σ2 = σ2.
= n n 2 σ2 = σ2.") SAMPLE STATISTICS A radom sample x 1,x,,x from a distributio f(x) is a set of idepedetly ad idetically variables with x i f(x) for all i Their joit pdf is f(x 1,x,,x )=f(x 1 )f(x ) f(x )= f(x i ) The sample
SAMPLE STATISTICS A radom sample x 1,x,,x from a distributio f(x) is a set of idepedetly ad idetically variables with x i f(x) for all i Their joit pdf is f(x 1,x,,x )=f(x 1 )f(x ) f(x )= f(x i ) The sample
Simple Linear Regression. Copyright 2012 Pearson Education, Inc. Publishing as Prentice Hall. Chapter Chapter. β0 β1. β β = 1. a. b.
 Chapter 3 3- Simple Liear Regressio Chapter 3 3. a. b. c. d. 3.3 a. Usig the techique explaied i Exercise 3.: b. () = β + β β β 6 = + () 4 () = β + β β β 6 = + () β = β y= + x = β = 4 y= 4+ x β = c. =
Math 140 Introductory Statistics
 8.2 Testig a Proportio Math 1 Itroductory Statistics Professor B. Abrego Lecture 15 Sectios 8.2 People ofte make decisios with data by comparig the results from a sample to some predetermied stadard. These
7-1. Chapter 4. Part I. Sampling Distributions and Confidence Intervals
 7-1 Chapter 4 Part I. Samplig Distributios ad Cofidece Itervals 1 7- Sectio 1. Samplig Distributio 7-3 Usig Statistics Statistical Iferece: Predict ad forecast values of populatio parameters... Test hypotheses
MBACATÓLICA. Quantitative Methods. Faculdade de Ciências Económicas e Empresariais UNIVERSIDADE CATÓLICA PORTUGUESA 9. SAMPLING DISTRIBUTIONS
 MBACATÓLICA Quatitative Methods Miguel Gouveia Mauel Leite Moteiro Faculdade de Ciêcias Ecoómicas e Empresariais UNIVERSIDADE CATÓLICA PORTUGUESA 9. SAMPLING DISTRIBUTIONS MBACatólica 006/07 Métodos Quatitativos
STA Learning Objectives. Population Proportions. Module 10 Comparing Two Proportions. Upon completing this module, you should be able to:
 STA 2023 Module 10 Comparig Two Proportios Learig Objectives Upo completig this module, you should be able to: 1. Perform large-sample ifereces (hypothesis test ad cofidece itervals) to compare two populatio
bwght = cigs
 EEP 118 / IAS 118 Elisabeth Sadoulet ad Daley Kutzma Uiversity of Califoria at Berkeley Fall 013 Itroductory Applied Ecoometrics Midterm examiatio Scores add up to 50 (5 poits for each sub-questio) Your
Important Formulas. Expectation: E (X) = Σ [X P(X)] = n p q σ = n p q. P(X) = n! X1! X 2! X 3! X k! p X. Chapter 6 The Normal Distribution.
![Important Formulas. Expectation: E (X) = Σ [X P(X)] = n p q σ = n p q. P(X) = n! X1! X 2! X 3! X k! p X. Chapter 6 The Normal Distribution.](/thumbs/96/128489792.jpg "Important Formulas. Expectation: E (X) = Σ [X P(X)] = n p q σ = n p q. P(X) = n! X1! X 2! X 3! X k! p X. Chapter 6 The Normal Distribution.") Importat Formulas Chapter 3 Data Descriptio Mea for idividual data: X = _ ΣX Mea for grouped data: X= _ Σf X m Stadard deviatio for a sample: _ s = Σ(X _ X ) or s = 1 (Σ X ) (Σ X ) ( 1) Stadard deviatio
Importat Formulas Chapter 3 Data Descriptio Mea for idividual data: X = _ ΣX Mea for grouped data: X= _ Σf X m Stadard deviatio for a sample: _ s = Σ(X _ X ) or s = 1 (Σ X ) (Σ X ) ( 1) Stadard deviatio
Instructor: Judith Canner Spring 2010 CONFIDENCE INTERVALS How do we make inferences about the population parameters?
 CONFIDENCE INTERVALS How do we make ifereces about the populatio parameters? The samplig distributio allows us to quatify the variability i sample statistics icludig how they differ from the parameter
of the matrix is =-85, so it is not positive definite. Thus, the first
 BOSTON COLLEGE Departmet of Ecoomics EC771: Ecoometrics Sprig 4 Prof. Baum, Ms. Uysal Solutio Key for Problem Set 1 1. Are the followig quadratic forms positive for all values of x? (a) y = x 1 8x 1 x
Statistical and Mathematical Methods DS-GA 1002 December 8, Sample Final Problems Solutions
 Statistical ad Mathematical Methods DS-GA 00 December 8, 05. Short questios Sample Fial Problems Solutios a. Ax b has a solutio if b is i the rage of A. The dimesio of the rage of A is because A has liearly-idepedet
Lecture 11 Simple Linear Regression
 Lecture 11 Simple Liear Regressio Fall 2013 Prof. Yao Xie, yao.xie@isye.gatech.edu H. Milto Stewart School of Idustrial Systems & Egieerig Georgia Tech Midterm 2 mea: 91.2 media: 93.75 std: 6.5 2 Meddicorp
NANYANG TECHNOLOGICAL UNIVERSITY SYLLABUS FOR ENTRANCE EXAMINATION FOR INTERNATIONAL STUDENTS AO-LEVEL MATHEMATICS
 NANYANG TECHNOLOGICAL UNIVERSITY SYLLABUS FOR ENTRANCE EXAMINATION FOR INTERNATIONAL STUDENTS AO-LEVEL MATHEMATICS STRUCTURE OF EXAMINATION PAPER. There will be oe 2-hour paper cosistig of 4 questios.
Common Large/Small Sample Tests 1/55
 Commo Large/Small Sample Tests 1/55 Test of Hypothesis for the Mea (σ Kow) Covert sample result ( x) to a z value Hypothesis Tests for µ Cosider the test H :μ = μ H 1 :μ > μ σ Kow (Assume the populatio
Topic 9: Sampling Distributions of Estimators
 Topic 9: Samplig Distributios of Estimators Course 003, 2018 Page 0 Samplig distributios of estimators Sice our estimators are statistics (particular fuctios of radom variables), their distributio ca be
Statistics 203 Introduction to Regression and Analysis of Variance Assignment #1 Solutions January 20, 2005
 Statistics 203 Itroductio to Regressio ad Aalysis of Variace Assigmet #1 Solutios Jauary 20, 2005 Q. 1) (MP 2.7) (a) Let x deote the hydrocarbo percetage, ad let y deote the oxyge purity. The simple liear
Stat 139 Homework 7 Solutions, Fall 2015
 Stat 139 Homework 7 Solutios, Fall 2015 Problem 1. I class we leared that the classical simple liear regressio model assumes the followig distributio of resposes: Y i = β 0 + β 1 X i + ɛ i, i = 1,...,,
Efficient GMM LECTURE 12 GMM II
 DECEMBER 1 010 LECTURE 1 II Efficiet The estimator depeds o the choice of the weight matrix A. The efficiet estimator is the oe that has the smallest asymptotic variace amog all estimators defied by differet
Grant MacEwan University STAT 252 Dr. Karen Buro Formula Sheet
 Grat MacEwa Uiversity STAT 5 Dr. Kare Buro Formula Sheet Descriptive Statistics Sample Mea: x = x i i= Sample Variace: s = i= (x i x) = Σ i=x i (Σ i= x i) Sample Stadard Deviatio: s = Sample Variace =
STATISTICAL PROPERTIES OF LEAST SQUARES ESTIMATORS. Comments:
 Recall: STATISTICAL PROPERTIES OF LEAST SQUARES ESTIMATORS Commets:. So far we have estimates of the parameters! 0 ad!, but have o idea how good these estimates are. Assumptio: E(Y x)! 0 +! x (liear coditioal
Y i n. i=1. = 1 [number of successes] number of successes = n
![Y i n. i=1. = 1 [number of successes] number of successes = n](/thumbs/77/75932300.jpg "Y i n. i=1. = 1 [number of successes] number of successes = n") Eco 371 Problem Set # Aswer Sheet 3. I this questio, you are asked to cosider a Beroulli radom variable Y, with a success probability P ry 1 p. You are told that you have draws from this distributio ad
Eco 371 Problem Set # Aswer Sheet 3. I this questio, you are asked to cosider a Beroulli radom variable Y, with a success probability P ry 1 p. You are told that you have draws from this distributio ad
1036: Probability & Statistics
 036: Probability & Statistics Lecture 0 Oe- ad Two-Sample Tests of Hypotheses 0- Statistical Hypotheses Decisio based o experimetal evidece whether Coffee drikig icreases the risk of cacer i humas. A perso
Joint Probability Distributions and Random Samples. Jointly Distributed Random Variables. Chapter { }
 UCLA STAT A Applied Probability & Statistics for Egieers Istructor: Ivo Diov, Asst. Prof. I Statistics ad Neurology Teachig Assistat: Neda Farziia, UCLA Statistics Uiversity of Califoria, Los Ageles, Sprig
Final Examination Solutions 17/6/2010
 The Islamic Uiversity of Gaza Faculty of Commerce epartmet of Ecoomics ad Political Scieces A Itroductio to Statistics Course (ECOE 30) Sprig Semester 009-00 Fial Eamiatio Solutios 7/6/00 Name: I: Istructor:
Statistical Analysis on Uncertainty for Autocorrelated Measurements and its Applications to Key Comparisons
 Statistical Aalysis o Ucertaity for Autocorrelated Measuremets ad its Applicatios to Key Comparisos Nie Fa Zhag Natioal Istitute of Stadards ad Techology Gaithersburg, MD 0899, USA Outlies. Itroductio.
Logit regression Logit regression
 Logit regressio Logit regressio models the probability of Y= as the cumulative stadard logistic distributio fuctio, evaluated at z = β 0 + β X: Pr(Y = X) = F(β 0 + β X) F is the cumulative logistic distributio
Topic 18: Composite Hypotheses
 Toc 18: November, 211 Simple hypotheses limit us to a decisio betwee oe of two possible states of ature. This limitatio does ot allow us, uder the procedures of hypothesis testig to address the basic questio:
Read through these prior to coming to the test and follow them when you take your test.
 Math 143 Sprig 2012 Test 2 Iformatio 1 Test 2 will be give i class o Thursday April 5. Material Covered The test is cummulative, but will emphasize the recet material (Chapters 6 8, 10 11, ad Sectios 12.1
Stat 421-SP2012 Interval Estimation Section
 Stat 41-SP01 Iterval Estimatio Sectio 11.1-11. We ow uderstad (Chapter 10) how to fid poit estimators of a ukow parameter. o However, a poit estimate does ot provide ay iformatio about the ucertaity (possible
Simple Linear Regression Matrix Form
 Simple Liear Regressio Matrix Form Q.1. A foam beverage isulator (beer hugger) maufacturer produces their product for firms that wat their logo o beer huggers for marketig purposes. The firm s cost aalyst
We have also learned that, thanks to the Central Limit Theorem and the Law of Large Numbers,
 Cofidece Itervals III What we kow so far: We have see how to set cofidece itervals for the ea, or expected value, of a oral probability distributio, both whe the variace is kow (usig the stadard oral,
Output Analysis (2, Chapters 10 &11 Law)
") B. Maddah ENMG 6 Simulatio Output Aalysis (, Chapters 10 &11 Law) Comparig alterative system cofiguratio Sice the output of a simulatio is radom, the comparig differet systems via simulatio should be doe
B. Maddah ENMG 6 Simulatio Output Aalysis (, Chapters 10 &11 Law) Comparig alterative system cofiguratio Sice the output of a simulatio is radom, the comparig differet systems via simulatio should be doe
Working with Two Populations. Comparing Two Means
 Workig with Two Populatios Comparig Two Meas Coditios for Two-Sample Iferece The data are from two radom samples from two distict idepedet populatios. Normality. Two sample t procedures are more robust