Parametric technique
|
|
|
- Holly Cameron
- 5 years ago
- Views:
Transcription
1 Regression analysis

2 Parametric technique A parametric technique assumes that the variables conform to some distribution (i.e. gaussian) The properties of the distribution are assumed in the underlying statistical method Bimodal distribution: the distribution has two maxima Skewness: the distribution is not symmetrical Kurtosis: the distribution is not bell shaped
3 Supervised techniques Supervised techniques use information about the dependent variable to derive the model with the goal of assigning correct output for a given input
4 Simple Linear Regression Let s assume the relationship between x and y is linear Linear relationship can be defined by a straight line with parameters k and w Equation of the straight line: y(x)=w0+w1 x Usually the line may do not fit the data exactly But we can try making the line a reasonable approximation Deviation for the pair (xi, yi): εi=yi y(xi)=yi (w0+w1xi) The total error is defined as the sum-of-squared deviations: RSS=Siεi² The best fitting line is defined by w0 and w1 minimizing the total error w0 = intercept w1 = slope
5 Standard deviation sy= [RSS/(n-2)] n numero di coppie di dati misurati (xi, yi) n-2 numero di gradi di libertà Perché ora dividiamo per (n-2) piuttosto che per (n)? Consideriamo il caso limite n=2, ovvero il caso in cui abbiamo due coppie di dati misurati. Poiché per 2 punti passa sempre una retta, allora con due coppie di dati non si possono avere informazioni sull'affidabilità delle misure. In altri termini possiamo dire che per calcolare la deviazione standard di una regressione lineare di (n) coppie di dati, è necessario prima calcolare i valori dell'intercetta e della pendenza, abbiamo dunque 2 gradi di libertà in meno rispetto agli (n) iniziali ed è quindi opportuno dividere per (n-2). Più in generale possiamo dire che i gradi di libertà corrispondono al numero di quantità che possono essere assegnate arbitrariamente: il numero di gradi di libertà è pari al numero di misure indipendenti (n, numero di dati osservati) meno il numero di parametri (pendenza e intercetta in questo caso) che da queste misure si calcolano (vincoli)
6 Squared correlation coefficient r²=ess/tss=(tss-rss)/tss RSS: residual sum of squares (deviation of the point from the line) ESS: explained sum of squares (deviation of the line from the mean) TSS: total sum of squares (deviation of the point from the mean) Linear regression Mean value The quality of a simple linear regression equation may be quantified by the squared correlation coefficient r² r² indicates the fraction of the total variation in the dependent variables yi that is explained by the regression equation Possible values reported for r² fall between 0 and 1 An r² of 0 means that there is no relationship between the dependent variable y and the independent variable x An r² of 1 means there is perfect correlation Disadvantage: higher r² values are obtained for larger data set
7 r tables The value of r can be controlled in the appropriate tables of statistical data (calculated on distributions of Gaussian type) to determine the significance of the regression equation The correlation between x and y will be significant at the given probability level if the value of r exceeds the tabulated r value Note: you should ignore the sign (+ or -) of r value when reading this table n=number of data points c= number of constrains n-c= degrees of freedom n-c 95% 99% 99.9%
8 A diagram tells you more than thousand equations Visualization may not be as precise as statistics, but it provides a unique view onto data that can make it much easier to discover interesting structures than numerical methods Visualization also provides the context necessary to make better choices and to be more careful when fitting models
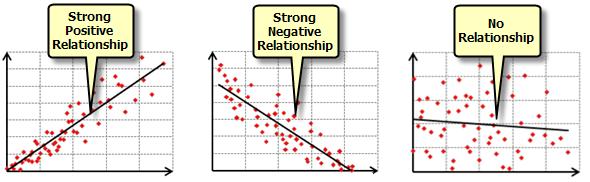
9 Anscombe s Quartet The plot appears to be a simple linear relationship, corresponding to two variables correlated and following the assumption of normality The distribution is linear, but with a different regression line, which is offset by the one outlier which exerts enough influence to alter the regression line and lower the correlation coefficient from 1 to While an obvious relationship between the two variables can be observed, it is not linear One outlier is enough to produce a high correlation coefficient, even though the relationship between the two variables is not linear Anscombe's quartet comprises four datasets (of 11 points) that have nearly identical simple statistical properties, yet appear very different when graphed
10 Anscombe s Quartet II I III IV I II III IV x y y y x y Property (in each case) Value Mean of x Variance of x Mean of y Variance of y or Linear regression line f(x)= x Correlation between x and y 0.816
11 Chance correlation problem
12 Fisher s statistic F = (n-c)/(c-1) ESS/RSS = (n-c)/(c-1) r²/(1-r²) Although the fit of the data to the regression line could be excellent, how can one decide if this correlation is based purely on chance? The higher the value for r² the less likely that the relationship is due to chance Given the assumption that the data has a Gaussian distribution, the F statistic assesses the statistical significance of the linear regression equation Values of F are available in statistical tables at different values of confidence If the calculated value is greater than the tabulated value then the equation is said to be significant at that particular level of confidence The value of F depends upon the number of independent variables in the equation and the number of data points As the number of data points increases and/or the number of independent variables falls so the value of F which corresponds to a particular confidence level also decreases This is because we would like to be able to explain a large number of data points with an equation containing as few variables as necessary Such an equation would be expected to have greater predictive power
13 (n-c)/(c-1)=(n-2)/(2-1)=n-2 n r² F values , E E E E E+18 1 Significance level Tabulated critical values of F for normal distributions 95.0% % % If we measured 12 pairs of data (n=12) and r²=0.8, then the probability that there is no relationship between dependent and independent variables is less than 1%: 10.04<17.78<21.04
14 Y-Scrambling A model MUST be validated on new independent data to avoid a chance correlation X1 Y1 Y2 X2 Y2 Y5 X3 Y3 Y4 X4 Y4 Y6 X5 Y5 Y1 X6 Y6 Y7 X7 Y7 Y3 R
15 Y-Scrambling X1 Y1 Y4 X2 Y2 Y1 X3 Y3 Y5 X4 Y4 Y2 X5 Y5 Y6 X6 Y6 Y3 X7 Y7 Y7 R
16 Y-Scrambling X1 Y1 Y7 X2 Y2 Y6 X3 Y3 Y3 X4 Y4 Y5 X5 Y5 Y4 X6 Y6 Y1 X7 Y7 Y2 R
17 Preparation of training and test sets Building of models Training set Initial data set Test % Splitting of an initial data set into training and test sets Selection of the best models according to statistical criteria Prediction calculations using the best models
 y ) 2")
 2 i =1")
18 Cross validation n m ( f ( x i ) y ) 2 r 2cv =q 2 = i =1 n m ( y i y ) 2 i =1
 a value is predicted for the data left out 4) this is repeated for every data point in")
19 Leave one out (LOO) The most common form of cross validation is leave one out : 1) a data value is left out 2) a model is derived using the remainder data 3) a value is predicted for the data left out 4) this is repeated for every data point in the set
20 Model s applicability domain Regression analysis is most effective for interpolation than extrapolation i.e., the region of experimental space described by the regression analysis has been explained, but projecting to a new, unanalysed region can be problematic
21 Model s applicability domain The data set should span the representation space evenly
22 Multiple linear regression: Linear regression in higher dimensions In order to analyse a relationship which is possibly influenced by several independent variables, it is useful to assess the contribution of each variable Multiple linear regression is used to determine the relative importance of multiple independent variables to the overall fit of the data For 2D inputs, linear regression fits a plane to the data: f(x1,x2)=w0+w1 x1+w2 x2 The best plane minimizes the sumof-squared deviations
23 Multiple linear regression Similar intuition carries over to higher dimensions too: fitting a pdimensional hyperplane to the data But it is hard to visualize in pictures... Multiple linear regression attempts to maximize the fit of the data to a regression equation (minimize the squared deviations from the regression equation) for the dependent variable (maximize the correlation coefficient) by adjusting each of the available parameters up or down Regression programs often approach this task in a stepwise fashion. That is, successive regression equations will be derived in which parameters will be either added or removed until the r² and s values are optimized The magnitude of the coefficients derived in this manner indicate the relative contribution of the associated parameter to dependent variable y
24
25
 The choice too many descriptors render the model too specific for the training set (a process called over-fitting): given enough parameters any data set can be fitted to a")
26 Overfitting Determining the most appropriate number of descriptors (and their nature) is generally a non-trivial task The choice of too few descriptors makes the model too general (with little, if any, predictive value) The choice too many descriptors render the model too specific for the training set (a process called over-fitting): given enough parameters any data set can be fitted to a regression line The consequence of this is that regression analysis generally requires significantly more compounds than parameters A useful rule of thumb is three to six times the number of parameters under consideration Model b performs well on the training examples, but poorly on new examples
27 Simple Linear Regression y1=w0+w1 x1 y2=w0+w1 x2 y3=w0+w1 x3 y4=w0+w1 x4 y4*1=w04*1+w1 x4*1 [ ][ ] [ ] y1 w0 y2 w0 = + w1. y3 w0 y4 w0 x1 x2 x3 x4
28 Single Linear Regression y1=w0 x10+w1 x11 y2=w0 x20+w1 x21 y3=w0 x30+w1 x31 y4=w0 x40+w1 x41 xi0=1 yn*1=xn*2 w2*1 [ ][ ] y1 x10 x 11 y2 x 20 x 21 w0 =. y3 x 30 x 31 w1 y4 x 40 x 41 [ ]
29 Single Linear Regression y1=w0 x10+w1 x11+ε1 y2=w0 x20+w1 x21+ε2 y3=w0 x30+w1 x31+ε3 y4=w0 x40+w1 x41+ε4 xi0=1 y4*1=x4*2 w2*1 [][ ] y1 x 10 x 11 ε1 y2 x 20 x 21 w 0 ε2 =. + y3 x 30 x 31 w 1 ε3 ε4 yn x 40 x 41 [ ][ ]
30 Double Linear Regression y1=w0 x10+w1 x11+w2 x12+ε1 y2=w0 x20+w1 x21+w2 x22+ε2 y3=w0 x30+w1 x31+w2 x32+ε3 y4=w0 x40+w1 x41+w2 x42+ε4 xi0=1 yn*1=x4*3 w3*1+ε4*1 [ ] [ ][ ] [ ] y1 x10 x 11 x12 w 0 ε1 y 2 = x 20 x 21 x 22. ε2 + w1 ε y3 x 30 x 31 x 32 3 w 2 ε4 y4 x 40 x 41 x 42
31 Triple Linear Regression y1=w0 x10+w1 x11+w2 x12+w3 x13+ε1 y2=w0 x20+w1 x21+w2 x22+w3 x23+ε2 y3=w0 x30+w1 x31+w2 x32+w3 x33+ε3 y4=w0 x40+w1 x41+w2 x42+w3 x43+ε4 xi0=1 y =X w +ε 4*1 4*4 4*1 4*1 [ ] [ ][ ] [ ] y1 x10 x 11 x12 x 13 w0 ε 1 y2 x x x x w = ε2 y3 x 30 x 31 x 32 x 33 w 2 ε3 ε4 y4 x 40 x 41 x 42 x 43 w3
32 Bivariate-Triple Linear Regression y11=w01 x10+w11 x11+w21 x12+w31 x13+ε11 y21=w01 x20+w11 x21+w21 x22+w31 x23+ε21 y31=w01 x30+w11 x31+w21 x32+w31 x33+ε31 y41=w01 x40+w11 x41+w21 x42+w31 x43+ε41 y12=w02 x10+w12 x11+w22 x12+w32 x13+ε12 y22=w02 x20+w12 x21+w22 x22+w32 x23+ε22 y32=w02 x30+w12 x31+w22 x32+w32 x33+ε32 y42=w02 x40+w12 x41+w22 x42+w32 x43+ε42 xi0=1 multivariate problems: there is more than one dependent variable Y4*2=X4*4 W4*2+E4*2 [ ] [ ][ ] [ y 11 y 12 x10 x 11 x 12 x 13 w 01 w 02 ε ε y 21 y 22 x x x x w w = ε21 ε22 y 31 y 32 x 30 x 31 x 32 x 33 w 21 w 22 ε31 ε32 ε41 ε42 y 41 y 42 x 40 x 41 x 42 x 43 w 31 w 32 ]
33 Multiple Linear Regression yn*1=xn*(p+1) w(p+1)*1+εn*1 Multivariate Linear Regression Yn*k=Xn*(p+1) W(p+1)*k+En*k xi0=1 xi0=1 Y={y(1),..., y(k)} dependent variables (observations) X={x(1),..., x(p+1)} independent variables (parameters), x(1)=1 W={w(1),..., w(p+1)}weights E={ε(1),..., ε(k)} error matrix n=number of data points p+1=number independent variables k=number dependent variables
34 Metodo dei minimi quadrati Y = X W + E Col metodo dei minimi quadrati si determina la matrice dei pesi W che minimizza gli errori quadratici S=E E=(Y-X W) (YX W) assumendo che gli errori siano casuali e indipendenti Si procede calcolando la derivata di E E rispetto a W e si trova che: W=(X X)-1X Y Dunque le predizioni sono date da: Y=X W Y=X (X X)-1 X Y Y=H Y
Fixed Priority Scheduling
 Fixed Priority Scheduling Giuseppe Lipari http://feanor.sssup.it/~lipari Scuola Superiore Sant Anna Pisa January 13, 2011 Outline 1 Fixed priority 2 Priority assignment 3 Scheduling analysis 4 A necessary
Statistical concepts in QSAR.
 Statistical concepts in QSAR. Computational chemistry represents molecular structures as a numerical models and simulates their behavior with the equations of quantum and classical physics. Available programs
Simple Linear Regression
 Simple Linear Regression ST 430/514 Recall: A regression model describes how a dependent variable (or response) Y is affected, on average, by one or more independent variables (or factors, or covariates)
LINEAR REGRESSION, RIDGE, LASSO, SVR
 LINEAR REGRESSION, RIDGE, LASSO, SVR Supervised Learning Katerina Tzompanaki Linear regression one feature* Price (y) What is the estimated price of a new house of area 30 m 2? 30 Area (x) *Also called
Microeconometria Day # 5 L. Cembalo. Regressione con due variabili e ipotesi dell OLS
 Microeconometria Day # 5 L. Cembalo Regressione con due variabili e ipotesi dell OLS Multiple regression model Classical hypothesis of a regression model: Assumption 1: Linear regression model.the regression
Linear Regression. Chapter 3
 Chapter 3 Linear Regression Once we ve acquired data with multiple variables, one very important question is how the variables are related. For example, we could ask for the relationship between people
Data Analysis and Statistical Methods Statistics 651
 y 1 2 3 4 5 6 7 x Data Analysis and Statistical Methods Statistics 651 http://www.stat.tamu.edu/~suhasini/teaching.html Lecture 32 Suhasini Subba Rao Previous lecture We are interested in whether a dependent
Reminders. Thought questions should be submitted on eclass. Please list the section related to the thought question
 Linear regression Reminders Thought questions should be submitted on eclass Please list the section related to the thought question If it is a more general, open-ended question not exactly related to a
Basic Business Statistics 6 th Edition
 Basic Business Statistics 6 th Edition Chapter 12 Simple Linear Regression Learning Objectives In this chapter, you learn: How to use regression analysis to predict the value of a dependent variable based
Statistics for classification
 AstroInformatics Statistics for classification Una rappresentazione utile è la matrice di confusione. L elemento sulla riga i e sulla colonna j è il numero assoluto oppure la percentuale di casi della
Chapter 14 Simple Linear Regression (A)
") Chapter 14 Simple Linear Regression (A) 1. Characteristics Managerial decisions often are based on the relationship between two or more variables. can be used to develop an equation showing how the variables
Chapter 14 Simple Linear Regression (A) 1. Characteristics Managerial decisions often are based on the relationship between two or more variables. can be used to develop an equation showing how the variables
Chapter 16. Simple Linear Regression and dcorrelation
 Chapter 16 Simple Linear Regression and dcorrelation 16.1 Regression Analysis Our problem objective is to analyze the relationship between interval variables; regression analysis is the first tool we will
Chapte The McGraw-Hill Companies, Inc. All rights reserved.
 12er12 Chapte Bivariate i Regression (Part 1) Bivariate Regression Visual Displays Begin the analysis of bivariate data (i.e., two variables) with a scatter plot. A scatter plot - displays each observed
Engineering 7: Introduction to computer programming for scientists and engineers
 Engineering 7: Introduction to computer programming for scientists and engineers Interpolation Recap Polynomial interpolation Spline interpolation Regression and Interpolation: learning functions from
Simple Linear Regression
 Simple Linear Regression In simple linear regression we are concerned about the relationship between two variables, X and Y. There are two components to such a relationship. 1. The strength of the relationship.
df=degrees of freedom = n - 1
 One sample t-test test of the mean Assumptions: Independent, random samples Approximately normal distribution (from intro class: σ is unknown, need to calculate and use s (sample standard deviation)) Hypotheses:
Statistics for Managers using Microsoft Excel 6 th Edition
 Statistics for Managers using Microsoft Excel 6 th Edition Chapter 13 Simple Linear Regression 13-1 Learning Objectives In this chapter, you learn: How to use regression analysis to predict the value of
EM375 STATISTICS AND MEASUREMENT UNCERTAINTY CORRELATION OF EXPERIMENTAL DATA
 EM375 STATISTICS AND MEASUREMENT UNCERTAINTY CORRELATION OF EXPERIMENTAL DATA In this unit of the course we use statistical methods to look for trends in data. Often experiments are conducted by having
Business Statistics. Tommaso Proietti. Linear Regression. DEF - Università di Roma 'Tor Vergata'
 Business Statistics Tommaso Proietti DEF - Università di Roma 'Tor Vergata' Linear Regression Specication Let Y be a univariate quantitative response variable. We model Y as follows: Y = f(x) + ε where
Modeling Data with Linear Combinations of Basis Functions. Read Chapter 3 in the text by Bishop
 Modeling Data with Linear Combinations of Basis Functions Read Chapter 3 in the text by Bishop A Type of Supervised Learning Problem We want to model data (x 1, t 1 ),..., (x N, t N ), where x i is a vector
Linear Regression Spring 2014
 Linear Regression 18.05 Spring 2014 Agenda Fitting curves to bivariate data Measuring the goodness of fit The fit vs. complexity tradeoff Regression to the mean Multiple linear regression January 1, 2017
4 Multiple Linear Regression
 4 Multiple Linear Regression 4. The Model Definition 4.. random variable Y fits a Multiple Linear Regression Model, iff there exist β, β,..., β k R so that for all (x, x 2,..., x k ) R k where ε N (, σ
Statistical View of Least Squares
 Basic Ideas Some Examples Least Squares May 22, 2007 Basic Ideas Simple Linear Regression Basic Ideas Some Examples Least Squares Suppose we have two variables x and y Basic Ideas Simple Linear Regression
Review of Statistics
 Review of Statistics Topics Descriptive Statistics Mean, Variance Probability Union event, joint event Random Variables Discrete and Continuous Distributions, Moments Two Random Variables Covariance and
Inferences for Regression
 Inferences for Regression An Example: Body Fat and Waist Size Looking at the relationship between % body fat and waist size (in inches). Here is a scatterplot of our data set: Remembering Regression In
MFin Econometrics I Session 4: t-distribution, Simple Linear Regression, OLS assumptions and properties of OLS estimators
 MFin Econometrics I Session 4: t-distribution, Simple Linear Regression, OLS assumptions and properties of OLS estimators Thilo Klein University of Cambridge Judge Business School Session 4: Linear regression,
This model of the conditional expectation is linear in the parameters. A more practical and relaxed attitude towards linear regression is to say that
 Linear Regression For (X, Y ) a pair of random variables with values in R p R we assume that E(Y X) = β 0 + with β R p+1. p X j β j = (1, X T )β j=1 This model of the conditional expectation is linear
Chapter 1: Linear Regression with One Predictor Variable also known as: Simple Linear Regression Bivariate Linear Regression
 BSTT523: Kutner et al., Chapter 1 1 Chapter 1: Linear Regression with One Predictor Variable also known as: Simple Linear Regression Bivariate Linear Regression Introduction: Functional relation between
Regression Models. Chapter 4. Introduction. Introduction. Introduction
 Chapter 4 Regression Models Quantitative Analysis for Management, Tenth Edition, by Render, Stair, and Hanna 008 Prentice-Hall, Inc. Introduction Regression analysis is a very valuable tool for a manager
Midterm 2 - Solutions
 Ecn 102 - Analysis of Economic Data University of California - Davis February 23, 2010 Instructor: John Parman Midterm 2 - Solutions You have until 10:20am to complete this exam. Please remember to put
2 Regression Analysis
 FORK 1002 Preparatory Course in Statistics: 2 Regression Analysis Genaro Sucarrat (BI) http://www.sucarrat.net/ Contents: 1 Bivariate Correlation Analysis 2 Simple Regression 3 Estimation and Fit 4 T -Test:
Practical Statistics
 Practical Statistics Lecture 1 (Nov. 9): - Correlation - Hypothesis Testing Lecture 2 (Nov. 16): - Error Estimation - Bayesian Analysis - Rejecting Outliers Lecture 3 (Nov. 18) - Monte Carlo Modeling -
9. Linear Regression and Correlation
 9. Linear Regression and Correlation Data: y a quantitative response variable x a quantitative explanatory variable (Chap. 8: Recall that both variables were categorical) For example, y = annual income,
Unit 10: Simple Linear Regression and Correlation
 Unit 10: Simple Linear Regression and Correlation Statistics 571: Statistical Methods Ramón V. León 6/28/2004 Unit 10 - Stat 571 - Ramón V. León 1 Introductory Remarks Regression analysis is a method for
Business Statistics. Lecture 9: Simple Regression
 Business Statistics Lecture 9: Simple Regression 1 On to Model Building! Up to now, class was about descriptive and inferential statistics Numerical and graphical summaries of data Confidence intervals
Correlation Analysis
 Simple Regression Correlation Analysis Correlation analysis is used to measure strength of the association (linear relationship) between two variables Correlation is only concerned with strength of the
+ Statistical Methods in
 + Statistical Methods in Practice STAT/MATH 3379 + Discovering Statistics 2nd Edition Daniel T. Larose Dr. A. B. W. Manage Associate Professor of Mathematics & Statistics Department of Mathematics & Statistics
Linear Regression In God we trust, all others bring data. William Edwards Deming
 Linear Regression ddebarr@uw.edu 2017-01-19 In God we trust, all others bring data. William Edwards Deming Course Outline 1. Introduction to Statistical Learning 2. Linear Regression 3. Classification
2 Prediction and Analysis of Variance
 2 Prediction and Analysis of Variance Reading: Chapters and 2 of Kennedy A Guide to Econometrics Achen, Christopher H. Interpreting and Using Regression (London: Sage, 982). Chapter 4 of Andy Field, Discovering
MATH 1150 Chapter 2 Notation and Terminology
 MATH 1150 Chapter 2 Notation and Terminology Categorical Data The following is a dataset for 30 randomly selected adults in the U.S., showing the values of two categorical variables: whether or not the
Linear Model Selection and Regularization
 Linear Model Selection and Regularization Recall the linear model Y = β 0 + β 1 X 1 + + β p X p + ɛ. In the lectures that follow, we consider some approaches for extending the linear model framework. In
Estimating σ 2. We can do simple prediction of Y and estimation of the mean of Y at any value of X.
 Estimating σ 2 We can do simple prediction of Y and estimation of the mean of Y at any value of X. To perform inferences about our regression line, we must estimate σ 2, the variance of the error term.
Data Mining - SVM. Dr. Jean-Michel RICHER Dr. Jean-Michel RICHER Data Mining - SVM 1 / 55
 Data Mining - SVM Dr. Jean-Michel RICHER 2018 jean-michel.richer@univ-angers.fr Dr. Jean-Michel RICHER Data Mining - SVM 1 / 55 Outline 1. Introduction 2. Linear regression 3. Support Vector Machine 4.
Chapter 16. Simple Linear Regression and Correlation
 Chapter 16 Simple Linear Regression and Correlation 16.1 Regression Analysis Our problem objective is to analyze the relationship between interval variables; regression analysis is the first tool we will
Advanced Engineering Statistics - Section 5 - Jay Liu Dept. Chemical Engineering PKNU
 Advanced Engineering Statistics - Section 5 - Jay Liu Dept. Chemical Engineering PKNU Least squares regression What we will cover Box, G.E.P., Use and abuse of regression, Technometrics, 8 (4), 625-629,
Simple Linear Regression: The Model
 Simple Linear Regression: The Model task: quantifying the effect of change X in X on Y, with some constant β 1 : Y = β 1 X, linear relationship between X and Y, however, relationship subject to a random
ES-2 Lecture: More Least-squares Fitting. Spring 2017
 ES-2 Lecture: More Least-squares Fitting Spring 2017 Outline Quick review of least-squares line fitting (also called `linear regression ) How can we find the best-fit line? (Brute-force method is not efficient)
QSAR/QSPR modeling. Quantitative Structure-Activity Relationships Quantitative Structure-Property-Relationships
 Quantitative Structure-Activity Relationships Quantitative Structure-Property-Relationships QSAR/QSPR modeling Alexandre Varnek Faculté de Chimie, ULP, Strasbourg, FRANCE QSAR/QSPR models Development Validation
appstats27.notebook April 06, 2017
 Chapter 27 Objective Students will conduct inference on regression and analyze data to write a conclusion. Inferences for Regression An Example: Body Fat and Waist Size pg 634 Our chapter example revolves
CHAPTER 5. Outlier Detection in Multivariate Data
 CHAPTER 5 Outlier Detection in Multivariate Data 5.1 Introduction Multivariate outlier detection is the important task of statistical analysis of multivariate data. Many methods have been proposed for
Regression. Oscar García
 Regression Oscar García Regression methods are fundamental in Forest Mensuration For a more concise and general presentation, we shall first review some matrix concepts 1 Matrices An order n m matrix is
Linear Models for Regression. Sargur Srihari
 Linear Models for Regression Sargur srihari@cedar.buffalo.edu 1 Topics in Linear Regression What is regression? Polynomial Curve Fitting with Scalar input Linear Basis Function Models Maximum Likelihood
Chapter 1. The Noble Eightfold Path to Linear Regression
 Chapter 1 The Noble Eightfold Path to Linear Regression In this chapter, I show several di erent ways of solving the linear regression problem. The di erent approaches are interesting in their own way.
Trendlines Simple Linear Regression Multiple Linear Regression Systematic Model Building Practical Issues
 Trendlines Simple Linear Regression Multiple Linear Regression Systematic Model Building Practical Issues Overfitting Categorical Variables Interaction Terms Non-linear Terms Linear Logarithmic y = a +
Applied Regression Modeling: A Business Approach Chapter 3: Multiple Linear Regression Sections
 Applied Regression Modeling: A Business Approach Chapter 3: Multiple Linear Regression Sections 3.1 3.3.2 by Iain Pardoe 3.1 Probability model for (X 1, X 2,...) and Y 2 Multiple linear regression................................................
Homework 2: Simple Linear Regression
 STAT 4385 Applied Regression Analysis Homework : Simple Linear Regression (Simple Linear Regression) Thirty (n = 30) College graduates who have recently entered the job market. For each student, the CGPA
Chapter 4. Probability and Statistics. Probability and Statistics
 Chapter 4 Probability and Statistics Figliola and Beasley, (999) Probability and Statistics Engineering measurements taken repeatedly under seemingly ideal conditions will normally show variability. Measurement
Learning Goals. 2. To be able to distinguish between a dependent and independent variable.
 Learning Goals 1. To understand what a linear regression is. 2. To be able to distinguish between a dependent and independent variable. 3. To understand what the correlation coefficient measures. 4. To
Introduction to Machine Learning Prof. Sudeshna Sarkar Department of Computer Science and Engineering Indian Institute of Technology, Kharagpur
 Introduction to Machine Learning Prof. Sudeshna Sarkar Department of Computer Science and Engineering Indian Institute of Technology, Kharagpur Module 2 Lecture 05 Linear Regression Good morning, welcome
Keller: Stats for Mgmt & Econ, 7th Ed July 17, 2006
 Chapter 17 Simple Linear Regression and Correlation 17.1 Regression Analysis Our problem objective is to analyze the relationship between interval variables; regression analysis is the first tool we will
Analysis of Simulated Data
 Analysis of Simulated Data Media Media di una popolazione: somma di tutti i valori delle variabili della popolazione diviso il numero di unità della popolazione (N) µ N i= = 1 N X i Dove: - N = numero
Reconstruction, prediction and. of multiple monthly stream-flow series
 Reconstruction, prediction and simulation of multiple monthly stream-flow series L. TORELLI Received on April 2nd, 1970 SUMMARY. The logarithms of monthly stream-flows are usually found to have a Normal
MultiDimensional Signal Processing Master Degree in Ingegneria delle Telecomunicazioni A.A
 MultiDimensional Signal Processing Master Degree in Ingegneria delle Telecomunicazioni A.A. 2017-2018 Pietro Guccione, PhD DEI - DIPARTIMENTO DI INGEGNERIA ELETTRICA E DELL INFORMAZIONE POLITECNICO DI
CMU-Q Lecture 24:
 CMU-Q 15-381 Lecture 24: Supervised Learning 2 Teacher: Gianni A. Di Caro SUPERVISED LEARNING Hypotheses space Hypothesis function Labeled Given Errors Performance criteria Given a collection of input
Quantitative Analysis of Financial Markets. Summary of Part II. Key Concepts & Formulas. Christopher Ting. November 11, 2017
 Summary of Part II Key Concepts & Formulas Christopher Ting November 11, 2017 christopherting@smu.edu.sg http://www.mysmu.edu/faculty/christophert/ Christopher Ting 1 of 16 Why Regression Analysis? Understand
Tutorial 6: Linear Regression
 Tutorial 6: Linear Regression Rob Nicholls nicholls@mrc-lmb.cam.ac.uk MRC LMB Statistics Course 2014 Contents 1 Introduction to Simple Linear Regression................ 1 2 Parameter Estimation and Model
Lecture 3. The Population Variance. The population variance, denoted σ 2, is the sum. of the squared deviations about the population
 Lecture 5 1 Lecture 3 The Population Variance The population variance, denoted σ 2, is the sum of the squared deviations about the population mean divided by the number of observations in the population,
Statistical Pattern Recognition
 Statistical Pattern Recognition Feature Extraction Hamid R. Rabiee Jafar Muhammadi, Alireza Ghasemi, Payam Siyari Spring 2014 http://ce.sharif.edu/courses/92-93/2/ce725-2/ Agenda Dimensionality Reduction
Of small numbers with big influence The Sum Of Squares
 Of small numbers with big influence The Sum Of Squares Dr. Peter Paul Heym Sum Of Squares Often, the small things make the biggest difference in life. Sometimes these things we do not recognise at first
Introduction to Machine Learning
 10-701 Introduction to Machine Learning PCA Slides based on 18-661 Fall 2018 PCA Raw data can be Complex, High-dimensional To understand a phenomenon we measure various related quantities If we knew what
1 Correlation and Inference from Regression
 1 Correlation and Inference from Regression Reading: Kennedy (1998) A Guide to Econometrics, Chapters 4 and 6 Maddala, G.S. (1992) Introduction to Econometrics p. 170-177 Moore and McCabe, chapter 12 is
Regression Diagnostics Procedures
 Regression Diagnostics Procedures ASSUMPTIONS UNDERLYING REGRESSION/CORRELATION NORMALITY OF VARIANCE IN Y FOR EACH VALUE OF X For any fixed value of the independent variable X, the distribution of the
Marcel Dettling. Applied Statistical Regression AS 2012 Week 05. ETH Zürich, October 22, Institute for Data Analysis and Process Design
 Marcel Dettling Institute for Data Analysis and Process Design Zurich University of Applied Sciences marcel.dettling@zhaw.ch http://stat.ethz.ch/~dettling ETH Zürich, October 22, 2012 1 What is Regression?
Linear Models 1. Isfahan University of Technology Fall Semester, 2014
 Linear Models 1 Isfahan University of Technology Fall Semester, 2014 References: [1] G. A. F., Seber and A. J. Lee (2003). Linear Regression Analysis (2nd ed.). Hoboken, NJ: Wiley. [2] A. C. Rencher and
WEIGHTED LEAST SQUARES. Model Assumptions for Weighted Least Squares: Recall: We can fit least squares estimates just assuming a linear mean function.
 1 2 WEIGHTED LEAST SQUARES Recall: We can fit least squares estimates just assuming a linear mean function. Without the constant variance assumption, we can still conclude that the coefficient estimators
Six Sigma Black Belt Study Guides
 Six Sigma Black Belt Study Guides 1 www.pmtutor.org Powered by POeT Solvers Limited. Analyze Correlation and Regression Analysis 2 www.pmtutor.org Powered by POeT Solvers Limited. Variables and relationships
STAT5044: Regression and Anova. Inyoung Kim
 STAT5044: Regression and Anova Inyoung Kim 2 / 47 Outline 1 Regression 2 Simple Linear regression 3 Basic concepts in regression 4 How to estimate unknown parameters 5 Properties of Least Squares Estimators:
Machine Learning Linear Regression. Prof. Matteo Matteucci
 Machine Learning Linear Regression Prof. Matteo Matteucci Outline 2 o Simple Linear Regression Model Least Squares Fit Measures of Fit Inference in Regression o Multi Variate Regession Model Least Squares
Regression Analysis. Table Relationship between muscle contractile force (mj) and stimulus intensity (mv).
 and stimulus intensity (mv).") Regression Analysis Two variables may be related in such a way that the magnitude of one, the dependent variable, is assumed to be a function of the magnitude of the second, the independent variable; however,
Regression Analysis Two variables may be related in such a way that the magnitude of one, the dependent variable, is assumed to be a function of the magnitude of the second, the independent variable; however,
STAT Chapter 11: Regression
 STAT 515 -- Chapter 11: Regression Mostly we have studied the behavior of a single random variable. Often, however, we gather data on two random variables. We wish to determine: Is there a relationship
ECE521 week 3: 23/26 January 2017
 ECE521 week 3: 23/26 January 2017 Outline Probabilistic interpretation of linear regression - Maximum likelihood estimation (MLE) - Maximum a posteriori (MAP) estimation Bias-variance trade-off Linear
Multivariate Regression
 Multivariate Regression The so-called supervised learning problem is the following: we want to approximate the random variable Y with an appropriate function of the random variables X 1,..., X p with the
Perceptron Revisited: Linear Separators. Support Vector Machines
 Support Vector Machines Perceptron Revisited: Linear Separators Binary classification can be viewed as the task of separating classes in feature space: w T x + b > 0 w T x + b = 0 w T x + b < 0 Department
THE ROYAL STATISTICAL SOCIETY 2008 EXAMINATIONS SOLUTIONS HIGHER CERTIFICATE (MODULAR FORMAT) MODULE 4 LINEAR MODELS
 MODULE 4 LINEAR MODELS") THE ROYAL STATISTICAL SOCIETY 008 EXAMINATIONS SOLUTIONS HIGHER CERTIFICATE (MODULAR FORMAT) MODULE 4 LINEAR MODELS The Society provides these solutions to assist candidates preparing for the examinations
THE ROYAL STATISTICAL SOCIETY 008 EXAMINATIONS SOLUTIONS HIGHER CERTIFICATE (MODULAR FORMAT) MODULE 4 LINEAR MODELS The Society provides these solutions to assist candidates preparing for the examinations
y Xw 2 2 y Xw λ w 2 2
 CS 189 Introduction to Machine Learning Spring 2018 Note 4 1 MLE and MAP for Regression (Part I) So far, we ve explored two approaches of the regression framework, Ordinary Least Squares and Ridge Regression:
Need for Several Predictor Variables
 Multiple regression One of the most widely used tools in statistical analysis Matrix expressions for multiple regression are the same as for simple linear regression Need for Several Predictor Variables
Linear Regression. Simple linear regression model determines the relationship between one dependent variable (y) and one independent variable (x).
 and one independent variable (x).") Linear Regression Simple linear regression model determines the relationship between one dependent variable (y) and one independent variable (x). A dependent variable is a random variable whose variation
Linear Regression Simple linear regression model determines the relationship between one dependent variable (y) and one independent variable (x). A dependent variable is a random variable whose variation
Linear Regression 1 / 25. Karl Stratos. June 18, 2018
 Linear Regression Karl Stratos June 18, 2018 1 / 25 The Regression Problem Problem. Find a desired input-output mapping f : X R where the output is a real value. x = = y = 0.1 How much should I turn my
Glossary. The ISI glossary of statistical terms provides definitions in a number of different languages:
 Glossary The ISI glossary of statistical terms provides definitions in a number of different languages: http://isi.cbs.nl/glossary/index.htm Adjusted r 2 Adjusted R squared measures the proportion of the
BIOL 458 BIOMETRY Lab 9 - Correlation and Bivariate Regression
 BIOL 458 BIOMETRY Lab 9 - Correlation and Bivariate Regression Introduction to Correlation and Regression The procedures discussed in the previous ANOVA labs are most useful in cases where we are interested
Lectures on Simple Linear Regression Stat 431, Summer 2012
 Lectures on Simple Linear Regression Stat 43, Summer 0 Hyunseung Kang July 6-8, 0 Last Updated: July 8, 0 :59PM Introduction Previously, we have been investigating various properties of the population
INTRODUCTION TO BASIC LINEAR REGRESSION MODEL
 INTRODUCTION TO BASIC LINEAR REGRESSION MODEL 13 September 2011 Yogyakarta, Indonesia Cosimo Beverelli (World Trade Organization) 1 LINEAR REGRESSION MODEL In general, regression models estimate the effect
SMA 6304 / MIT / MIT Manufacturing Systems. Lecture 10: Data and Regression Analysis. Lecturer: Prof. Duane S. Boning
 SMA 6304 / MIT 2.853 / MIT 2.854 Manufacturing Systems Lecture 10: Data and Regression Analysis Lecturer: Prof. Duane S. Boning 1 Agenda 1. Comparison of Treatments (One Variable) Analysis of Variance
CHAPTER 4 DESCRIPTIVE MEASURES IN REGRESSION AND CORRELATION
 STP 226 ELEMENTARY STATISTICS CHAPTER 4 DESCRIPTIVE MEASURES IN REGRESSION AND CORRELATION Linear Regression and correlation allows us to examine the relationship between two or more quantitative variables.
Two-Variable Regression Model: The Problem of Estimation
 Two-Variable Regression Model: The Problem of Estimation Introducing the Ordinary Least Squares Estimator Jamie Monogan University of Georgia Intermediate Political Methodology Jamie Monogan (UGA) Two-Variable
6x 2 8x + 5 ) = 12x 8
 = 12x 8") Example. If f(x) = x 3 4x + 5x + 1, then f (x) = 6x 8x + 5 Observation: f (x) is also a differentiable function... d dx ( f (x) ) = d dx ( 6x 8x + 5 ) = 1x 8 The derivative of f (x) is called the second
Example. If f(x) = x 3 4x + 5x + 1, then f (x) = 6x 8x + 5 Observation: f (x) is also a differentiable function... d dx ( f (x) ) = d dx ( 6x 8x + 5 ) = 1x 8 The derivative of f (x) is called the second
Modelli Lineari (Generalizzati) e SVM
 e SVM") Modelli Lineari (Generalizzati) e SVM Corso di AA, anno 2018/19, Padova Fabio Aiolli 19/26 Novembre 2018 Fabio Aiolli Modelli Lineari (Generalizzati) e SVM 19/26 Novembre 2018 1 / 36 Outline Linear methods
Modelli Lineari (Generalizzati) e SVM Corso di AA, anno 2018/19, Padova Fabio Aiolli 19/26 Novembre 2018 Fabio Aiolli Modelli Lineari (Generalizzati) e SVM 19/26 Novembre 2018 1 / 36 Outline Linear methods
3 Multiple Linear Regression
 3 Multiple Linear Regression 3.1 The Model Essentially, all models are wrong, but some are useful. Quote by George E.P. Box. Models are supposed to be exact descriptions of the population, but that is
MA 575 Linear Models: Cedric E. Ginestet, Boston University Midterm Review Week 7
 MA 575 Linear Models: Cedric E. Ginestet, Boston University Midterm Review Week 7 1 Random Vectors Let a 0 and y be n 1 vectors, and let A be an n n matrix. Here, a 0 and A are non-random, whereas y is
Regression Models - Introduction
 Regression Models - Introduction In regression models, two types of variables that are studied: A dependent variable, Y, also called response variable. It is modeled as random. An independent variable,