Bayesian inference on earthquake size distribution: a case study in Italy
|
|
|
- Penelope Ford
- 5 years ago
- Views:
Transcription
1 Bayesian inference on earthquake size distribution: a case study in Italy Licia Faenza 1, Carlo Meletti 2 and Laura Sandri 3 1 Istituto Nazionale di Geofisica e Vulcanologia, CNT; via di Vigna Murata 65, Roma, Italy 2 Istituto Nazionale di Geofisica e Vulcanologia, sezione di Milano-Pavia, via Bassini 15, Milano, Italy 3 Istituto Nazionale di Geofisica e Vulcanologia, sezione di Bologna, via Donato Creti 12, Bologna, Italy. Accepted for publication at BSSA on 29th September 29. Abbreviated title: Bayesian Inference in Magnitude distribution Corresponding author: Licia Faenza Istituto Nazionale di Geofisica e Vulcanologia Via di Vigna Murata Rome Italy Tel: licia.faenza@ingv.it 1
2 Abstract This paper is focused on the study of earthquake size statistical distribution by using Bayesian inference. The strategy consists in the definition of an a priori distribution based on instrumental seismicity, and modeled as a power law distribution. By using the observed historical data, the power law is then modified in order to obtain the posterior distribution. The aim of this paper is to define the earthquake size distribution using all the seismic database available (i.e., instrumental and historical catalogs) and a robust statistical technique. We apply this methodology to the Italian seismicity, dividing the territory in source zones as done for the seismic hazard assessment, taken here as a reference model. The results suggest that each area has its own peculiar trend: while the power law is able to capture the mean aspect of the earthquake size distribution, the posterior emphasizes different slopes in different areas. Our results are in general agreement with the ones used in the seismic hazard assessment in Italy. However, there are areas in which a flattening in the curve is shown, meaning a significant departure from the power law behavior and implying that there are some local aspects that a power law distribution is not able to capture. Online material Results of the analysis applying the statistical completeness. Keywords: Earthquake size distribution, Bayesian inference, Italian seismicity, Seismic hazard 2
3 1 Introduction In probabilistic seismic hazard analysis (see e.g., SSHAC, 1997), the study of the past seismicity is a fundamental element to model the occurrence of future ground shaking. Under the assumption of a stationary seismogenic process, in a standard approach (Cornell, 1968; McGuire, 1976) the seismic hazard is evaluated by studying seismicity in terms of time and magnitude recurrence laws from a probabilistic point of view, and by defining ground-motion attenuation relationships, after the identification of active seismic zones. In Italy, seismic hazard analysis is usually carried out on historical seismicity (CPTI4, CPTI Working Group, 24), like it has been done for the official seismic hazard map of Italy (MPS4, MPS Working Group, 24), a work that represents the state-of-the-art in Italy for what concerns the seismic hazard. As each seismic zone has its own frequency of earthquake occurrence, in low frequency seismic zones this reflects a very small number of available historical events to be used for hazard model calibration, affecting the reliability of the model parameters. In this study, we would like to enhance the data set used for hazard model calibration regarding the earthquake size distribution, by properly taking into account instrumental seismicity, even if it contains a large number of small events, not suitable for classical seismic hazard models. Bayesian inference is the process of fitting a probability model to a set of observations and summarizing the results with a probability distribution for the parameters of the model. Its applications span over several scientific and economical disciplines, showing some interesting aspects. First, according to Bayesian philosophy, Bayesian inference allows to simultaneously take into account, giving proper weights, heterogeneous sources of information on the process under study, 3
4 such as theoretical models, prior beliefs, and observations. In this view, Bayesian inference can provide an estimate of the quantity of interest even in the case of few observations available, if there are prior models. Secondly, Bayesian inference allows the estimation of the uncertainty on the results obtained. In dealing with a complex process (i.e., governed by several degrees of freedom of comparable weight) such as the seismogenic one, the treatment of aleatory and epistemic uncertainties is of primary importance. In particular, the aleatory uncertainty is associated to the intrinsic stochasticity of the process, resulting in an unavoidable impossibility of predicting deterministically its evolution. The epistemic uncertainty represents our limited knowledge of the system. An overview of this point can be found in Woo (1999), Field et al. (23) and MacKay (23). While it is possible to reduce this latter type of uncertainty (e.g., by increasing the number of data points or improving the physical knowledge of the phenomenon), the aleatory one is independent on our degree of knowledge and cannot be lowered. Because of these features, Bayesian inference can be an interesting instrument to study the probabilistic law governing earthquake size. For example, Agostinetti and Rotondi (23) by using Bayesian belief network investigated the dependence relationship between the size of the earthquakes in a sequence and their time of occurrence. Our study instead makes Bayesian inference on the parameters of the size distribution of events able to generate damage in Italy, i.e., earthquakes with magnitude M w 4.65 (MPS4). In detail, we use instrumental seismicity to calibrate a diffuse (i.e., with a large epistemic uncertainty) prior model, and we refine it into the posterior model by means of historical catalog. In this way we can provide more accurate estimates for model parameters. In principle, the results obtained can be incorporated in a probabilistic seismic 4
5 hazard study for Italian damaging seismicity. 2 Data The input data for this analysis are the seismic zonation ZS9 (Meletti et al., 28), the seismic catalog CPTI4 (CPTI Working Group, 24) and the CSI catalog (Catalogo Strumentale Italiano, Chiarabba et al., 25; Castello et al., 27). 2.1 The seismic zones model ZS9 ZS9 (Figure 1) is the product of consensus from an expert team of researchers and it is an ingredient of the seismic hazard map for Italy (MPS4). The model was designed for the application in country-wide probabilistic seismic hazard assessment and it is largely based on data collected in the last 1 years, including historical earthquakes and instrumental seismicity, active faults and their seismogenic potential, and seismotectonic evidence from recent earthquakes. ZS9 is made out of 36 zones where earthquakes with M w 5 are expected and every zone is characterized also by its mean seismogenic depth and predominant focal mechanism. For a detailed description of the requirements the zonation model has to satisfy and for the input data used to build ZS9 up, we refer to Meletti et al. (28). 2.2 The Parametric Catalog of Italian Earthquakes The Parametric Catalog of Italian Earthquakes (CPTI4) is the most updated and complete catalog for the historical events above damage threshold in Italy. It contains events from 217 b.c. to 22. Like ZS9, CPTI4 is one of the input element of the MPS4 seismic hazard map of Italy. During the MPS4 elaboration 5
6 the content of CPTI4 catalog was deeply analyzed in order to define the timeinterval completeness and seismicity rates. The M w magnitude ranges between 4.65 and 7.41; according to the MPS4, the magnitude is binned into 12 classes with increment equal to.23. The time-interval completeness of the CPTI4 catalog was estimated for each zone of ZS9 and for each class of magnitude according two different approaches: one approach is mainly historical, based on the analysis of the archive completeness; the second one is mainly statistical (for details, see MPS4). Tables 1 and 2 summarize the temporal windows of completeness and the number of events used in the analysis for all zones and magnitude classes, for the historical and statistical completeness, respectively. 2.3 The instrumental catalog The CSI catalog (Chiarabba et al., 25; Castello et al., 27) is a collection of revised hypocentral locations of the earthquakes occurred in the Italian territory. Maintained by the INGV, it contains data collected by a network of seismic stations, active since 1981, spanning the time period We check the completeness of the catalog with the cumulative of the events, finding that it is complete for M l 2.9 for events with shallow and intermediate hypocenters (depth 7km, to agree with CPTI4). We shall see in section the reason for using this data set. 6
7 3 The method of Bayesian inference 3.1 General description Different from the frequentist approach, in a Bayesian perspective there is not a true value for the variables of interest, but they are represented by a probability density function (pdf). In this view, Bayesian inference is the instrument used to best estimate the parameters of that pdf. Practically, this is accomplished by merging a prior model for the variables (constituting the so-called prior distribution, [θ] prior, where θ is the vector of the variables, and the square brackets denote a pdf) with a set of past observations (y), in order to maximize the probability of having observed those data with that prior model in mind. The output of Bayesian inference is thus a posterior distribution ([θ y]) for the variables of the model. The practical way used for combining prior distribution and data is the Bayes theorem: [θ y] = [θ] prior[y θ] [y] (1) where [y θ] is the so-called likelihood function (representing the probability of observing data y given parameters θ), and [y] is a normalizing factor accounting for the total probability of observing the data y. With Bayesian inference the uncertainty on θ is also provided. In particular, while the mean of the posterior pdf represents an estimation of the intrinsic randomness of the process (aleatory uncertainty), its variance is an estimation of the epistemic uncertainty, due to our limited knowledge of the process. As mentioned above, the latter can be reduced by increasing the amount of observations available, if the prior model does not rule out the true model, (i.e., θ prior (truemodel) = ). To avoid this extreme case, we will choose a prior model that does not rule out any possibility. 7
8 3.2 Our application In this study, the random variable of our system θ represent the probability of a given earthquake size in the different zones in Italy, conditional to the hypothesis that a damaging event will occur in future. In particular, θ = (θ 1,...θ 12 ) (2) where the 12 elements of vector θ represent the probabilities of 12 different possible classes of earthquake sizes, as binned by MPS4; the 12 classes derive from the consideration that magnitudes for the historical earthquakes come from a rough conversion of the epicentral intensity. The Italian catalogs normally adopt the MCS intensity scale, based on 12 degrees. For this reason, the range of magnitudes in CPTI4 catalog was divided in order to have in each class earthquakes with the same epicentral intensity (M w class 1 corresponds to the intensity value of 5.5, M w class 2 corresponds to the intensity value of 6, and so on). Since the basic hypothesis is that a damaging event will occur and the first class (with probability θ 1 ) represents the lowest class of magnitudes considered able to produce damage (i.e., M w 4.76 ±.115), the 12 binned classes of magnitude are a complete set of mutually exclusive events, i.e. 12 i=1 θ i = 1. (3) In our application, the available past observations are counts of past earthquake magnitudes in each of the 12 magnitude bins. Since each earthquake has a magnitude that is independent from the others, our past observations can be thought as independent trials producing one of 12 possible mutually exclusive outcomes, each characterized by a probability θ j (j = 1,...12). For this reason, we express the 8
9 likelihood of the available past observations through a multinomial distribution: [y θ] = n y 1...y m (θ 1 ) y 1...(θ m ) ym (4) where y j (j = 1,...12) is the observed number of past earthquakes with magnitude falling in the j-th size class, and n = m j=1 y j is the total number of past data available. In Bayesian inference, the choice of the shape of the prior pdf is subjective. In this application, similarly to Marzocchi et al. (24, 28), we choose a Dirichlet distribution for our prior model. Besides being the conjugate distribution of the multinomial, implying a simplification in the evaluation of the posterior distribution (which, for this choice, remains a Dirichlet distribution, see e.g. Gelman et al., 24), we would also like to highlight three important reasons for choosing a Dirichlet distribution. Firstly, we would like a unimodal prior for [θ]; secondly, since our random variable [θ] is a probability, we need a pdf with domain [,1]; lastly, the sample of the magnitude classes has to be a mutually exclusive and exhaustive sample, i.e. the intersection has to be null and the union equals 1. In our specific application, the prior Dirichlet distribution reads: [θ] = Di(α 1,...α 12 ) = Γ(α α 12 ) Γ(α 1 ) Γ(α 12 ) [θ 1] (α 1 1) [θ 12 ] (α 12 1) (5) where α j (j = 1,, 12) are the parameters of the distribution and are greater then, and Γ( ) is the Gamma function. For the j-th event, the first moment (i.e., the mean) is E[θ j ] = α j α where α = m j=1 α j, while the second moment (i.e., the variance) V ar[θ j ] = α j(α α j ) α 2 (α + 1) (6) (7) 9
10 (see Gelman et al., 24). In our application, E[θ j ] represents our initial best guess, for the probability of occurrence of an event in magnitude class j given the occurrence of a damage event, while V ar[θ j ] represents our degree of confidence on the best guess for magnitude class j. A noteworthy case occurs when α = m. In this case, the variance is comparable to that of the uniform distribution (often taken as the maximum ignorance distribution), and only one past observation is potentially able to modify the best guess of such a large-variance prior model. In such case, the epistemic uncertainty is very high (i.e., our knowledge is very scarce). The marginal distribution for a specific parameter θ j of a Dirichlet distribution is a Beta distribution [θ j ] = Beta(α j ; β j ) = Γ(α j + β j ) Γ(α j )Γ(β j ) θα j 1 j (1 θ j ) β j 1 (8) where β j = α α j. As mentioned above, a Dirichlet distribution for the prior model conjugates with a multinomial distribution for past data. This means that the posterior density is still a Dirichlet, with updated posterior parameters: [θ y] = Di(α 1 + y 1,...α m + y m ) (9) Prior distribution For the definition of the prior distribution, we start by considering that the frequency-magnitude relationship for earthquake occurrence follows a power law distribution, known as the Gutenberg-Richter (G-R) relation (Gutenberg and Richter, 1954). We decide that the prior distribution is the same for all the 36 zones that compose the ZS9 seismic zonation and for both the two completeness 1
11 evaluations in tables 1 and 2. The calibration of the distribution is done using the events from the CSI catalog (Chiarabba et al., 25; Castello et al., 27). This data set contains many small events and very few events of damaging sizes (however M w < 6). In this view, it is not a very pertinent data set for our calibrating model, since it contains many events with a smaller magnitude than that considered in seismic hazard analysis. However, since it contains many records, it allows us to define a diffuse prior distribution even in the seismic zones with few historical events. We then used the CPTI4 catalog to estimate the likelihood; this is a more accurate data set for our purpose because it contains many damaging events. A problem we want to underline concerns the de-clustering of the catalogs. CPTI4 has been designed for the probabilistic seismic hazard analysis, using the approach of Cornell (McGuire,1976; Cornell, 1968), i.e. with a random temporal earthquake occurrence. Therefore, CPTI4 is composed only by independent events, while CSI catalog is not de-clustered. It is still debatable which dependent events and mainshocks have the same frequency-magnitude distribution. In our application, we assumed that the frequency-magnitude distribution of the whole seismicity (i.e. independent and dependent events) is the same as the one of independent events alone. We then convert M l in M w using the empirical relation in MPS4; the b-value of the frequency-magnitude relationship is calculated with the maximum likelihood method (Marzocchi and Sandri, 23; Sandri and Marzocchi, 27) and gives b = 1.17 ±.1 (figure 2). Assuming universality of the G-R, we can extrapolate this b-value for greater events. The relative probability of each binned class of magnitude is calculated by using the G-R law with the estimated b-value. Then these frequencies are normalized to 1. The meaning of this normalization is to impose that a damaging event (i.e., 11
12 with M w > 4.65) will occur in the future within the area covered by the seismic zonation. We therefore have 12 frequencies, f i (i = 1, 12), with 12 i=1 f i = 1. The parameters of the prior Dirichlet distribution (α j, j = 1,...12) are then found by imposing that: 1. for each of the 12 binned classes of magnitude, our best guess value is equal to the frequency given from the power law distribution, i.e., E[θ j ] = f j, for j = 1,...12; 2. our degree of confidence on the best guess is the lowest possible, i.e., the prior distribution has the maximum allowed variance: α = 12 By inverting equations 6 and 7 with these conditions, we obtain the 12 values (α 1,...α 12 ), provided in table 3. We realize that the resulting prior has a strong assumption, therefore it has lowest degree of confidence. Other possible priors can be built fitting for each zone a different b parameter using the CSI catalog or the CPTI4 catalog. In both cases, the b parameter is fitted using a small data set for each zone and completeness; moreover, in the latter hypothesis the prior and the likelihood are based on the same data set. A point we want to stress is that the aim of this application is to build a final result, i.e. the posterior, which is accurate rather than precise Likelihood function We use both historical and statistical completeness estimates to get two independent results. The values of table 3 are the starting point for both the two analysis. For zone l (l = 1,, 36) and for binned class of magnitude i (i = 1,, 12), within the temporal window of completeness we count the number n il of events with magnitude M w in the class and occurring in the zone according to CPTI4 12
13 catalog. Since the length of temporal window of completeness is different for each binned class of magnitude and zone, we cannot simply use these numbers n il as the occurrences y l in equation 9. Because of this, we define the duration of the temporal window of completeness for zone l and magnitude class i as t il (tables 1 and 2). Therefore, in each zone l there are N l data available, i.e., N l = 12 i=1 n il. From here it is possible to define the rate of events in class i and zone l as r il = n il t il. We transform the rates into (fictitious) absolute numbers of occurrences as N l r il y il = round( 12 k=1 r ) (1) kl where the y il are rounded to the nearest integer, since they are fictitious counts of past magnitudes in the various bins. The computation of y il is based on two assumptions: the normalization of the rates to 1 (i.e., the division by 12 k=1 r kl) implies that the final distribution is conditional to the occurrence of an event above the damage threshold, i.e., that an events with M w 4.65 will certainly occur the multiplication by N l is based on the hypothesis that seismicity is a stationary feature in each specific zone. This implies that the parameters of the distribution do not change with time and that the data set used with the completeness interval is a representative sample of the distribution of the size of the earthquake. We recognize that the latter is a strong assumption; however, it is the basic assumption for every standard seismic hazard study. 13
14 3.2.3 Posterior distribution The posterior distribution is obtained by letting the a priori distribution be modified by the available data using Bayes theorem (equation 1). In particular, for zone l (l = 1,, 36), by using equation 9, with data y il just computed (equation 1) we obtain [θ l y] = Di(α 1 + y 1l,, α 12 + y 12l ) (11) 4 Results For the sake of conciseness, only the results of the historical completeness are presented. For statistical completeness we obtain similar results, which we provide as electronic supplementary material. For example, we first present the plot of the marginal posterior distributions for 4 zones, by using the data obtained by applying historical completeness estimates. Zone ZS91 is a zone with a few events (see figure 1). Figure 3a shows its marginal posterior distributions. The abscissa represents the probability θ i (i = 1,, 12) that a certain magnitude will occur, given our a priori information and the past events; the y-axis represents the posterior probability distribution of each probability θ i (i = 1,, 12) class. A remarkable aspect of ZS91 is that the marginal posterior distribution of class 3 is similar to the one of class 2. This means that the relative frequency of class 3 is higher than the one expected by a simple power-law distribution. Zone ZS95 (figure 3b) is one of the areas with the highest number of events (figure 1). Classes 1, 2, 3 have classic bell-shaped distributions, these marginals are peaked (low epistemic uncertainty), since they are well populated (26,13,12 14
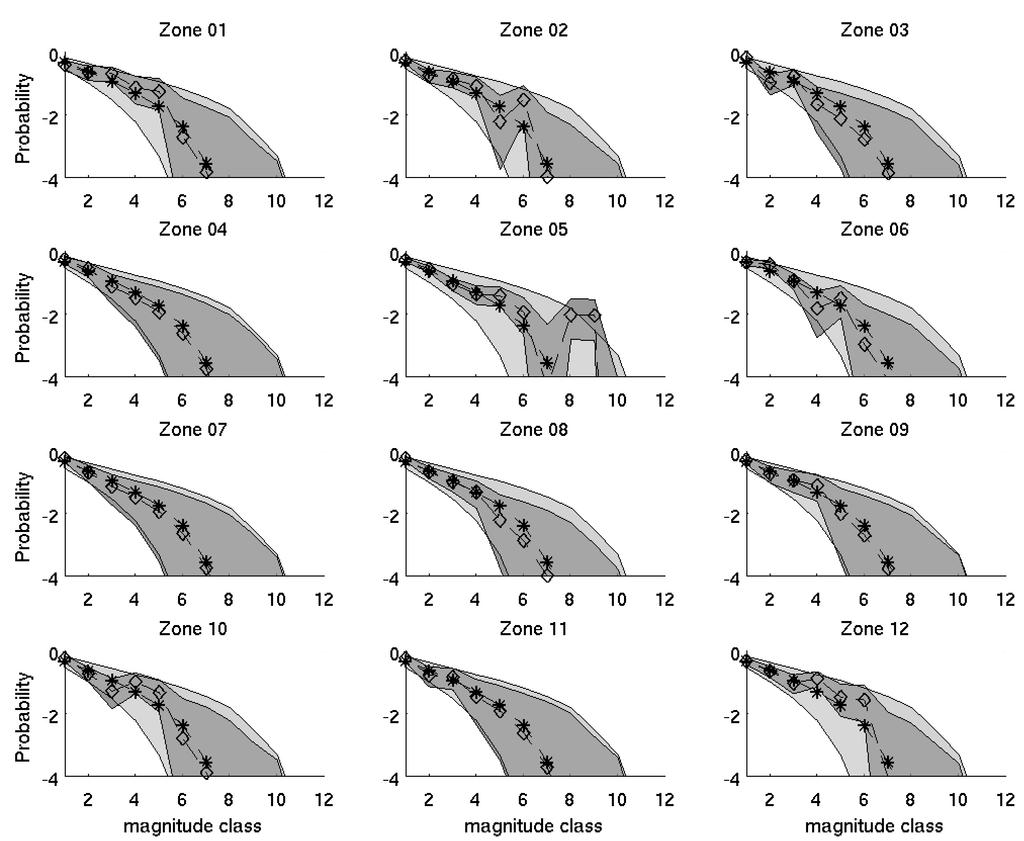
15 events in the time completeness, respectively). Remarkably, the occurrence of a class 9 event (M w = 6.6) is more probable than a class 7 (M w = 6.14) or 8 (M w = 6.37) event. A quite similar situation can be found in ZS923 (figure 3c), also a very active seismic zone. There is a collapse of the marginal distributions of class 5 (M w = 5.68) and 6 (M w = 5.91) in an almost single curve, while the amount of data in class 1 (51 events) makes the bell shaped distribution more peaked (decreasing the epistemic uncertainty) with respect to the other 3 zones. We display the plot for zone ZS931 since it shows a particular case with more strong events than medium ones. This is shown in figure 3d, where the marginal posterior for class 1 is higher than expected from an a priori G-R based marginal distribution. In order to visualize the relative influence of the prior model and the past observations in the posterior estimate, we then compare the prior based on a G-R distribution with b = 1.17 with the posterior. We compare the median of the Dirichlet prior and posterior distributions, and the 1th-9th percentile, for each single zone. These comparisons give an overall and reliable representation of the distributions, providing the central value and as well the confidence boundaries. In principle it would be possible to analytically compute the percentiles if the probability density functions were analytically integrable. However, in our case this is not an easy task because of distributions are 12-variate Dirichlet distributions. Because of this, for each zone we generate 1 synthetic draws from the Dirichlet prior and posterior distributions with 12 variates, and compute the percentiles of the synthetic draws. We use the percentiles and not the mean specifically, because the estimate of the mean from a finite number of draws is less stable than the median, especially when the mean is very low (if the mean is of 15
16 the order of 1 n, we need at least 1 n+1 draws for a stable estimate). In figure 4 we plot the median of the synthetic Dirichlet draws and the shaded grey areas of the 1th-9th percentile, for both prior and posterior distribution for each single zone. The first comment is that as more and more data are available, the epistemic uncertainty decreases, if compared to the one of the prior model, as for example ZS95, which has a narrower dark-gray area (posterior confidence interval) than light-gray one (prior confidence interval). The second point is that for almost half of the zones, the posterior probability of the medium and/or high magnitude classes seems to be increased, if compared to the prior. In more detail, there is an increase in the probability of medium size magnitude in the areas in the Northern Apennines (e.g., Zones ZS912, ZS914 and ZS917) with an increase of probability for classes 5 (Mw5.68) and 6 (Mw5.91). In Friuli region, Central Apennines, and Calabria Belt (e.g., respectively Zones ZS95, ZS918, ZS919, ZS923, ZS927, ZS929, and ZS93) the probability is increased for high classes of magnitude, like class 8 (Mw6.37) and above. This could reflect the difference in magnitude size distribution between the Northern Apennines and the Eastern Alps or Southern Apennines. There are some other areas in which the opposite seems to occur, i.e., the posterior distribution shows lower probability value compared to the prior ones, like Zones ZS913, ZS915 and ZS92 in North- Central Apennines. In these zones, in general, magnitude classes between 1 and 4 (Mw ) have more events than median to high classes. There are areas, as well, in which the posterior does not differ from the prior, like Zones ZS94, ZS98, ZS99, ZS911, ZS922 and ZS931. A key point is that, in most of the areas in which the posterior distribution 16
17 seems significantly different from the prior, this shows a preferred magnitude or group of magnitudes, rather than showing a different power law. In other words, the analysis seems to reflect a change in the slope of the power law, rather than a deviation from the power-law distribution. This deviation is significant since it is outside the confidence interval. This tendency lead us to compare our posterior size distribution with the one applied in MPS4, based on a power-law, which in some ways represents a reference benchmark for the earthquake size distribution in Italy. Figure 5 shows the mean values of the prior, the posterior plus and minus one standard deviation, grey area in the picture and the values used in MPS4, with the b-values calculated in that elaboration for each zone and time-interval completeness estimate. In particular, to agree with our initial statement to have at least one M w 4.65 event in each zone, we normalized the frequency of each zone to 1, by imposing 12 i=1 f i = 1, where f i are the frequencies estimated from b- values of the G-R distributions (MPS4). We refer to these curves as MPS4-GR. To compare our results with the MPS4-GR we are forced to compare the mean values, rather than the median, since the average is the only value available from MPS4 elaboration. The main difference between our posterior and the MPS4- GR is that in the areas in which deviations from the power-law are shown, the MPS4-GR decreases the b-value, leading to a general increase in the probability of occurrence of the large magnitudes, without capturing the distribution shown by the data, based on the occurrence of a preferred magnitude size (see Zones ZS925, ZS929, and ZS935, for instance). To check the stability of our results we have performed the same strategy considering only 6 classes of magnitude, i.e., grouping the events of classes 1 and 2 into a new class 1, the one of classes 3 and 4 into a new class 2 and so on. The 17
18 central magnitude values of the new classes are M w 1 = 4.88; M w 2 = 5.34; M w 3 = 5.8; M w 4 = 6.23; M w 5 = 6.72; M w 6 = 7.18 with an incremental step of.46. The results show the same patterns outlined in figure 4, when comparing the prior and posterior distribution (see figure 6), and in figure 5, when comparing the posterior and the MPS4-GR (see figure 7). This indicates that our results are not the consequence of incorrect magnitude evaluation, but reflect the behavior the earthquake size distribution. 5 Conclusions This work is the first attempt studying the size distribution of earthquakes using a Bayesian approach. The methodology, developed in the context of natural hazard in Marzocchi et al. (24, 28), has been applied to the Italian seismicity, by using the most recent information regarding the seismic catalog (CPTI Working Group, 24) and the seismic source zones model (Meletti et al., 28). The aim of this work is to quantify the statistical size distribution of earthquakes in Italy. Using this methodology, we are able to quantify how much the real data move away from the a priori distribution based on a power-law G-R distribution for the size of earthquakes. By using Bayes theory, we let the past data modify the a priori pdf. Our results are then compared to the current reference size distribution, that has been used in the set up of the official seismic hazard map MPS4 (MPS Working Group, 24) by using the G-R distribution calibrated separately for each zone. As a general comment, the MPS4-GR is able to capture the main trend in earthquake size distributions for different areas. In fact, zones with more strong events (e.g., ZS931) have lower b-value, in absolute value, than zones with more medium events (e.g., ZS92). But MPS4-GR is not able to capture other as- 18
19 pects of earthquake size distributions, as the flattening for medium-magnitude classes 5, 6 and 7, which occurs in many zones (e.g., ZS92, ZS94, ZS91, ZS914, ZS918, ZS919, ZS923 etc). Furthermore, calculating the b-value for each zone independently, as done in MPS4, implies working with few data, increasing the uncertainties on relevant estimates. It is important to remark that our results are based on the hypothesis of stationarity in the seismicity, which is currently adopted in many papers on statistical seismology. In any case, there is a debate on the correctness of adopting catalog that covers different time spans, because this implies that the seismicity rate is constant with time. To partially check whether this bias affects our results, we re-run our analysis considering only the classes from 5 and above, and a common time span from 15 to 22. The result of this test confirms our previous conclusion, apparently excluding a bias due to the stationarity hypothesis This test, however, is not exhaustive, since we can compare only events with medium-high classes of magnitude. We can not investigate the possible changing rates in the medium size seismicity, since there is not historical data in ancient times. A second aspect we want to emphasize in this discussion is the physical reasons for the mismatch between the posterior distributions and the G-R one. It seems, from figure 4 and 5, that for some zones there are some preferred magnitudes (like class 6, Mw=5.91, for zone ZS926 or class 9, Mw=6.6, for ZS95). This indicates that the characteristic earthquake (Schwartz and Coppersmith, 1984) behavior could result in these source zones, where a magnitude class, corresponding to a main seismogenic fault, is dominant and the other classes represent the seismicity of the minor fault systems in the zone. But, of course, this feature has still to be fully explored. 19
20 6 Data and Resources All data used in this article came from published sources listed in the references. Some plots were made using the Generic Mapping Tools version ( Wessel and Smith, 1998) 2
21 Acknowledgments: The author thank V. D Amico for the useful comments to the preliminary version on the work. We would like to thank two anonymous reviewers and the Editor Jeanne Hardebeck for providing constructive criticism. We thank Dr. Karen Britten for improving the readability of the manuscript. 21
22 Bibliography Agostinelli, C and R. Rotondi (23).Using Bayesian belief networks to analyse the stochastic dependence between interevent time and size of earthquakes. Journal of Seismology, 7, Castello B., M. Olivieri, and G. Selvaggi (27). Local and duration magnitude determination for the Italian earthquake catalogue ( ). Bulletin of the Seismological Society of America, 97, 1B, Chiarabba C., L. Jovane, and R. Di Stefano (25). A new view of Italian seismicity using 2 years of instrumental recordings, Tectonophysics, 395/3-4, CPTI Working Group (24). Catalogo Parametrico dei Terremoti Italiani, versione 24 (CPTI4), INGV, Bologna. Cornell, C.A. (1968). Engineering seismic risk analysis, Bull. Seism. Soc. Am., 58, Field, E.H., T.H. Jordan, and C.A. Cornell (23). OpenSHA. A Developing Community-Modeling Environment for Seismic Hazard Analysis. Seismological Research Letters, 74, Gelman, A., J.B. Carlin, H.S. Stren, and D.B. Rubin (24). Bayesian Data Analysis, Chapman and Hall, New York, 2nd edition, pp 696. Gutenberg, B., and C. Richter (1954). Seismicity of the Earth and Associated Phenomena, Princeton University Press, Princeton, New Jersey, 2nd edition, pp 22
23 31. MacKay D.J.C. (23) Information Theory, Inference, and Learning Algorithms. Cambridge University Press, pp 64. Marzocchi, W. and L. Sandri (23). A review and new insight on the estimation of the b-value and its uncertainty, Ann. Geophys, 46, 6, Marzocchi, W., L. Sandri, P. Gasparini, C. Newhall, and E. Boschi (24). Quantifying probabilities of volcanic events: the examples of volcanic hazard at Mount Vesuvius, J. Geophys.Res, 19, B1121, doi:1.129/24jb3155. Marzocchi, W., L. Sandri, and J. Selva (28). BET EF: a probabilistic tool for long- and short- term eruption forecasting, Bull. Volcanol., 7, , doi: 1.27/s y. McGuire, R.K. (1976). Fortran computer program for seismic risk analysis, US Geological Survey open-file Report Meletti C., F. Galadini, G. Valensise, M. Stucchi, R. Basili, S. Barba, G. Vannucci, and E. Boschi (28). A seismic source model for the seismic hazard assessment of the Italian territory. Tectonophysics, 45(1), doi:1.116/j.tecto MPS Working Group (24). Redazione della mappa di pericolosità sismica prevista dall Ordinanza PCM 3274 del 2 marzo 23. Rapporto Conclusivo per il Dipartimento della Protezione Civile, INGV, Milano-Roma, 24 april, 65 pp. 5 appendixes. 23
24 Sandri, L., and W. Marzocchi (27). A technical note on the bias in the estimation of the b-value and its uncertainty through the Least Squares technique, Ann. Geophys, 5,3, Senior Seismic Hazard Analysis Committee (SSHAC) (1997). Recommendations for probabilistic seismic hazard analysis-guidance on uncertainty and use of experts, U.S. Nuclear Regulatory Commission, NUREG/CR Schwartz, D.P., and K.J. Coppersmith (1984). Fault behavior and characteristic earthquakes: examples from the Wasatch and San Andreas fault zones, J. Geophys. Res Woo, G. (1999). The mathematics of natural catastrophes. Imperial College Press, London. 24
25 Figure 1: The seismic zonation ZS9 and distribution of the events in CPTI4 catalog that are in the complete portion according to the historical approach. 25
26 Cl. 1 Cl. 2 Cl. 3 Cl. 4 Cl. 5 Cl. 6 Cl. 7 Cl. 8 Cl. 9 Cl. 1 Cl. 11 Cl. 12 M4.76 M4.99 M5.22 M5.45 M5.68 M5.91 M6.14 M6.37 M6.6 M6.83 M7.6 M7.29 ZS (2) 1871(1) 17(4) 17(1) 153(2) 153() 13() 13() 13() 13() 13() 13() ZS (7) 1871(2) 17(5) 17(3) 153(1) 153(2) 13(1) 13() 13() 13() 13() 13() ZS (1) 1871() 17(5) 17() 153() 153() 13() 13() 13() 13() 13() 13() ZS (4) 1871(2) 17() 17() 153(1) 153() 13() 13() 13() 13() 13() 13() ZS (26) 1836(13) 153(12) 153(6) 153(5) 13(3) 13() 11(2) 11(3) 11() 11() 11() ZS (8) 1836(8) 153(6) 153(1) 153(2) 13() 13() 11() 11(1) 11() 11() 11() ZS (4) 1836(1) 153(1) 153() 153(1) 13() 13() 11() 11() 11() 11() 11() ZS (11) 1871(3) 17(4) 17(1) 153(1) 153() 13() 13() 13() 13() 13() 13() ZS (4) 1871(1) 17(2) 17(1) 153() 153() 13() 13() 13() 13() 13() 13() ZS (6) 1871(1) 17() 17(3) 153(2) 153(1) 13() 13(1) 13() 13() 13() 13() ZS (3) 1871() 17(1) 17() 153(1) 153() 13() 13() 13() 13() 13() 13() ZS (7) 1836(3) 153(3) 153(7) 153(1) 13(2) 13() 11() 11() 11() 11() 11() ZS (18) 1836(1) 153(9) 153(4) 153(3) 13(1) 13() 11() 11() 11() 11() 11() ZS (14) 1836(1) 153(8) 153(4) 153(2) 13(4) 13() 11() 11() 11() 11() 11() ZS (23) 1871(11) 165(14) 165() 153(2) 153(1) 13(1) 13(1) 13() 13() 13() 13() ZS (5) 1871(4) 153(6) 153(1) 153(1) 13() 13() 12() 12() 12() 12() 12() ZS (7) 1836(4) 165(5) 165(3) 153(5) 153(3) 153() 12() 12() 12() 12() 12() ZS (21) 1871(3) 165(6) 165(2) 165(3) 153(3) 153(2) 13() 13(1) 13() 13() 13() ZS (15) 1871(7) 153(14) 153(6) 153(2) 13(7) 13(1) 12(2) 12() 12() 12() 12() ZS (23) 1871(1) 165(23) 165(3) 165() 13() 13() 13() 12() 12() 12() 12() ZS (21) 1871(11) 153(11) 153(4) 153(2) 13(1) 13() 12() 12() 12() 12() 12() ZS (6) 1871(3) 153(8) 153(2) 153() 13() 13() 12() 12() 12() 12() 12() ZS (51) 1871(11) 165(25) 165(8) 165(3) 153(5) 153(1) 13(4) 13(2) 13(1) 13(1) 13() ZS (9) 1871(5) 1787(9) 1787(6) 1787(2) 153() 153(2) 14() 14() 14(1) 14() 14() ZS (5) 1871(2) 1787(2) 1787() 1787() 153() 153() 14(2) 14() 14(1) 14() 14() ZS (3) 1871(2) 1787(4) 1787() 1787() 153(1) 153() 14() 14() 14() 14() 14() ZS (21) 1895(6) 1787(11) 1787(1) 1787(2) 153(3) 153(1) 153(2) 14(3) 14(3) 14(2) 14() ZS (2) 1871(2) 1787(4) 1787() 153(3) 153() 13() 13() 13() 13() 13() 13() ZS (23) 1895(4) 1787(14) 1787(6) 1787(1) 1787(3) 153(4) 153() 14(2) 14(1) 14(2) 14(1) ZS (7) 1895(3) 1787(1) 1787(2) 1787(2) 1787(1) 153(1) 153(1) 14(1) 14(1) 14() 14() ZS (1) 195(1) 195() 1787() 1787(1) 1787() 153() 153() 153() 153(1) 153() 153() ZS (8) 1895(2) 17(5) 17(1) 17() 153(1) 153(1) 13() 13() 13() 13() 13() ZS (1) 1871(3) 17(5) 17(5) 17(1) 153(2) 153() 13() 13() 13() 13() 13() ZS (2) 1895() 17(2) 17(1) 17() 153() 153(1) 13() 13() 13() 13() 13() ZS (4) 1871() 17(5) 17(2) 153(3) 153() 153() 115() 115(2) 115() 115() 115() ZS (5) 1871(3) 17(4) 17() 153() 153(1) 153() 115() 115() 115() 115() 115() Table 1: Starting date of the complete period in the CPTI4 catalog according to the historical approach for the ZS9 seismic source zones. In round brackets the number of events used in the analysis. 26
27 Cl. 1 Cl. 2 Cl. 3 Cl. 4 Cl. 5 Cl. 6 Cl. 7 Cl. 8 Cl. 9 Cl. 1 Cl. 11 Cl. 12 M4.76 M4.99 M5.22 M5.45 M5.68 M5.91 M6.14 M6.37 M6.6 M6.83 M7.6 M7.29 ZS91 191(2) 1871(1) 1871(4) 17(1) 17(2) 153() 153() 13() 13() 13() 13() 13() ZS92 191(3) 1871(2) 1871(1) 17(3) 17(1) 153(2) 153(1) 13() 13() 13() 13() 13() ZS93 191(5) 1871() 1871(2) 17() 17() 153() 153() 13() 13() 13() 13() 13() ZS94 191(4) 1871(2) 1871() 17() 17(1) 153() 153() 13() 13() 13() 13() 13() ZS95 191(15) 1871(11) 1871(7) 17(6) 17(5) 153(3) 153() 14(2) 14(2) 13() 13() 13() ZS96 191(5) 1871(8) 1871(4) 17(1) 17(2) 153() 153() 14() 14() 13() 13() 13() ZS97 191(2) 1871(1) 1871() 17() 17(1) 153() 153() 14() 14() 13() 13() 13() ZS98 191(6) 1871(3) 1871(2) 17(1) 17(1) 153() 153() 13() 13() 13() 13() 13() ZS99 191(3) 1871(1) 1871(2) 17(1) 17() 153() 153() 13() 13() 13() 13() 13() ZS91 191(2) 1871(1) 1871() 17(3) 17(1) 153(1) 153() 13(1) 13() 13() 13() 13() ZS (2) 1871() 1871(1) 17() 17(1) 153() 153() 13() 13() 13() 13() 13() ZS (3) 1871(3) 1871() 17(4) 17(1) 153(1) 153() 14() 14() 13() 13() 13() ZS (11) 1871(8) 1871(4) 17(4) 17(3) 153() 153() 14() 14() 13() 13() 13() ZS (7) 1871(9) 1871(4) 17(3) 17(2) 153(4) 153() 14() 14() 13() 13() 13() ZS (17) 1871(11) 1871(8) 17() 17(2) 17() 153(1) 153(1) 13() 13() 13() 13() ZS (2) 1871(4) 1871(4) 17(1) 17(1) 17() 153() 153() 13() 13() 13() 13() ZS (5) 1871(3) 1871(3) 17(3) 17(3) 17(3) 153() 153() 13() 13() 13() 13() ZS (13) 1871(3) 1871(4) 17(2) 17(3) 17(3) 153(2) 153() 13(1) 13() 13() 13() ZS (11) 1871(7) 1871(5) 17(5) 17(2) 153(4) 153(1) 153(1) 13() 13() 13() 13() ZS92 192(7) 1871(1) 1871(12) 17(3) 17() 17() 153() 153() 13() 13() 13() 13() ZS (9) 1871(11) 1871(4) 17(4) 17(1) 17() 153() 153() 13() 13() 13() 13() ZS () 1871(3) 1871(4) 17(2) 17() 17() 153() 153() 13() 13() 13() 13() ZS (24) 1871(11) 1871(15) 17(8) 17(3) 17(4) 153(1) 153(1) 153(1) 13(1) 13(1) 13() ZS (7) 1895(5) 1895(4) 1787(6) 1787(2) 153() 153(2) 153() 153() 14(1) 14() 14() ZS (4) 1895(2) 1895(2) 1787() 1787() 153() 153() 153(2) 153() 14(1) 14() 14() ZS (2) 1895(2) 1895(3) 1787() 1787() 153(1) 153() 153() 153() 14() 14() 14() ZS (12) 1895(6) 1895(5) 1787(1) 1787(2) 153(3) 153(1) 153(2) 153(2) 14(3) 14(2) 14() ZS (1) 1895(2) 1895(1) 1787() 153(3) 153() 153() 153() 153() 13() 13() 13() ZS (12) 1895(4) 1895(5) 1787(6) 1787(1) 1787(3) 178(3) 153() 153(2) 14(1) 14(2) 14(1) ZS93 192(2) 1895(3) 1895() 1787(2) 1787(2) 1787(1) 178(1) 153(1) 153(1) 14(1) 14() 14() ZS (1) 195(1) 195() 1787() 1787(1) 1787() 178() 153() 153() 153(1) 145() 153() ZS (4) 1895(2) 1895(3) 17(1) 17() 17(1) 17(1) 145() 145() 145() 145() 145() ZS (5) 1895(2) 1895(3) 17(5) 17(1) 17(2) 17() 145() 145() 145() 13() 145() ZS (2) 1895() 1895(1) 17(1) 17() 17() 153(1) 153() 13() 13() 13() 13() ZS (3) 1895() 1895(3) 17(2) 17(2) 17() 17() 145() 145(1) 145() 145() 145() ZS (3) 1895(2) 1895(3) 17() 17() 17(1) 17() 145() 145() 145() 145() 145() Table 2: Starting date of the complete period in the CPTI4 catalog according to the statistical approach for the ZS9 seismic source zones. In round brackets the number of events used in the analysis. 27
28 Table 3: A priori α parameters. They are the normalized frequency of occurrence of the 12 magnitude classes, on the basis of INGV-CNT catalogue, with b-value of
29 log1 (number events) b=1.17 ± M w Figure 2: The magnitude-frequency relation of M w 2.9 events since 1981 (data from INGV-CNT catalog). We plot the value of b of the Gutenberg-Richter relation from a Maximum Likelihood Estimation. 29
30 Posterior probabilty density function of θ Zone ZS91 (a) θ 1 θ 2 θ 3 θ 4 θ 5 θ 6 θ 7 θ 8 θ 9 θ 1 θ 11 θ Zone ZS (b) Posterior probabilty density function of θ Zone ZS Probability of different classes (θ) (c) Zone ZS Probability of different classes (θ) (d) Figure 3: Marginals posterior distributions for the 12 states for zone ZS91(a), ZS95 (b), ZS923 (c) and ZS931(d) 3
31 31
32 32
33 Figure 4: Marginal probability distribution of earthquake size for the different zones based on the historical completeness estimates, for the prior and posterior distributions. Diamonds represent the 5 percentile for the posterior Dirichlet distribution; Stars represent the 5 percentile for the prior Dirichlet distribution. Dark-gray area covers the area of the 1-9 percentile of the posterior Dirichlet distribution; light-gray area the same but for the prior Dirichlet distribution. Top panel: zones 1 to 12; Middle panel: zones 13 to 24; Lower pannel: zones 25 to
34 Zone 1 Zone 2 Zone 3 Probability Zone Zone Zone 6 Probability Zone Zone Zone 9 Probability Zone Zone Zone 12 Probability magnitude class magnitude class magnitude class 34
35 Zone 13 Zone 14 Zone 15 Probability Zone Zone Zone 18 Probability Zone Zone Zone 21 Probability Zone Zone Zone 24 Probability magnitude class magnitude class magnitude class 35
36 Zone 25 Zone 26 Zone 27 Probability Zone Zone Zone 3 Probability Zone Zone Zone 33 Probability Zone Zone Zone 36 Probability magnitude class magnitude class magnitude class Figure 5: Comparison of the mean values of the probability distribution of earthquake size for the different zones based on the historical completeness estimates. Diamonds represents the mean for the posterior Dirichlet distribution. The gray area is the ±σ value. Stars: the mean of the prior distribution; Plus the MPS4- GR distribution. Top panel: zones 1 to 12; Middle pannel: zones 13 to 24; Lower pannel: zones 25 to

37 Figure 6: Marginal probability distribution of earthquake size - now for 6 larger classes - for the different zones based on the historical completeness estimates, for the prior and posterior distributions. Diamonds represent the 5 percentile for the posterior Dirichlet distribution; Stars represent the 5 percentile for the prior Dirichlet distribution. Dark-gray area covers the area of the 1-9 percentile of the posterior Dirichlet distribution; light-gray area the same but for the prior Dirichlet distribution. In picture, only 12 out of 36 zones are shown, as sake of comparison. 37
38 Zone 1 Zone 5 Zone 8 Probability Zone Zone Zone 18 Probability Zone Zone Zone 25 Probability Zone Zone Zone 36 Probability magnitude class magnitude class magnitude class Figure 7: Comparison of the mean values of the probability distribution of earthquake size - now for 6 larger classes - for the different zones based on the historical completeness estimates. Diamonds represents the mean for the posterior Dirichlet distribution. The gray area is the ±σ value. Stars: the mean of the prior distribution; Plus the MPS4-GR distribution. In picture, only 12 out of 36 zones are shown, as sake of comparison. 38
Comment on the paper. Layered seismogenic source model and probabilistic seismic-hazard analyses in. Central Italy
 Comment on the paper Layered seismogenic source model and probabilistic seismic-hazard analyses in Central Italy by Pace B., L. Peruzza, G. Lavecchia, P. Boncio. BSSA, vol. 96, No. 1, pp. 107-132, February
Project S1: Analysis of the seismic potential in Italy for the evaluation of the seismic hazard
 Agreement INGV-DPC 2007-2009 Project S1: Analysis of the seismic potential in Italy for the evaluation of the seismic hazard Responsibles: Salvatore Barba, Istituto Nazionale di Geofisica e Vulcanologia,
Italian Map of Design Earthquakes from Multimodal Disaggregation Distributions: Preliminary Results.
 Italian Map of Design Earthquakes from Multimodal Disaggregation Distributions: Preliminary Results. Eugenio Chioccarelli Dipartimento di Ingegneria Strutturale, Università degli Studi di Napoli, Federico
Probabilistic procedure to estimate the macroseismic intensity attenuation in the Italian volcanic districts
 Probabilistic procedure to estimate the macroseismic intensity attenuation in the Italian volcanic districts G. Zonno 1, R. Azzaro 2, R. Rotondi 3, S. D'Amico 2, T. Tuvè 2 and G. Musacchio 1 1 Istituto
Italian design earthquakes: how and why
 Italian design earthquakes: how and why Iunio Iervolino, Eugenio Chioccarelli Dipartimento DIST Università degli Studi di Napoli Federico II. Via Claudio 21, 8125 Napoli. Vincenzo Convertito Istituto Nazionale
Design earthquakes map: an additional tool for engineering seismic risk analysis. Application to southern Apennines (Italy).
.") Design earthquakes map: an additional tool for engineering seismic risk analysis. Application to southern Apennines (Italy). Vincenzo Convertito Istituto Nazionale di Geofisica e Vulcanologia, Osservatorio
Design earthquakes map: an additional tool for engineering seismic risk analysis. Application to southern Apennines (Italy). Vincenzo Convertito Istituto Nazionale di Geofisica e Vulcanologia, Osservatorio
Setting up an earthquake forecast experiment in Italy
 ANNALS OF GEOPHYSICS, 53, 3, 2010; doi: 10.4401/ag-4844 Setting up an earthquake forecast experiment in Italy Danijel Schorlemmer 1,*, Annemarie Christophersen 2, Andrea Rovida 3, Francesco Mele 4, Massimiliano
On the earthquake predictability of fault interaction models
 On the earthquake predictability of fault interaction models Warner Marzocchi, and Daniele Melini Istituto Nazionale di Geofisica e Vulcanologia, Rome, Italy StatSei 9 meeting, Potsdam, June 15-17, 2015
1.1 Prior to the 6 April 2009, L Aquila earthquake: state of knowledge and seismological hypotheses
 Seismic actions and site effects 1.1 Prior to the 6 April 2009, L Aquila earthquake: state of knowledge and seismological hypotheses E. Boschi 1, A. Amato 1, C. Chiarabba 1, C. Meletti 2, D. Pantosti 1,
Operational Earthquake Forecasting in Italy: perspectives and the role of CSEP activities
 Operational Earthquake Forecasting in Italy: perspectives and the role of CSEP activities Warner Marzocchi, Istituto Nazionale di Geofisica e Vulcanologia, Italy The research was developed partially within
Overview of Seismic PHSA Approaches with Emphasis on the Management of Uncertainties
 H4.SMR/1645-29 "2nd Workshop on Earthquake Engineering for Nuclear Facilities: Uncertainties in Seismic Hazard" 14-25 February 2005 Overview of Seismic PHSA Approaches with Emphasis on the Management of
Analysis of the 2016 Amatrice earthquake macroseismic data
 Analysis of the 2016 Amatrice earthquake macroseismic data LORENZO HOFER, MARIANO ANGELO ZANINI*, FLORA FALESCHINI University of Padova, Dept. of Civil, Environmental and Architectural Engineering, Padova,
What is the impact of the August 24, 2016 Amatrice earthquake on the seismic hazard assessment in central Italy?
 What is the impact of the August 24, 2016 Amatrice earthquake on the seismic hazard assessment in central Italy? MAURA MURRU *, MATTEO TARONI, AYBIGE AKINCI, GIUSEPPE FALCONE Istituto Nazionale di Geofisica
Comment on Systematic survey of high-resolution b-value imaging along Californian faults: inference on asperities.
 Comment on Systematic survey of high-resolution b-value imaging along Californian faults: inference on asperities Yavor Kamer 1, 2 1 Swiss Seismological Service, ETH Zürich, Switzerland 2 Chair of Entrepreneurial
THE ECAT SOFTWARE PACKAGE TO ANALYZE EARTHQUAKE CATALOGUES
 THE ECAT SOFTWARE PACKAGE TO ANALYZE EARTHQUAKE CATALOGUES Tuba Eroğlu Azak Akdeniz University, Department of Civil Engineering, Antalya Turkey tubaeroglu@akdeniz.edu.tr Abstract: Earthquakes are one of
Time-dependent neo-deterministic seismic hazard scenarios: Preliminary report on the M6.2 Central Italy earthquake, 24 th August 2016
 Time-dependent neo-deterministic seismic hazard scenarios: Preliminary report on the M6.2 Central Italy earthquake, 24 th August 2016 Antonella Peresan 1,2,4, Vladimir Kossobokov 3,4, Leontina Romashkova
Adaptively smoothed seismicity earthquake forecasts for Italy
 ANNALS OF GEOPHYSICS, 53, 3, 2010; doi: 10.4401/ag-4839 Adaptively smoothed seismicity earthquake forecasts for Italy Maximilian J. Werner 1,*, Agnès Helmstetter 2, David D. Jackson 3, Yan Y. Kagan 3,
MICROZONATION STUDY FOR AN INDUSTRIAL SITE IN SOUTHERN ITALY
 MICROZONATION STUDY FOR AN INDUSTRIAL SITE IN SOUTHERN ITALY E. Fiorini 1, M. Onida 1, B. Borzi 1, F. Pacor 2, L. Luzi 2, C. Meletti 2, V. D Amico 2, S. Marzorati 2, G. Ameri 2 1 EUCENTRE, European Centre
Daily earthquake forecasts during the May-June 2012 Emilia earthquake sequence (northern Italy)
") 2012 EMILIA EARTHQUAKES ANNALS OF GEOPHYSICS, 55, 4, 2012; doi: 10.4401/ag-6161 Daily earthquake forecasts during the May-June 2012 Emilia earthquake sequence (northern Italy) Warner Marzocchi *, Maura
2012 EMILIA EARTHQUAKES ANNALS OF GEOPHYSICS, 55, 4, 2012; doi: 10.4401/ag-6161 Daily earthquake forecasts during the May-June 2012 Emilia earthquake sequence (northern Italy) Warner Marzocchi *, Maura
SEISMOTECTONIC ANALYSIS OF A COMPLEX FAULT SYSTEM IN ITALY: THE
 SEISMOTECTONIC ANALYSIS OF A COMPLEX FAULT SYSTEM IN ITALY: THE GARFAGNANA-NORTH (NORTHERN TUSCANY) LINE. Eva Claudio 1, Eva Elena 2, Scafidi Davide 1, Solarino Stefano 2, Turino Chiara 1 1 Dipartimento
THE ROLE OF EPSILON FOR THE IDENTIFICATION OF GROUPS OF EARTHQUAKE INPUTS OF GIVEN HAZARD
 THE ROLE OF EPSILON FOR THE IDENTIFICATION OF GROUPS OF EARTHQUAKE INPUTS OF GIVEN HAZARD Tomaso TROMBETTI Stefano SILVESTRI * Giada GASPARINI University of Bologna, Italy THE ISSUE 2 THE ISSUE 3 m 3 u
EARTHQUAKE HAZARD ASSESSMENT IN KAZAKHSTAN
 EARTHQUAKE HAZARD ASSESSMENT IN KAZAKHSTAN Dr Ilaria Mosca 1 and Dr Natalya Silacheva 2 1 British Geological Survey, Edinburgh (UK) imosca@nerc.ac.uk 2 Institute of Seismology, Almaty (Kazakhstan) silacheva_nat@mail.ru
Monte Carlo simulations for analysis and prediction of nonstationary magnitude-frequency distributions in probabilistic seismic hazard analysis
 Monte Carlo simulations for analysis and prediction of nonstationary magnitude-frequency distributions in probabilistic seismic hazard analysis Mauricio Reyes Canales and Mirko van der Baan Dept. of Physics,
Uniform Hazard Spectrum(UHS) for performance based seismic design
 for performance based seismic design") Uniform Hazard Spectrum(UHS) for performance based seismic design *Jun-Kyoung Kim 1), Soung-Hoon Wee 2) and Seong-Hwa Yoo 2) 1) Department of Fire Protection and Disaster Prevention, Semyoung University,
Uniform Hazard Spectrum(UHS) for performance based seismic design *Jun-Kyoung Kim 1), Soung-Hoon Wee 2) and Seong-Hwa Yoo 2) 1) Department of Fire Protection and Disaster Prevention, Semyoung University,
Preliminary Statistics Lecture 2: Probability Theory (Outline) prelimsoas.webs.com
 prelimsoas.webs.com") 1 School of Oriental and African Studies September 2015 Department of Economics Preliminary Statistics Lecture 2: Probability Theory (Outline) prelimsoas.webs.com Gujarati D. Basic Econometrics, Appendix
1 School of Oriental and African Studies September 2015 Department of Economics Preliminary Statistics Lecture 2: Probability Theory (Outline) prelimsoas.webs.com Gujarati D. Basic Econometrics, Appendix
Simulated and Observed Scaling in Earthquakes Kasey Schultz Physics 219B Final Project December 6, 2013
 Simulated and Observed Scaling in Earthquakes Kasey Schultz Physics 219B Final Project December 6, 2013 Abstract Earthquakes do not fit into the class of models we discussed in Physics 219B. Earthquakes
Estimation of reliability parameters from Experimental data (Parte 2) Prof. Enrico Zio
 Prof. Enrico Zio") Estimation of reliability parameters from Experimental data (Parte 2) This lecture Life test (t 1,t 2,...,t n ) Estimate θ of f T t θ For example: λ of f T (t)= λe - λt Classical approach (frequentist
Estimation of reliability parameters from Experimental data (Parte 2) This lecture Life test (t 1,t 2,...,t n ) Estimate θ of f T t θ For example: λ of f T (t)= λe - λt Classical approach (frequentist
A GLOBAL MODEL FOR AFTERSHOCK BEHAVIOUR
 A GLOBAL MODEL FOR AFTERSHOCK BEHAVIOUR Annemarie CHRISTOPHERSEN 1 And Euan G C SMITH 2 SUMMARY This paper considers the distribution of aftershocks in space, abundance, magnitude and time. Investigations
Advanced Conference on Seismic Risk Mitigation and Sustainable Development
 2142-21 Advanced Conference on Seismic Risk Mitigation and Sustainable Development 10-14 May 2010 ANALYSIS OF EARTHQUAKE CATALOGUES FOR CSEP TESTING REGION ITALY A. Peressan Department of Earth Sciences/ICTP
Mechanical origin of aftershocks: Supplementary Information
 Mechanical origin of aftershocks: Supplementary Information E. Lippiello Department of Mathematics and Physics, Second University of Naples, Via Vivaldi 43, 81100 Caserta, Italy & Kavli Institute for Theoretical
the abdus salam international centre for theoretical physics
 united nations educational, scientific and cultural organization the abdus salam international centre for theoretical physics international atomic energy agency strada costiera, 11-34014 trieste italy
Coping with natural risk in the XXI century: new challenges for scientists and decision makers
 Coping with natural risk in the XXI century: new challenges for scientists and decision makers Warner Marzocchi, Istituto Nazionale di Geofisica e Vulcanologia Outline The definition of hazard and risk
Investigating the effects of smoothing on the performance of earthquake hazard maps
 Brooks et al. Smoothing hazard maps 1 Investigating the effects of smoothing on the performance of earthquake hazard maps Edward M. Brooks 1,2, Seth Stein 1,2, Bruce D. Spencer 3,2 1 Department of Earth
Maximum Direction to Geometric Mean Spectral Response Ratios using the Relevance Vector Machine
 Maximum Direction to Geometric Mean Spectral Response Ratios using the Relevance Vector Machine Y. Dak Hazirbaba, J. Tezcan, Q. Cheng Southern Illinois University Carbondale, IL, USA SUMMARY: The 2009
volcanic tremor and Low frequency earthquakes at mt. vesuvius M. La Rocca 1, D. Galluzzo 2 1
 volcanic tremor and Low frequency earthquakes at mt. vesuvius M. La Rocca 1, D. Galluzzo 2 1 Università della Calabria, Cosenza, Italy 2 Istituto Nazionale di Geofisica e Vulcanologia Osservatorio Vesuviano,
THE SEISMICITY OF THE CAMPANIAN PLAIN: PRELIMINARY RESULTS
 THE SEISMICITY OF THE CAMPANIAN PLAIN: PRELIMINARY RESULTS Girolamo Milano Osservatorio Vesuviano, Via Diocleziano 328, 80124 Napoli milano@osve.unina.it INTRODUCTION In areas affected by active volcanism,
Regional Workshop on Essential Knowledge of Site Evaluation Report for Nuclear Power Plants.
 Regional Workshop on Essential Knowledge of Site Evaluation Report for Nuclear Power Plants. Development of seismotectonic models Ramon Secanell Kuala Lumpur, 26-30 August 2013 Overview of Presentation
arxiv: v2 [physics.geo-ph] 28 Jun 2010
![arxiv: v2 [physics.geo-ph] 28 Jun 2010](/thumbs/92/108367569.jpg "arxiv: v2 [physics.geo-ph] 28 Jun 2010") arxiv:1003.4374v2 [physics.geo-ph] 28 Jun 2010 1 2 3 4 5 6 7 8 9 10 11 12 13 14 15 16 17 18 19 20 21 22 23 24 25 26 27 28 Adaptively Smoothed Seismicity Earthquake Forecasts for Italy Maximilian J. Werner
arxiv:1003.4374v2 [physics.geo-ph] 28 Jun 2010 1 2 3 4 5 6 7 8 9 10 11 12 13 14 15 16 17 18 19 20 21 22 23 24 25 26 27 28 Adaptively Smoothed Seismicity Earthquake Forecasts for Italy Maximilian J. Werner
S. Barani 1, D. Albarello 2, M. Massa 3, D. Spallarossa 1
 on the infulence of ground motion predictive equations on Probabilistic Seismic Hazard analysis, part 2: testing and scoring past and recent attenuation models S. Barani 1, D. Albarello 2, M. Massa 3,
On the Occurrence of Large Earthquakes: New Insights From a Model based on Interacting Faults Embedded in a Realistic Tectonic Setting
 JOURNAL OF GEOPHYSICAL RESEARCH, VOL.???, XXXX, DOI:10.1029/, On the Occurrence of Large Earthquakes: New Insights From a Model based on Interacting Faults Embedded in a Realistic Tectonic Setting Warner
Estimation of Regional Seismic Hazard in the Korean Peninsula Using Historical Earthquake Data between A.D. 2 and 1995
 Bulletin of the Seismological Society of America, Vol. 94, No. 1, pp. 269 284, February 2004 Estimation of Regional Seismic Hazard in the Korean Peninsula Using Historical Earthquake Data between A.D.
Geophysical Journal International
 Geophysical Journal International Geophys. J. Int. (2012) 190, 1733 1745 doi: 10.1111/j.1365-246X.2012.05575.x A comparison of moment magnitude estimates for the European Mediterranean and Italian regions
Appendix O: Gridded Seismicity Sources
 Appendix O: Gridded Seismicity Sources Peter M. Powers U.S. Geological Survey Introduction The Uniform California Earthquake Rupture Forecast, Version 3 (UCERF3) is a forecast of earthquakes that fall
Renewal models of seismic recurrence applied to paleoseismological. data. Abstract. I. Mosca 1, R. Console 2,3 and G. D Addezio 2
 * Manuscript Click here to download Manuscript: manuscript.doc Renewal models of seismic recurrence applied to paleoseismological data I. Mosca 1, R. Console 2,3 and G. D Addezio 2 1 Utrecht University,
Seismic Source Characterization in Siting New Nuclear Power Plants in the Central and Eastern United States
 Seismic Source Characterization in Siting New Nuclear Power Plants in the Central and Eastern United States ABSTRACT : Yong Li 1 and Nilesh Chokshi 2 1 Senior Geophysicist, 2 Deputy Director of DSER Nuclear
Northern Sicily, September 6, 2002 earthquake: investigation on peculiar macroseismic effects
 ANNALS OF GEOPHYSICS, VOL. 46, N. 6, December 2003 Northern Sicily, September 6, 2002 earthquake: investigation on peculiar macroseismic effects Calvino Gasparini, Patrizia Tosi and Valerio De Rubeis Istituto
L. Danciu, D. Giardini, J. Wößner Swiss Seismological Service ETH-Zurich Switzerland
 BUILDING CAPACITIES FOR ELABORATION OF NDPs AND NAs OF THE EUROCODES IN THE BALKAN REGION Experience on the field of seismic hazard zonation SHARE Project L. Danciu, D. Giardini, J. Wößner Swiss Seismological
Deterministic Seismic Hazard Assessment of Quetta, Pakistan
 Deterministic Seismic Hazard Assessment of Quetta, Pakistan M.A. Shah Micro Seismic Studies Programme, Islamabad, Pakistan Pakistan Institute of Engineering and Applied Sciences, Islamabad, Pakistan M.
Comment on Why Do Modern Probabilistic Seismic-Hazard Analyses Often Lead to Increased Hazard Estimates? by Julian J. Bommer and Norman A.
 Comment on Why Do Modern Probabilistic Seismic-Hazard Analyses Often Lead to Increased Hazard Estimates? by Julian J. Bommer and Norman A. Abrahamson Zhenming Wang Kentucky Geological Survey 8 Mining and
Coulomb stress changes due to Queensland earthquakes and the implications for seismic risk assessment
 Coulomb stress changes due to Queensland earthquakes and the implications for seismic risk assessment Abstract D. Weatherley University of Queensland Coulomb stress change analysis has been applied in
Distribution of volcanic earthquake recurrence intervals
 JOURNAL OF GEOPHYSICAL RESEARCH, VOL. 114,, doi:10.1029/2008jb005942, 2009 Distribution of volcanic earthquake recurrence intervals M. Bottiglieri, 1 C. Godano, 1 and L. D Auria 2 Received 21 July 2008;
SEISMIC INPUT FOR CHENNAI USING ADAPTIVE KERNEL DENSITY ESTIMATION TECHNIQUE
 SEISMIC INPUT FOR CHENNAI USING ADAPTIVE KERNEL DENSITY ESTIMATION TECHNIQUE G. R. Dodagoudar Associate Professor, Indian Institute of Technology Madras, Chennai - 600036, goudar@iitm.ac.in P. Ragunathan
Occurrence of negative epsilon in seismic hazard analysis deaggregation, and its impact on target spectra computation
 Occurrence of negative epsilon in seismic hazard analysis deaggregation, and its impact on target spectra computation Lynne S. Burks 1 and Jack W. Baker Department of Civil and Environmental Engineering,
Probabilistic approach to earthquake prediction
 ANNALS OF GEOPHYSICS, VOL. 45, N. 6, December 2002 Probabilistic approach to earthquake prediction Rodolfo Console, Daniela Pantosti and Giuliana D Addezio Istituto Nazionale di Geofisica e Vulcanologia,
The ShakeMap Atlas for the City of Naples, Italy
 The ShakeMap Atlas for the City of Naples, Italy by Licia Faenza, Simona Pierdominici, Romano Camassi, Alberto Michelini, Emanuela Ercolani, and Valentino Lauciani E Online Material: Tables of felt earthquakes
Seismic Analysis of Structures Prof. T.K. Datta Department of Civil Engineering Indian Institute of Technology, Delhi. Lecture 03 Seismology (Contd.
 Seismic Analysis of Structures Prof. T.K. Datta Department of Civil Engineering Indian Institute of Technology, Delhi Lecture 03 Seismology (Contd.) In the previous lecture, we discussed about the earth
Simple smoothed seismicity earthquake forecasts for Italy
 ANNALS OF GEOPHYSICS, 53, 3, 010; doi: 10.4401/ag-4845 Simple smoothed seismicity earthquake forecasts for Italy J. Douglas Zechar 1,,* and Thomas H. Jordan 3 1 ETH Zurich, Swiss Seismological Service,
Module 7 SEISMIC HAZARD ANALYSIS (Lectures 33 to 36)
") Lecture 34 Topics Module 7 SEISMIC HAZARD ANALYSIS (Lectures 33 to 36) 7.3 DETERMINISTIC SEISMIC HAZARD ANALYSIS 7.4 PROBABILISTIC SEISMIC HAZARD ANALYSIS 7.4.1 Earthquake Source Characterization 7.4.2
Lecture 34 Topics Module 7 SEISMIC HAZARD ANALYSIS (Lectures 33 to 36) 7.3 DETERMINISTIC SEISMIC HAZARD ANALYSIS 7.4 PROBABILISTIC SEISMIC HAZARD ANALYSIS 7.4.1 Earthquake Source Characterization 7.4.2
Soil Dynamics and Earthquake Engineering
 Soil Dynamics and Earthquake Engineering 31 (2011) 1212 1231 Contents lists available at ScienceDirect Soil Dynamics and Earthquake Engineering journal homepage: www.elsevier.com/locate/soildyn Engineering
5. Probabilistic Seismic Hazard Analysis
 Probabilistic Seismic Hazard Analysis (PSHA) proposed by C.A. Cornell (1968) used to determine the design earthquake for all locations in USA. PSHA gives a relative quantification i of the design earthquake,
A TESTABLE FIVE-YEAR FORECAST OF MODERATE AND LARGE EARTHQUAKES. Yan Y. Kagan 1,David D. Jackson 1, and Yufang Rong 2
 Printed: September 1, 2005 A TESTABLE FIVE-YEAR FORECAST OF MODERATE AND LARGE EARTHQUAKES IN SOUTHERN CALIFORNIA BASED ON SMOOTHED SEISMICITY Yan Y. Kagan 1,David D. Jackson 1, and Yufang Rong 2 1 Department
Macroseismic Earthquake Parameter Determination. Appendix E
 Appendix E The BOXER method applied to the determination of earthquake parameters from macroseismic data - Verification of the calibration of historical earthquakes in the Earthquake Catalogue of Switzerland
Supporting Information for Break of slope in earthquake-size distribution reveals creep rate along the San Andreas fault system
 GEOPHYSICAL RESEARCH LETTERS Supporting Information for Break of slope in earthquake-size distribution reveals creep rate along the San Andreas fault system Inessa Vorobieva, 1,2 Peter Shebalin, 1,2 Clément
Earthquake catalogues and preparation of input data for PSHA science or art?
 Earthquake catalogues and preparation of input data for PSHA science or art? Marijan Herak Department of Geophysics, Faculty of Science University of Zagreb, Zagreb, Croatia e-mail: herak@irb.hr EARTHQUAKE
PARAMETER ESTIMATION: BAYESIAN APPROACH. These notes summarize the lectures on Bayesian parameter estimation.
 PARAMETER ESTIMATION: BAYESIAN APPROACH. These notes summarize the lectures on Bayesian parameter estimation.. Beta Distribution We ll start by learning about the Beta distribution, since we end up using
Bayesian Methods for Machine Learning
 Bayesian Methods for Machine Learning CS 584: Big Data Analytics Material adapted from Radford Neal s tutorial (http://ftp.cs.utoronto.ca/pub/radford/bayes-tut.pdf), Zoubin Ghahramni (http://hunch.net/~coms-4771/zoubin_ghahramani_bayesian_learning.pdf),
Recent advances on assessing seismic hazard and earthquake probabilities in Italy
 Recent advances on assessing seismic hazard and earthquake probabilities in Italy Dario Slejko (1) and Gianluca Valensise (2) with contributions of Salvatore Barba (2), Roberto Basili (2), Alessandro Caporali
AN OVERVIEW AND GUIDELINES FOR PROBABILISTIC SEISMIC HAZARD MAPPING
 CO 2 TRACCS INTERNATIONAL WORKSHOP Bucharest, 2 September, 2012 AN OVERVIEW AND GUIDELINES FOR PROBABILISTIC SEISMIC HAZARD MAPPING M. Semih YÜCEMEN Department of Civil Engineering and Earthquake Studies
QUANTITATIVE PROBABILISTIC SEISMIC RISK ANALYSIS OF STORAGE FACILITIES
 QUANTITATIVE PROBABILISTIC SEISMIC RISK ANALYSIS OF STORAGE FACILITIES Antonio Di Carluccio, Iunio Iervolino, Gaetano Manfredi Dip. di Analisi e Progettazione Sismica, Università di Napoli Federico II,
Bayesian Inference. Chapter 1. Introduction and basic concepts
 Bayesian Inference Chapter 1. Introduction and basic concepts M. Concepción Ausín Department of Statistics Universidad Carlos III de Madrid Master in Business Administration and Quantitative Methods Master
Comparison between empirical predictive equations calibrated at global and national scale and the Italian strong-motion data
 Comparison between empirical predictive equations calibrated at global and national scale and the Italian strong-motion data Massa M., Luzi L., Pacor F., Bindi D., and Ameri G. Istituto Nazionale di Geofisica
OPERATIONAL EARTHQUAKE LOSS FORECASTING IN ITALY: PRELIMINARY RESULTS
 OPERATIONAL EARTHQUAKE LOSS FORECASTING IN ITALY: PRELIMINARY RESULTS Iunio IERVOLINO, 1 Eugenio CHIOCCARELLI, 2 Massimiliano GIORGIO, 3 Warner MARZOCCHI, 4 Anna Maria LOMBARDI, 5 Giulio ZUCCARO, 6 and
Assessment and Mitigation of Ground Motion Hazards from Induced Seismicity. Gail M. Atkinson
 Assessment and Mitigation of Ground Motion Hazards from Induced Seismicity Gail M. Atkinson (with acknowledgement to many collaborators, especially Ghofrani and Assatourians) NSERC/TransAlta/Nanometrics
Aspects of risk assessment in power-law distributed natural hazards
 Natural Hazards and Earth System Sciences (2004) 4: 309 313 SRef-ID: 1684-9981/nhess/2004-4-309 European Geosciences Union 2004 Natural Hazards and Earth System Sciences Aspects of risk assessment in power-law
Non-commercial use only
 DOI: 10.4081/jsas.2016.6953 BEST STRATEGY FOR THE DEVELOPMENT OF A SEISMIC PREVENTION PLAN Enzo Mantovani, 1 Marcello Viti, 1 Daniele Babbucci, 1 Caterina Tamburelli, 1 Nicola Cenni 2 1 Dipartimento di
BC HYDRO SSHAC LEVEL 3 PSHA STUDY METHODOLOGY
 BC HYDRO SSHAC LEVEL 3 PSHA STUDY METHODOLOGY M. W. McCann, Jr. 1, K. Addo 2 and M. Lawrence 3 ABSTRACT BC Hydro recently completed a comprehensive Probabilistic Seismic Hazard Analysis (PSHA) to evaluate
SEISMIC HAZARD CHARACTERIZATION AND RISK EVALUATION USING GUMBEL S METHOD OF EXTREMES (G1 AND G3) AND G-R FORMULA FOR IRAQ
 AND G-R FORMULA FOR IRAQ") 13 th World Conference on Earthquake Engineering Vancouver, B.C., Canada August 1-6, 2004 Paper No. 2898 SEISMIC HAZARD CHARACTERIZATION AND RISK EVALUATION USING GUMBEL S METHOD OF EXTREMES (G1 AND G3)
13 th World Conference on Earthquake Engineering Vancouver, B.C., Canada August 1-6, 2004 Paper No. 2898 SEISMIC HAZARD CHARACTERIZATION AND RISK EVALUATION USING GUMBEL S METHOD OF EXTREMES (G1 AND G3)
SUPPLEMENTAL INFORMATION
 GSA DATA REPOSITORY 2013310 A.M. Thomas et al. MOMENT TENSOR SOLUTIONS SUPPLEMENTAL INFORMATION Earthquake records were acquired from the Northern California Earthquake Data Center. Waveforms are corrected
Probabilistic Earthquake Risk Assessment of Newcastle and Lake Macquarie Part 1 Seismic Hazard.
 Probabilistic Earthquake Risk Assessment of Newcastle and Lake Macquarie Part 1 Seismic Hazard. T. Dhu, D. Robinson, C. Sinadinovski, T. Jones, A. Jones & J. Schneider Geoscience Australia, Canberra, Australia.
The attenuation of seismic intensity in the Etna region and comparison with other Italian volcanic districts
 ANNALS OF GEOPHYSICS, VOL. 49, N. 4/5, August/October 2006 The attenuation of seismic intensity in the Etna region and comparison with other Italian volcanic districts Raffaele Azzaro ( 1 ), M. Serafina
ANNALS OF GEOPHYSICS, VOL. 51, N. 2/3, April/June 2008
 ANNALS OF GEOPHYSICS, VOL. 51, N. 2/3, April/June 2008 Earthquake forecasting in Italy, before and after the Umbria-Marche seismic sequence 1997. A review of earthquake occurrence modeling at different
VHR seismic imaging of displacement along an active off-shore fault system of the Adriatic foreland
 VHR seismic imaging of displacement along an active off-shore fault system of the Adriatic foreland Daniela Di Bucci 1, Domenico Ridente 2, 3, Umberto Fracassi 4, Fabio Trincardi 2, Gianluca Valensise
Probabilistic eruption forecasting and the call for an evacuation
 1 Probabilistic eruption forecasting and the call for an evacuation Warner Marzocchi Istituto Nazionale di Geofisica e Vulcanologia, Italy. Gordon Woo Risk Management Solutions, United Kingdom. Short title:
Abstract. 1 Introduction
 Macroseismic intensity versos distance: constraints to the attenuation model L. Peruzza CNR, Gruppo Nazionaleper la Difesa dai Terremoti, at OGS, 2077, 34076 Abstract Constraints in the way of deriving
Section 3: Report on the project by UR Responsible
 Section 3: Report on the project by UR Responsible 3.1 UR information 3.1.1 UR no. 3.13 3.1.2 UR responsible: Zonno Gaetano 3.1.3 Email: zonno@mi.ingv.it 3.2 Activity of UR (1 and 2 year of the project)
Testing for Poisson Behavior
 Testing for Poisson Behavior Philip B. Stark Department of Statistics, UC Berkeley joint with Brad Luen 17 April 2012 Seismological Society of America Annual Meeting San Diego, CA Quake Physics versus
Quantifying the effect of declustering on probabilistic seismic hazard
 Proceedings of the Ninth Pacific Conference on Earthquake Engineering Building an Earthquake-Resilient Society 14-16 April, 2011, Auckland, New Zealand Quantifying the effect of declustering on probabilistic
PSHA for seismicity induced by gas extraction in the Groningen Field
 PSHA for seismicity induced by gas extraction in the Groningen Field Dirk Kraaijpoel, Mauro Caccavale, Torild van Eck, Bernard Dost Schatzalp Workshop Induced Seismicity 2015-03-13 Groningen Field # events
Seismic-Hazard Assessment for a Characteristic Earthquake Scenario: An Integrated Probabilistic Deterministic Method
 Seismic-Hazard Assessment for a Characteristic Earthquake Scenario: An Integrated Probabilistic Deterministic Method by Vincenzo Convertito,* Antonio Emolo, and Aldo Zollo Abstract Probabilistic seismic
Statistical Rock Physics
 Statistical - Introduction Book review 3.1-3.3 Min Sun March. 13, 2009 Outline. What is Statistical. Why we need Statistical. How Statistical works Statistical Rock physics Information theory Statistics
Estimation of Peak Ground Acceleration for Delhi Region using Finsim, a Finite Fault Simulation Technique
 215 Estimation of Peak Ground Acceleration for Delhi Region using Finsim, a Finite Fault Simulation Technique NEELIMA SATYAM. D* and K. S. RAO** * Earthquake Engineering Research Centre, International
Probabilistic seismic hazard estimation in low-seismicity regions considering non-poissonian seismic occurrence
 Geophys. J. Int. (26) 164, 543 55 doi: 1.1111/j.1365-246X.26.2863.x Probabilistic seismic hazard estimation in low-seismicity regions considering non-poissonian seismic occurrence Céline Beauval, Sebastian
NEW LOCAL MAGNITUDE CALIBRATION FOR VRANCEA (ROMANIA) INTERMEDIATE-DEPTH EARTHQUAKES
 INTERMEDIATE-DEPTH EARTHQUAKES") Romanian Reports in Physics, Vol. 64, No. 4, P. 1097 1108, 2012 EARTH PHYSICS NEW LOCAL MAGNITUDE CALIBRATION FOR VRANCEA (ROMANIA) INTERMEDIATE-DEPTH EARTHQUAKES M. CRAIU, A. CRAIU, C. IONESCU, M. POPA,
Romanian Reports in Physics, Vol. 64, No. 4, P. 1097 1108, 2012 EARTH PHYSICS NEW LOCAL MAGNITUDE CALIBRATION FOR VRANCEA (ROMANIA) INTERMEDIATE-DEPTH EARTHQUAKES M. CRAIU, A. CRAIU, C. IONESCU, M. POPA,
A NEW STATISTICAL MODEL FOR VRANCEA EARTHQUAKES USING PRIOR INFORMATION FROM EARTHQUAKES BEFORE 1900
 A NEW STATISTICAL MODEL FOR VRANCEA EARTHQUAKES USING PRIOR INFORMATION FROM EARTHQUAKES BEFORE 1900 P.H.A.J.M. van Gelder 1 and D. Lungu 2 1 Department of Civil Engineering, Delft University of Technology,
THE RESPONSE SPECTRUM
 (NBCC 25) Gail M. The Canadian Society for Civil Engineering, Vancouver Section THE RESPONSE SPECTRUM Seismic Hazard Analysis to obtain Uniform Hazard Response Spectrum (NBCC 25) Gail M. Department of
Vertical to Horizontal (V/H) Ratios for Large Megathrust Subduction Zone Earthquakes
 Ratios for Large Megathrust Subduction Zone Earthquakes") Vertical to Horizontal (V/H) Ratios for Large Megathrust Subduction Zone Earthquakes N.J. Gregor Consultant, Oakland, California, USA N.A. Abrahamson University of California, Berkeley, USA K.O. Addo BC
Vertical to Horizontal (V/H) Ratios for Large Megathrust Subduction Zone Earthquakes N.J. Gregor Consultant, Oakland, California, USA N.A. Abrahamson University of California, Berkeley, USA K.O. Addo BC
Bayesian Inference for the Multivariate Normal
 Bayesian Inference for the Multivariate Normal Will Penny Wellcome Trust Centre for Neuroimaging, University College, London WC1N 3BG, UK. November 28, 2014 Abstract Bayesian inference for the multivariate
INTEGRATING DIVERSE CALIBRATION PRODUCTS TO IMPROVE SEISMIC LOCATION
 INTEGRATING DIVERSE CALIBRATION PRODUCTS TO IMPROVE SEISMIC LOCATION ABSTRACT Craig A. Schultz, Steven C. Myers, Jennifer L. Swenson, Megan P. Flanagan, Michael E. Pasyanos, and Joydeep Bhattacharyya Lawrence
Supplementary Note on Bayesian analysis
 Supplementary Note on Bayesian analysis Structured variability of muscle activations supports the minimal intervention principle of motor control Francisco J. Valero-Cuevas 1,2,3, Madhusudhan Venkadesan
Deaggregation of the Regional Seismic Hazard: City of Patras, Greece.
 Proceedings of the 1st IASME / WSEAS International Conference on Geology and Seismology (GES'07), Portoroz, Slovenia, May 15-17, 2007 57 Deaggregation of the Regional Seismic Hazard: City of Patras, Greece.