Resampling Methods CAPT David Ruth, USN
|
|
|
- Elisabeth Boone
- 5 years ago
- Views:
Transcription
1 Resampling Methods CAPT David Ruth, USN Mathematics Department, United States Naval Academy Science of Test Workshop 05 April 2017
2 Outline Overview of resampling methods Bootstrapping Cross-validation Permutation tests
3 Overview of resampling methods Re- sampling methods => methods applied to an existing sample. Gist: Sample from existing sample to obtain new sample(s). Bootstrapping: Sample WITH replacement, treating original sample as a proxy for the population of interest. Cross-validation and permutation tests: Sample WITHOUT replacement, using exchangeability assumptions for inference.

4 Bootstrapping
5 Bootstrapping The bootstrap is a tool for assessing statistical accuracy. Goal: Estimate any aspect of the distribution of S Z, where S is a statistic of interest and Z = Z 1,, Z n. Idea: Approximate the (unknown) distribution function, F, for the Z i s with the empirical distribution function, F. Draw bootstrap samples from F to estimate quantity of interest.
6 Bootstrapping For example, we can estimate the variance of S(Z) by Var S(Z) = 1 B 1 B i=1 S Z i S
7 Bootstrapping Algorithm: Given original sample Z = Z 1,, Z N, Choose some large B as the number of bootstrap samples. for (i in 1:B){ # Sample Z WITH REPLACEMENT to obtain bootstrap sample Z i = Z i1,, Z in # Compute statistic S Z i } Use the B bootstrap replications of the S Z i s to estimate quantity of interest.
8 Bootstrapping
9 Bootstrapping
10 Bootstrapping R
11 Cross-validation
12 Cross-validation One of the simplest and most widely used methods for estimating prediction error. If we had enough data, we might set aside a test set or validation set to assess a fitted prediction model s performance. Why not just use training data as test data? OVERFITTING!
13 Cross-validation Goal: Estimate expected extra-sample error E L Y, f(x) when X and Y are drawn from a from an independent test sample (e.g., E Y X β 2 ). Idea: Partition original data set into training and test sets. Fit model to training set; validate analysis on test set. Perform multiple rounds of partitioning and average prediction error over all rounds.
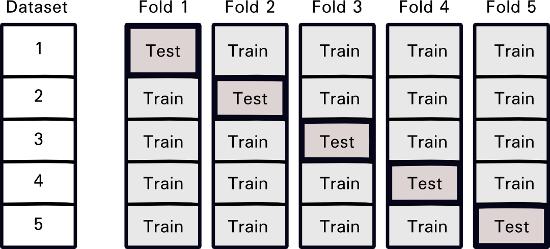
14 Cross-validation K-fold cross validation is widely used with K = 5 or K = 10 recommended as a good compromise. Algorithm: Split data into K roughly equal-sized parts. for (k in 1:K){ # Leave out set k, and fit model to remaining parts. # Compute prediction error for fitted model on set k.} Average the k prediction errors.
15 Cross-validation
16 Real-world example: Heart data Data: heart disease diagnosis for 303 patients at the Cleveland Clinic Foundation, plus 75 other attributes We consider 5 quantitative and 8 categorical explanatory variables with separate binary response (presence of heart disease; evident in 139 of 303 patients): age sex cp trestbps chol fbs restecg thalach exang oldpeak slope ca thal Data available from the UCI Machine Learning Repository at
17 Cross-validation R
18 Permutation tests
19 Permutation tests Permutation tests may be used to test for a distributional difference among groups. Under the assumption that observations are exchangeable, the distribution of a test statistic may be approximated by its empirical distribution under all possible label permutations. All possible may be rather large, so RESAMPLE!
20 Permutation tests Simple example: difference in resting blood pressure from heart data (univariate) Noisy example: difference in resting blood pressure from heart data with tainted labels (univariate) MCC example: difference in resting blood pressure from heart data with tainted labels (multivariate)
21 Permutation tests R
22 Mean Cross Count Test
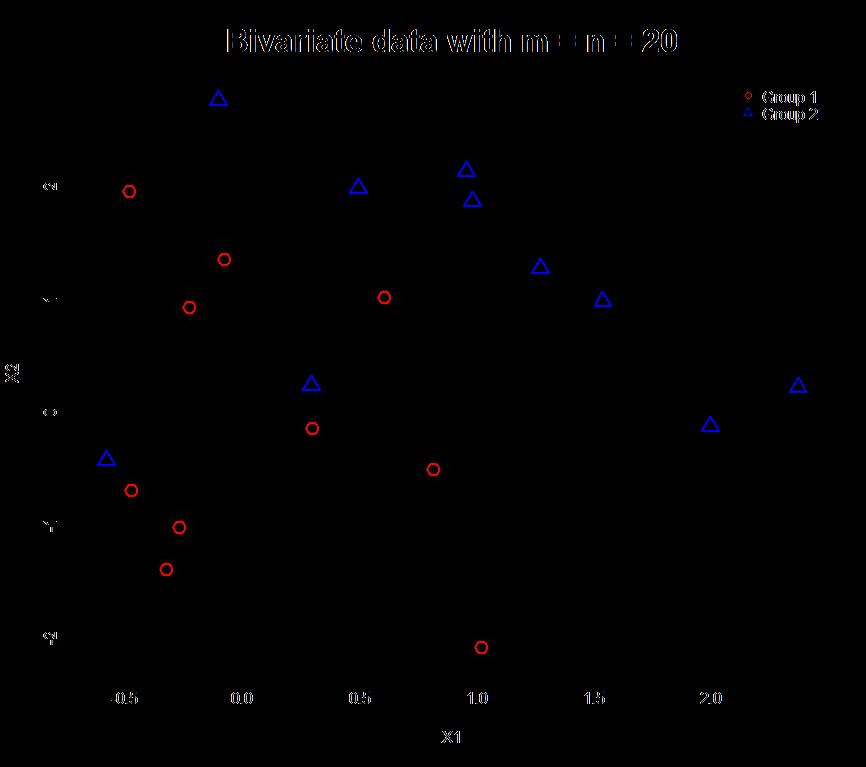
23 Problem statement Given: Two sets of independent multivariate observations (with categorical or quantitative attributes, or both). Formally: N = m + n independent p-variate observations A = X 1,, X m, B = X m+1,, X N, X i ~ F i: 1 i m, X j ~G j: m + 1 j N. Goal: Develop a robust two-sample test against H 0 : F = G.
24 Gower dissimilarity for mixed data Given p-variate observations X 1, X 2,, X N, the dissimilarity d ij,k between observations X i and X j on covariate k is given by d ij,k = 0 if covariate k is categorical and x ik = x jk, 1 if covariate k is categorical and x ik x jk, x ik x jk R k if covariate k is quantitative, where x ik and x jk are the i and j entries, respectively, in the column associated with covariate k, and R k is the range of covariate k. Gower s dissimilarity measure is a weighted average: p d Gower X i, X j = k=1 ij,k d ij,k p k=1 ij,k
. Let I k i, j = I X i and X j are in different leaves of tree k.")
25 Tree-based dissimilarity In the CART setting, consider two observations to be alike if they fall into the same leaf of a tree. Create p trees, using each predictor in turn as a response variable (may prune to avoid overfitting). Let I k i, j = I X i and X j are in different leaves of tree k. Define treeclust dissimilarity as d treeclust X i, X j = 1 K k=1 K (or variation on this theme). w k I k (i, j) The R package treeclust finds these pairwise dissimilarities.
26 Mean Cross Count test Given some choice of informative distance measure for mixed data, we use a graph-theoretic approach to determine whether a difference exists between groups. Let each observation be a vertex in a graph, G, and each pair of observations be an (undirected) edge. Assign interpoint dissimilarities as edge weights (from treeclust, for example).
27 Mean Cross Count test With respect to the weighted graph, G, find a minimum-weight r-regular spanning subgraph, G r. Note: G r does not depend on group labels. Let A r be the number of edges in G r which have one vertex in the first group and the other in the second group. Call T r = A r the Mean Cross-Count (MCC) r and use this statistic for our two-sample test.
28 10 28

29 10 A r r = 12 3 = 4 p-value.11
30 Supporting R packages treeclust (treeclustering) produces tree-based dissimilarities allows a number of user options AcrossTic (A cost-minimal regular spanning subgraph with Tree clustering) finds minimum weight regular spanning subgraphs and associated test statistic for two-sample problem ptest performs permutation test for p-values plot allows 2D view of spanning subgraph and MCC
31 Mean Cross Count test R
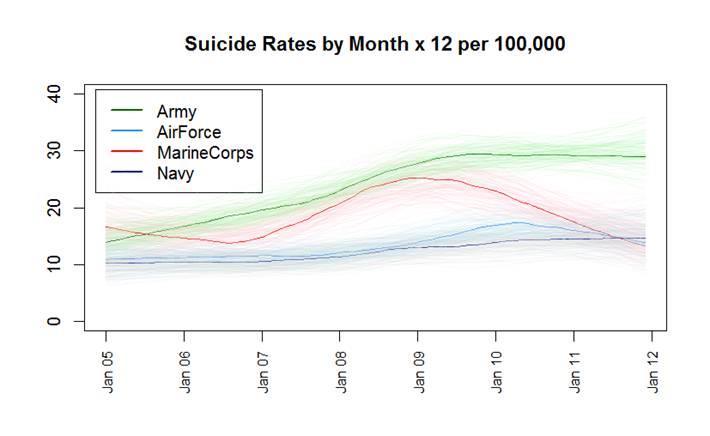
32 References Anglemyer, A., Miller, M., Buttrey, S., Whitaker, L. (2015), Suicide Rates and Methods in Active Duty Military Personnel, 2005 to 2011; A Cohort Study, Annals of Internal Medicine, 165(3). Blake, C. and Merz, C. (1998), UCI repository of machine learning databases, University of California, Irvine, Department of Information and Computer Sciences. Buttrey, S. and Whitaker, L. (2015), treeclust: An R Package for Tree- Based Clustering Dissimilarities, R Journal, 7(2). Friedman, J., Hastie, T., Tibshirani, R., The Elements of Statistical Learning: Data Mining, Inference, and Prediction, Springer Series in Statistics, Ruth, D. (2014), A New Multivariate Two-Sample Test Using Regular Minimum-Weight Spanning Subgraphs, Journal of Statistical Distributions and Applications, 1(1).
ECE521 week 3: 23/26 January 2017
 ECE521 week 3: 23/26 January 2017 Outline Probabilistic interpretation of linear regression - Maximum likelihood estimation (MLE) - Maximum a posteriori (MAP) estimation Bias-variance trade-off Linear
Diagnostics. Gad Kimmel
 Diagnostics Gad Kimmel Outline Introduction. Bootstrap method. Cross validation. ROC plot. Introduction Motivation Estimating properties of an estimator. Given data samples say the average. x 1, x 2,...,
Data Mining. 3.6 Regression Analysis. Fall Instructor: Dr. Masoud Yaghini. Numeric Prediction
 Data Mining 3.6 Regression Analysis Fall 2008 Instructor: Dr. Masoud Yaghini Outline Introduction Straight-Line Linear Regression Multiple Linear Regression Other Regression Models References Introduction
Bagging. Ryan Tibshirani Data Mining: / April Optional reading: ISL 8.2, ESL 8.7
 Bagging Ryan Tibshirani Data Mining: 36-462/36-662 April 23 2013 Optional reading: ISL 8.2, ESL 8.7 1 Reminder: classification trees Our task is to predict the class label y {1,... K} given a feature vector
Decision Trees. CS57300 Data Mining Fall Instructor: Bruno Ribeiro
 Decision Trees CS57300 Data Mining Fall 2016 Instructor: Bruno Ribeiro Goal } Classification without Models Well, partially without a model } Today: Decision Trees 2015 Bruno Ribeiro 2 3 Why Trees? } interpretable/intuitive,
Generalized Boosted Models: A guide to the gbm package
 Generalized Boosted Models: A guide to the gbm package Greg Ridgeway April 15, 2006 Boosting takes on various forms with different programs using different loss functions, different base models, and different
Experimental Design and Data Analysis for Biologists
 Experimental Design and Data Analysis for Biologists Gerry P. Quinn Monash University Michael J. Keough University of Melbourne CAMBRIDGE UNIVERSITY PRESS Contents Preface page xv I I Introduction 1 1.1
Influence measures for CART
 Jean-Michel Poggi Orsay, Paris Sud & Paris Descartes Joint work with Avner Bar-Hen Servane Gey (MAP5, Paris Descartes ) CART CART Classification And Regression Trees, Breiman et al. (1984) Learning set
Statistical aspects of prediction models with high-dimensional data
 Statistical aspects of prediction models with high-dimensional data Anne Laure Boulesteix Institut für Medizinische Informationsverarbeitung, Biometrie und Epidemiologie February 15th, 2017 Typeset by
Supplementary material for Intervention in prediction measure: a new approach to assessing variable importance for random forests
 Supplementary material for Intervention in prediction measure: a new approach to assessing variable importance for random forests Irene Epifanio Dept. Matemàtiques and IMAC Universitat Jaume I Castelló,
Data Mining. CS57300 Purdue University. Bruno Ribeiro. February 8, 2018
 Data Mining CS57300 Purdue University Bruno Ribeiro February 8, 2018 Decision trees Why Trees? interpretable/intuitive, popular in medical applications because they mimic the way a doctor thinks model
Chapter 17: Undirected Graphical Models
 Chapter 17: Undirected Graphical Models The Elements of Statistical Learning Biaobin Jiang Department of Biological Sciences Purdue University bjiang@purdue.edu October 30, 2014 Biaobin Jiang (Purdue)
Proteomics and Variable Selection
 Proteomics and Variable Selection p. 1/55 Proteomics and Variable Selection Alex Lewin With thanks to Paul Kirk for some graphs Department of Epidemiology and Biostatistics, School of Public Health, Imperial
Introduction to Machine Learning
 Introduction to Machine Learning Thomas G. Dietterich tgd@eecs.oregonstate.edu 1 Outline What is Machine Learning? Introduction to Supervised Learning: Linear Methods Overfitting, Regularization, and the
Machine Learning Recitation 8 Oct 21, Oznur Tastan
 Machine Learning 10601 Recitation 8 Oct 21, 2009 Oznur Tastan Outline Tree representation Brief information theory Learning decision trees Bagging Random forests Decision trees Non linear classifier Easy
Learning the Semantic Correlation: An Alternative Way to Gain from Unlabeled Text
 Learning the Semantic Correlation: An Alternative Way to Gain from Unlabeled Text Yi Zhang Machine Learning Department Carnegie Mellon University yizhang1@cs.cmu.edu Jeff Schneider The Robotics Institute
Data splitting. INSERM Workshop: Evaluation of predictive models: goodness-of-fit and predictive power #+TITLE:
 #+TITLE: Data splitting INSERM Workshop: Evaluation of predictive models: goodness-of-fit and predictive power #+AUTHOR: Thomas Alexander Gerds #+INSTITUTE: Department of Biostatistics, University of Copenhagen
Final Overview. Introduction to ML. Marek Petrik 4/25/2017
 Final Overview Introduction to ML Marek Petrik 4/25/2017 This Course: Introduction to Machine Learning Build a foundation for practice and research in ML Basic machine learning concepts: max likelihood,
A Bias Correction for the Minimum Error Rate in Cross-validation
 A Bias Correction for the Minimum Error Rate in Cross-validation Ryan J. Tibshirani Robert Tibshirani Abstract Tuning parameters in supervised learning problems are often estimated by cross-validation.
Statistical Consulting Topics Classification and Regression Trees (CART)
") Statistical Consulting Topics Classification and Regression Trees (CART) Suppose the main goal in a data analysis is the prediction of a categorical variable outcome. Such as in the examples below. Given
Statistical Consulting Topics Classification and Regression Trees (CART) Suppose the main goal in a data analysis is the prediction of a categorical variable outcome. Such as in the examples below. Given
Variable Selection and Sensitivity Analysis via Dynamic Trees with an application to Computer Code Performance Tuning
 Variable Selection and Sensitivity Analysis via Dynamic Trees with an application to Computer Code Performance Tuning Robert B. Gramacy University of Chicago Booth School of Business faculty.chicagobooth.edu/robert.gramacy
Analysis of Fast Input Selection: Application in Time Series Prediction
 Analysis of Fast Input Selection: Application in Time Series Prediction Jarkko Tikka, Amaury Lendasse, and Jaakko Hollmén Helsinki University of Technology, Laboratory of Computer and Information Science,
An Empirical Study of Building Compact Ensembles
 An Empirical Study of Building Compact Ensembles Huan Liu, Amit Mandvikar, and Jigar Mody Computer Science & Engineering Arizona State University Tempe, AZ 85281 {huan.liu,amitm,jigar.mody}@asu.edu Abstract.
The computationally optimal test set size in simulation studies on supervised learning
 Mathias Fuchs, Xiaoyu Jiang, Anne-Laure Boulesteix The computationally optimal test set size in simulation studies on supervised learning Technical Report Number 189, 2016 Department of Statistics University
Ensemble Methods for Machine Learning
 Ensemble Methods for Machine Learning COMBINING CLASSIFIERS: ENSEMBLE APPROACHES Common Ensemble classifiers Bagging/Random Forests Bucket of models Stacking Boosting Ensemble classifiers we ve studied
Question of the Day. Machine Learning 2D1431. Decision Tree for PlayTennis. Outline. Lecture 4: Decision Tree Learning
 Question of the Day Machine Learning 2D1431 How can you make the following equation true by drawing only one straight line? 5 + 5 + 5 = 550 Lecture 4: Decision Tree Learning Outline Decision Tree for PlayTennis
Decision Tree Learning
 Decision Tree Learning Goals for the lecture you should understand the following concepts the decision tree representation the standard top-down approach to learning a tree Occam s razor entropy and information
1 Handling of Continuous Attributes in C4.5. Algorithm
 .. Spring 2009 CSC 466: Knowledge Discovery from Data Alexander Dekhtyar.. Data Mining: Classification/Supervised Learning Potpourri Contents 1. C4.5. and continuous attributes: incorporating continuous
BAGGING PREDICTORS AND RANDOM FOREST
 BAGGING PREDICTORS AND RANDOM FOREST DANA KANER M.SC. SEMINAR IN STATISTICS, MAY 2017 BAGIGNG PREDICTORS / LEO BREIMAN, 1996 RANDOM FORESTS / LEO BREIMAN, 2001 THE ELEMENTS OF STATISTICAL LEARNING (CHAPTERS
Discrete Multivariate Statistics
 Discrete Multivariate Statistics Univariate Discrete Random variables Let X be a discrete random variable which, in this module, will be assumed to take a finite number of t different values which are
Reducing Multiclass to Binary: A Unifying Approach for Margin Classifiers
 Reducing Multiclass to Binary: A Unifying Approach for Margin Classifiers Erin Allwein, Robert Schapire and Yoram Singer Journal of Machine Learning Research, 1:113-141, 000 CSE 54: Seminar on Learning
Bayesian Patchworks: An Approach to Case-Based Reasoning
 Bayesian Patchworks: An Approach to Case-Based Reasoning Ramin Moghaddass, Cynthia Rudin Abstract Doctors often rely on their past experience in order to diagnose patients. For a doctor with enough experience,
PDEEC Machine Learning 2016/17
 PDEEC Machine Learning 2016/17 Lecture - Model assessment, selection and Ensemble Jaime S. Cardoso jaime.cardoso@inesctec.pt INESC TEC and Faculdade Engenharia, Universidade do Porto Nov. 07, 2017 1 /
Data Mining und Maschinelles Lernen
 Data Mining und Maschinelles Lernen Ensemble Methods Bias-Variance Trade-off Basic Idea of Ensembles Bagging Basic Algorithm Bagging with Costs Randomization Random Forests Boosting Stacking Error-Correcting
Inducing Polynomial Equations for Regression
 Inducing Polynomial Equations for Regression Ljupčo Todorovski, Peter Ljubič, and Sašo Džeroski Department of Knowledge Technologies, Jožef Stefan Institute Jamova 39, SI-1000 Ljubljana, Slovenia Ljupco.Todorovski@ijs.si
Empirical Risk Minimization, Model Selection, and Model Assessment
 Empirical Risk Minimization, Model Selection, and Model Assessment CS6780 Advanced Machine Learning Spring 2015 Thorsten Joachims Cornell University Reading: Murphy 5.7-5.7.2.4, 6.5-6.5.3.1 Dietterich,
Variance Reduction and Ensemble Methods
 Variance Reduction and Ensemble Methods Nicholas Ruozzi University of Texas at Dallas Based on the slides of Vibhav Gogate and David Sontag Last Time PAC learning Bias/variance tradeoff small hypothesis
Bootstrapping, Randomization, 2B-PLS
 Bootstrapping, Randomization, 2B-PLS Statistics, Tests, and Bootstrapping Statistic a measure that summarizes some feature of a set of data (e.g., mean, standard deviation, skew, coefficient of variation,
CS6375: Machine Learning Gautam Kunapuli. Decision Trees
 Gautam Kunapuli Example: Restaurant Recommendation Example: Develop a model to recommend restaurants to users depending on their past dining experiences. Here, the features are cost (x ) and the user s
MS-C1620 Statistical inference
 MS-C1620 Statistical inference 10 Linear regression III Joni Virta Department of Mathematics and Systems Analysis School of Science Aalto University Academic year 2018 2019 Period III - IV 1 / 32 Contents
SF2930 Regression Analysis
 SF2930 Regression Analysis Alexandre Chotard Tree-based regression and classication 20 February 2017 1 / 30 Idag Overview Regression trees Pruning Bagging, random forests 2 / 30 Today Overview Regression
Manual for a computer class in ML
 Manual for a computer class in ML November 3, 2015 Abstract This document describes a tour of Machine Learning (ML) techniques using tools in MATLAB. We point to the standard implementations, give example
Informal Definition: Telling things apart
 9. Decision Trees Informal Definition: Telling things apart 2 Nominal data No numeric feature vector Just a list or properties: Banana: longish, yellow Apple: round, medium sized, different colors like
Holdout and Cross-Validation Methods Overfitting Avoidance
 Holdout and Cross-Validation Methods Overfitting Avoidance Decision Trees Reduce error pruning Cost-complexity pruning Neural Networks Early stopping Adjusting Regularizers via Cross-Validation Nearest
STATISTICS 407 METHODS OF MULTIVARIATE ANALYSIS TOPICS
 STATISTICS 407 METHODS OF MULTIVARIATE ANALYSIS TOPICS Principal Component Analysis (PCA): Reduce the, summarize the sources of variation in the data, transform the data into a new data set where the variables
Data Mining Classification Trees (2)
") Data Mining Classification Trees (2) Ad Feelders Universiteit Utrecht September 14, 2017 Ad Feelders ( Universiteit Utrecht ) Data Mining September 14, 2017 1 / 46 Basic Tree Construction Algorithm Construct
Data Mining Classification Trees (2) Ad Feelders Universiteit Utrecht September 14, 2017 Ad Feelders ( Universiteit Utrecht ) Data Mining September 14, 2017 1 / 46 Basic Tree Construction Algorithm Construct
CS6220: DATA MINING TECHNIQUES
 CS6220: DATA MINING TECHNIQUES Matrix Data: Prediction Instructor: Yizhou Sun yzsun@ccs.neu.edu September 14, 2014 Today s Schedule Course Project Introduction Linear Regression Model Decision Tree 2 Methods
Decision Tree Learning
 Decision Tree Learning Goals for the lecture you should understand the following concepts the decision tree representation the standard top-down approach to learning a tree Occam s razor entropy and information
Advanced Techniques for Mining Structured Data: Process Mining
 Advanced Techniques for Mining Structured Data: Process Mining Frequent Pattern Discovery /Event Forecasting Dr A. Appice Scuola di Dottorato in Informatica e Matematica XXXII Problem definition 1. Given
Lossless Online Bayesian Bagging
 Lossless Online Bayesian Bagging Herbert K. H. Lee ISDS Duke University Box 90251 Durham, NC 27708 herbie@isds.duke.edu Merlise A. Clyde ISDS Duke University Box 90251 Durham, NC 27708 clyde@isds.duke.edu
Lecture 7: DecisionTrees
 Lecture 7: DecisionTrees What are decision trees? Brief interlude on information theory Decision tree construction Overfitting avoidance Regression trees COMP-652, Lecture 7 - September 28, 2009 1 Recall:
Prerequisite: STATS 7 or STATS 8 or AP90 or (STATS 120A and STATS 120B and STATS 120C). AP90 with a minimum score of 3
. AP90 with a minimum score of 3") University of California, Irvine 2017-2018 1 Statistics (STATS) Courses STATS 5. Seminar in Data Science. 1 Unit. An introduction to the field of Data Science; intended for entering freshman and transfers.
University of California, Irvine 2017-2018 1 Statistics (STATS) Courses STATS 5. Seminar in Data Science. 1 Unit. An introduction to the field of Data Science; intended for entering freshman and transfers.
Big Data Analysis with Apache Spark UC#BERKELEY
 Big Data Analysis with Apache Spark UC#BERKELEY This Lecture: Relation between Variables An association A trend» Positive association or Negative association A pattern» Could be any discernible shape»
Cross-Validation with Confidence
 Cross-Validation with Confidence Jing Lei Department of Statistics, Carnegie Mellon University WHOA-PSI Workshop, St Louis, 2017 Quotes from Day 1 and Day 2 Good model or pure model? Occam s razor We really
Supervised Learning! Algorithm Implementations! Inferring Rudimentary Rules and Decision Trees!
 Supervised Learning! Algorithm Implementations! Inferring Rudimentary Rules and Decision Trees! Summary! Input Knowledge representation! Preparing data for learning! Input: Concept, Instances, Attributes"
Regression tree methods for subgroup identification I
 Regression tree methods for subgroup identification I Xu He Academy of Mathematics and Systems Science, Chinese Academy of Sciences March 25, 2014 Xu He (AMSS, CAS) March 25, 2014 1 / 34 Outline The problem
CS 484 Data Mining. Classification 7. Some slides are from Professor Padhraic Smyth at UC Irvine
 CS 484 Data Mining Classification 7 Some slides are from Professor Padhraic Smyth at UC Irvine Bayesian Belief networks Conditional independence assumption of Naïve Bayes classifier is too strong. Allows
Stability-Based Model Selection
 Stability-Based Model Selection Tilman Lange, Mikio L. Braun, Volker Roth, Joachim M. Buhmann (lange,braunm,roth,jb)@cs.uni-bonn.de Institute of Computer Science, Dept. III, University of Bonn Römerstraße
Ensemble Methods. Charles Sutton Data Mining and Exploration Spring Friday, 27 January 12
 Ensemble Methods Charles Sutton Data Mining and Exploration Spring 2012 Bias and Variance Consider a regression problem Y = f(x)+ N(0, 2 ) With an estimate regression function ˆf, e.g., ˆf(x) =w > x Suppose
Generalization Error on Pruning Decision Trees
 Generalization Error on Pruning Decision Trees Ryan R. Rosario Computer Science 269 Fall 2010 A decision tree is a predictive model that can be used for either classification or regression [3]. Decision
Classification 1: Linear regression of indicators, linear discriminant analysis
 Classification 1: Linear regression of indicators, linear discriminant analysis Ryan Tibshirani Data Mining: 36-462/36-662 April 2 2013 Optional reading: ISL 4.1, 4.2, 4.4, ESL 4.1 4.3 1 Classification
Data Mining Classification: Basic Concepts and Techniques. Lecture Notes for Chapter 3. Introduction to Data Mining, 2nd Edition
 Data Mining Classification: Basic Concepts and Techniques Lecture Notes for Chapter 3 by Tan, Steinbach, Karpatne, Kumar 1 Classification: Definition Given a collection of records (training set ) Each
Probabilistic Random Forests: Predicting Data Point Specific Misclassification Probabilities ; CU- CS
 University of Colorado, Boulder CU Scholar Computer Science Technical Reports Computer Science Spring 5-1-23 Probabilistic Random Forests: Predicting Data Point Specific Misclassification Probabilities
Sleep data, two drugs Ch13.xls
 Model Based Statistics in Biology. Part IV. The General Linear Mixed Model.. Chapter 13.3 Fixed*Random Effects (Paired t-test) ReCap. Part I (Chapters 1,2,3,4), Part II (Ch 5, 6, 7) ReCap Part III (Ch
Gaussian Process Vine Copulas for Multivariate Dependence
 Gaussian Process Vine Copulas for Multivariate Dependence José Miguel Hernández-Lobato 1,2 joint work with David López-Paz 2,3 and Zoubin Ghahramani 1 1 Department of Engineering, Cambridge University,
CLUe Training An Introduction to Machine Learning in R with an example from handwritten digit recognition
 CLUe Training An Introduction to Machine Learning in R with an example from handwritten digit recognition Ad Feelders Universiteit Utrecht Department of Information and Computing Sciences Algorithmic Data
Advanced Statistical Methods: Beyond Linear Regression
 Advanced Statistical Methods: Beyond Linear Regression John R. Stevens Utah State University Notes 3. Statistical Methods II Mathematics Educators Worshop 28 March 2009 1 http://www.stat.usu.edu/~jrstevens/pcmi
UVA CS 4501: Machine Learning
 UVA CS 4501: Machine Learning Lecture 21: Decision Tree / Random Forest / Ensemble Dr. Yanjun Qi University of Virginia Department of Computer Science Where are we? è Five major sections of this course
Machine learning - HT Basis Expansion, Regularization, Validation
 Machine learning - HT 016 4. Basis Expansion, Regularization, Validation Varun Kanade University of Oxford Feburary 03, 016 Outline Introduce basis function to go beyond linear regression Understanding
Lars Schmidt-Thieme, Information Systems and Machine Learning Lab (ISMLL), University of Hildesheim, Germany
, University of Hildesheim, Germany") Syllabus Fri. 21.10. (1) 0. Introduction A. Supervised Learning: Linear Models & Fundamentals Fri. 27.10. (2) A.1 Linear Regression Fri. 3.11. (3) A.2 Linear Classification Fri. 10.11. (4) A.3 Regularization
Syllabus Fri. 21.10. (1) 0. Introduction A. Supervised Learning: Linear Models & Fundamentals Fri. 27.10. (2) A.1 Linear Regression Fri. 3.11. (3) A.2 Linear Classification Fri. 10.11. (4) A.3 Regularization
Optimal Kernel Shapes for Local Linear Regression
 Optimal Kernel Shapes for Local Linear Regression Dirk Ormoneit Trevor Hastie Department of Statistics Stanford University Stanford, CA 94305-4065 ormoneit@stat.stanjord.edu Abstract Local linear regression
Statistics and learning: Big Data
 Statistics and learning: Big Data Learning Decision Trees and an Introduction to Boosting Sébastien Gadat Toulouse School of Economics February 2017 S. Gadat (TSE) SAD 2013 1 / 30 Keywords Decision trees
Multivariate statistical methods and data mining in particle physics
 Multivariate statistical methods and data mining in particle physics RHUL Physics www.pp.rhul.ac.uk/~cowan Academic Training Lectures CERN 16 19 June, 2008 1 Outline Statement of the problem Some general
Machine Learning. Ensemble Methods. Manfred Huber
 Machine Learning Ensemble Methods Manfred Huber 2015 1 Bias, Variance, Noise Classification errors have different sources Choice of hypothesis space and algorithm Training set Noise in the data The expected
On Multi-Class Cost-Sensitive Learning
 On Multi-Class Cost-Sensitive Learning Zhi-Hua Zhou and Xu-Ying Liu National Laboratory for Novel Software Technology Nanjing University, Nanjing 210093, China {zhouzh, liuxy}@lamda.nju.edu.cn Abstract
Distribution-Free Distribution Regression
 Distribution-Free Distribution Regression Barnabás Póczos, Alessandro Rinaldo, Aarti Singh and Larry Wasserman AISTATS 2013 Presented by Esther Salazar Duke University February 28, 2014 E. Salazar (Reading
Bayesian Patchworks: An Approach to Case-Based Reasoning
 Bayesian Patchworks: An Approach to Case-Based Reasoning Ramin Moghaddass, Cynthia Rudin Abstract arxiv:1809.03541v1 [cs.ai] 10 Sep 2018 Doctors often rely on their past experience in order to diagnose
Performance Evaluation and Comparison
 Outline Hong Chang Institute of Computing Technology, Chinese Academy of Sciences Machine Learning Methods (Fall 2012) Outline Outline I 1 Introduction 2 Cross Validation and Resampling 3 Interval Estimation
Bootstrap & Confidence/Prediction intervals
 Bootstrap & Confidence/Prediction intervals Olivier Roustant Mines Saint-Étienne 2017/11 Olivier Roustant (EMSE) Bootstrap & Confidence/Prediction intervals 2017/11 1 / 9 Framework Consider a model with
Describing Contingency tables
 Today s topics: Describing Contingency tables 1. Probability structure for contingency tables (distributions, sensitivity/specificity, sampling schemes). 2. Comparing two proportions (relative risk, odds
CS 540: Machine Learning Lecture 1: Introduction
 CS 540: Machine Learning Lecture 1: Introduction AD January 2008 AD () January 2008 1 / 41 Acknowledgments Thanks to Nando de Freitas Kevin Murphy AD () January 2008 2 / 41 Administrivia & Announcement
Universität Potsdam Institut für Informatik Lehrstuhl Maschinelles Lernen. Decision Trees. Tobias Scheffer
 Universität Potsdam Institut für Informatik Lehrstuhl Maschinelles Lernen Decision Trees Tobias Scheffer Decision Trees One of many applications: credit risk Employed longer than 3 months Positive credit
CSE 417T: Introduction to Machine Learning. Final Review. Henry Chai 12/4/18
 CSE 417T: Introduction to Machine Learning Final Review Henry Chai 12/4/18 Overfitting Overfitting is fitting the training data more than is warranted Fitting noise rather than signal 2 Estimating! "#$
Making Our Cities Safer: A Study In Neighbhorhood Crime Patterns
 Making Our Cities Safer: A Study In Neighbhorhood Crime Patterns Aly Kane alykane@stanford.edu Ariel Sagalovsky asagalov@stanford.edu Abstract Equipped with an understanding of the factors that influence
EXAM IN STATISTICAL MACHINE LEARNING STATISTISK MASKININLÄRNING
 EXAM IN STATISTICAL MACHINE LEARNING STATISTISK MASKININLÄRNING DATE AND TIME: June 9, 2018, 09.00 14.00 RESPONSIBLE TEACHER: Andreas Svensson NUMBER OF PROBLEMS: 5 AIDING MATERIAL: Calculator, mathematical
Machine Learning, Fall 2009: Midterm
 10-601 Machine Learning, Fall 009: Midterm Monday, November nd hours 1. Personal info: Name: Andrew account: E-mail address:. You are permitted two pages of notes and a calculator. Please turn off all
Classification using stochastic ensembles
 July 31, 2014 Topics Introduction Topics Classification Application and classfication Classification and Regression Trees Stochastic ensemble methods Our application: USAID Poverty Assessment Tools Topics
18.312: Algebraic Combinatorics Lionel Levine. Lecture 19
 832: Algebraic Combinatorics Lionel Levine Lecture date: April 2, 20 Lecture 9 Notes by: David Witmer Matrix-Tree Theorem Undirected Graphs Let G = (V, E) be a connected, undirected graph with n vertices,
1 Handling of Continuous Attributes in C4.5. Algorithm
 .. Spring 2009 CSC 466: Knowledge Discovery from Data Alexander Dekhtyar.. Data Mining: Classification/Supervised Learning Potpourri Contents 1. C4.5. and continuous attributes: incorporating continuous
Supporting Statistical Hypothesis Testing Over Graphs
 Supporting Statistical Hypothesis Testing Over Graphs Jennifer Neville Departments of Computer Science and Statistics Purdue University (joint work with Tina Eliassi-Rad, Brian Gallagher, Sergey Kirshner,
Ensemble Methods: Jay Hyer
 Ensemble Methods: committee-based learning Jay Hyer linkedin.com/in/jayhyer @adatahead Overview Why Ensemble Learning? What is learning? How is ensemble learning different? Boosting Weak and Strong Learners
Ronald Christensen. University of New Mexico. Albuquerque, New Mexico. Wesley Johnson. University of California, Irvine. Irvine, California
 Texts in Statistical Science Bayesian Ideas and Data Analysis An Introduction for Scientists and Statisticians Ronald Christensen University of New Mexico Albuquerque, New Mexico Wesley Johnson University
Sparse representation classification and positive L1 minimization
 Sparse representation classification and positive L1 minimization Cencheng Shen Joint Work with Li Chen, Carey E. Priebe Applied Mathematics and Statistics Johns Hopkins University, August 5, 2014 Cencheng
Machine Learning 2nd Edi7on
 Lecture Slides for INTRODUCTION TO Machine Learning 2nd Edi7on CHAPTER 9: Decision Trees ETHEM ALPAYDIN The MIT Press, 2010 Edited and expanded for CS 4641 by Chris Simpkins alpaydin@boun.edu.tr h1p://www.cmpe.boun.edu.tr/~ethem/i2ml2e
Structured Statistical Learning with Support Vector Machine for Feature Selection and Prediction
 Structured Statistical Learning with Support Vector Machine for Feature Selection and Prediction Yoonkyung Lee Department of Statistics The Ohio State University http://www.stat.ohio-state.edu/ yklee Predictive
Cross-Validation with Confidence
 Cross-Validation with Confidence Jing Lei Department of Statistics, Carnegie Mellon University UMN Statistics Seminar, Mar 30, 2017 Overview Parameter est. Model selection Point est. MLE, M-est.,... Cross-validation
Generative classifiers: The Gaussian classifier. Ata Kaban School of Computer Science University of Birmingham
 Generative classifiers: The Gaussian classifier Ata Kaban School of Computer Science University of Birmingham Outline We have already seen how Bayes rule can be turned into a classifier In all our examples
A Course in Applied Econometrics Lecture 7: Cluster Sampling. Jeff Wooldridge IRP Lectures, UW Madison, August 2008
 A Course in Applied Econometrics Lecture 7: Cluster Sampling Jeff Wooldridge IRP Lectures, UW Madison, August 2008 1. The Linear Model with Cluster Effects 2. Estimation with a Small Number of roups and
Machine Learning, Midterm Exam: Spring 2008 SOLUTIONS. Q Topic Max. Score Score. 1 Short answer questions 20.
 10-601 Machine Learning, Midterm Exam: Spring 2008 Please put your name on this cover sheet If you need more room to work out your answer to a question, use the back of the page and clearly mark on the
Data Mining: Concepts and Techniques. (3 rd ed.) Chapter 8. Chapter 8. Classification: Basic Concepts
 Chapter 8. Chapter 8. Classification: Basic Concepts") Data Mining: Concepts and Techniques (3 rd ed.) Chapter 8 1 Chapter 8. Classification: Basic Concepts Classification: Basic Concepts Decision Tree Induction Bayes Classification Methods Rule-Based Classification
Data Mining: Concepts and Techniques (3 rd ed.) Chapter 8 1 Chapter 8. Classification: Basic Concepts Classification: Basic Concepts Decision Tree Induction Bayes Classification Methods Rule-Based Classification