Genesis Hospital. Surgery Simulation. Curtis Theel, MBA, CSSBB, PMP 2016 ASQ Columbus Spring Conference March 7 th, 2016
|
|
|
- Jade Fox
- 5 years ago
- Views:
Transcription


1 Genesis Hospital Surgery Simulation Curtis Theel, MBA, CSSBB, PMP 2016 ASQ Columbus Spring Conference March 7 th, 2016
2 Background information In 2011, Genesis Healthcare System decided to combine 2 separate Hospitals, Good Samaritan and Bethesda The Besthesda Hospital would be renovated and a new 3-story Tower would be added on to it Construction would take place from The 3-story tour would primary house the Emergency Department, Surgical Services, and a Critical Care Unit (CCU) The Problem: How do we determine how large to build our Surgical Suite?
3 GS OR Rooms Current Configuration BH OR Rooms Total OR suites GS = 8 BH = 6 Combined = 14
4 Total OR suites GS = 8 BH = 6 Combined = 14 With zero analysis, administration would default to build 14 OR rooms. Was this the correct decision?
5 GS OR Rooms Current Configuration BH OR Rooms Rm 1: 685 Rm 2: 276 Rm 3: 1089 Rm 1: 309 Rm 2: 513 Rm 3: 481 Rm 4: 1297 Rm 5: 783 Rm 6: 401 Rm 4: 393 Rm 5: 3 Rm 6: 21 Rm 7: 470 Rm 8: 291
6 GS OR Rooms Current Configuration BH OR Rooms Rm 1: 685 X Rm 2: 276 Rm 3: 1089 Rm 1: 309 Rm 2: 513 Rm 3: 481 Rm 4: 1297 Rm 5: 783 Rm 6: 401 Rm 4: 393 X X Rm 5: Rm 6: 3 21 Rm 7: 470 X Rm 8: rooms at BH never used 2 rooms as GS used less than 25% of normal use Rooms currently used = 10 rooms

7 Basic analysis indicated we only use 10 rooms. Is this the correct amount of rooms to build? 2 key questions: How do we validate this? How do we plan for the future? The answer: SIMULATION
8 Model Configuration 3 important steps to developing a simulation model Arrival Patterns Process flow Process times The rest is mechanical and data analysis
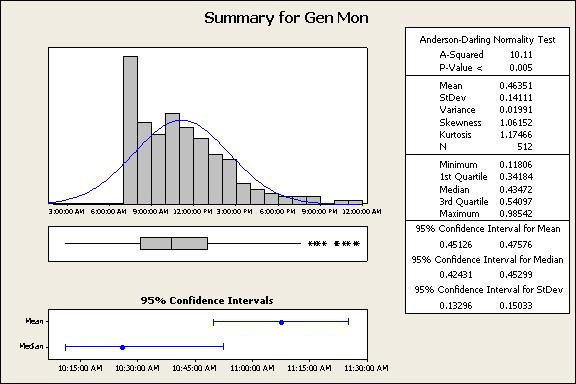
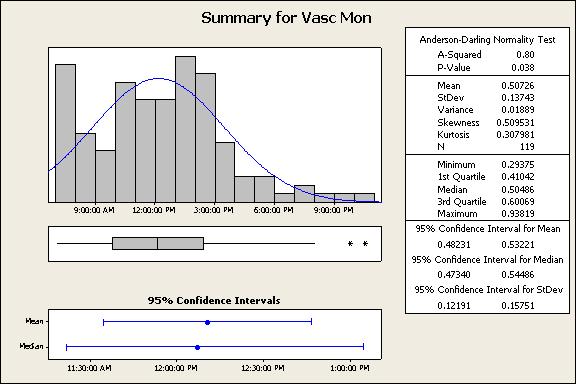
9 Model Configuration For arrival patterns and process times: Included complete OR data; separated service lines General Surgery Orthopedics Urology Neurosurgery CVOR Vascular Included complete Cath and EP Lab data; separated by type Cath Lab EP Lab Why differentiate between specialties?

10 Model Configuration *12 Operating Rooms *3 Cath Rooms *1 EP Room Note: For this model, the Hybrid OR was considered a normal-use OR

11 Arrival Distributions

12 Arrival Distributions First Method Arrival distribution by Specialty by Day
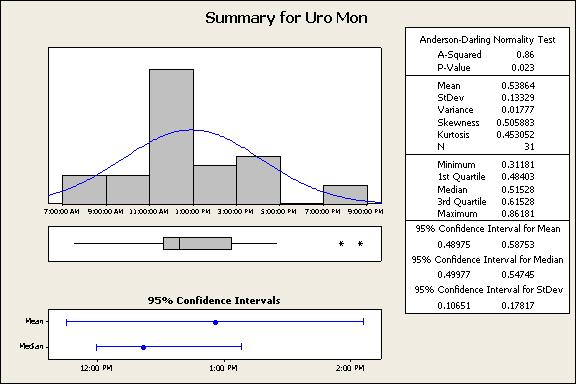
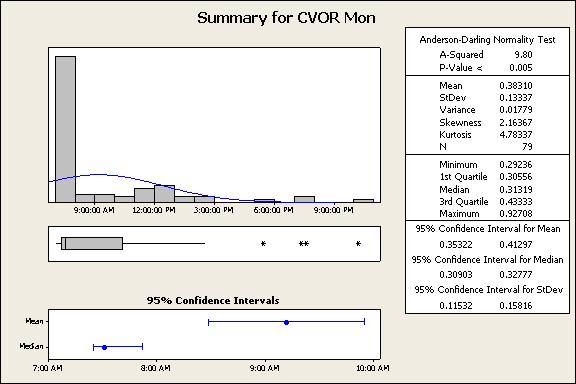
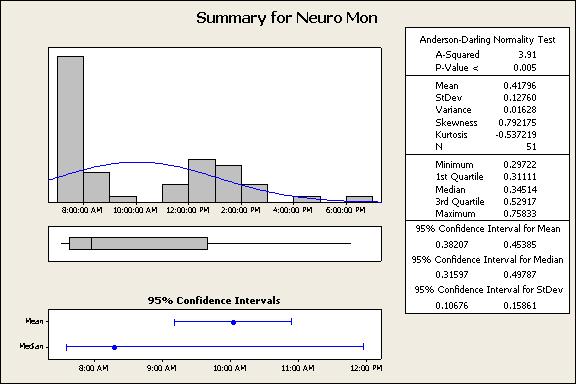
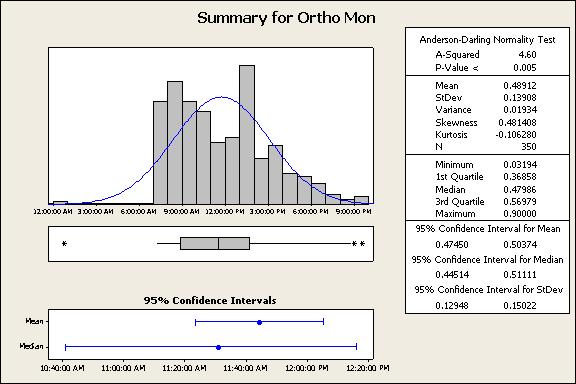
13 Arrival Distributions First Method Arrival distribution by Specialty by Day
14 Arrival Distributions Second Method Service Line Day Hour Neuro Monday % 0.00% 0.00% 0.00% 0.00% 0.00% 0.00% 0.00% 0.00% 0.00% Neuro % 0.00% 0.00% 0.00% 0.00% 0.00% 0.00% 0.00% 0.00% 0.00% Neuro % 0.00% 0.00% 0.00% 0.00% 0.00% 0.00% 0.00% 0.00% 0.00% Neuro % 0.00% 0.00% 0.00% 0.00% 0.00% 0.00% 0.00% 0.00% 0.00% Neuro % 0.00% 0.00% 0.00% 0.00% 0.00% 0.00% 0.00% 0.00% 0.00% Neuro % 0.00% 0.00% 0.00% 0.00% 0.00% 0.00% 0.00% 0.00% 0.00% Neuro % 0.00% 0.00% 0.00% 0.00% 0.00% 0.00% 0.00% 0.00% 0.00% Neuro % 27.59% 6.90% 0.00% 0.00% 0.00% 0.00% 0.00% 0.00% 0.00% Neuro % 8.62% 0.00% 0.00% 0.00% 0.00% 0.00% 0.00% 0.00% 0.00% Neuro % 1.72% 0.00% 0.00% 0.00% 0.00% 0.00% 0.00% 0.00% 0.00% Neuro % 0.00% 0.00% 0.00% 0.00% 0.00% 0.00% 0.00% 0.00% 0.00% Neuro % 5.17% 0.00% 0.00% 0.00% 0.00% 0.00% 0.00% 0.00% 0.00% Neuro % 8.62% 1.72% 0.00% 0.00% 0.00% 0.00% 0.00% 0.00% 0.00% Neuro % 10.34% 0.00% 0.00% 0.00% 0.00% 0.00% 0.00% 0.00% 0.00% Neuro % 5.17% 0.00% 0.00% 0.00% 0.00% 0.00% 0.00% 0.00% 0.00% Neuro % 0.00% 0.00% 0.00% 0.00% 0.00% 0.00% 0.00% 0.00% 0.00% Neuro % 1.72% 0.00% 0.00% 0.00% 0.00% 0.00% 0.00% 0.00% 0.00% Neuro % 0.00% 0.00% 0.00% 0.00% 0.00% 0.00% 0.00% 0.00% 0.00% Neuro % 1.72% 0.00% 0.00% 0.00% 0.00% 0.00% 0.00% 0.00% 0.00% Neuro % 0.00% 0.00% 0.00% 0.00% 0.00% 0.00% 0.00% 0.00% 0.00% Neuro % 0.00% 0.00% 0.00% 0.00% 0.00% 0.00% 0.00% 0.00% 0.00% Neuro % 0.00% 0.00% 0.00% 0.00% 0.00% 0.00% 0.00% 0.00% 0.00% Neuro % 0.00% 0.00% 0.00% 0.00% 0.00% 0.00% 0.00% 0.00% 0.00% Neuro % 0.00% 0.00% 0.00% 0.00% 0.00% 0.00% 0.00% 0.00% 0.00% # of arrivals
15 Arrival Distributions Second Method Service Line Day Hour General Tuesday % 1.75% 0.00% 0.00% 0.00% 0.00% 0.00% 0.00% 0.00% 0.00% General % 3.51% 0.00% 0.00% 0.00% 0.00% 0.00% 0.00% 0.00% 0.00% General % 0.00% 0.00% 0.00% 0.00% 0.00% 0.00% 0.00% 0.00% 0.00% General % 0.00% 0.00% 0.00% 0.00% 0.00% 0.00% 0.00% 0.00% 0.00% General % 0.00% 0.00% 0.00% 0.00% 0.00% 0.00% 0.00% 0.00% 0.00% General % 3.51% 0.00% 0.00% 0.00% 0.00% 0.00% 0.00% 0.00% 0.00% General % 1.75% 0.00% 0.00% 0.00% 0.00% 0.00% 0.00% 0.00% 0.00% General % 42.11% 22.81% 15.79% 1.75% 0.00% 0.00% 0.00% 0.00% 0.00% General % 45.61% 33.33% 5.26% 3.51% 0.00% 0.00% 0.00% 0.00% 0.00% General % 45.61% 15.79% 8.77% 0.00% 0.00% 0.00% 0.00% 0.00% 0.00% General % 42.11% 26.32% 3.51% 0.00% 0.00% 0.00% 0.00% 0.00% 0.00% General % 45.61% 28.07% 8.77% 0.00% 0.00% 0.00% 0.00% 0.00% 0.00% General % 35.09% 31.58% 21.05% 0.00% 0.00% 0.00% 0.00% 0.00% 0.00% General % 26.32% 33.33% 21.05% 1.75% 1.75% 0.00% 0.00% 0.00% 0.00% General % 47.37% 15.79% 5.26% 0.00% 0.00% 0.00% 0.00% 0.00% 0.00% General % 33.33% 8.77% 0.00% 0.00% 0.00% 0.00% 0.00% 0.00% 0.00% General % 33.33% 8.77% 0.00% 0.00% 0.00% 0.00% 0.00% 0.00% 0.00% General % 29.82% 0.00% 0.00% 0.00% 0.00% 0.00% 0.00% 0.00% 0.00% General % 19.30% 0.00% 0.00% 0.00% 0.00% 0.00% 0.00% 0.00% 0.00% General % 10.53% 0.00% 0.00% 0.00% 0.00% 0.00% 0.00% 0.00% 0.00% General % 10.53% 0.00% 0.00% 0.00% 0.00% 0.00% 0.00% 0.00% 0.00% General % 8.77% 0.00% 0.00% 0.00% 0.00% 0.00% 0.00% 0.00% 0.00% General % 1.75% 0.00% 0.00% 0.00% 0.00% 0.00% 0.00% 0.00% 0.00% General % 3.51% 0.00% 0.00% 0.00% 0.00% 0.00% 0.00% 0.00% 0.00% # of arrivals

16 Arrival pattern (all service lines) validation: Actual vs Flexsim output Mann-Whitney Test and CI: Actual Arrivals, Flexsim Arrivals Since the p-value is not less than N Median the chosen a level of 0.05, Actual you Arrivals conclude that there is insufficient Flexsim Arrivals evidence to reject H0. Therefore, the data does not support the Point estimate for ETA1-ETA2 is hypothesis that there is a difference 95.0 Percent CI for ETA1-ETA2 is ( , ) between the population medians. W = Test of ETA1 = ETA2 vs ETA1 not = ETA2 is significant at The test is significant at (adjusted for ties)

17 Arrival pattern (individual service lines) validation: Actual vs Flexsim output Mann-Whitney Test and CI: Ortho Wed Flexsim, Ortho Actual Since the p-value is not less than N Median the chosen a level of 0.05, Ortho you Wed Flexsim conclude that there is insufficient Ortho Actual evidence to reject H0. Therefore, the data does not support the Point estimate for ETA1-ETA2 is hypothesis that there is a difference 95.0 Percent CI for ETA1-ETA2 is (-1.000,1.000) between the population medians. W = Test of ETA1 = ETA2 vs ETA1 not = ETA2 is significant at The test is significant at (adjusted for ties)

 W = 284230.0 Test of ETA1 = ETA2 vs ETA1 not = ETA2 is significant at 0.9944 The test is significant at 0.")
18 Process Times (individual service lines) validation: Actual vs Flexsim output Mann-Whitney Test and CI: Flexsim Gen 3, Actual Gen 3 Since the p-value is not less than N Median the chosen a level of 0.05, Flexsim you Gen conclude that there is insufficient Actual Gen evidence to reject H0. Therefore, the data does not support the hypothesis that there is a difference Point estimate for ETA1-ETA2 is between the population medians Percent CI for ETA1-ETA2 is (-6.47,6.44) W = Test of ETA1 = ETA2 vs ETA1 not = ETA2 is significant at The test is significant at (adjusted for ties)
19 *Video clip of simulation*
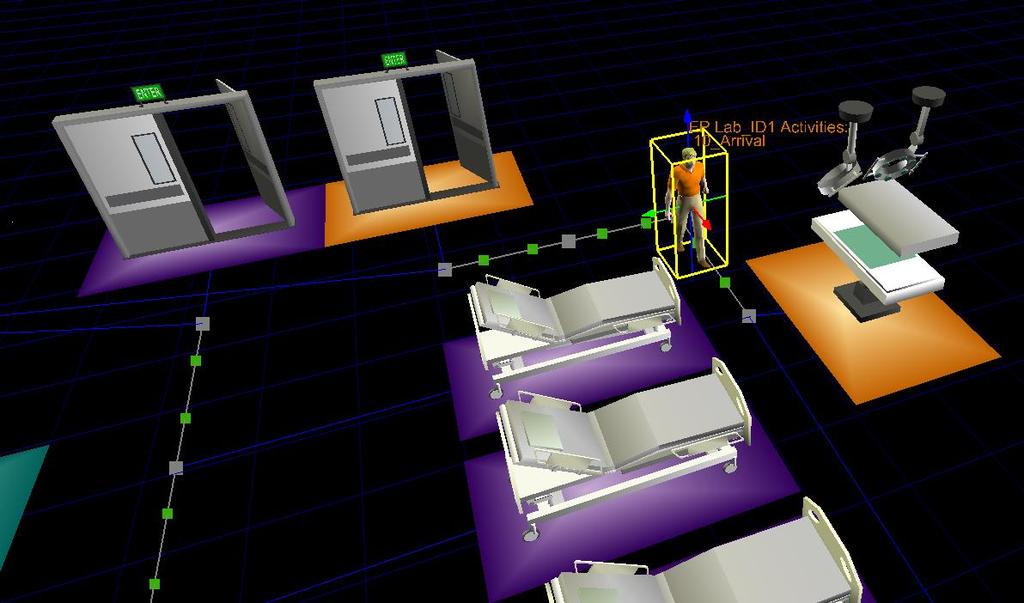
20
21 The Output Replication Number Bed4 Bed5 Bed6 Bed7 Bed8 Bed9 Bed10 Bed11 Bed12 Bed13 Bed14 Bed15 Max Occupied Data= Monday 100
22 OR Monday Percent rooms are concurrently occupied Example: 9 beds are used concurrently for 5% of the day 12.5% = 1 hr 7:30a 3:30p
23 OR Tuesday Percent rooms are concurrently occupied Example: 9 beds are used concurrently for 12% of the day 12.5% = 1 hr 7:30a 3:30p

24 OR Wednesday Percent rooms are concurrently occupied Example: 9 beds are used concurrently for 15% of the day 12.5% = 1 hr 7:30a 3:30p
25 OR Thursday Percent rooms are concurrently occupied Example: 9 beds are used concurrently for 20% of the day 12.5% = 1 hr 7:30a 3:30p
26 OR Friday Percent rooms are concurrently occupied Example: 9 beds are used concurrently for 7% of the day 12.5% = 1 hr 7:30a 3:30p
27 OR Average Day (average of mon-fri usage patterns) =22.7 Percent rooms are concurrently occupied Example: 9 beds are used concurrently for 12% of the day 12.5% = 1 hr 7:30a 3:30p Note: Does include turnover time

28 Simulated OR utilization data by day of week 7:30a 3:30p Note: Does not include turnover time
29 Utilizing simulation for Scenario Analysis

30 10 OR s test Thursday 100 replications
31 OR Average Day (average of mon-fri usage patterns) CONVERTED to projected volumes; rooms removed = Percent rooms are concurrently occupied 93% 69% 43% 23% Add 4.4% volume added to each room Reduce to 9 OR s
32 OR Utilization by volume growth 10% growth Service Line Day Hr Service Line Day Hr General Monday % 0.00% 0.00% 0.00% 0.00% 0.00% 0.00% 0.00% 0.00% 0.00% General Monday % 0.00% 0.00% 0.00% 0.00% 0.00% 0.00% 0.00% 0.00% 0.00% General % 0.00% 0.00% 0.00% 0.00% 0.00% 0.00% 0.00% 0.00% 0.00% General % 0.00% 0.00% 0.00% 0.00% 0.00% 0.00% 0.00% 0.00% 0.00% General % 1.72% 0.00% 0.00% 0.00% 0.00% 0.00% 0.00% 0.00% 0.00% General % 1.90% 0.00% 0.00% 0.00% 0.00% 0.00% 0.00% 0.00% 0.00% General % 0.00% 0.00% 0.00% 0.00% 0.00% 0.00% 0.00% 0.00% 0.00% General % 0.00% 0.00% 0.00% 0.00% 0.00% 0.00% 0.00% 0.00% 0.00% General % 0.00% 0.00% 0.00% 0.00% 0.00% 0.00% 0.00% 0.00% 0.00% General % 0.00% 0.00% 0.00% 0.00% 0.00% 0.00% 0.00% 0.00% 0.00% General % 1.72% 0.00% 0.00% 0.00% 0.00% 0.00% 0.00% 0.00% 0.00% General % 1.90% 0.00% 0.00% 0.00% 0.00% 0.00% 0.00% 0.00% 0.00% General % 1.72% 0.00% 0.00% 0.00% 0.00% 0.00% 0.00% 0.00% 0.00% General % 1.90% 0.00% 0.00% 0.00% 0.00% 0.00% 0.00% 0.00% 0.00% General % 18.97% 41.38% 15.52% 8.62% 0.00% 0.00% 0.00% 0.00% 0.00% General % 20.86% 45.52% 17.07% 9.48% 0.00% 0.00% 0.00% 0.00% 0.00% General % 39.66% 15.52% 10.34% 0.00% 0.00% 0.00% 0.00% 0.00% 0.00% General % 43.62% 17.07% 11.38% 0.00% 0.00% 0.00% 0.00% 0.00% 0.00% General % 41.38% 22.41% 0.00% 0.00% 0.00% 0.00% 0.00% 0.00% 0.00% General % 45.52% 24.66% 0.00% 0.00% 0.00% 0.00% 0.00% 0.00% 0.00% General % 39.66% 20.69% 10.34% 0.00% 0.00% 0.00% 0.00% 0.00% 0.00% General % 43.62% 22.76% 11.38% 0.00% 0.00% 0.00% 0.00% 0.00% 0.00% General % 46.55% 24.14% 0.00% 0.00% 0.00% 0.00% 0.00% 0.00% 0.00% General % 51.21% 26.55% 0.00% 0.00% 0.00% 0.00% 0.00% 0.00% 0.00% General % 50.00% 15.52% 0.00% 0.00% 0.00% 0.00% 0.00% 0.00% 0.00% General % 55.00% 17.07% 0.00% 0.00% 0.00% 0.00% 0.00% 0.00% 0.00% General % 37.93% 6.90% 3.45% 0.00% 0.00% 0.00% 0.00% 0.00% 0.00% General % 41.72% 7.59% 3.79% 0.00% 0.00% 0.00% 0.00% 0.00% 0.00% General % 27.59% 10.34% 0.00% 1.72% 0.00% 0.00% 0.00% 0.00% 0.00% General % 30.34% 11.38% 0.00% 1.90% 0.00% 0.00% 0.00% 0.00% 0.00% General % 22.41% 1.72% 0.00% 0.00% 0.00% 0.00% 0.00% 0.00% 0.00% General % 24.66% 1.90% 0.00% 0.00% 0.00% 0.00% 0.00% 0.00% 0.00% General % 15.52% 1.72% 0.00% 0.00% 0.00% 0.00% 0.00% 0.00% 0.00% General % 17.07% 1.90% 0.00% 0.00% 0.00% 0.00% 0.00% 0.00% 0.00% General % 13.79% 0.00% 0.00% 0.00% 0.00% 0.00% 0.00% 0.00% 0.00% General % 15.17% 0.00% 0.00% 0.00% 0.00% 0.00% 0.00% 0.00% 0.00% General % 10.34% 0.00% 0.00% 0.00% 0.00% 0.00% 0.00% 0.00% 0.00% General % 11.38% 0.00% 0.00% 0.00% 0.00% 0.00% 0.00% 0.00% 0.00% General % 10.34% 0.00% 0.00% 0.00% 0.00% 0.00% 0.00% 0.00% 0.00% General % 11.38% 0.00% 0.00% 0.00% 0.00% 0.00% 0.00% 0.00% 0.00% General % 10.34% 0.00% 0.00% 0.00% 0.00% 0.00% 0.00% 0.00% 0.00% General % 11.38% 0.00% 0.00% 0.00% 0.00% 0.00% 0.00% 0.00% 0.00% General % 1.72% 0.00% 0.00% 0.00% 0.00% 0.00% 0.00% 0.00% 0.00% General % 1.90% 0.00% 0.00% 0.00% 0.00% 0.00% 0.00% 0.00% 0.00% General % 5.17% 0.00% 0.00% 0.00% 0.00% 0.00% 0.00% 0.00% 0.00% General % 5.69% 0.00% 0.00% 0.00% 0.00% 0.00% 0.00% 0.00% 0.00% General % 5.17% 0.00% 0.00% 0.00% 0.00% 0.00% 0.00% 0.00% 0.00% General % 5.69% 0.00% 0.00% 0.00% 0.00% 0.00% 0.00% 0.00% 0.00% General Tuesday % 1.75% 0.00% 0.00% 0.00% 0.00% 0.00% 0.00% 0.00% 0.00% General Tuesday % 1.93% 0.00% 0.00% 0.00% 0.00% 0.00% 0.00% 0.00% 0.00% General % 3.51% 0.00% 0.00% 0.00% 0.00% 0.00% 0.00% 0.00% 0.00% General % 3.86% 0.00% 0.00% 0.00% 0.00% 0.00% 0.00% 0.00% 0.00% General % 0.00% 0.00% 0.00% 0.00% 0.00% 0.00% 0.00% 0.00% 0.00% General % 0.00% 0.00% 0.00% 0.00% 0.00% 0.00% 0.00% 0.00% 0.00% General % 0.00% 0.00% 0.00% 0.00% 0.00% 0.00% 0.00% 0.00% 0.00% General % 0.00% 0.00% 0.00% 0.00% 0.00% 0.00% 0.00% 0.00% 0.00% General % 0.00% 0.00% 0.00% 0.00% 0.00% 0.00% 0.00% 0.00% 0.00% General % 0.00% 0.00% 0.00% 0.00% 0.00% 0.00% 0.00% 0.00% 0.00% General % 3.51% 0.00% 0.00% 0.00% 0.00% 0.00% 0.00% 0.00% 0.00% General % 3.86% 0.00% 0.00% 0.00% 0.00% 0.00% 0.00% 0.00% 0.00% General % 1.75% 0.00% 0.00% 0.00% 0.00% 0.00% 0.00% 0.00% 0.00% General % 1.93% 0.00% 0.00% 0.00% 0.00% 0.00% 0.00% 0.00% 0.00% General % 42.11% 22.81% 15.79% 1.75% 0.00% 0.00% 0.00% 0.00% 0.00% General % 46.32% 25.09% 17.37% 1.93% 0.00% 0.00% 0.00% 0.00% 0.00% General % 45.61% 33.33% 5.26% 3.51% 0.00% 0.00% 0.00% 0.00% 0.00% General % 50.18% 36.67% 5.79% 3.86% 0.00% 0.00% 0.00% 0.00% 0.00% General % 45.61% 15.79% 8.77% 0.00% 0.00% 0.00% 0.00% 0.00% 0.00% General % 50.18% 17.37% 9.65% 0.00% 0.00% 0.00% 0.00% 0.00% 0.00% General % 42.11% 26.32% 3.51% 0.00% 0.00% 0.00% 0.00% 0.00% 0.00% General % 46.32% 28.95% 3.86% 0.00% 0.00% 0.00% 0.00% 0.00% 0.00% General % 45.61% 28.07% 8.77% 0.00% 0.00% 0.00% 0.00% 0.00% 0.00% General % 50.18% 30.88% 9.65% 0.00% 0.00% 0.00% 0.00% 0.00% 0.00% General % 35.09% 31.58% 21.05% 0.00% 0.00% 0.00% 0.00% 0.00% 0.00% General % 38.60% 34.74% 23.16% 0.00% 0.00% 0.00% 0.00% 0.00% 0.00%

33 OR Utilization by volume growth Note: Assumes 12 OR rooms available. Does not include Turnover Time Volume growth Subsequent quarter = 4.4% growth
34 Convincing others

35 Table top simulation completed on longest/busiest day in year Team utilized 10 OR rooms, 1 hybrid room, 1 minor procedure room Day 1 had 6, 4+ hour cases. 34 OR cases total Day 2 had 3, 4+ hour cases. 34 OR cases total Both days caseload fit running 10 hour day
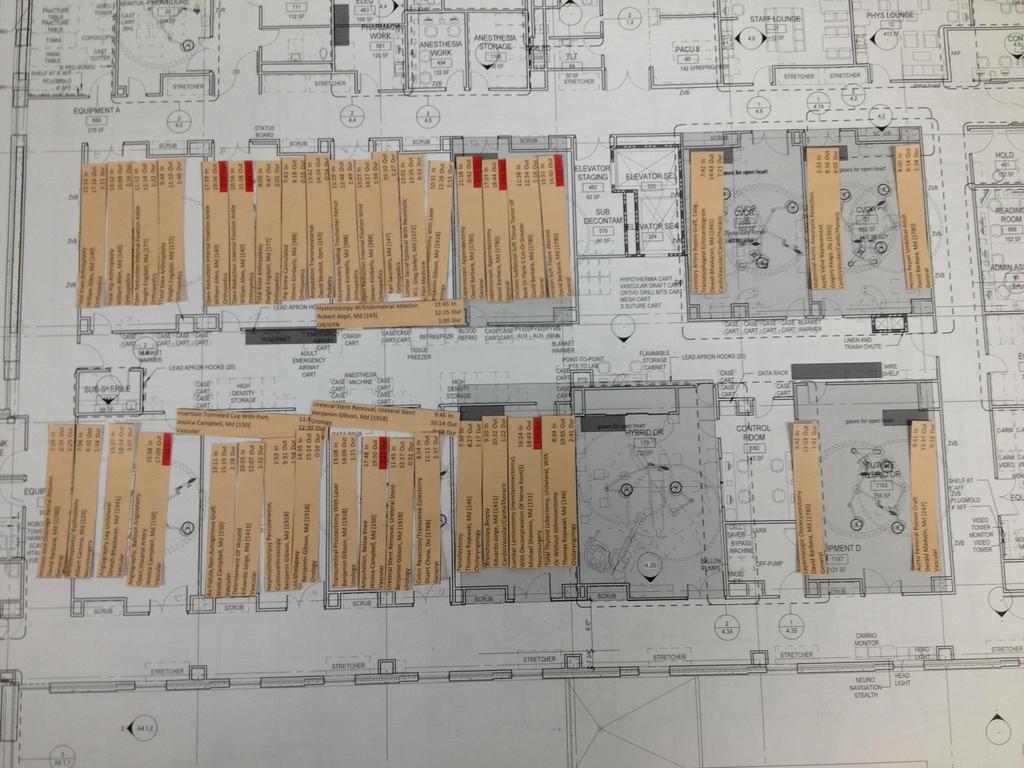
36

37 Future Plan Minor Shell Hybrid standard OR Rooms 1 Hybrid Procedure Room 1 Shelled OR Room for future need
38 OR operational modeling Staff Utilization Determining FTE s for appropriate utilization in Surgery, Cath Lab, EP Lab
39 Service Line Typical Staffing by Case type Staff needed MD Nurse Tech Anes Total General Ortho Vascular Neuro Uro Cath Lab EP Lab *Did not include assistants to the Surgeons that are not hospital employees

40 EP MD EP RN OR MD Cath Tech Cath RN Cath MD EP Tech OR Anes OR Tech OR RN Perfusion Model with max needed staff added to availability

41 Minutes each RN would work per Replication Completed with each job role

42 Minutes converted to Utilization

43 Color coded by percentages and grouped in to 3 categories How many OR RN s were more than 50%, 55%, 60% utilized on average during day?


44 Current vs Simulation Staffing Current staffing Monday Tuesday Wednesday Thursday Friday Combined Techs Combined RNs Simulation staffing A difference of 27.8 FTE s per week Monday Tuesday Wednesday Thursday Friday FlexCombined Techs FlexCombined RNs
45 Conclusion: 10 OR s + 1 Hybrid would sufficiently accommodate current and increased volumes (up to +20% validated) Savings: Construction (hard savings): 2 less OR s = $4M Staffing (soft savings): $1.6M (salary + benefits)
University of Michigan Hospital s Operating Room Utilization Analysis
 University of Michigan Hospital s Operating Room Utilization Analysis by: Jim Caidwell Bernice Lin Grace Yee Client: Dr. Timothy Rutter Project Coordinator: Liz Othman, R.N. JOE 481-Senior Design Project
Thanksgiving Break Homework Packet Name: Per: Everyday on break, you are expected to do at least 15 minutes of math work.
 Thanksgiving Break Homework Packet Name: Per: Everyday on break, you are expected to do at least 15 minutes of math work. Here s your schedule: Mon 11/19 Tues 11/20 Wed 11/21 Thurs 11/22 Fri 11/23 Operations
11 CHI-SQUARED Introduction. Objectives. How random are your numbers? After studying this chapter you should
 11 CHI-SQUARED Chapter 11 Chi-squared Objectives After studying this chapter you should be able to use the χ 2 distribution to test if a set of observations fits an appropriate model; know how to calculate
NHS Occupational Health Workforce Survey 2009
 NHS Occupational Health Workforce Survey 2009 Analysed by the Workforce Review Team NHS Occupational Health Workforce Survey 2009 Table of Contents 1. Foreword... 7 2. NHS Plus... 8 3. Executive summary...
How to use this revision book
 How to use this revision book - Roughly 10 minutes work a day - The number at the top of each page is for a video on http://corbettmaths.com/contents/ - For each day 1) Watch the video 2) Answer the questions
Mean, Median, Mode, and Range
 Mean, Median, Mode, and Range Mean, median, and mode are measures of central tendency; they measure the center of data. Range is a measure of dispersion; it measures the spread of data. The mean of a data
This Job Aid walks hourly employees with benefits through the process of entering inclement weather on a time card.
 This walks hourly employees with benefits through the process of entering inclement weather on a time card. Audience: Hourly USS employees with benefits. Hourly Unclassified employees with benefits Examples
Determine the trend for time series data
 Extra Online Questions Determine the trend for time series data Covers AS 90641 (Statistics and Modelling 3.1) Scholarship Statistics and Modelling Chapter 1 Essent ial exam notes Time series 1. The value
Prince County Hospital. Summerside, Prince Edward Island
 Prince County Hospital Summerside, Prince Edward Island P R I N C E E D W A R D I S L A N D S I T E Prince County Hospital Full service regional hospital 17,000 square metres 102 beds S I T E Gift Shop
AAMC s Approach to Managing Patient Throughput. Barbara S Jacobs, MSN, RN-BC, NEA-BC, CCRN-K, Chief Nursing Officer
 AAMC s Approach to Managing Patient Throughput Barbara S Jacobs, MSN, RN-BC, NEA-BC, CCRN-K, Chief Nursing Officer Our Original State June 2016 375 Licensed beds 97,000 Emergency Department visits per
ZSFG Human Resources Services Report Submitted to the Joint Conference Committee (September, 2018)
") ZSFG Human Resources Services Report Submitted to the Joint Conference Committee (September, ) Report Contents: Vacancy Report Summary of Hiring Status (Vacancy rate over 10%) Graphs: YTD vacancy rate,
ZSFG Human Resources Services Report Submitted to the Joint Conference Committee (September, ) Report Contents: Vacancy Report Summary of Hiring Status (Vacancy rate over 10%) Graphs: YTD vacancy rate,
Parking Study MAIN ST
 Parking Study This parking study was initiated to help understand parking supply and parking demand within Oneida City Center. The parking study was performed and analyzed by the Madison County Planning
What does acid base theory tell us is the difference between acids and bases? Name at least 2 parts.
 Monday, March 16th Learning Target : I can determine the relative acidity of solutions using indicators to measure ph. Homework: Worksheet due Thursday What does acid base theory tell us is the difference
SPR Satisfaction Survey BC Surgical Patient Registry (SPR) Satisfaction Survey 2012
 Satisfaction Survey 2012") BC Surgical Patient Registry (SPR) Satisfaction Survey 2012 July 16, 2012 Table of Contents BACKGROUND...1 RESULTS...2 1. Demographics... 2 2. Usage of the SPR... 3 3. Access to the SPR... 6 4. Value of
BC Surgical Patient Registry (SPR) Satisfaction Survey 2012 July 16, 2012 Table of Contents BACKGROUND...1 RESULTS...2 1. Demographics... 2 2. Usage of the SPR... 3 3. Access to the SPR... 6 4. Value of
UNIT #6 EXPONENTS, EXPONENTS, AND MORE EXPONENTS REVIEW QUESTIONS
 Name: Date: UNIT #6 EXPONENTS, EXPONENTS, AND MORE EXPONENTS REVIEW QUESTIONS Part I Questions 1. The epression 9 5 10 can be simplified to (1) 6 () () 1 1 6 (4). Which of the following is equivalent to
Syllabus, General Chemistry I, CHM 1142 Section TCAA, Fall, 2008 McCall Hall, Room 318 MWF 9:00-9:50 AM
 Syllabus, General Chemistry I, CHM 1142 Section TCAA, Fall, 2008 McCall Hall, Room 318 MWF 9:00-9:50 AM Instructor: Dr. Christopher King, cking@troy.edu Office: McCall 315, (334)670 3576. My office hours
Application of Edge Coloring of a Fuzzy Graph
 Application of Edge Coloring of a Fuzzy Graph Poornima B. Research Scholar B.I.E.T., Davangere. Karnataka, India. Dr. V. Ramaswamy Professor and Head I.S. & E Department, B.I.E.T. Davangere. Karnataka,
3. If a forecast is too high when compared to an actual outcome, will that forecast error be positive or negative?
 1. Does a moving average forecast become more or less responsive to changes in a data series when more data points are included in the average? 2. Does an exponential smoothing forecast become more or
ZSFG Human Resources Services Report Submitted to the Joint Conference Committee (April, 2018)
") ZSFG Human Resources Services Report Submitted to the Joint Conference Committee (April, 2018) Report Contents: Report Summary of Hiring Status ( rate over 10%) 1) Total hospital vacancy rate continue
ZSFG Human Resources Services Report Submitted to the Joint Conference Committee (April, 2018) Report Contents: Report Summary of Hiring Status ( rate over 10%) 1) Total hospital vacancy rate continue
Bishop Kelley High School Summer Math Program Course: Algebra 1 Fall or Spring
 2016 2017 Bishop Kelley High School Summer Math Program Course: Algebra 1 Fall or Spring NAME: DIRECTIONS: Show all work neatly in the packet. You may not use a calculator for the math packet but you do
JANUARY MONDAY TUESDAY WEDNESDAY THURSDAY FRIDAY SATURDAY SUNDAY
 Vocabulary (01) The Calendar (012) In context: Look at the calendar. Then, answer the questions. JANUARY MONDAY TUESDAY WEDNESDAY THURSDAY FRIDAY SATURDAY SUNDAY 1 New 2 3 4 5 6 Year s Day 7 8 9 10 11
JANUARY Single Ad Business Card Size: 3.5 x 2. Single Ad Business Card Size: 3.5 x 2. Double Ad Ad Size: 3.5 x 4.125
 JANUARY 2019 Sunday MONday TUESday WEDNESday THURSday FRIday SATURday 1 2 3 4 5 New Year s Day New Moon 6 7 8 9 10 11 12 13 14 15 16 17 18 19 First Quarter 20 21 22 23 24 25 26 Martin Luther King, Jr.
YEAR 10 GENERAL MATHEMATICS 2017 STRAND: BIVARIATE DATA PART II CHAPTER 12 RESIDUAL ANALYSIS, LINEARITY AND TIME SERIES
 YEAR 10 GENERAL MATHEMATICS 2017 STRAND: BIVARIATE DATA PART II CHAPTER 12 RESIDUAL ANALYSIS, LINEARITY AND TIME SERIES This topic includes: Transformation of data to linearity to establish relationships
Sensory Map. of the North Carolina Museum of Natural Sciences
 Sensory Map of the North Carolina Museum of Natural Sciences Introduction Welcome to the North Carolina Museum of Natural Sciences. You can use this sensory map to identify sensory-friendly spaces within
6 th Grade Earth-Space Science (Lesson Plans Subject to Change Based on Rate of Learning) Week of October 6-10, 2014
 Week of October 6-10, 2014") 6 th Grade Earth-Space Science (Lesson Plans Subject to Change Based on Rate of Learning) Week of October 6-10, 2014 6 th Grade Science Topic, Assignments, Agenda, Board Configurations Homeroom: Skill
6 th Grade Earth-Space Science (Lesson Plans Subject to Change Based on Rate of Learning) Week of October 6-10, 2014 6 th Grade Science Topic, Assignments, Agenda, Board Configurations Homeroom: Skill
Passover Days CE
 Passover Days 28-35 CE 1. Introduction There have been various attempts over the years at producing calendars in modern formats for the year of the Crucifixion of the Messaiah. The accuracy of these is
Name: Teacher: Per: Unit 1 Unit 2 Unit 3 Unit 4 Unit 5 Unit 6 Unit 7 Unit 8 Unit 9 Unit 10. Unit 4. [Writing Linear Equations]
![Name: Teacher: Per: Unit 1 Unit 2 Unit 3 Unit 4 Unit 5 Unit 6 Unit 7 Unit 8 Unit 9 Unit 10. Unit 4. [Writing Linear Equations]](/thumbs/77/74638460.jpg "Name: Teacher: Per: Unit 1 Unit 2 Unit 3 Unit 4 Unit 5 Unit 6 Unit 7 Unit 8 Unit 9 Unit 10. Unit 4. [Writing Linear Equations]") Name: Teacher: Per: Unit 1 Unit 2 Unit 3 Unit 4 Unit 5 Unit 6 Unit 7 Unit 8 Unit 9 Unit 10 Unit 4 [Writing Linear Equations] Find the equation of a line that has slope m = 4 and passes through the point
Name: Teacher: Per: Unit 1 Unit 2 Unit 3 Unit 4 Unit 5 Unit 6 Unit 7 Unit 8 Unit 9 Unit 10 Unit 4 [Writing Linear Equations] Find the equation of a line that has slope m = 4 and passes through the point
SUL ROSS STATE UNIVERSITY Lab Syllabus for Inorganic Chemistry I: CHEM 2402 (Spring 2017)
") SUL ROSS STATE UNIVERSITY Lab Syllabus for Inorganic Chemistry I: CHEM 2402 (Spring 2017) LAB: Inorganic Chemistry I TA: Rebecca Davis Room: WSB 307 Office: WSB Room 308 Time: L01 Th 2:00-4:50 pm Email:
SUL ROSS STATE UNIVERSITY Lab Syllabus for Inorganic Chemistry I: CHEM 2402 (Spring 2017) LAB: Inorganic Chemistry I TA: Rebecca Davis Room: WSB 307 Office: WSB Room 308 Time: L01 Th 2:00-4:50 pm Email:
Announcements. Unit 3: Foundations for inference Lecture 3: Decision errors, significance levels, sample size, and power.
 Announcements Announcements Unit 3: Foundations for inference Lecture 3:, significance levels, sample size, and power Statistics 101 Mine Çetinkaya-Rundel October 1, 2013 Project proposal due 5pm on Friday,
Application 1 - People Allocation in Line Balancing
 Chapter 9 Workforce Planning Introduction to Lecture This chapter presents some applications of Operations Research models in workforce planning. Work force planning would be more of a generic application
Advance signals that can be used to foresee demand response days PJM SODRTF - March 9, 2018
 Advance signals that can be used to foresee demand response days PJM SODRTF - March 9, 2018 1 OVERVIEW BGE s load response programs are split between two programs Peak Rewards and Smart Energy Rewards
Bishop Kelley High School Summer Math Program Course: Algebra II B
 016 017 Summer Math Program Course: NAME: DIRECTIONS: Show all work in the packet. You may not use a calculator. No matter when you have math, this packet is due on the first day of class This material
9/5/2018 TEXAS MEDICAID FEE SCHEDULE - PHYSICAL THERAPIST
 9/5/208 TEXAS MEDICAID FEE SCHEDULE - Page of 6 Texas Medicaid Fee Schedule Information This fee schedule is intended to be used by a variety of provider types and provider specialties. Some procedure
Fall 2017 Student Calendar. August 2017 S M T W T F S
 September 2017 August 2017 3 4 5 6 7 8 9 10 11 12 13 14 15 16 17 18 19 20 22 23 24 25 26 27 28 29 30 31 September 2017 October 2017 3 4 5 6 7 8 9 10 11 12 13 14 15 16 17 18 19 20 21 22 23 24 25 26 27 28
IWT Scenario 1 Integrated Warning Team Workshop National Weather Service Albany, NY October 31, 2014
 Integrated Warning Team Workshop National Weather Service Albany, NY October 31, 2014 23 24 25 26 27 Scenario 1 Timeline November 23-27 Sun Mon Tue Wed Thu Thanksgiving Day Sunday, Nov. 23 @ 430 pm NWS
Chapter 10 Verification and Validation of Simulation Models. Banks, Carson, Nelson & Nicol Discrete-Event System Simulation
 Chapter 10 Verification and Validation of Simulation Models Banks, Carson, Nelson & Nicol Discrete-Event System Simulation The Black Box [Bank Example: Validate I-O Transformation] A model was developed
Algebra 1 - Semester 2 Exam Review
 Class: Date: Algebra - Semester 2 Exam Review Multiple Choice Identify the choice that best completes the statement or answers the question.. 00 equals a. 0 d. 50 b. undefined e. 20 c. 200 2. Solve the
Chemistry 125. Physical Chemistry Laboratory Spring 2007
 Chemistry 125 Physical Chemistry Laboratory Spring 2007 Course Goals See the experimental evidence for the basic concepts of physical chemistry Further develop experimental skills in laboratory Increase
PROPHECY HEALTH TEST STUDY GUIDE PDF
 PROPHECY HEALTH TEST STUDY GUIDE PDF ==> Download: PROPHECY HEALTH TEST STUDY GUIDE PDF PROPHECY HEALTH TEST STUDY GUIDE PDF - Are you searching for Prophecy Health Test Study Guide Books? Now, you will
Chemistry 110 General Chemistry, Course Lecture MWF 8:30 am 9:50 am Room NSM C221 Laboratory M or W 1:00 pm 3:50 pm Room NSM B340
 Course Syllabus Fall 2009 CSU Dominguez Hills Chemistry 110 General Chemistry, Course 40318 Lecture MWF 8:30 am 9:50 am Room NSM C221 Laboratory M or W 1:00 pm 3:50 pm Room NSM B340 Instructor: Dr. Kenneth
Eindhoven University of Technology. Performance Analysis of the Clinical Chemistry Laboratory
 Eindhoven University of Technology Department of Mathematics and Computer Science Performance Analysis of the Clinical Chemistry Laboratory Waterland Hospital Purmerend Author: Maike Op het Veld Supervisors:
CHAPTER 16: SCHEDULING
 CHAPTER 16: SCHEDULING Solutions: 1. Job A B C A B C 1 5 8 6 row 1 0 3 1 Worker 2 6 7 9 reduction 2 0 1 3 3 4 5 3 3 1 2 0 column reduction A B C 1 0 2 1 Optimum: 2 0 0 3 Worker 1, Job A 3 1 1 0 2 B 3 C
Probability and Data Management AP Book 8, Part 2: Unit 2
 Probability and Data Management AP Book 8, Part 2: Unit 2 AP Book PDM8-6 page 38 50 15 30; The number of people doubled, so you can expect the number choosing Action to also double (15 2 = 30). To get
GRADE 6 MATHEMATICS. Form M0117, CORE 1 VIRGINIA STANDARDS OF LEARNING. Spring 2007 Released Test. Property of the Virginia Department of Education
 VIRGINIA STANDARDS OF LEARNING Spring 2007 Released Test GRADE 6 MATHEMATICS Form M0117, CORE 1 Property of the Virginia Department of Education 2007 by the Commonwealth of Virginia, Department of Education,
Unit 5: Proportions and Lines. Activities: Resources:
 Timeline: 2 nd nine weeks Vocabulary: Slope Formula, Rate of Change, Y Intercept, Slope intercept form, Vertical, Horizontal Linear Function Slope Slope of a Line Unit 5: Proportions and Lines New State
SYLLABUS CHEM 202 Lab - Inorganic Chemistry 2 Laboratory Spring, 2014
 SYLLABUS CHEM 202 Lab - Inorganic Chemistry 2 Laboratory Spring, 2014 Laboratory Director: Dr. J. Scott McConnell Office and Office Hours: The lab director s office is 519A. Office hours are 3:00-5:00
Algebra 1 Unit 6B Factoring
 Algebra 1 Unit 6B Factoring Monday Tuesday Wednesday Thursday Friday 9 A Day 10 B Day 11 A Day 12 B Day 13 A Day Test Exponents and Polynomials Factor GCF and Trinomials box method Factoring Trinomials
Office Hours: Mon., Wed before and after class or by appointment.
 Instructor: Long Beach Community College Chemistry 2 Introductory General Chemistry Section 70320 Spring 2013 MW 8:00 9:25 AM, Lecture, Room D314 M 9:35 10:40, Prelab lecture, Room D304 M 10:50 12:55 PM,
Jamati Orientation Update. Houston, Texas March 2018
 Jamati Orientation Update Houston, Texas March 2018 Entry Card Envelope Pick Up Date Fri, March 16 th (Last Day) Starting Sat, March 17 th to Wed, March 21 st 10 am - 10 pm CST Entry Card Pickup Site Jamatkhana
7/6/2018 TEXAS MEDICAID FEE SCHEDULE - TUBERCULOSIS (TB) CLINIC GROUP
 CLINIC GROUP") Page of 5 Texas Schedule Information This fee schedule is intended to be used by a variety of provider types and provider specialties. Some procedure codes might not apply to every provider type and provider
Page of 5 Texas Schedule Information This fee schedule is intended to be used by a variety of provider types and provider specialties. Some procedure codes might not apply to every provider type and provider
2017 Autumn Courses. Spanish Elementary. September - December Elementary 1 - A1.1 Complete beginner
 2017 Autumn Courses 2017 Autumn Courses Spanish Elementary September December 2017 Elementary 1 A1.1 Complete beginner Monday 25 Sept 27 Nov 25 Sept 11 Dec 14.30 16.30 17.30 26 Sept 28 Nov 26 Sept 12 Dec
International Journal of Computing and Business Research (IJCBR) ISSN (Online) : APPLICATION OF GIS IN HEALTHCARE MANAGEMENT
 ISSN (Online) : APPLICATION OF GIS IN HEALTHCARE MANAGEMENT") International Journal of Computing and Business Research (IJCBR) ISSN (Online) : 2229-6166 Volume 3 Issue 2 May 2012 APPLICATION OF GIS IN HEALTHCARE MANAGEMENT Dr. Ram Shukla, Faculty (Operations Area),
International Journal of Computing and Business Research (IJCBR) ISSN (Online) : 2229-6166 Volume 3 Issue 2 May 2012 APPLICATION OF GIS IN HEALTHCARE MANAGEMENT Dr. Ram Shukla, Faculty (Operations Area),
15 Sapium Rd, Southport, 4215 ph: e:
 15 Sapium Rd, Southport, 4215 ph: 07 5597 3844 e: info@benowaearlylearning.com.au www.benowaearlylearning.com.au Office Use Only: Class Required: Date of Commencement: ENROLMENT FORM 2017 Enrolled Formal
Chapter 7 Comparison of two independent samples
 Chapter 7 Comparison of two independent samples 7.1 Introduction Population 1 µ σ 1 1 N 1 Sample 1 y s 1 1 n 1 Population µ σ N Sample y s n 1, : population means 1, : population standard deviations N
ZSFG Human Resources Services Report Submitted to the Joint Conference Committee (June, 2017)
") ZSFG Human Resources Services Report Submitted to the Joint Conference Committee (June, 2017) Report Contents: Vacancy Report Summary of Hiring Status (Vacancy rate over 10%) 1) Total hospital vacancies
ZSFG Human Resources Services Report Submitted to the Joint Conference Committee (June, 2017) Report Contents: Vacancy Report Summary of Hiring Status (Vacancy rate over 10%) 1) Total hospital vacancies
Reteaching Using Deductive and Inductive Reasoning
 Name Date Class Reteaching Using Deductive and Inductive Reasoning INV There are two types of basic reasoning in mathematics: deductive reasoning and inductive reasoning. Deductive reasoning bases a conclusion
FY SUMMARY BUDGET
 SCHOOL Cole Middle School Budgeted Pupil Count 461.0 BEGINNING FUND BALANCE (Includes ALL Reserves) Object/ Source 736,466.00 736,466.00 REVENUES Local Sources 1000-1999 584,080 584,079.95 Intermediate
Title: Department: Previous Version(s): Replaces:
: Replaces:") Title: Department: Pediatric Massive Transfusion Protocol (MTP) Trauma Services Effective Date: 09/2014 Reviewed: Policy and Protocol Previous Version(s): Replaces: **The reader is cautioned to refer to
Title: Department: Pediatric Massive Transfusion Protocol (MTP) Trauma Services Effective Date: 09/2014 Reviewed: Policy and Protocol Previous Version(s): Replaces: **The reader is cautioned to refer to
APPENDIX "A" EFFECTIVE AUGUST 21,2011 THROUGH AUGUST 25, DIPLOMA-
 THE BOARD OF TRUSTEES OF THE UNIVERSITY OF ILLINOIS SALARY RANGES FIRST CONTRACT YEAR - 2% EFFECTIVE AUGUST 21,2011 THROUGH AUGUST 25, 2012 - DIPLOMA- I SteRs* Hourl)l Annual** SteRs* Hourl)l Annual**
SEXTANT & SEXTANT PE frequently asked questions
 SEXTANT & SEXTANT PE frequently asked questions What is SEXTANT? SEXTANT is a software application that helps Financial Executives and Estimators determine their costing and budgeting standards also known
Unit 4: Part 3 Solving Quadratics
 Name: Block: Unit : Part 3 Solving Quadratics Day 1 Day Day 3 Day Day 5 Day 6 Day 7 Factoring Zero Product Property Small Quiz: Factoring & Solving Quadratic Formula (QF) Completing the Square (CTS) Review:
one two three four five six seven eight nine ten eleven twelve thirteen fourteen fifteen zero oneteen twoteen fiveteen tenteen
 Stacking races game Numbers, ordinal numbers, dates, days of the week, months, times Instructions for teachers Cut up one pack of cards. Divide the class into teams of two to four students and give them
GRADE 6 MATHEMATICS. Form M0117, CORE 1 VIRGINIA STANDARDS OF LEARNING. Spring 2007 Released Test. Property of the Virginia Department of Education
 VIRGINIA STANDARDS OF LEARNING Spring 2007 Released Test GRADE 6 MATHEMATICS Form M0117, CORE 1 Property of the Virginia Department of Education 2007 by the Commonwealth of Virginia, Department of Education,
I also express my gratitude to all my friends who courage and help me for writing this book.
 1 Preface It is the benevolence of Allah All Mighty that I am able to present this book to students. I expect that this book will fulfill needs of students preparing for national and International Test.
F rom the C u s t o m er s Perspective... N o rt h w e s t e rn Memorial Hospital Delivers Quality Care With the S Y S T I M A X GigaSPEED Solution
 Health Care GigaSPEED TM Solution F rom the C u s t o m er s Perspective... N o rt h w e s t e rn Memorial Hospital Delivers Quality Care With the S Y S T I M A X GigaSPEED Solution Highly Rated Hospital
ASTRONOMY 10 De Anza College
 ASTRONOMY De Anza College Section 1 M - F, 7:0-8: am De Anza Planetarium (PLT) ek Cichanski Office: S-1a Office hours: Mon thru Fri :0am-:pm, other times by appt. Office phone: (408) 84-84 Email: cichanskimarek@fhda.edu
AirSafe.com traffic spikes heat maps May 2006 to November 2015 Todd Curtis November 22, 2015
 AirSafe.com traffic spikes heat maps May 2006 to November 2015 Todd Curtis November 22, 2015 Summary A previous AirSafe.com study, AirSafe.com traffic spikes May 2006 to November 2015, reviewed traffic
ASTRONOMY LAB INDEPENDENT EXERCISE PRICES FORK OBSERVATORY OPEN HOUSE
 NAME SECTION: Mon Tue Wed Thu ASTRONOMY LAB INDEPENDENT EXERCISE PRICES FORK OBSERVATORY OPEN HOUSE Turn in this writeup to your Teaching Assistant at the next lab meeting after the open house you attend.
California OES Atmospheric River Events Weather Threat Briefing
 California OES Atmospheric River Events Weather Threat Briefing 23 February 2017 10:00 AM PST Day 1: Flooding continues along small streams and creeks and some main stem rivers. National Weather Service
Monday, October 19, CDT Brian Hoeth
 Monday, October 19, 2015 1400 CDT Brian Hoeth Some of the briefing presented is worstcase scenario and may differ in detail from local NWS Weather Forecast Offices. National Weather Service Southern Region
Non-parametric (Distribution-free) approaches p188 CN
 approaches p188 CN") Week 1: Introduction to some nonparametric and computer intensive (re-sampling) approaches: the sign test, Wilcoxon tests and multi-sample extensions, Spearman s rank correlation; the Bootstrap. (ch14
Week 1: Introduction to some nonparametric and computer intensive (re-sampling) approaches: the sign test, Wilcoxon tests and multi-sample extensions, Spearman s rank correlation; the Bootstrap. (ch14
A Model of ICU Bumping
 A Model of ICU Bumping Version: May 2009 Abstract: Many intensive care units (ICUs) face overcrowding. One response to this overcrowding is to bump ICU patients to other departments of the hospital to
ZSFG Human Resources Services Report Submitted to the Joint Conference Committee (July, 2018)
") ZSFG Human Resources Services Report Submitted to the Joint Conference Committee (July, 2018) Report Contents: Report Summary of Hiring Status ( rate over 10%) 1) Hospital vacancies have slowly decreased
ZSFG Human Resources Services Report Submitted to the Joint Conference Committee (July, 2018) Report Contents: Report Summary of Hiring Status ( rate over 10%) 1) Hospital vacancies have slowly decreased
S2: Overview. Illustrated for 2017 Spring Calendar S2. Current Spring Calendar. First Class Day: Earliest: Jan 22 Latest: Jan 28
 : Overview Spring Calendar First Class Day: Earliest: Jan 21 Latest: Jan 27 Last : Earliest: May 19 Latest: May 25 The Motivators 1. The February break is too early. 2. The Spring break is too late. 3.
CWMS Modeling for Real-Time Water Management
 Hydrologic Engineering Center Training Course on CWMS Modeling for Real-Time Water Management August 2018 Davis, California The Corps Water Management System (CWMS) is a software and hardware system to
DataMOCCA. Data MOdels for Call Center Analysis
 4 The SEE Center - Project DataMOCCA Page 1 of 1 DataMOCCA Data MOdels for Call Center Analysis Project Collaborators: Technion: Wharton: Companies: Paul Feigin, Avi Mandelbaum Technion SEElab: Valery
The Tampa Bay Catastrophic Plan Presentation to CFGIS Users Group FDOT District 5 Urban Offices - Orlando July 30, 2010
 The Tampa Bay Catastrophic Plan Presentation to CFGIS Users Group FDOT District 5 Urban Offices - Orlando July 30, 2010 Brady Smith Senior Planner Tampa Bay Regional Planning Council Introduction Recent
Solar Data what can it show us?
 Solar Data what can it show us? Science, English Curriculum Levels 1-2 Activity Description Genesis Energy has installed solar panels at selected schools across Aotearoa/ New Zealand. This activity encourages
Assignments for Algebra 1 Unit 4: Linear Functions and Correlation
 Name: Assignments for Algebra 1 Unit 4: Linear Functions and Correlation Day Date Assignment (Due the next class meeting) Thursday 10/25/12 (A) Monday 10/29/12 (B) 4.1 Worksheet Tuesday 10/30/12 (A) Wednesday
SAVE THIS SYLLABUS FOR REFERENCE DURING THE SEMESTER.
 SYLLABUS Course: General Chemistry I: (call #16279) Lecture: 9:00-10:25AM Mon.-Wed.; Room 6068 Recitation: 1 hour per week: Mon.; 12:00-1:00 Room 3066 Laboratory: 3 hours per week: Mon.; 1:00-4:00 Room
IWT Scenario 2 Integrated Warning Team Workshop National Weather Service Albany, NY October 31, 2014
 IWT Scenario 2 Integrated Warning Team Workshop National Weather Service Albany, NY October 31, 2014 09 10 11 12 13 Scenario 2 Timeline December 9-13 Tue Wed Thu Fri Sat Tue, Dec. 9 @ 5 am 2014 2014 2014
IRIS Undergraduate Internship Orientation Week May 26 June 1, 2013 New Mexico Tech
 IRIS Undergraduate Internship Orientation Week May 26 June 1, 2013 New Mexico Tech Staff: Rick Aster (NMT) Greg Chavez (PIC) Gary Axen (NMT) Katie Foster (U. of Wyoming & Program Alumnus) Michael Hubenthal
= L y 1. y 2. L y 2 (2) L c y = c L y, c.
 L c y = c L y, c.") Definition: A second order linear differential equation for a function y x is a differential equation that can be written in the form A x y B x y C x y = F x. We search for solution functions y x defined
Definition: A second order linear differential equation for a function y x is a differential equation that can be written in the form A x y B x y C x y = F x. We search for solution functions y x defined
Appendix BAL Baltimore, Maryland 2003 Annual Report on Freeway Mobility and Reliability
 (http://mobility.tamu.edu/mmp) Office of Operations, Federal Highway Administration Appendix BAL Baltimore, Maryland 2003 Annual Report on Freeway Mobility and Reliability This report is a supplement to:
JAN FEB MAR APR MAY JUN JUL AUG SEP OCT NOV DEC TOTAL AVG
 Jennifer Road Detention Center CY-2016 Health Services Report JAN FEB MAR APR MAY JUN JUL AUG SEP OCT NOV DEC TOTAL AVG Average Daily Census 421 439 441 399 408 409 421 432 440 425 469 388 5092 CLINIC
Geography Revision plans 2017/18
 Geography Revision plans 2017/18 Day Date WK Examinations Topic/Skill Focus ssessment HWK/Revision to be set January 3 Revision guide Physical geography Wednesday topics Thursday 4 Friday 5 Monday 8 Tuesday
Turn to Section 4 of your answer sheet to answer the questions in this section.
 Math Test Calculator 55 MINUTES, 38 QUESTIONS Turn to Section 4 of your answer sheet to answer the questions in this section....directions... Questions 1-30 ask you to solve a problem, select the best
ADVENTURES IN THE FLIPPED CLASSROOM FOR INTRODUCTORY
 ADVENTURES IN THE FLIPPED CLASSROOM FOR INTRODUCTORY A M Y N U S S B A U M A N D M O N N I E M C G E E STATISTICS S R C O S J U N E 5, 2 0 1 3 Amy Nussbaum and Monnie McGee SRCOS, June 5, 2013 FLIPPED
Obj: Observe and describe states of matter.
 Do Now Date: March 6, 2017 Obj: Observe and describe states of matter. Copy and Solve: 1. If Dr. B has a 5.0L container at a pressure of 2 atm, how much pressure would it place on the walls of a 2.5L container?
Chapter 2: Graphs, Charts, and Tables Describing Your Data
 Chapter 2: Graphs, Charts, and Tables Describing Your Data When applicable, the first few problems in each section will be done following the appropriate step by step procedures outlined in the corresponding
GEOLOGY 100 Planet Earth Spring Semester, 2007
 GEOLOGY 100 Planet Earth Spring Semester, 2007 Instructor: Michael A. Stewart, 250 Natural History Building Phone: 244-5025 Email: stewart1@uiuc.edu Office hours: Friday 1:00-2:30 pm by appointment Discussion
CHEMISTRY 3A INTRODUCTION TO CHEMISTRY SPRING
 CHEMISTRY 3A INTRODUCTION TO CHEMISTRY SPRING ---- 2007 INSTRUCTOR: Dr. Phil Reedy Office: Cunningham 321 Telephone: 954-5671 email: preedy@deltacollege.edu WEBSITES: www.deltacollege.edu/emp/preedy www.preparatorychemistry.com
STAT Section 5.8: Block Designs
 STAT 518 --- Section 5.8: Block Designs Recall that in paired-data studies, we match up pairs of subjects so that the two subjects in a pair are alike in some sense. Then we randomly assign, say, treatment
January SUNDAY. State Representative Joseph A. Petrarca. Compliments of
 January 0 Irvis Office Building P.O. Box Harrisburg, PA 0- () - Fax: () 0- Longfellow St. Vandergrift, PA 0 () - Fax: () -000 N. Chestnut St. Derry, PA () - Fax: () - 0 Jefferson St. Latrobe, PA 0 () -0
Is there a role for robotics in PAE?
 Is there a role for robotics in PAE? S A N D E E P B A G L A, M D V A S C U L A R I N S T I T U T E O F V I R G I N I A W O O D B R I D G E V I R G I N I A U S A A D J U N C T C L I N I C A L A S S O C
MODELING (Integer Programming Examples)
") MODELING (Integer Programming Eamples) IE 400 Principles of Engineering Management Integer Programming: Set 5 Integer Programming: So far, we have considered problems under the following assumptions:
MODELING (Integer Programming Eamples) IE 400 Principles of Engineering Management Integer Programming: Set 5 Integer Programming: So far, we have considered problems under the following assumptions:
Historical Geology, GEOL 1120 (final version) Spring 2009
 Spring 2009") Instructor: Dr. John H. Whitmore, Associate Professor of Geology, at Cedarville since 1991 B.S. Geology, Kent State University, 1985 M.S. Geology, Institute for Creation Research, 1991 Ph.D., Biology with
Instructor: Dr. John H. Whitmore, Associate Professor of Geology, at Cedarville since 1991 B.S. Geology, Kent State University, 1985 M.S. Geology, Institute for Creation Research, 1991 Ph.D., Biology with
CprE 281: Digital Logic
 CprE 281: Digital Logic Instructor: Alexander Stoytchev http://www.ece.iastate.edu/~alexs/classes/ NAND and NOR Logic Networks CprE 281: Digital Logic Iowa State University, Ames, IA Copyright Alexander
Marquette University Executive MBA Program Statistics Review Class Notes Summer 2018
 Marquette University Executive MBA Program Statistics Review Class Notes Summer 2018 Chapter One: Data and Statistics Statistics A collection of procedures and principles
Grade 6 Math Circles November 17, 2010 Sequences
 1 University of Waterloo Faculty of Mathematics Centre for Education in Mathematics and Computing Grade 6 Math Circles November 17, 2010 Sequences Sequences A list of numbers or objects in which all terms