Principal component analysis, PCA
|
|
|
- Brice Walsh
- 5 years ago
- Views:
Transcription
1 CHEM-E3205 Bioprocess Optimization and Simulation Principal component analysis, PCA Tero Eerikäinen Room D416d
2 Data Process or system measurements New information from the gathered data Data type and variability important to know How can we extract information from data?
3 Purposes Monitoring state of the processes Understanding relationship between varibles Optimisation
 Collinearity (not all independent)")
4 Good to know In stable situation every process or system measurement vary around it s mean value Typically normal variance is inside the control limits when 99,5% of measurements are within mean +/- 3*variance Dimensionality (over load if too many variables too often) Collinearity (not all independent)
 vs.")
5 Datatypes Univariate K=1 Bivariate K=2 Low number of variables K < 6 Multivariable data K 6 controlled and/or response variables Number of variables (K) vs. observations (N) K>N observations more interesting K<N variables more interesting


6 Problems types
7
8 Classical methods, 1930-> Few variables, many observations, independent X s: Multivariate regression Canonical analysis Linear discriminant analysis Analysis of variance Maximun likelyhood etc... Chemistry, biology, engineering, PAT 1990 Many variables, few observations: Chemometrics PCA PLS Other projection methods

9
10 Principal Component Analysis PCA basic principle
11 Basic principle From variables X 1,X 2,,X k will be created new varibles P 1, P 2, P k (max k) New variables (principal components) are linear equations from the original variables Principal components combine the variance of many original variables
12 K-dimensional variable space
13 Observations from data matrix
14 The center of gravity
15 Mean centering
16 Variance maximizing, residual variance minimizing
17 The first principal component
18 The second principal component
19 Two PCs --> plane

20 Scaling
21 Scaling
22 Scaling
23 PCA principles Pricipal components uncorrelated to each other (orthogonality) The distance between original observation points remains unchanged after tranformation The first principal component P 1 covers the most of the original variance, P 2 the most of the remaining variance, etc.
24 PCA properties The goal is to reduce or compress the original data to few explaining components To reduce the dimensionality of original data Works efficiently if there is strong correlation between some of the original X 1,X 2,,X k
25 Choosing the variables PCA variables are equal since they are not classified to dependent and independent variables Correlation matrix helps to inspect if principal components should be used Multinormal deviation of variables is desirable Linear relation between variables is needed (due to correlation or covariance matrix)


26 PCA Calculation Calculation is carried out using covariance matrix or correlation matrix
27 Analysis principle n*k-observation matrix n observations, k variables Coefficients a 11, a 12,,a 1k are chosen so, that the variance of new variable P 1 is as large as possible and that sum of squares is:

28 Analysis principle Similar approach to other components P x Same limit for the coefficients a xk2 =1 The eigenvalues (the number of = k) of correlation or covariance matrix are the variances of the principal components The sum of principal component variances is equal to sum of original variable variances When using correlation matrix, the sum of eigenvalues is equal to number of variables
29 Analysis principle The variances D 2 (P i ) of pricipal components P i are the eigenvalues i of matrix C The number of chosen principal components is decided according to eigenvalues For example to cover % of total variance Graphical inspection
30 Simca PCA criteria Principal component is significant if at least one of the following is true : Rule 1: Q 2 > Limit The significance limit is displayed near the component. For a PCA model, the limit increases with subsequent components to account for the loss in degrees of freedom. Rule 2: At least K 0.5 variables (K = number of X-variables) Q 2 V > Limit
31 Determination<>prediction
32 Component weights=loadings The composition of various principal component the ratio explained of original variables by different principal components eigenvector a i forms the weights of component p i The intepretation of the principal components is the most subjective phase
33 Loadings
34 Score For each observation a score value can be calculated from original variable values, here e.g. the score value t 1n for the first component and observation n is: in which x ni is the value of X i from observation n From score plots one can see process trends, clustering of various observations etc.
35 Scores and distance to model
 20")
, 16")
36 Exaple: Foods (Simca-program) 20 variables (foodstuff), 16 observations (contries)


37 Calculate enough principal components


38 Characteristic values for the model and original variables


39 Score values for the observations Middle European countries form one cluster Mediterranean countries on the left Nordic countries up right and middle


40 Loadings Garlic and olive oil form a Mediterranean group Crisp bread and frozen fish seem to be characterics to nordic countries Instant coffee and powder soup are used a lot in middle european countries


41 Components 1 and 3 The third component separates England and Ireland from the rest of the countries


42 Components 1 and 3 Loadings-plot shows that tee and jam are popular but grained coffee and fruits are less consumed on these islands.

 of")
43 Exaple: size classification Table shows the morphometric measurements (in mm) of 2-24 days old water fleas


44 Exaple: size classification...
45 Example: size classification... The first and the second principal components explain about 96 % of the original variation Each of the body size variables (all the other but X 2 ) explain each about 20 % of the variation that PC1 explains The second component (which could be said to describe the shape of a water flea) is actually only effected by X2 which describes the size of abdomen fling
. Samples were analysed using the transcript analysis with aid of affinity capture (TRAC) method.")

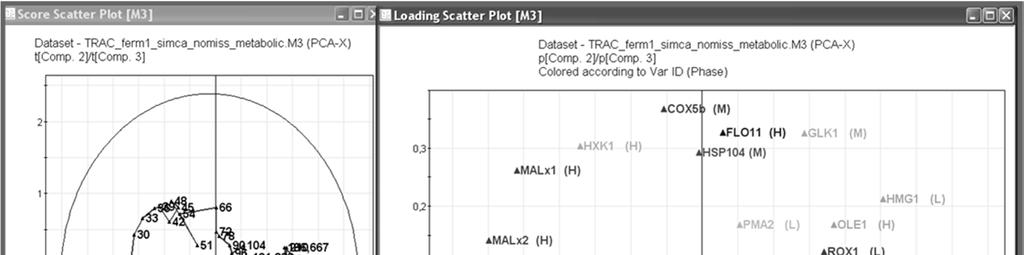
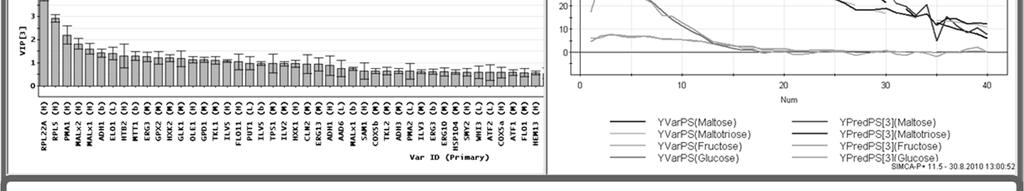
46 Multivariate analysis of dynamic gene expression data from yeast Data was originally gathered from samples of very high gravity wort fermentations using Saccharomyces pastorianus (combining S. cerevisiae and S. bayanus genes). Samples were analysed using the transcript analysis with aid of affinity capture (TRAC) method. TRAC can be used to create a dynamic expression picture along the physiological states of observed cultivations. The expression of selected genes relevant to wort fermentation were monitored at high frequency from several days fermentations. Changes in expression during the first hours of fermentations for several genes affecting maltose metabolism, glycolysis and ergosterol synthesis seemed to be remarkable. To find out more about gene interactions during different metabolic states, multivariate modelling was carried out using PCA and PLS methods. Score plots formed trajectories from the first hours through different metabolic states. Gene expression could be used to monitor fermentation phase changes and product quality. PLS modelling of fermentation sugars and apparent extract (carbohydrate conversion) are shown here. fermentation


47

48
49 PLS-models Partial Least Squares tai Projection to Latents Structures Find the correlation from multivariate data for output/explained variables (Y) in relation to input/process variables (X)
50 PLS 1
51 PLS 2
52 PLS 3
53 Y-score vs. X-score
54 PLS weights (w*c (1) vs. w*c (2) Weights w * reflect the correlation of X vs. u (Y) Weights c reflect the correlation of Y versus t(x) The weights of the 1st and 2nd dimension for both the X and Y space: w* c1 vs. w* c2 in the figure The farther away variable is from the center the greater its effect for the model is For example, the most positive effect to y6 is from x5in and the most negative x3in and x1in


55


56
57 Some more examples Batch statistical process control Bioinformatics
58 BSPC batch-wise manufacturing processes baker s yeast, beer brewing, polymerization processes, car painting, bioreactor cultivation etc. finite duration time dependent variable trajectories
59 Baker s yeast (BSPC) 7 batch trajectories of a single batch How does the trajectories correlate to product quality? Batch-to-batch variations due to deviations in: batch initiations, raw materials, impurities
60 Baker s yeast (BSPC) Evolution measurements yield a 3D-table with N batches, J time points and K variables Intial conditions and result characteristics yield additional data tables Batch maturity and various phases important
61 N=33 batches, 23 selected as reference Last step (14 hours) is concerned 1 sample/10 minutes -> J=83 samples/batch 7 measured variables Baker s yeast
62 Baker s yeast Develop model of good batches Use the model to monitor new batches Early fault detection possible Helps to understand how Y = f(z,x)
63 Baker s yeast, unfolding data Local batch time describing the "dummy" Y-variable, which Simca-P + automatically generates during data intake. In the example variable is described by the term $Time and the estimates from the PLS model describe well the maturity of the batch.
64 Baker s yeast, PLS model
65 Baker s yeast, control limits

66 Baker s yeast, control charts

67 Baker s yeast, control charts (monitoring)
68 QSAM Quatitative sequence-activity models Models to allow alter the biological activity of a DNA segment PLS model to establish numerical description of 68 bp fragments of 25 E.coli promoters and their in vivo strength QSAM model was used to predict more potent promoters


69 QSAM

70 PPs (scores) of 20 nucleosides 21 variables, which describe properties of 20 nucleosides 4 principal components the score values of which may be used further in PLS modeling (e.g. Table 6. A, C, G...)


71 Promoter hyperspace The 25 promoters were parametrized in each of 68 position by four descriptor variables This gives an 25x272 X- matrix This hyperspace is used to correlate with the promoter efficiency

72 Influence of each position Positions , -11 and 1 are constants for all and likely to be important to everyone, even a small numerical value. Otherwise, the most significant points found on positions -12, , etc.
73 Literature vs. measured promoter Using PLS model two promoter, P LS1 and P LS2, were built from one- and twodimensional QSAM models, then predictions were calculated and in vivo experiments were made in which the activities to the existing reference promoters were compared strengths
74 Summary Principal component analysis summarize the variation of a data matrix X The data is modelled as a plane or hyperplane The axes of (hyper)plane are principal components Prior PCA data are pre-prosessed typically by mean centering and scaling to unit variance PLS models are used for output/explained variables (Y) in relation to input/process variables (X)
Principal component analysis
 Principal component analysis Motivation i for PCA came from major-axis regression. Strong assumption: single homogeneous sample. Free of assumptions when used for exploration. Classical tests of significance
BATCH PROCESS MONITORING THROUGH THE INTEGRATION OF SPECTRAL AND PROCESS DATA. Julian Morris, Elaine Martin and David Stewart
 BATCH PROCESS MONITORING THROUGH THE INTEGRATION OF SPECTRAL AND PROCESS DATA Julian Morris, Elaine Martin and David Stewart Centre for Process Analytics and Control Technology School of Chemical Engineering
Principle Components Analysis (PCA) Relationship Between a Linear Combination of Variables and Axes Rotation for PCA
 Relationship Between a Linear Combination of Variables and Axes Rotation for PCA") Principle Components Analysis (PCA) Relationship Between a Linear Combination of Variables and Axes Rotation for PCA Principle Components Analysis: Uses one group of variables (we will call this X) In
Principle Components Analysis (PCA) Relationship Between a Linear Combination of Variables and Axes Rotation for PCA Principle Components Analysis: Uses one group of variables (we will call this X) In
Introduction to Machine Learning. PCA and Spectral Clustering. Introduction to Machine Learning, Slides: Eran Halperin
 1 Introduction to Machine Learning PCA and Spectral Clustering Introduction to Machine Learning, 2013-14 Slides: Eran Halperin Singular Value Decomposition (SVD) The singular value decomposition (SVD)
Principal Components Analysis (PCA)
") Principal Components Analysis (PCA) Principal Components Analysis (PCA) a technique for finding patterns in data of high dimension Outline:. Eigenvectors and eigenvalues. PCA: a) Getting the data b) Centering
Principal Components Analysis (PCA) Principal Components Analysis (PCA) a technique for finding patterns in data of high dimension Outline:. Eigenvectors and eigenvalues. PCA: a) Getting the data b) Centering
Table of Contents. Multivariate methods. Introduction II. Introduction I
 Table of Contents Introduction Antti Penttilä Department of Physics University of Helsinki Exactum summer school, 04 Construction of multinormal distribution Test of multinormality with 3 Interpretation
Experimental design. Matti Hotokka Department of Physical Chemistry Åbo Akademi University
 Experimental design Matti Hotokka Department of Physical Chemistry Åbo Akademi University Contents Elementary concepts Regression Validation Hypotesis testing ANOVA PCA, PCR, PLS Clusters, SIMCA Design
Drift Reduction For Metal-Oxide Sensor Arrays Using Canonical Correlation Regression And Partial Least Squares
 Drift Reduction For Metal-Oxide Sensor Arrays Using Canonical Correlation Regression And Partial Least Squares R Gutierrez-Osuna Computer Science Department, Wright State University, Dayton, OH 45435,
What is Principal Component Analysis?
 What is Principal Component Analysis? Principal component analysis (PCA) Reduce the dimensionality of a data set by finding a new set of variables, smaller than the original set of variables Retains most
Principal component analysis
 Principal component analysis Angela Montanari 1 Introduction Principal component analysis (PCA) is one of the most popular multivariate statistical methods. It was first introduced by Pearson (1901) and
Introduction to Machine Learning
 10-701 Introduction to Machine Learning PCA Slides based on 18-661 Fall 2018 PCA Raw data can be Complex, High-dimensional To understand a phenomenon we measure various related quantities If we knew what
Y (Nominal/Categorical) 1. Metric (interval/ratio) data for 2+ IVs, and categorical (nominal) data for a single DV
 1. Metric (interval/ratio) data for 2+ IVs, and categorical (nominal) data for a single DV") 1 Neuendorf Discriminant Analysis The Model X1 X2 X3 X4 DF2 DF3 DF1 Y (Nominal/Categorical) Assumptions: 1. Metric (interval/ratio) data for 2+ IVs, and categorical (nominal) data for a single DV 2. Linearity--in
1 Neuendorf Discriminant Analysis The Model X1 X2 X3 X4 DF2 DF3 DF1 Y (Nominal/Categorical) Assumptions: 1. Metric (interval/ratio) data for 2+ IVs, and categorical (nominal) data for a single DV 2. Linearity--in
2 D wavelet analysis , 487
 Index 2 2 D wavelet analysis... 263, 487 A Absolute distance to the model... 452 Aligned Vectors... 446 All data are needed... 19, 32 Alternating conditional expectations (ACE)... 375 Alternative to block
Multivariate Data Analysis a survey of data reduction and data association techniques: Principal Components Analysis
 Multivariate Data Analysis a survey of data reduction and data association techniques: Principal Components Analysis For example Data reduction approaches Cluster analysis Principal components analysis
Dimension Reduction and Classification Using PCA and Factor. Overview
 Dimension Reduction and Classification Using PCA and - A Short Overview Laboratory for Interdisciplinary Statistical Analysis Department of Statistics Virginia Tech http://www.stat.vt.edu/consult/ March
Eigenvalues, Eigenvectors, and an Intro to PCA
 Eigenvalues, Eigenvectors, and an Intro to PCA Eigenvalues, Eigenvectors, and an Intro to PCA Changing Basis We ve talked so far about re-writing our data using a new set of variables, or a new basis.
2/26/2017. This is similar to canonical correlation in some ways. PSY 512: Advanced Statistics for Psychological and Behavioral Research 2
 PSY 512: Advanced Statistics for Psychological and Behavioral Research 2 What is factor analysis? What are factors? Representing factors Graphs and equations Extracting factors Methods and criteria Interpreting
Eigenvalues, Eigenvectors, and an Intro to PCA
 Eigenvalues, Eigenvectors, and an Intro to PCA Eigenvalues, Eigenvectors, and an Intro to PCA Changing Basis We ve talked so far about re-writing our data using a new set of variables, or a new basis.
FERMENTATION BATCH PROCESS MONITORING BY STEP-BY-STEP ADAPTIVE MPCA. Ning He, Lei Xie, Shu-qing Wang, Jian-ming Zhang
 FERMENTATION BATCH PROCESS MONITORING BY STEP-BY-STEP ADAPTIVE MPCA Ning He Lei Xie Shu-qing Wang ian-ming Zhang National ey Laboratory of Industrial Control Technology Zhejiang University Hangzhou 3007
18.S096 Problem Set 7 Fall 2013 Factor Models Due Date: 11/14/2013. [ ] variance: E[X] =, and Cov[X] = Σ = =
![18.S096 Problem Set 7 Fall 2013 Factor Models Due Date: 11/14/2013. [ ] variance: E[X] =, and Cov[X] = Σ = =](/thumbs/82/85647425.jpg "18.S096 Problem Set 7 Fall 2013 Factor Models Due Date: 11/14/2013. [ ] variance: E[X] =, and Cov[X] = Σ = =") 18.S096 Problem Set 7 Fall 2013 Factor Models Due Date: 11/14/2013 1. Consider a bivariate random variable: [ ] X X = 1 X 2 with mean and co [ ] variance: [ ] [ α1 Σ 1,1 Σ 1,2 σ 2 ρσ 1 σ E[X] =, and Cov[X]
18.S096 Problem Set 7 Fall 2013 Factor Models Due Date: 11/14/2013 1. Consider a bivariate random variable: [ ] X X = 1 X 2 with mean and co [ ] variance: [ ] [ α1 Σ 1,1 Σ 1,2 σ 2 ρσ 1 σ E[X] =, and Cov[X]
Multivariate data analysis (MVA) - Introduction
 - Introduction") Multivariate data analysis (MVA) - Introduction Introduction t 2 Univariate/Multivariate Latent variables Projections t 1 PCA Examples 10/9/2012 MVA intro 2008 H. Antti 1 Chemical and Biological data are
Multivariate data analysis (MVA) - Introduction Introduction t 2 Univariate/Multivariate Latent variables Projections t 1 PCA Examples 10/9/2012 MVA intro 2008 H. Antti 1 Chemical and Biological data are
Experimental Design and Data Analysis for Biologists
 Experimental Design and Data Analysis for Biologists Gerry P. Quinn Monash University Michael J. Keough University of Melbourne CAMBRIDGE UNIVERSITY PRESS Contents Preface page xv I I Introduction 1 1.1
Principal Component Analysis
 Principal Component Analysis Yingyu Liang yliang@cs.wisc.edu Computer Sciences Department University of Wisconsin, Madison [based on slides from Nina Balcan] slide 1 Goals for the lecture you should understand
Multivariate Analysis
 Prof. Dr. J. Franke All of Statistics 3.1 Multivariate Analysis High dimensional data X 1,..., X N, i.i.d. random vectors in R p. As a data matrix X: objects values of p features 1 X 11 X 12... X 1p 2.
Principal Component Analysis (PCA) Principal Component Analysis (PCA)
 Principal Component Analysis (PCA)") Recall: Eigenvectors of the Covariance Matrix Covariance matrices are symmetric. Eigenvectors are orthogonal Eigenvectors are ordered by the magnitude of eigenvalues: λ 1 λ 2 λ p {v 1, v 2,..., v n } Recall:
Recall: Eigenvectors of the Covariance Matrix Covariance matrices are symmetric. Eigenvectors are orthogonal Eigenvectors are ordered by the magnitude of eigenvalues: λ 1 λ 2 λ p {v 1, v 2,..., v n } Recall:
Principal Component Analysis -- PCA (also called Karhunen-Loeve transformation)
") Principal Component Analysis -- PCA (also called Karhunen-Loeve transformation) PCA transforms the original input space into a lower dimensional space, by constructing dimensions that are linear combinations
Principal Component Analysis -- PCA (also called Karhunen-Loeve transformation) PCA transforms the original input space into a lower dimensional space, by constructing dimensions that are linear combinations
Basics of Multivariate Modelling and Data Analysis
 Basics of Multivariate Modelling and Data Analysis Kurt-Erik Häggblom 2. Overview of multivariate techniques 2.1 Different approaches to multivariate data analysis 2.2 Classification of multivariate techniques
Unconstrained Ordination
 Unconstrained Ordination Sites Species A Species B Species C Species D Species E 1 0 (1) 5 (1) 1 (1) 10 (4) 10 (4) 2 2 (3) 8 (3) 4 (3) 12 (6) 20 (6) 3 8 (6) 20 (6) 10 (6) 1 (2) 3 (2) 4 4 (5) 11 (5) 8 (5)
Chapter 4: Factor Analysis
 Chapter 4: Factor Analysis In many studies, we may not be able to measure directly the variables of interest. We can merely collect data on other variables which may be related to the variables of interest.
DISCRIMINATION AND CLASSIFICATION IN NIR SPECTROSCOPY. 1 Dept. Chemistry, University of Rome La Sapienza, Rome, Italy
 DISCRIMINATION AND CLASSIFICATION IN NIR SPECTROSCOPY Federico Marini Dept. Chemistry, University of Rome La Sapienza, Rome, Italy Classification To find a criterion to assign an object (sample) to one
Introduction to Principal Component Analysis (PCA)
") Introduction to Principal Component Analysis (PCA) NESAC/BIO NESAC/BIO Daniel J. Graham PhD University of Washington NESAC/BIO MVSA Website 2010 Multivariate Analysis Multivariate analysis (MVA) methods
Introduction to Principal Component Analysis (PCA) NESAC/BIO NESAC/BIO Daniel J. Graham PhD University of Washington NESAC/BIO MVSA Website 2010 Multivariate Analysis Multivariate analysis (MVA) methods
B I O P H A R M A C E U T I C A L D ATA A N A LY T I C S U S I N G A S S E T F R A M E W O R K A N D E V E N T F R A M E S F O R M V D A
 2018 PI WORLD LIFE SCIENCES A CASE STUDY: B I O P H A R M A C E U T I C A L D ATA A N A LY T I C S U S I N G A S S E T F R A M E W O R K A N D E V E N T F R A M E S F O R M V D A WHAT IF WE COULD In biopharmaceutical
-Principal components analysis is by far the oldest multivariate technique, dating back to the early 1900's; ecologists have used PCA since the
 1 2 3 -Principal components analysis is by far the oldest multivariate technique, dating back to the early 1900's; ecologists have used PCA since the 1950's. -PCA is based on covariance or correlation
Principal Component Analysis-I Geog 210C Introduction to Spatial Data Analysis. Chris Funk. Lecture 17
 Principal Component Analysis-I Geog 210C Introduction to Spatial Data Analysis Chris Funk Lecture 17 Outline Filters and Rotations Generating co-varying random fields Translating co-varying fields into
International Journal of Pure and Applied Mathematics Volume 19 No , A NOTE ON BETWEEN-GROUP PCA
 International Journal of Pure and Applied Mathematics Volume 19 No. 3 2005, 359-366 A NOTE ON BETWEEN-GROUP PCA Anne-Laure Boulesteix Department of Statistics University of Munich Akademiestrasse 1, Munich,
Vector Space Models. wine_spectral.r
 Vector Space Models 137 wine_spectral.r Latent Semantic Analysis Problem with words Even a small vocabulary as in wine example is challenging LSA Reduce number of columns of DTM by principal components
Factor Analysis and Kalman Filtering (11/2/04)
") CS281A/Stat241A: Statistical Learning Theory Factor Analysis and Kalman Filtering (11/2/04) Lecturer: Michael I. Jordan Scribes: Byung-Gon Chun and Sunghoon Kim 1 Factor Analysis Factor analysis is used
CS281A/Stat241A: Statistical Learning Theory Factor Analysis and Kalman Filtering (11/2/04) Lecturer: Michael I. Jordan Scribes: Byung-Gon Chun and Sunghoon Kim 1 Factor Analysis Factor analysis is used
Bootstrapping, Randomization, 2B-PLS
 Bootstrapping, Randomization, 2B-PLS Statistics, Tests, and Bootstrapping Statistic a measure that summarizes some feature of a set of data (e.g., mean, standard deviation, skew, coefficient of variation,
Principal component analysis (PCA) for clustering gene expression data
 for clustering gene expression data") Principal component analysis (PCA) for clustering gene expression data Ka Yee Yeung Walter L. Ruzzo Bioinformatics, v17 #9 (2001) pp 763-774 1 Outline of talk Background and motivation Design of our empirical
Principal component analysis (PCA) for clustering gene expression data Ka Yee Yeung Walter L. Ruzzo Bioinformatics, v17 #9 (2001) pp 763-774 1 Outline of talk Background and motivation Design of our empirical
Lecture 5: November 19, Minimizing the maximum intracluster distance
 Analysis of DNA Chips and Gene Networks Spring Semester, 2009 Lecture 5: November 19, 2009 Lecturer: Ron Shamir Scribe: Renana Meller 5.1 Minimizing the maximum intracluster distance 5.1.1 Introduction
Basics of Multivariate Modelling and Data Analysis
 Basics of Multivariate Modelling and Data Analysis Kurt-Erik Häggblom 6. Principal component analysis (PCA) 6.1 Overview 6.2 Essentials of PCA 6.3 Numerical calculation of PCs 6.4 Effects of data preprocessing
Principal Component Analysis, A Powerful Scoring Technique
 Principal Component Analysis, A Powerful Scoring Technique George C. J. Fernandez, University of Nevada - Reno, Reno NV 89557 ABSTRACT Data mining is a collection of analytical techniques to uncover new
1 A factor can be considered to be an underlying latent variable: (a) on which people differ. (b) that is explained by unknown variables
 on which people differ. (b) that is explained by unknown variables") 1 A factor can be considered to be an underlying latent variable: (a) on which people differ (b) that is explained by unknown variables (c) that cannot be defined (d) that is influenced by observed variables
1 A factor can be considered to be an underlying latent variable: (a) on which people differ (b) that is explained by unknown variables (c) that cannot be defined (d) that is influenced by observed variables
PRINCIPAL COMPONENT ANALYSIS
 PRINCIPAL COMPONENT ANALYSIS Dimensionality Reduction Tzompanaki Katerina Dimensionality Reduction Unsupervised learning Goal: Find hidden patterns in the data. Used for Visualization Data compression
Structure in Data. A major objective in data analysis is to identify interesting features or structure in the data.
 Structure in Data A major objective in data analysis is to identify interesting features or structure in the data. The graphical methods are very useful in discovering structure. There are basically two
Machine Learning 2nd Edition
 INTRODUCTION TO Lecture Slides for Machine Learning 2nd Edition ETHEM ALPAYDIN, modified by Leonardo Bobadilla and some parts from http://www.cs.tau.ac.il/~apartzin/machinelearning/ The MIT Press, 2010
Introduction to multivariate analysis Outline
 Introduction to multivariate analysis Outline Why do a multivariate analysis Ordination, classification, model fitting Principal component analysis Discriminant analysis, quickly Species presence/absence
Principal Component Analysis vs. Independent Component Analysis for Damage Detection
 6th European Workshop on Structural Health Monitoring - Fr..D.4 Principal Component Analysis vs. Independent Component Analysis for Damage Detection D. A. TIBADUIZA, L. E. MUJICA, M. ANAYA, J. RODELLAR
Applications of genome alignment
 Applications of genome alignment Comparing different genome assemblies Locating genome duplications and conserved segments Gene finding through comparative genomics Analyzing pathogenic bacteria against
A Peak to the World of Multivariate Statistical Analysis
 A Peak to the World of Multivariate Statistical Analysis Real Contents Real Real Real Why is it important to know a bit about the theory behind the methods? Real 5 10 15 20 Real 10 15 20 Figure: Multivariate
Can Assumption-Free Batch Modeling Eliminate Processing Uncertainties?
 Can Assumption-Free Batch Modeling Eliminate Processing Uncertainties? Can Assumption-Free Batch Modeling Eliminate Processing Uncertainties? Today, univariate control charts are used to monitor product
Principal Component Analysis (PCA) Theory, Practice, and Examples
 Theory, Practice, and Examples") Principal Component Analysis (PCA) Theory, Practice, and Examples Data Reduction summarization of data with many (p) variables by a smaller set of (k) derived (synthetic, composite) variables. p k n A
Principal Component Analysis (PCA) Theory, Practice, and Examples Data Reduction summarization of data with many (p) variables by a smaller set of (k) derived (synthetic, composite) variables. p k n A
Multivariate Statistics Fundamentals Part 1: Rotation-based Techniques
 Multivariate Statistics Fundamentals Part 1: Rotation-based Techniques A reminded from a univariate statistics courses Population Class of things (What you want to learn about) Sample group representing
Noise & Data Reduction
 Noise & Data Reduction Paired Sample t Test Data Transformation - Overview From Covariance Matrix to PCA and Dimension Reduction Fourier Analysis - Spectrum Dimension Reduction 1 Remember: Central Limit
CS4495/6495 Introduction to Computer Vision. 8B-L2 Principle Component Analysis (and its use in Computer Vision)
") CS4495/6495 Introduction to Computer Vision 8B-L2 Principle Component Analysis (and its use in Computer Vision) Wavelength 2 Wavelength 2 Principal Components Principal components are all about the directions
CS4495/6495 Introduction to Computer Vision 8B-L2 Principle Component Analysis (and its use in Computer Vision) Wavelength 2 Wavelength 2 Principal Components Principal components are all about the directions
Chemometrics. Matti Hotokka Physical chemistry Åbo Akademi University
 Chemometrics Matti Hotokka Physical chemistry Åbo Akademi University Linear regression Experiment Consider spectrophotometry as an example Beer-Lamberts law: A = cå Experiment Make three known references
Machine Learning. Principal Components Analysis. Le Song. CSE6740/CS7641/ISYE6740, Fall 2012
 Machine Learning CSE6740/CS7641/ISYE6740, Fall 2012 Principal Components Analysis Le Song Lecture 22, Nov 13, 2012 Based on slides from Eric Xing, CMU Reading: Chap 12.1, CB book 1 2 Factor or Component
Data reduction for multivariate analysis
 Data reduction for multivariate analysis Using T 2, m-cusum, m-ewma can help deal with the multivariate detection cases. But when the characteristic vector x of interest is of high dimension, it is difficult
The prediction of house price
 000 001 002 003 004 005 006 007 008 009 010 011 012 013 014 015 016 017 018 019 020 021 022 023 024 025 026 027 028 029 030 031 032 033 034 035 036 037 038 039 040 041 042 043 044 045 046 047 048 049 050
sphericity, 5-29, 5-32 residuals, 7-1 spread and level, 2-17 t test, 1-13 transformations, 2-15 violations, 1-19
 additive tree structure, 10-28 ADDTREE, 10-51, 10-53 EXTREE, 10-31 four point condition, 10-29 ADDTREE, 10-28, 10-51, 10-53 adjusted R 2, 8-7 ALSCAL, 10-49 ANCOVA, 9-1 assumptions, 9-5 example, 9-7 MANOVA
I L L I N O I S UNIVERSITY OF ILLINOIS AT URBANA-CHAMPAIGN
 Introduction Edps/Psych/Stat/ 584 Applied Multivariate Statistics Carolyn J Anderson Department of Educational Psychology I L L I N O I S UNIVERSITY OF ILLINOIS AT URBANA-CHAMPAIGN c Board of Trustees,
Classification 2: Linear discriminant analysis (continued); logistic regression
; logistic regression") Classification 2: Linear discriminant analysis (continued); logistic regression Ryan Tibshirani Data Mining: 36-462/36-662 April 4 2013 Optional reading: ISL 4.4, ESL 4.3; ISL 4.3, ESL 4.4 1 Reminder:
Classification 2: Linear discriminant analysis (continued); logistic regression Ryan Tibshirani Data Mining: 36-462/36-662 April 4 2013 Optional reading: ISL 4.4, ESL 4.3; ISL 4.3, ESL 4.4 1 Reminder:
UPSET AND SENSOR FAILURE DETECTION IN MULTIVARIATE PROCESSES
 UPSET AND SENSOR FAILURE DETECTION IN MULTIVARIATE PROCESSES Barry M. Wise, N. Lawrence Ricker and David J. Veltkamp Center for Process Analytical Chemistry and Department of Chemical Engineering University
Using Principal Component Analysis Modeling to Monitor Temperature Sensors in a Nuclear Research Reactor
 Using Principal Component Analysis Modeling to Monitor Temperature Sensors in a Nuclear Research Reactor Rosani M. L. Penha Centro de Energia Nuclear Instituto de Pesquisas Energéticas e Nucleares - Ipen
Inferential Analysis with NIR and Chemometrics
 Inferential Analysis with NIR and Chemometrics Santanu Talukdar Manager, Engineering Services Part 2 NIR Spectroscopic Data with Chemometrics A Tutorial Presentation Part 2 Page.2 References This tutorial
Multivariate analysis of genetic data: exploring groups diversity
 Multivariate analysis of genetic data: exploring groups diversity T. Jombart Imperial College London Bogota 01-12-2010 1/42 Outline Introduction Clustering algorithms Hierarchical clustering K-means Multivariate
Inter Item Correlation Matrix (R )
") 7 1. I have the ability to influence my child s well-being. 2. Whether my child avoids injury is just a matter of luck. 3. Luck plays a big part in determining how healthy my child is. 4. I can do a lot
7 1. I have the ability to influence my child s well-being. 2. Whether my child avoids injury is just a matter of luck. 3. Luck plays a big part in determining how healthy my child is. 4. I can do a lot
Chapter 4 Dimension Reduction
 Chapter 4 Dimension Reduction Data Mining for Business Intelligence Shmueli, Patel & Bruce Galit Shmueli and Peter Bruce 2010 Exploring the data Statistical summary of data: common metrics Average Median
Noise & Data Reduction
 Noise & Data Reduction Andreas Wichert - Teóricas andreas.wichert@inesc-id.pt 1 Paired Sample t Test Data Transformation - Overview From Covariance Matrix to PCA and Dimension Reduction Fourier Analysis
STA 414/2104: Lecture 8
 STA 414/2104: Lecture 8 6-7 March 2017: Continuous Latent Variable Models, Neural networks With thanks to Russ Salakhutdinov, Jimmy Ba and others Outline Continuous latent variable models Background PCA
CPSC 340: Machine Learning and Data Mining. More PCA Fall 2017
 CPSC 340: Machine Learning and Data Mining More PCA Fall 2017 Admin Assignment 4: Due Friday of next week. No class Monday due to holiday. There will be tutorials next week on MAP/PCA (except Monday).
Modeling Mutagenicity Status of a Diverse Set of Chemical Compounds by Envelope Methods
 Modeling Mutagenicity Status of a Diverse Set of Chemical Compounds by Envelope Methods Subho Majumdar School of Statistics, University of Minnesota Envelopes in Chemometrics August 4, 2014 1 / 23 Motivation
M.Sc. (Final) DEGREE EXAMINATION, MAY Final Year STATISTICS. Time : 03 Hours Maximum Marks : 100
 DEGREE EXAMINATION, MAY Final Year STATISTICS. Time : 03 Hours Maximum Marks : 100") (DMSTT21) M.Sc. (Final) DEGREE EXAMINATION, MAY - 2013 Final Year STATISTICS Paper - I : Statistical Quality Control Time : 03 Hours Maximum Marks : 100 Answer any Five questions All questions carry equal
(DMSTT21) M.Sc. (Final) DEGREE EXAMINATION, MAY - 2013 Final Year STATISTICS Paper - I : Statistical Quality Control Time : 03 Hours Maximum Marks : 100 Answer any Five questions All questions carry equal
UCLA STAT 233 Statistical Methods in Biomedical Imaging
 UCLA STAT 233 Statistical Methods in Biomedical Imaging Instructor: Ivo Dinov, Asst. Prof. In Statistics and Neurology University of California, Los Angeles, Spring 2004 http://www.stat.ucla.edu/~dinov/
ECE 521. Lecture 11 (not on midterm material) 13 February K-means clustering, Dimensionality reduction
 13 February K-means clustering, Dimensionality reduction") ECE 521 Lecture 11 (not on midterm material) 13 February 2017 K-means clustering, Dimensionality reduction With thanks to Ruslan Salakhutdinov for an earlier version of the slides Overview K-means clustering
ECE 521 Lecture 11 (not on midterm material) 13 February 2017 K-means clustering, Dimensionality reduction With thanks to Ruslan Salakhutdinov for an earlier version of the slides Overview K-means clustering
Statistics for Applications. Chapter 9: Principal Component Analysis (PCA) 1/16
 1/16") Statistics for Applications Chapter 9: Principal Component Analysis (PCA) 1/16 Multivariate statistics and review of linear algebra (1) Let X be a d-dimensional random vector and X 1,..., X n be n independent
Statistics for Applications Chapter 9: Principal Component Analysis (PCA) 1/16 Multivariate statistics and review of linear algebra (1) Let X be a d-dimensional random vector and X 1,..., X n be n independent
FAST CROSS-VALIDATION IN ROBUST PCA
 COMPSTAT 2004 Symposium c Physica-Verlag/Springer 2004 FAST CROSS-VALIDATION IN ROBUST PCA Sanne Engelen, Mia Hubert Key words: Cross-Validation, Robustness, fast algorithm COMPSTAT 2004 section: Partial
Lecture 7: Con3nuous Latent Variable Models
 CSC2515 Fall 2015 Introduc3on to Machine Learning Lecture 7: Con3nuous Latent Variable Models All lecture slides will be available as.pdf on the course website: http://www.cs.toronto.edu/~urtasun/courses/csc2515/
MS-E2112 Multivariate Statistical Analysis (5cr) Lecture 8: Canonical Correlation Analysis
 Lecture 8: Canonical Correlation Analysis") MS-E2112 Multivariate Statistical (5cr) Lecture 8: Contents Canonical correlation analysis involves partition of variables into two vectors x and y. The aim is to find linear combinations α T x and β
MS-E2112 Multivariate Statistical (5cr) Lecture 8: Contents Canonical correlation analysis involves partition of variables into two vectors x and y. The aim is to find linear combinations α T x and β
PRINCIPAL COMPONENTS ANALYSIS
 121 CHAPTER 11 PRINCIPAL COMPONENTS ANALYSIS We now have the tools necessary to discuss one of the most important concepts in mathematical statistics: Principal Components Analysis (PCA). PCA involves
Multivariate Fundamentals: Rotation. Exploratory Factor Analysis
 Multivariate Fundamentals: Rotation Exploratory Factor Analysis PCA Analysis A Review Precipitation Temperature Ecosystems PCA Analysis with Spatial Data Proportion of variance explained Comp.1 + Comp.2
PCA and admixture models
 PCA and admixture models CM226: Machine Learning for Bioinformatics. Fall 2016 Sriram Sankararaman Acknowledgments: Fei Sha, Ameet Talwalkar, Alkes Price PCA and admixture models 1 / 57 Announcements HW1
1 Principal Components Analysis
 Lecture 3 and 4 Sept. 18 and Sept.20-2006 Data Visualization STAT 442 / 890, CM 462 Lecture: Ali Ghodsi 1 Principal Components Analysis Principal components analysis (PCA) is a very popular technique for
Dimensionality Reduction Techniques (DRT)
") Dimensionality Reduction Techniques (DRT) Introduction: Sometimes we have lot of variables in the data for analysis which create multidimensional matrix. To simplify calculation and to get appropriate,
Dimensionality Reduction Techniques (DRT) Introduction: Sometimes we have lot of variables in the data for analysis which create multidimensional matrix. To simplify calculation and to get appropriate,
Machine learning for pervasive systems Classification in high-dimensional spaces
 Machine learning for pervasive systems Classification in high-dimensional spaces Department of Communications and Networking Aalto University, School of Electrical Engineering stephan.sigg@aalto.fi Version
Dimensionality Reduction and Principal Components
 Dimensionality Reduction and Principal Components Nuno Vasconcelos (Ken Kreutz-Delgado) UCSD Motivation Recall, in Bayesian decision theory we have: World: States Y in {1,..., M} and observations of X
b) (1) Using the results of part (a), let Q be the matrix with column vectors b j and A be the matrix with column vectors v j :
 (1) Using the results of part (a), let Q be the matrix with column vectors b j and A be the matrix with column vectors v j :") Exercise assignment 2 Each exercise assignment has two parts. The first part consists of 3 5 elementary problems for a maximum of 10 points from each assignment. For the second part consisting of problems
Exercise assignment 2 Each exercise assignment has two parts. The first part consists of 3 5 elementary problems for a maximum of 10 points from each assignment. For the second part consisting of problems
Factor Analysis (10/2/13)
") STA561: Probabilistic machine learning Factor Analysis (10/2/13) Lecturer: Barbara Engelhardt Scribes: Li Zhu, Fan Li, Ni Guan Factor Analysis Factor analysis is related to the mixture models we have studied.
STA561: Probabilistic machine learning Factor Analysis (10/2/13) Lecturer: Barbara Engelhardt Scribes: Li Zhu, Fan Li, Ni Guan Factor Analysis Factor analysis is related to the mixture models we have studied.
Discriminant analysis and supervised classification
 Discriminant analysis and supervised classification Angela Montanari 1 Linear discriminant analysis Linear discriminant analysis (LDA) also known as Fisher s linear discriminant analysis or as Canonical
Dynamic-Inner Partial Least Squares for Dynamic Data Modeling
 Preprints of the 9th International Symposium on Advanced Control of Chemical Processes The International Federation of Automatic Control MoM.5 Dynamic-Inner Partial Least Squares for Dynamic Data Modeling
Explaining Correlations by Plotting Orthogonal Contrasts
 Explaining Correlations by Plotting Orthogonal Contrasts Øyvind Langsrud MATFORSK, Norwegian Food Research Institute. www.matforsk.no/ola/ To appear in The American Statistician www.amstat.org/publications/tas/
PCA, Kernel PCA, ICA
 PCA, Kernel PCA, ICA Learning Representations. Dimensionality Reduction. Maria-Florina Balcan 04/08/2015 Big & High-Dimensional Data High-Dimensions = Lot of Features Document classification Features per
Canonical Correlations
 Canonical Correlations Like Principal Components Analysis, Canonical Correlation Analysis looks for interesting linear combinations of multivariate observations. In Canonical Correlation Analysis, a multivariate
7. Variable extraction and dimensionality reduction
 7. Variable extraction and dimensionality reduction The goal of the variable selection in the preceding chapter was to find least useful variables so that it would be possible to reduce the dimensionality
MULTIVARIATE TECHNIQUES, ROBUSTNESS
 MULTIVARIATE TECHNIQUES, ROBUSTNESS Mia Hubert Associate Professor, Department of Mathematics and L-STAT Katholieke Universiteit Leuven, Belgium mia.hubert@wis.kuleuven.be Peter J. Rousseeuw 1 Senior Researcher,
BASICS OF CHEMOMETRICS
 INTRODUCTION - Chemometrics Introduction What is this and why we need it BASICS OF CHEMOMETRICS Juan Antonio Fernández Pierna Vincent Baeten Pierre Daenne - Some definitions - Overview of methods - Eamples
Multivariate Statistics 101. Ordination (PCA, NMDS, CA) Cluster Analysis (UPGMA, Ward s) Canonical Correspondence Analysis
 Cluster Analysis (UPGMA, Ward s) Canonical Correspondence Analysis") Multivariate Statistics 101 Ordination (PCA, NMDS, CA) Cluster Analysis (UPGMA, Ward s) Canonical Correspondence Analysis Multivariate Statistics 101 Copy of slides and exercises PAST software download
Multivariate Statistics 101 Ordination (PCA, NMDS, CA) Cluster Analysis (UPGMA, Ward s) Canonical Correspondence Analysis Multivariate Statistics 101 Copy of slides and exercises PAST software download
Applied Multivariate Analysis
 Department of Mathematics and Statistics, University of Vaasa, Finland Spring 2017 Dimension reduction Exploratory (EFA) Background While the motivation in PCA is to replace the original (correlated) variables
Mid-year Report Linear and Non-linear Dimentionality. Reduction. applied to gene expression data of cancer tissue samples
 Mid-year Report Linear and Non-linear Dimentionality applied to gene expression data of cancer tissue samples Franck Olivier Ndjakou Njeunje Applied Mathematics, Statistics, and Scientific Computation
Chapter 11 Canonical analysis
 Chapter 11 Canonical analysis 11.0 Principles of canonical analysis Canonical analysis is the simultaneous analysis of two, or possibly several data tables. Canonical analyses allow ecologists to perform