Transforming the time scale in linear multivariate growth curve models Stoel, Reinoud D.; Wittenboer, Godfried van den
|
|
|
- Griffin Wilson
- 5 years ago
- Views:
Transcription

 zur Verfügung gestellt.")
1 Transforming the time scale in linear multivariate growth curve models Stoel, Reinoud D.; Wittenboer, Godfried van den Veröffentlichungsversion / Published Version Zeitschriftenartikel / journal article Empfohlene Zitierung / Suggested Citation: Stoel, Reinoud D. ; Wittenboer, Godfried van den: Transforming the time scale in linear multivariate growth curve models. In: Historical Social Research 25 (2000), 3/4, pp URN: ssoar Nutzungsbedingungen: Dieser Text wird unter einer CC BY-NC-ND Lizenz (Namensnennung-Nicht-kommerziell-Keine Bearbeitung) zur Verfügung gestellt. Nähere Auskünfte zu den CC-Lizenzen finden Sie hier: Terms of use: This document is made available under a CC BY-NC-ND Licence (Attribution Non Comercial-NoDerivatives). For more Information see:
2 Historical Social Research, Vol No. 3/4, Transforming the Time Scale in Linear Multivariate Growth Curve Models Reinoud D. Stoel and Godfried van den Wittenboer University of Amsterdam Abstract: Latent growth curve models represent repeated measures of outcome variables as functions of consecutive time points and other measures. Already a few authors noticed that the relationship between the initial status and growth rate depends on the time scale involved in the model. Different time scales lead to different estimates of these two growth parameters, as well as their variances and covariances. In this article we consider the multivariate growth curve model, in which the relationship between patterns of change of more than one outcome variable can be modeled. We will show that the dependency also occurs in the multivariate case. Mathematical evidence will be presented in which the relationship will be established of initial status and growth rate with the selected time scale. The nature of the relationship will be illustrated on models with a different time scale for the same empirical data. Introduction The multivariate growth curve model is a straightforward extension of the univariate growth curve model, which represents repeated measures of a specific outcome variable as a function of consecutive time points and other measures (Duncan & Duncan, 1995; Willet & Sayer, 1994). Multivariate growth curve models provide additional information on the relationship between patterns of change of different outcome variables. The values of an individual on the outcome variables at a specific time point are modeled as a function of the Address all communications to Reinoud D. Stoel, University of Amsterdam, Faculty of Social and Behavioral Sciences, P.O.Box 94208, NL-1091 GE Amsterdam. reinoud@educ.uva.nl. 57
3 underlying linear growth process. The parameters of such a process (the initial status and the growth rate) vary randomly across individuals, and they are allowed to covary within each process as well as between the processes. Questions about intra- and interindividual variation on multiple outcome variables can be investigated, especially with regard to covarying patterns of change on different variables across individuals (Maccallum, Kim, Malarkey & Kiecolt- Glaser, 1997). The correlation between the growth parameters, initial status and growth rate, has been a central parameter in the analysis of growth models. By including correlates and predictors of the individual growth parameters it also becomes possible to study systematic differences in the individual growth processes (Willet & Sayer, 1994). Parameters of one growth process can be used in a multivariate growth model as predictors of the growth parameters of another growth process, and vice versa. The extension of univariate latent growth curve methodology to multivariate models provides a commonly accepted framework for the analysis of multivariate longitudinal data. Substantive questions, which can be examined using a multivariate growth curve model, are questions like: Is there evidence for systematic change and individual variability in change in the outcome variables? Are time invariant predictors (e.g. age and gender) related to the initial levels or growth rates? Is the growth rate of one process related the growth rate of another process? Do earlier level of an process predict later growth rates of another process? It is not well documented, however, that the conclusions drawn from growth curve analysis are extremely sensitive to the selected time scale. The scale metric chosen for the time factor has serious consequences for the substantive conclusions based on the model. Within the same set of data, different values of the basis function for the time factor (Meredith & Tisak, 1990, p. 108) lead to different relationships between the initial status and growth rate, as is shown already by several researchers (Garst, 2000; Mehta & West, 2000; Rogosa & Willet, 1985; Rovine & Molenaar, 1998; Rudinger & Rietz, 1998). Stoel & Wittenboer (2000) investigate the relationship for univariate growth curve models with effects of an exogenous predictor on the initial status and growth rate. In this paper we investigate the relationship in the multivariate case. We will show how the relations between the growth characteristics of different growth processes also depend on the metric of the selected time scale involved. Related ideas can already be found in Rogosa and Willet (1985), and have recently been investigated by Garst (2000) and Stoel and Wittenboer (2000). The paper is build up as follows. Section 2 starts with a brief introduction into univariate and multivariate latent growth curve models and it illustrates the ideas with a relatively simple example. In Section 3 we formally derive how relations between growth parameters of different growth processes depend on the metric of the time scale used. The fourth section illustrates the ideas with an 58
4 empirical example. The paper ends up with a discussion in which implications and possible solutions are discussed. Time and the (Multivariate) Linear Growth Curve Model The first demonstration that different selections of the time for the initial status lead to different correlations in the same data between initial status and growth rate (ranging from significantly positive to significantly negative) was given by Rogosa and colleagues (Rogosa, Brandt & Zimowski, 1982; Rogosa & Willet, 1985). Their conclusion that, no such thing as the correlation between initial status and change exists, was quite surprising, because determination of a unique correlation seemed to be the goal of much empirical research (Rogosa & Willet, 1985, p. 225). Although the conclusion of Rogosa and Willet (1985) was obvious and even though it was elaborated further in other areas like regression analysis (Aiken & West, 1991), it took some time before the ideas got ground in latent growth curve methodology. Only recently, renewed interest in time dependency of growth parameters in growth curve modeling has emerged (Garst, 2000; Mehta & West, 2000; Rovine & Molenaar, 1998; Rudinger & Rietz, 1998; Stoel & Wittenboer, 2000). Point of departure will be a relatively simple multivariate growth curve model with two outcome variables, so that two growth processes are modeled simultaneously. The growth parameters of the First growth process are modeled here as exogenous variables with an effect on the parameters of the second growth process. This model contains most of the difficulties involved in varying the time scale, so parameter changes due to different time scale metrics can be illustrated quite well. Extensions to multivariate models with reciprocal effects between the growth parameters of the two growth processes are straightforward, but will unnecessarily complicate the model. Further details about latent growth curve models can be found in Maccallum et al. (1997), Meredith & Tisak (1990), and Willet & Sayer (1994). If the multivariate growth curve model is specified as a so-called `füll LISREL model', combining the x-side and y-side of the LISREL model, the cross-process effects can be modeled in the г matrix of the model. This specification has the advantage that it will greatly simplify the exhibition in this paper because one does not have to compute the matrix (I-B) -1. On the other hand, specifying the multivariate growth curve model entirely on the y-side allows reciprocal effects between the growth parameters to be estimated. The model can be expressed, in matrix form, as a normal confirmatory factor analysis model: Χ = τ + Λ ξ + δ Χ Χ (1) 59
5 y τ + Λ η + ε (2) = y y where x and y are the i x 1 vectors of observed repeated measures, while τ Χ and τ y are the i x 1 vectors of item intercepts. Λ x, and Λ y are the i m matrices of basis function coefficients linking the latent growth parameters to the observed variables, ξ and η are the m 1 vector of latent random growth parameters, and δ and ε are the i 1 vectors of random disturbances. As usual, vectors τ Χ and τ y are constrained to zero (see Rovine & Molenaar, 2000; Willet & Sayer, 1994, p. 369) and both Λ x and Λ x are (partly) constrained to known time points to incorporate time into the growth model. Alternatively, Equation 1 and 2 can be thought of as single univariate growth models. The equation for the structural part of the model for the latent growth parameters can be expressed as: η = α + Γξ + ζ (3) where α is the m 1 vector of latent means, Γ is the m m coefficient matrix for the latent growth parameters, ζ is the m 1 vector of error in the equations or random disturbances, and E (ξ) = κ. The covariance matrix of this model (Equations 1 to 3) is: Λ y ( ΓΦΓ +Ψ ) Λ y +Θε Λ yγφλ x Σ = ( ) (4) Λ ΦΓ Λ x y Λ xφλ x +Θδ where Θ δ and Θ ε are the covariance matrices of respectively δ and ε; Φ and Ψ are the covariance matrices of respectively ξ and η Standard SEM assumptions are made (see Jöreskog & Sörbom, 1996, p. 2; Bollen, 1989); together with the following additional assumptions. (1) Linear growth for the time interval of interest. (2) `Time-structured' data (Bock, 1979): both the number and the spacing of the assessments must be the same for all subjects (Willet & Sayer, 1994, p. 365). (3) Each individual latent factor score can be expressed as the latent factor mean plus a latent deviation score from the mean (Duncan et al., 1999). (4) The assumption of common causation: the sources of betweenoccasion variation and individual differences are identical (Mandys, Dolan & Molenaar, 1994). If the basis function coefficients in Λ x, and Λ y are left free to estimate, Equations 1 and 2 represent the more general growth model (Meredith & Tisak, 1990) that also allows for non-linear growth curves. Linear growth, however, requires certain parameters in the basis function to be constrained to specific values. To obtain the linear growth curve model, constraints have to be placed on the basis function coefficients (see Figure 1 and Equations 5 and 6). If the growth rate factors represent a 'unit of change', then each basis function coefficient represents the change that occurs between that occasion and the origin of the process (Rovine & Molenaar, 1998). 60


6 The graphic form of a multivariate linear latent growth curve model with 4 consecutive measures of two outcome variables x and y appears in Figure 1. It shows a multivariate growth model in which the parameters of one growth process are used as predictor of the parameters of another growth process. In the example, to be presented in the next paragraph, we will elaborate further on this specific model. Constraining the Basis coefficients to specific values, give η 0 and ξ 0 respectively η 1, and ξ 1 the interpretation of initial status and growth rate. So, η 0 and ξ 0 represent the expected status at the start of each process, and η 1 and ξ 1 designate the average true growth rates. In particular, the basis function coefficients for the initial status factors η 0 and ξ 0 are constrained to 1 and the Basis function coefficients for the growth rate factors η 1 and ξ 1 are constrained to 0, 1, 2 and 3, respectively. The covariance between initial Status and growth rate has been modeled in the picture, as well as effects between the two linear growth processes. 61
.")
7 A natural origin of time is a mere coincidence in most social and behavioral research. Therefore, the interpretation of the initial status is established usually at an arbitrary point in time (see also Garst, 2000, p. 61, Willet and Sayer, 1994, p. 367). In Figure 1, the origin of both processes is defined at the first measurement occasion by constraining the first basis function coefficients to zero (t 1x = 0 and t 1y = 0). If the basis function coefficients of the first measurement occasion had been constrained to values other than zero, the origin of the processes would have been established at another point in time. Assume, for instance, that our model describes the development of assertiveness and well-being among adolescents on four consecutive time intervals of one year, where the age of the subjects at the first measurement is 12 years 1. If the basis function coefficient of the first measurement occasion is constrained to zero, this formally means that the processes of assertiveness and well-being start at age 12. Another growth model for assertiveness and emotional well-being is the model in which both processes start at the birth of an individual. To incorporate this initial status into the growth model, the basis function coefficients for the growth rate factor have to be constrained to 12, 13, 14 and 15, successively. The measures of x, and y, now indicate the status of both processes twelve years after the origin of the process, if it may be assumed, at least, that the processes remain linear outside the domain of the time points measured. In other words, the true initial status of each process is shifted on the time axis. The origin of the process will be less, however, if there is no 1 Mehta and West (2000) provide solutions when the age of the subjects is not equal at the first measurement occasion. 62


8 natural origin, and researchers have to define the origin of the process themselves, with the risk of misspecification. Changing the Basis Function: the Lack of Invariance of the Growth Parameters to Transformations of the Time Scale The effect of different time scales on the growth parameters is demonstrated by the transformations of the time scales t ix and t iy, defined by [t 1 =0, t 2= 1, t 3 =2, t 4 =3), into new time scales t ix * and t ix *, respectively by a linear function. Since we elaborate in this paper on the transformation of the time scale in one of the two growth processes, we will merely show the effect of the transformation in the y-side of the growth model. However, transformation of the time scale in the x-side of the model will have similar effects. The exposition is based on Garst (2000) and we will use the transformation function 63


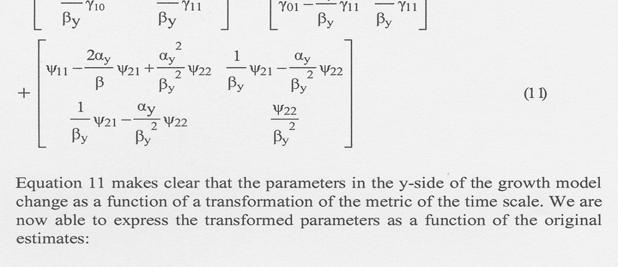
9 64
10 of which Equation 16 to 18 also appear in Garst (2000), and Equation 12 to 15 in Stoel and Wittenboer (2000). From Equation 12 to 18 we may conclude for the y-side of the model that: 1) Multiplying the basis function of one growth process with a constant ß y leads to a change in all relevant parameters. 2) 2. If a constant α y has been added to the basis function, changes will be found in the variance of the initial status and the covariance between initial status and growth rate of this specific growth process. Effects of the parameters of the other growth process on initial status are also subject to change. So, in addition to the changing relation between initial status and growth, the relationship between other growth processes and initial status is also affected by 'shifts' of the time scale. 65
11 3) The growth parameters are only dependent on the time scale, if the variance of the growth rate is nonzero between subjects (Garst, 2000, p. 64; Rovine & Molenaar, 1998). If there is a nonzero variance of the growth rate, than all growth parameters change proportionally, if the measurement unit (ß y )of the time factor is subject to change. On the other hand, if the origin of the process (α y ) changes, only some of the growth parameters obtain other values. Since the change of α y is potentially more dangerous in applied settings than the change of ß y because of its confusing nature, we will focus on this type of change and hold ß y equal to 1. 4) The correlation between initial status and growth rate will be equal to zero in a specific point in time t 0 (Rogosa & Willet, 1985). This point is defined by the expression 0 α =ψ 21 /ψ, where 0 y 22 α equals the number y of time units between the origin of the process and the first measurement occasion (Stoel and Wittenboer, 2000). Illustration at Empirical Data The change in the growth parameters will be illustrated at data taken from the National Longitudinal Survey of Youth (NLSY) of Labor Market Experience in Youth. This study was initiated in 1979 by the U.S. Department of Labor to investigate the transition of young people into the Labor force and a detailed description of the data and data collecting procedures can be found in Baker, Keck, Mott and Quinlan (1993), and Curran (1997). The data used here are from a battery of assessments of Curran (1997). 2 In total 221 children had complete records on the four consecutive measures of 'antisocial behavior' and reading recognition' (1986, 1988, 1990 & 1992). Antisocial behavior was measured by the mother's report on six items that assessed the child's antisocial behavior over the previous three month time period. The scale score for antisocial behavior could range in value from zero to 12. The reading recognition test measured word recognition and pronunciation ability; components considered to be essential to reading achievement. The scale score for reading recognition could range in value from zero to 8.4. The measurement unit was a two years period. The covariance matrix and the sample means of the four measurement occasions an antisocial behavior and reading recognition can be found in Table 1. The fact that List-wise deletion has been used has implications for the generalization of the results. The models are tested to the covariance matrix and mean vector of Table 1 using Mplus 1.04 (Muthén & Muthén, 1998). The model tested is similar to the model depicted in Figure 1. However, preliminary analyses lead to a rejection 2 The data can be found at 66
12 of the assumption of linear growth for the model concerning the outcome variable `reading recognition'. In the final multivariate model the Basis function coefficients for the third and fourth measures of reading recognition are therefore left free to estimate, and they represent the non-linear growth (Meredith & Tisak, 1990; Rovine & Molenaar, 1998). Table 1: Sample means and covariance matrix of antisocial behavior (t 1 - t 4 ) and reading recognition (t 1 - t 4 ). Antisocial behavior Reading reconition t 1 t 2 t 3 t 4 t 1 t 2 t 3 t 4 Means Cov. matrix t t t t t t t t Note. N= 221; Source: Curran (1997) The setup for the multivariate model is presented in Appendix A, and Table 2 Shows the different results when the values of the basis function for antisocial behavior are changed systematically. It contains the relevant parameter estimates of four fitted models with different specifications of the time scale in the basis function of antisocial behavior (λ iy ) Since the growth models yield the same expected covariance matrix (Stoel & Wittenboer, 2000), they give exactly the Same fit measures [χ² (20, N = 221) =17.17, p=.64; RMSEA=.00]. The difference between the models appears in the specification of the basis function for antisocial behavior' (λ iy ). Model 1 assumes that the growth process starts at the time of the first measurement occasion. The other models are obtained by adding (or subtracting) a constant to represent an origin after, or prior to the first measurement occasion (model 2, 3 and 4). As can be seen from Equations 12 to 28, the growth parameters must change if the basis functions are transformed to other values. Corresponding changes can be observed in the relevant growth parameters of 67
13 antisocial behavior in Table 2: (1) the variance of the initial status (ψ 11 ) (2) the covariance between initial status and growth rate (ψ 21 ) (3) the effects of the growth parameters of reading recognition on the initial status and growth rate of antisocial behavior (γ 00. γ 10 and γ 01 ). Table 2 also contains the expectations of the initial status and growth rate of both processes (κ 0, κ 1, α 0 and α 1 ). As one can see, the mean initial status of antisocial behavior α 0 changes as well. Parameter Table 2: Maximum Likelihood estimates of the parameters of the fitted growth models with different basis functions for antisocial behavior Modell [0, 1, 2, 3] Model 2 [1, 2, 3, 4] 68 Model 3 [1.78, 2.78, 3.78, 4.78] Model 4 [10, 11, 12, 13] φ (6.79).542 (6.79).542 (6.79).542 (6.79) φ (5.29).160 (5.29).160 (5.29).160 (5.29) φ (.14).005 (.14).005 (.14).005 (.14) ψ (3.51).547 (1.34).489 (.81) (1.05) ψ (1.82).096 (1.82).096 (1.82).096 (1.82) ψ (2.00).075 (.58).000 (.00) (-1.34) γ (-.53) (-.11).027 (.12).531 (.687) γ (-.87) (-.87) (-.87) (-.87) γ (-3.37) (-3.27) (-3.07) (-2.08) γ (1.54).216 (1.54).216 (1.54).216 (1.54) κ (41.37) (41.37) (41.37) (41.37) κ (28.71) (28.71) (28.71) (28.71) α (6.64) (5.38) (4.46) (1.33) α (.00).000 (.00).000 (.00).000 (.00) Notes: Residuals variances are invariant across the 4 models [ε 1 = ]; ε 2 =1.64 (9.37); ε 3 = 1.36 (8.25) ; ε 4 = 1.43(5.71)]. The basis function for reading recognition was estimated at [0, 1, 1.63, 2.14]. The first element of the basis function equals α. Estimate/ standard error is given in the parentheses.
14 Parameter estimates for the base model with the origin of the process (the true initial status) defined at the first measurement occasion can be found under Model 1 with the specification [0, 1, 2, 3]. These parameters have the most straightforward interpretation, since the first measurement occasion corresponds with the true initial status and no assumption is needed for the growth curve outside the observed time interval. The specification of Model 1 leads statistically the least complicated model, and with respect to subject matter it has the simplest interpretation. The specification in the basis function of Model 2 represents the usual setting in longitudinal multilevel analyses (Bryk & Raudenbush, 1987; Goldstein, 1995). Given the parameter estimates of Model 1 t 0 can be computed using y 0 α y = ψ 21 / ψ 21 =.171/.096 = This implicates that t 0 is located 1.78 y time units prior to the first measurement occasion (Model 3). Model 3 on the contrary, has no 'natural' interpretation. It consists of a time point specification for which the variance of the initial status is minimal and the covariance between the initial status and growth rate of antisocial behavior is zero. Model 4 consists of an extreme, but realistic, time scale with the initial status defined at 10 time units prior to the first measurement occasion. This leads to settings of the basis function equal to [10, 11, 12, 14]. It becomes clear from Table 2 that the variance of the initial status ψ 11 increases if the initial status is further and further apart from the minimum value at t 0 the covariance and expectation of y the initial status change from positive to negative; γ 00 becomes increasingly positive and γ 01 becomes increasingly negative. As one can see in Model 3 (with the zero correlation between initial status and growth), the variance of initial status reaches a minimum value. If one had interpreted the results based on Model 1, the following conclusions would have been drawn. The mean true growth curve for reading recognition is a non-linear curve with an initial status κ 0 = and a growth rate κ 1 = The partly estimated basis function [0, 1, 1.63, 2.14] reveals that the mean growth tempers as time continues. The variance of initial status ( φ ) and growth rate ( φ ) are both significant, but there is a nonsignificant covariance between initial status and growth rate φ ). Eliminating the effects of the growth parameters of reading recognition on the growth process of antisocial behavior, a mean true growth curve remains for antisocial behavior with an initial status α 0 =3.497 and a growth rate α 1 =.000, with significant variation in initial status ( ψ 11 =.792), nonsignificant variation in growth rate ( ψ 22 =.096), and a significant positive covariance between initial status and growth rate ( ψ ). Thus, after controlling for effects of reading recognition, subjects having a higher initial status, also grow more in their antisocial behavior. From the reading recognition parameters, only the growth rate of reading recognition has a significant (negative) effect on the initial status of antisocial behavior ( γ = ). Thus, subjects growing faster on 01 reading recognition would have a lower initial status of antisocial behavior. 69
15 Although these conclusions appear to be clear, they may change drastically if another specification of the time scale would have been used. Model 4, for instance, would have lead to a negative covariance between initial status and growth and a positive effect of the growth rate of reading recognition on the initial status of antisocial behavior ψ 21=-.789; γ =.531). 01 Discussion The analysis in this paper Shows explicitly that the effects of growth parameters from one process to the growth parameters of another depend on the time scale being selected in the multivariate growth curve model. Although maximum likelihood estimation is scale-free (Long, 1984, p.58; Bollen, 1989, p.109) so that the expected covariance matrix will be invariant under linear transformations, the parameter estimates will not. Any other time scale, i.e. any linear transformation of a time scale, corresponds to parameter changes of the parameters involved and causes similar interpretation problems as in the area of multiple regression analysis (Aiken & West, 1991; Mehta & West, 2000). All growth parameter results, being multivariate or not, depend on the time scale used. So, if the scale is arbitrary as in much of the social research, the results have an arbitrary interpretation as well; an interpretation that will be conditional on the selected time for the initial status. Confining us to shifts on the time scale (adding a constant), the change in covariance between the initial status and growth rate of antisocial behavior in Model 1 and Model 4 from.171 to is revealing. If no strong substantial argument prevails for the choice of the initial status, the parameter estimates just reflect arbitrarily selected levels of the process, and it will be much better, then, to use the term 'level' instead of `initial status' (McArlde & Hamagani, 1991; Rovine & Molenaar, 1998). Note, however, that the growth rate is invariant across models. Problems get worse, if the time unit changes as well. For instance, if we measure in years instead of decades and we take the first measurement occasion as initial status. In that case, both growth rate and initial status are subject to change and the interpretation becomes more complicated. Being merely interested in pure change, on the other hand, we simply need confine ourselves to the same unit of time and we need not bother about time scale shifts by adding constants. Growth rates of processes may be compared in that case, for example between groups or between different processes in the same multivariate model, because growth rates are insensitive to adding a constant to the time scale. If the time unit does not change, the growth rate does not change either. In other words, growth rates are invariant under shifts on the time scale. Apparently, problems arise if researchers overreach their goals in interpreting the initial status, or more specifically de correlation between initial status and growth rate. As is shown in Stoel & Van den Wittenboer (2000) already, 70
16 this is meaningful only in those cases in which the processes have a natural origin; if time is measured on a ratio scale, so to speak. Although specific situations exist in which the origin of the process is known, and the correlation between initial status and growth rate can be substantively interpreted, most social science research is limited to growth per se. References Aiken, L. S., & West, S. G. (1991). Multiple regression: testing and interpreting interactions. Newbury Park, CA: Sage. Baker, P. C., Keck, C. K., Mott, F. L., & Quinlan, S. V. (1993). NLSY child handbook: a guide to the National Longitudinal Survey of Youth child data. Columbus, OH: Center for Human Resource Research. Bock, R. D. (1979). Univariate and multivariate analysis of variance of timestructured data. In: J. R. Nesselroade &. P. B. Baltes (Eds.), Longitudinal research in the study of behavior and development (pp ). New York: Academic Press. Bollen, K. A. (1989). Structural equations with latent variables. New York: Wiley. Bryk, A. S., & Raudenbush, S. W. (1987). Application of hierarchical linear models to assessing change. Psychological Bulletin, 101, Curran, P.J. (1997). The bridging of quantitative methodology and applied developmental research. In Patrick J. Curran (Chair), Comparing three modern approaches to longitudinal data analysis: An examination of a single developmental sample. Symposium conducted at the 1997 meeting of the Society for Research on Child Development, Washington, DC. Duncan, T. E., & Duncan, S. C. (1995). Modeling processes of development via latent growth curve methodology. Structural Equation Modeling, 2, Duncan, T. E., Duncan, S. C., Strycker, L. A., Li, F., & Alpert, A. (1999). An introduction to latent growth curve modeling. New Jersey: Mahwah. Garst, H. (2000). Longitudinal research using structural equation modeling applied in studier of determinants of psychological well-being and personal initiative in East Germany after the unification. Unpublished doctoral dissertation, University of Amsterdam, The Netherlands. Goldstein, H. (1995). Multilevel statistical models (2nd ed.). New York: Halsted. Jöreskog, K. G., & Sörbom, D. (1996). LISREL 8: User's reference guide. Chicago: SSI International. Jöreskog, K. G., & Sörbom, D. (2000). LISREL 8.30 [Computer software]. Chicago: SSI International. Long, S. C. (1984). Confirmatory factor analysis. London: Sage. 71
17 Mandys, F., Dolan, C. V., & Molenaar, P. C. M. (1994). Two aspects of the simplex model: Goodness of fit to linear growth curve structures and the analysis of mean trends. Journal of Educational and Behavioral Statistics, 19, MacCallum, R. C., Kim, C., Malarkey, W. B., & Kiecolt-Glaser, J. K. (1997). Studying multivariate change using multilevel models and latent growth curve models. Multivariate Behavioral Research, 32, McArdle, J.J. & Hamagami, F. (1991). Modeling incomplete longitudinal and cross-sectional data. In L. M. Collins & J. L. Horn (Eds.), Best methods for the analysis of change (pp ). Washington, DC: American Psychological Association. Mehta, P. D., & West, S. G. (2000). Putting the individual back into growth curves. Psychological Methods, 5, Meredith, W., & Tisak, J. (1990). Latent curve analysis. Psychometrika, 55, Muthen, L. K. & Muthen, B. O. (1998). Mplus 1.04 [Computer software]. Los Angeles: Muthen & Muthen. Muthen, L. K. & Muthen, B. O. (1998). Mplus User's Guide. Los Angeles: Muthen & Mutheu. Rogosa, D. (1995). Myths and methods: "Myths about longitudinal research" plus supplemental questions. In: J. M. Gottman (Ed.), The analysis of change (pp. 3-66). New Jersey: Mahwah. Rogosa, D. R., & Willet, J. B. (1985). Understanding correlates of change by modeling individual differences in growth. Psychometrika, 50, Rogosa, D., Brandt, D., & Zimowski, M. (1982). A growth curve approach to the measurement of change. Quantitative Methods in Psychology, 92, Rovine, M. J., & Molenaar, P. C. M. (1998). The covariance between level and shape in the latent growth curve model with estimated basis vector coefficients. Methods of Psychological Research Online [On-line serial], 3. Retrieved from the World Wide Web, 12 October 1999, ppm.ipn.uni-kiel.de/mpr/issue5/ Rovine, M. J., & Molenaar, P. C. M. (2000). A structural modeling approach to a multilevel random coefficients model. Multivariate Behavioral Research, 35, Rudinger, G., & Rietz, C. (1998). The neglected time dimension? Introducing a longitudinal model testing latent growth curves, stability, and reliability as time bound processes. Methods of Psychological Research Online [On-line serial], 3. Retrieved from the World Wide Web, 12 October 1999, Stoel, R. D. & Wittenboer, G. van den (2000). Prediction of initial status and change: incorporating time in linear growth curve models. Manuscript submitted for publication. 72
18 Willet, J. B., & Sayer, A. G. (1994). Using covariance structure analysis to detect correlates and predictors of individual change over time. Psychological Bulletin, 116, Appendix A In this appendix we present the Mplus 1.04 programs that were used to fit Models 1 through 4. Since all have a similar structure, we present the program used to fit Model 1 in its entirety. The remaining models can be fitted by changing the restrictions imposed on the slope factor of antisocial behavior (SlopeA) according to Table 2. For further information on the program specification we refer to the Mplus User's Guide (Mutken & Mutken, 1998). TITLE: multivariate growth model on Curran data DATA: file is currandata.dat; VARIABLE: Names are anti 1 anti2 anti3 anti4 read1 read2 read3 read4; usevariables are anti1 anti2 anti3 anti4 read1 read2 read3 read4; ANALYSIS: type = meanstructure, MODEL: InterA by anti1-anti4@1; SlopeA by anti anti2@1 1 anti3@2 anti4@3; InterR by read1-read4@1; SlopeR by read1@0 read2@1 read3 read4; InterA on InterR SlopeR; SlopeA on InterR SlopeR; InterA with SlopeA; InterR with SlopeR; [anti1-read4@0 InterR SlopeR InterA SlopeA]; Below we also present the program that can be used to fit the models using the LISREL 8.30 program (Jöreskog & Sörbom, 2000). Multivariate growth model on Curran data DA ni=8 no=221 ma=cm RA fi=currandata.dat LA Anti1 anti2 anti3 anti4 read1 read2 read3 read4 SE Read1 read2 read3 read4 anti1 anti2 anti3 anti4 MO ny=8 ne=4 ly=fu,fi te=di,fr ps=sy,fi be=fu,fi ty=ze al=fr LE InterR SlopeR InterA SlopeA MA ly 73
19 Fr ly 3 2 ly 4 2 Fr ps 1 1 ps 2 2 ps 3 3 ps 4 4 ps 2 1 ps 4 3 Fr be 3 1 be 4 1 be 3 2 be 4 2 OU se rs ad=off sc ss 74
Time Dependence of Growth Parameters in Latent Growth Curve Models with Time Invariant Covariates
 Methods of Psychological Research Online 003, Vol.8, No., pp. -4 Department of Psychology Internet: http://www.mpr-online.de 003 University of Koblenz-Landau Time Dependence of Growth Parameters in Latent
CHAPTER 2. APPLYING LGM TO EMPIRICAL DATA
 02-Preacher-45609:02-Preacher-45609.qxd 6/3/2008 3:35 PM Page 22 CHAPTER 2. APPLYING LGM TO EMPIRICAL DATA Data In the following, we demonstrate how to use growth curve models in practice. For this demonstration,
Specifying Latent Curve and Other Growth Models Using Mplus. (Revised )
") Ronald H. Heck 1 University of Hawai i at Mānoa Handout #20 Specifying Latent Curve and Other Growth Models Using Mplus (Revised 12-1-2014) The SEM approach offers a contrasting framework for use in analyzing
Ronald H. Heck 1 University of Hawai i at Mānoa Handout #20 Specifying Latent Curve and Other Growth Models Using Mplus (Revised 12-1-2014) The SEM approach offers a contrasting framework for use in analyzing
Testing Main Effects and Interactions in Latent Curve Analysis
 Psychological Methods 2004, Vol. 9, No. 2, 220 237 Copyright 2004 by the American Psychological Association 1082-989X/04/$12.00 DOI: 10.1037/1082-989X.9.2.220 Testing Main Effects and Interactions in Latent
Goals for the Morning
 Introduction to Growth Curve Modeling: An Overview and Recommendations for Practice Patrick J. Curran & Daniel J. Bauer University of North Carolina at Chapel Hill Goals for the Morning Brief review of
Multilevel Structural Equation Modeling
 Multilevel Structural Equation Modeling Joop Hox Utrecht University j.hox@uu.nl http://www.joophox.net 14_15_mlevsem Multilevel Regression Three level data structure Groups at different levels may have
How well do Fit Indices Distinguish Between the Two?
 MODELS OF VARIABILITY VS. MODELS OF TRAIT CHANGE How well do Fit Indices Distinguish Between the Two? M Conference University of Connecticut, May 2-22, 2 bkeller2@asu.edu INTRODUCTION More and more researchers
CHAPTER 3. SPECIALIZED EXTENSIONS
 03-Preacher-45609:03-Preacher-45609.qxd 6/3/2008 3:36 PM Page 57 CHAPTER 3. SPECIALIZED EXTENSIONS We have by no means exhausted the possibilities of LGM with the examples presented thus far. As scientific
SEM Day 1 Lab Exercises SPIDA 2007 Dave Flora
 SEM Day 1 Lab Exercises SPIDA 2007 Dave Flora 1 Today we will see how to estimate CFA models and interpret output using both SAS and LISREL. In SAS, commands for specifying SEMs are given using linear
Running head: AUTOCORRELATION IN THE COFM. The Effects of Autocorrelation on the Curve-of-Factors Growth Model
 Autocorrelation in the COFM 1 Running head: AUTOCORRELATION IN THE COFM The Effects of Autocorrelation on the Curve-of-Factors Growth Model Daniel L. Murphy Pearson S. Natasha Beretvas and Keenan A. Pituch
Misspecification in Nonrecursive SEMs 1. Nonrecursive Latent Variable Models under Misspecification
 Misspecification in Nonrecursive SEMs 1 Nonrecursive Latent Variable Models under Misspecification Misspecification in Nonrecursive SEMs 2 Abstract A problem central to structural equation modeling is
The Biasing Effects of Unmodeled ARMA Time Series Processes on Latent Growth Curve Model Estimates
 STRUCTURAL EQUATION MODELING, 12(2), 215 231 Copyright 2005, Lawrence Erlbaum Associates, Inc. The Biasing Effects of Unmodeled ARMA Time Series Processes on Latent Growth Curve Model Estimates Stephen
Functioning of global fit statistics in latent growth curve modeling
 University of Northern Colorado Scholarship & Creative Works @ Digital UNC Dissertations Student Research 12-1-2009 Functioning of global fit statistics in latent growth curve modeling Kathryn K. DeRoche
RANDOM INTERCEPT ITEM FACTOR ANALYSIS. IE Working Paper MK8-102-I 02 / 04 / Alberto Maydeu Olivares
 RANDOM INTERCEPT ITEM FACTOR ANALYSIS IE Working Paper MK8-102-I 02 / 04 / 2003 Alberto Maydeu Olivares Instituto de Empresa Marketing Dept. C / María de Molina 11-15, 28006 Madrid España Alberto.Maydeu@ie.edu
Lecture notes I: Measurement invariance 1
 Lecture notes I: Measurement Invariance (RM20; Jelte Wicherts). 1 Lecture notes I: Measurement invariance 1 Literature. Mellenbergh, G. J. (1989). Item bias and item response theory. International Journal
1. A Brief History of Longitudinal Factor Analysis
 Factor Analysis in Longitudinal and Repeated Measures Studies Jack McArdle, Psychology Dept., University of Virginia, Charlottesville, VA The Factor Analysis at 00 Meeting University of North Carolina,
SEM Day 3 Lab Exercises SPIDA 2007 Dave Flora
 SEM Day 3 Lab Exercises SPIDA 2007 Dave Flora 1 Today we will see how to estimate SEM conditional latent trajectory models and interpret output using both SAS and LISREL. Exercise 1 Using SAS PROC CALIS,
Model Fit and Interpretation of Non-Linear Latent Growth Curve Models. Greg W. Welch. B.A., University of Wyoming, 2000
 Model Fit and Interpretation of Non-Linear Latent Growth Curve Models by Greg W. Welch B.A., University of Wyoming, 000 M.S., University of Wyoming, 005 M.A., University of Pittsburgh, 005 Submitted to
Multilevel Analysis of Grouped and Longitudinal Data
 Multilevel Analysis of Grouped and Longitudinal Data Joop J. Hox Utrecht University Second draft, to appear in: T.D. Little, K.U. Schnabel, & J. Baumert (Eds.). Modeling longitudinal and multiple-group
A Study of Statistical Power and Type I Errors in Testing a Factor Analytic. Model for Group Differences in Regression Intercepts
 A Study of Statistical Power and Type I Errors in Testing a Factor Analytic Model for Group Differences in Regression Intercepts by Margarita Olivera Aguilar A Thesis Presented in Partial Fulfillment of
THE IMPACT OF UNMODELED TIME SERIES PROCESSES IN WITHIN-SUBJECT RESIDUAL STRUCTURE IN CONDITIONAL LATENT GROWTH MODELING: A MONTE CARLO STUDY
 THE IMPACT OF UNMODELED TIME SERIES PROCESSES IN WITHIN-SUBJECT RESIDUAL STRUCTURE IN CONDITIONAL LATENT GROWTH MODELING: A MONTE CARLO STUDY By YUYING SHI A DISSERTATION PRESENTED TO THE GRADUATE SCHOOL
Testing and Interpreting Interaction Effects in Multilevel Models
 Testing and Interpreting Interaction Effects in Multilevel Models Joseph J. Stevens University of Oregon and Ann C. Schulte Arizona State University Presented at the annual AERA conference, Washington,
Comparing Change Scores with Lagged Dependent Variables in Models of the Effects of Parents Actions to Modify Children's Problem Behavior
 Comparing Change Scores with Lagged Dependent Variables in Models of the Effects of Parents Actions to Modify Children's Problem Behavior David R. Johnson Department of Sociology and Haskell Sie Department
Research Design: Topic 18 Hierarchical Linear Modeling (Measures within Persons) 2010 R.C. Gardner, Ph.d.
 2010 R.C. Gardner, Ph.d.") Research Design: Topic 8 Hierarchical Linear Modeling (Measures within Persons) R.C. Gardner, Ph.d. General Rationale, Purpose, and Applications Linear Growth Models HLM can also be used with repeated
Research Design: Topic 8 Hierarchical Linear Modeling (Measures within Persons) R.C. Gardner, Ph.d. General Rationale, Purpose, and Applications Linear Growth Models HLM can also be used with repeated
STRUCTURAL EQUATION MODELING. Khaled Bedair Statistics Department Virginia Tech LISA, Summer 2013
 STRUCTURAL EQUATION MODELING Khaled Bedair Statistics Department Virginia Tech LISA, Summer 2013 Introduction: Path analysis Path Analysis is used to estimate a system of equations in which all of the
CENTERING IN MULTILEVEL MODELS. Consider the situation in which we have m groups of individuals, where
 CENTERING IN MULTILEVEL MODELS JAN DE LEEUW ABSTRACT. This is an entry for The Encyclopedia of Statistics in Behavioral Science, to be published by Wiley in 2005. Consider the situation in which we have
Time Metric in Latent Difference Score Models. Holly P. O Rourke
 Time Metric in Latent Difference Score Models by Holly P. O Rourke A Dissertation Presented in Partial Fulfillment of the Requirements for the Degree Doctor of Philosophy Approved June 2016 by the Graduate
Supplemental material for Autoregressive Latent Trajectory 1
 Supplemental material for Autoregressive Latent Trajectory 1 Supplemental Materials for The Longitudinal Interplay of Adolescents Self-Esteem and Body Image: A Conditional Autoregressive Latent Trajectory
Using Covariance Structure Analysis to Detect Correlates and Predictors of Individual Change Over Time
 QUATITATIVE METHODS IN PSYCHOLOGY Using Covariance Structure Analysis to Detect Correlates and Predictors of Individual Change Over Time John B. Willett and Aline G. Sayer Recently, methodologists have
A Threshold-Free Approach to the Study of the Structure of Binary Data
 International Journal of Statistics and Probability; Vol. 2, No. 2; 2013 ISSN 1927-7032 E-ISSN 1927-7040 Published by Canadian Center of Science and Education A Threshold-Free Approach to the Study of
Online Appendices for: Modeling Latent Growth With Multiple Indicators: A Comparison of Three Approaches
 Online Appendices for: Modeling Latent Growth With Multiple Indicators: A Comparison of Three Approaches Jacob Bishop and Christian Geiser Utah State University David A. Cole Vanderbilt University Contents
Testing Structural Equation Models: The Effect of Kurtosis
 Testing Structural Equation Models: The Effect of Kurtosis Tron Foss, Karl G Jöreskog & Ulf H Olsson Norwegian School of Management October 18, 2006 Abstract Various chi-square statistics are used for
Chapter 5. Introduction to Path Analysis. Overview. Correlation and causation. Specification of path models. Types of path models
 Chapter 5 Introduction to Path Analysis Put simply, the basic dilemma in all sciences is that of how much to oversimplify reality. Overview H. M. Blalock Correlation and causation Specification of path
SC705: Advanced Statistics Instructor: Natasha Sarkisian Class notes: Model Building Strategies
 SC705: Advanced Statistics Instructor: Natasha Sarkisian Class notes: Model Building Strategies Model Diagnostics The model diagnostics and improvement strategies discussed here apply to both measurement
LONGITUDINAL STUDIES OF ACHIEVEMENT GROWTH USING LATENT VARIABLE MODELING
 LONGITUDINAL STUDIES OF ACHIEVEMENT GROWTH USING LATENT VARIABLE MODELING BENGT O. MUTHI~N UNIVERSITY OF CALIFORNIA, LOS ANGELES SIEK-TOON KHO0 ARIZONA STATE UNIVERSITY ABSTRACT: This article gives a pedagogical
MICHAEL SCHREINER and KARL SCHWEIZER
 Review of Psychology, 2011, Vol. 18, No. 1, 3-11 UDC 159.9 The hypothesis-based investigation of patterns of relatedness by means of confirmatory factor models: The treatment levels of the Exchange Test
Exogenous Variables and Multiple Groups
 Exogenous Variables and Multiple Groups LGC -- Extension Variables McArdle & Epstein (1987) Growth Model with Exogenous Variable ω 0s z y0 * z ys * ω 0 ω s γ 01 1 γ s1 µ x γ 0x γ sx X σ x 2 y 0 1 1 1 1
WHAT IS STRUCTURAL EQUATION MODELING (SEM)?
?") WHAT IS STRUCTURAL EQUATION MODELING (SEM)? 1 LINEAR STRUCTURAL RELATIONS 2 Terminología LINEAR LATENT VARIABLE MODELS T.W. Anderson (1989), Journal of Econometrics MULTIVARIATE LINEAR RELATIONS T.W. Anderson
WHAT IS STRUCTURAL EQUATION MODELING (SEM)? 1 LINEAR STRUCTURAL RELATIONS 2 Terminología LINEAR LATENT VARIABLE MODELS T.W. Anderson (1989), Journal of Econometrics MULTIVARIATE LINEAR RELATIONS T.W. Anderson
Computationally Efficient Estimation of Multilevel High-Dimensional Latent Variable Models
 Computationally Efficient Estimation of Multilevel High-Dimensional Latent Variable Models Tihomir Asparouhov 1, Bengt Muthen 2 Muthen & Muthen 1 UCLA 2 Abstract Multilevel analysis often leads to modeling
Nesting and Equivalence Testing
 Nesting and Equivalence Testing Tihomir Asparouhov and Bengt Muthén August 13, 2018 Abstract In this note, we discuss the nesting and equivalence testing (NET) methodology developed in Bentler and Satorra
Overview of Talk. Motivating Example: Antisocial Behavior (AB) Raw Data
 Raw Data") An Evaluative Comparison of Random Coefficient Growth Models for Individual Development May 6, 7 Association for Psychological Science Overview of Talk Motivating example Definition of Random Coefficient
An Evaluative Comparison of Random Coefficient Growth Models for Individual Development May 6, 7 Association for Psychological Science Overview of Talk Motivating example Definition of Random Coefficient
INTRODUCTION TO STRUCTURAL EQUATION MODELS
 I. Description of the course. INTRODUCTION TO STRUCTURAL EQUATION MODELS A. Objectives and scope of the course. B. Logistics of enrollment, auditing, requirements, distribution of notes, access to programs.
RESMA course Introduction to LISREL. Harry Ganzeboom RESMA Data Analysis & Report #4 February
 RESMA course Introduction to LISREL Harry Ganzeboom RESMA Data Analysis & Report #4 February 17 2009 LISREL SEM: Simultaneous [Structural] Equations Model: A system of linear equations ( causal model )
Introduction to Structural Equation Modeling
 Introduction to Structural Equation Modeling Notes Prepared by: Lisa Lix, PhD Manitoba Centre for Health Policy Topics Section I: Introduction Section II: Review of Statistical Concepts and Regression
The aderoid factors in the development of the Kaliningrad region Pogrebnyakov, Pavel V.
 www.ssoar.info The aderoid factors in the development of the Kaliningrad region Pogrebnyakov, Pavel V. Veröffentlichungsversion / Published Version Zeitschriftenartikel / journal article Empfohlene Zitierung
SC705: Advanced Statistics Instructor: Natasha Sarkisian Class notes: Introduction to Structural Equation Modeling (SEM)
") SC705: Advanced Statistics Instructor: Natasha Sarkisian Class notes: Introduction to Structural Equation Modeling (SEM) SEM is a family of statistical techniques which builds upon multiple regression,
SC705: Advanced Statistics Instructor: Natasha Sarkisian Class notes: Introduction to Structural Equation Modeling (SEM) SEM is a family of statistical techniques which builds upon multiple regression,
A Simulation Paradigm for Evaluating. Approximate Fit. In Latent Variable Modeling.
 A Simulation Paradigm for Evaluating Approximate Fit In Latent Variable Modeling. Roger E. Millsap Arizona State University Talk given at the conference Current topics in the Theory and Application of
Estimation of nonlinear latent structural equation models using the extended unconstrained approach
 Review of Psychology, 009, Vol. 6, No., 3-3 UDC 59.9 Estimation of nonlinear latent structural equation models using the extended unconstrained approach AUGUSTIN KELAVA HOLGER BRANDT In the past two decades,
Citation for published version (APA): Jak, S. (2013). Cluster bias: Testing measurement invariance in multilevel data
: Jak, S. (2013). Cluster bias: Testing measurement invariance in multilevel data") UvA-DARE (Digital Academic Repository) Cluster bias: Testing measurement invariance in multilevel data Jak, S. Link to publication Citation for published version (APA): Jak, S. (2013). Cluster bias: Testing
UvA-DARE (Digital Academic Repository) Cluster bias: Testing measurement invariance in multilevel data Jak, S. Link to publication Citation for published version (APA): Jak, S. (2013). Cluster bias: Testing
Second-Order Latent Growth Models with Shifting Indicators
 Journal of Modern Applied Statistical Methods Volume 7 Issue Article 5 5--2008 Second-Order Latent Growth Models with Shifting Indicators Gregory R. Hancock University of Maryland, ghancock@umd.edu Michelle
Using Power Tables to Compute Statistical Power in Multilevel Experimental Designs
 A peer-reviewed electronic journal. Copyright is retained by the first or sole author, who grants right of first publication to the Practical Assessment, Research & Evaluation. Permission is granted to
General structural model Part 1: Covariance structure and identification. Psychology 588: Covariance structure and factor models
 General structural model Part 1: Covariance structure and identification Psychology 588: Covariance structure and factor models Latent variables 2 Interchangeably used: constructs --- substantively defined
Sum Scores in Twin Growth Curve Models: Practicality Versus Bias
 DOI 10.1007/s10519-017-9864-0 ORIGINAL RESEARCH Sum Scores in Twin Growth Curve Models: Practicality Versus Bias Justin M. Luningham 1 Daniel B. McArtor 1 Meike Bartels 2 Dorret I. Boomsma 2 Gitta H. Lubke
The Sensitivity of Confirmatory Factor Analytic Fit Indices to. Violations of Factorial Invariance across Latent Classes: A Simulation.
 The Sensitivity of Confirmatory Factor Analytic Fit Indices to Violations of Factorial Invariance across Latent Classes: A Simulation Study by Kimberly Carol Blackwell A Dissertation Presented in Partial
The Matrix Algebra of Sample Statistics
 The Matrix Algebra of Sample Statistics James H. Steiger Department of Psychology and Human Development Vanderbilt University James H. Steiger (Vanderbilt University) The Matrix Algebra of Sample Statistics
Chapter 8. Models with Structural and Measurement Components. Overview. Characteristics of SR models. Analysis of SR models. Estimation of SR models
 Chapter 8 Models with Structural and Measurement Components Good people are good because they've come to wisdom through failure. Overview William Saroyan Characteristics of SR models Estimation of SR models
Paloma Bernal Turnes. George Washington University, Washington, D.C., United States; Rey Juan Carlos University, Madrid, Spain.
 China-USA Business Review, January 2016, Vol. 15, No. 1, 1-13 doi: 10.17265/1537-1514/2016.01.001 D DAVID PUBLISHING The Use of Longitudinal Mediation Models for Testing Causal Effects and Measuring Direct
ABSTRACT. Chair, Dr. Gregory R. Hancock, Department of. interactions as a function of the size of the interaction effect, sample size, the loadings of
 ABSTRACT Title of Document: A COMPARISON OF METHODS FOR TESTING FOR INTERACTION EFFECTS IN STRUCTURAL EQUATION MODELING Brandi A. Weiss, Doctor of Philosophy, 00 Directed By: Chair, Dr. Gregory R. Hancock,
The Specification of Causal Models with Tetrad IV: A Review
 Structural Equation Modeling, 17:703 711, 2010 Copyright Taylor & Francis Group, LLC ISSN: 1070-5511 print/1532-8007 online DOI: 10.1080/10705511.2010.510074 SOFTWARE REVIEW The Specification of Causal
An Efficient State Space Approach to Estimate Univariate and Multivariate Multilevel Regression Models
 An Efficient State Space Approach to Estimate Univariate and Multivariate Multilevel Regression Models Fei Gu Kristopher J. Preacher Wei Wu 05/21/2013 Overview Introduction: estimate MLM as SEM (Bauer,
Can Variances of Latent Variables be Scaled in Such a Way That They Correspond to Eigenvalues?
 International Journal of Statistics and Probability; Vol. 6, No. 6; November 07 ISSN 97-703 E-ISSN 97-7040 Published by Canadian Center of Science and Education Can Variances of Latent Variables be Scaled
Centering Predictor and Mediator Variables in Multilevel and Time-Series Models
 Centering Predictor and Mediator Variables in Multilevel and Time-Series Models Tihomir Asparouhov and Bengt Muthén Part 2 May 7, 2018 Tihomir Asparouhov and Bengt Muthén Part 2 Muthén & Muthén 1/ 42 Overview
Measurement Invariance (MI) in CFA and Differential Item Functioning (DIF) in IRT/IFA
 in CFA and Differential Item Functioning (DIF) in IRT/IFA") Topics: Measurement Invariance (MI) in CFA and Differential Item Functioning (DIF) in IRT/IFA What are MI and DIF? Testing measurement invariance in CFA Testing differential item functioning in IRT/IFA
Topics: Measurement Invariance (MI) in CFA and Differential Item Functioning (DIF) in IRT/IFA What are MI and DIF? Testing measurement invariance in CFA Testing differential item functioning in IRT/IFA
ROBUSTNESS OF MULTILEVEL PARAMETER ESTIMATES AGAINST SMALL SAMPLE SIZES
 ROBUSTNESS OF MULTILEVEL PARAMETER ESTIMATES AGAINST SMALL SAMPLE SIZES Cora J.M. Maas 1 Utrecht University, The Netherlands Joop J. Hox Utrecht University, The Netherlands In social sciences, research
Evaluating the Sensitivity of Goodness-of-Fit Indices to Data Perturbation: An Integrated MC-SGR Approach
 Evaluating the Sensitivity of Goodness-of-Fit Indices to Data Perturbation: An Integrated MC-SGR Approach Massimiliano Pastore 1 and Luigi Lombardi 2 1 Department of Psychology University of Cagliari Via
Thursday Morning. Growth Modelling in Mplus. Using a set of repeated continuous measures of bodyweight
 Thursday Morning Growth Modelling in Mplus Using a set of repeated continuous measures of bodyweight 1 Growth modelling Continuous Data Mplus model syntax refresher ALSPAC Confirmatory Factor Analysis
Estimation of Curvilinear Effects in SEM. Rex B. Kline, September 2009
 Estimation of Curvilinear Effects in SEM Supplement to Principles and Practice of Structural Equation Modeling (3rd ed.) Rex B. Kline, September 009 Curvlinear Effects of Observed Variables Consider the
Psychological Methods
 Psychological Methods A Cautionary Note on Modeling Growth Trends in Longitudinal Data Goran Kuljanin, Michael T. Braun, and Richard P. DeShon Online First Publication, April 5, 011. doi: 10.1037/a003348
ADVANCED C. MEASUREMENT INVARIANCE SEM REX B KLINE CONCORDIA
 ADVANCED SEM C. MEASUREMENT INVARIANCE REX B KLINE CONCORDIA C C2 multiple model 2 data sets simultaneous C3 multiple 2 populations 2 occasions 2 methods C4 multiple unstandardized constrain to equal fit
Three-Level Modeling for Factorial Experiments With Experimentally Induced Clustering
 Three-Level Modeling for Factorial Experiments With Experimentally Induced Clustering John J. Dziak The Pennsylvania State University Inbal Nahum-Shani The University of Michigan Copyright 016, Penn State.
Supplemental material to accompany Preacher and Hayes (2008)
") Supplemental material to accompany Preacher and Hayes (2008) Kristopher J. Preacher University of Kansas Andrew F. Hayes The Ohio State University The multivariate delta method for deriving the asymptotic
Supplemental material to accompany Preacher and Hayes (2008) Kristopher J. Preacher University of Kansas Andrew F. Hayes The Ohio State University The multivariate delta method for deriving the asymptotic
Hypothesis Testing for Var-Cov Components
 Hypothesis Testing for Var-Cov Components When the specification of coefficients as fixed, random or non-randomly varying is considered, a null hypothesis of the form is considered, where Additional output
What is Structural Equation Modelling?
 methods@manchester What is Structural Equation Modelling? Nick Shryane Institute for Social Change University of Manchester 1 Topics Where SEM fits in the families of statistical models Causality SEM is
Mplus Short Courses Day 2. Growth Modeling With Latent Variables Using Mplus
 Mplus Short Courses Day 2 Growth Modeling With Latent Variables Using Mplus Linda K. Muthén Bengt Muthén Copyright 2007 Muthén & Muthén www.statmodel.com 1 Table Of Contents General Latent Variable Modeling
A Practitioner s Guide to Generalized Linear Models
 A Practitioners Guide to Generalized Linear Models Background The classical linear models and most of the minimum bias procedures are special cases of generalized linear models (GLMs). GLMs are more technically
Structural Equation Modeling and Confirmatory Factor Analysis. Types of Variables
 /4/04 Structural Equation Modeling and Confirmatory Factor Analysis Advanced Statistics for Researchers Session 3 Dr. Chris Rakes Website: http://csrakes.yolasite.com Email: Rakes@umbc.edu Twitter: @RakesChris
Using Mplus individual residual plots for. diagnostics and model evaluation in SEM
 Using Mplus individual residual plots for diagnostics and model evaluation in SEM Tihomir Asparouhov and Bengt Muthén Mplus Web Notes: No. 20 October 31, 2017 1 Introduction A variety of plots are available
Factor Analysis. Qian-Li Xue
 Factor Analysis Qian-Li Xue Biostatistics Program Harvard Catalyst The Harvard Clinical & Translational Science Center Short course, October 7, 06 Well-used latent variable models Latent variable scale
Exploiting TIMSS and PIRLS combined data: multivariate multilevel modelling of student achievement
 Exploiting TIMSS and PIRLS combined data: multivariate multilevel modelling of student achievement Second meeting of the FIRB 2012 project Mixture and latent variable models for causal-inference and analysis
Latent variable interactions
 Latent variable interactions Bengt Muthén & Tihomir Asparouhov Mplus www.statmodel.com November 2, 2015 1 1 Latent variable interactions Structural equation modeling with latent variable interactions has
Model fit evaluation in multilevel structural equation models
 Model fit evaluation in multilevel structural equation models Ehri Ryu Journal Name: Frontiers in Psychology ISSN: 1664-1078 Article type: Review Article Received on: 0 Sep 013 Accepted on: 1 Jan 014 Provisional
An Introduction to Mplus and Path Analysis
 An Introduction to Mplus and Path Analysis PSYC 943: Fundamentals of Multivariate Modeling Lecture 10: October 30, 2013 PSYC 943: Lecture 10 Today s Lecture Path analysis starting with multivariate regression
Assessing Factorial Invariance in Ordered-Categorical Measures
 Multivariate Behavioral Research, 39 (3), 479-515 Copyright 2004, Lawrence Erlbaum Associates, Inc. Assessing Factorial Invariance in Ordered-Categorical Measures Roger E. Millsap and Jenn Yun-Tein Arizona
Course title SD206. Introduction to Structural Equation Modelling
 10 th ECPR Summer School in Methods and Techniques, 23 July - 8 August University of Ljubljana, Slovenia Course Description Form 1-2 week course (30 hrs) Course title SD206. Introduction to Structural
Structural Equation Modeling Lab 5 In Class Modification Indices Example
 Structural Equation Modeling Lab 5 In Class Modification Indices Example. Model specifications sntax TI Modification Indices DA NI=0 NO=0 MA=CM RA FI='E:\Teaching\SEM S09\Lab 5\jsp6.psf' SE 7 6 5 / MO
Advanced Structural Equations Models I
 This work is licensed under a Creative Commons Attribution-NonCommercial-ShareAlike License. Your use of this material constitutes acceptance of that license and the conditions of use of materials on this
Supplementary materials for: Exploratory Structural Equation Modeling
 Supplementary materials for: Exploratory Structural Equation Modeling To appear in Hancock, G. R., & Mueller, R. O. (Eds.). (2013). Structural equation modeling: A second course (2nd ed.). Charlotte, NC:
Path Analysis. PRE 906: Structural Equation Modeling Lecture #5 February 18, PRE 906, SEM: Lecture 5 - Path Analysis
 Path Analysis PRE 906: Structural Equation Modeling Lecture #5 February 18, 2015 PRE 906, SEM: Lecture 5 - Path Analysis Key Questions for Today s Lecture What distinguishes path models from multivariate
Modelling heterogeneous variance-covariance components in two-level multilevel models with application to school effects educational research
 Modelling heterogeneous variance-covariance components in two-level multilevel models with application to school effects educational research Research Methods Festival Oxford 9 th July 014 George Leckie
STAT 730 Chapter 9: Factor analysis
 STAT 730 Chapter 9: Factor analysis Timothy Hanson Department of Statistics, University of South Carolina Stat 730: Multivariate Data Analysis 1 / 15 Basic idea Factor analysis attempts to explain the
Longitudinal Invariance CFA (using MLR) Example in Mplus v. 7.4 (N = 151; 6 items over 3 occasions)
 Example in Mplus v. 7.4 (N = 151; 6 items over 3 occasions)") Longitudinal Invariance CFA (using MLR) Example in Mplus v. 7.4 (N = 151; 6 items over 3 occasions) CLP 948 Example 7b page 1 These data measuring a latent trait of social functioning were collected at
Longitudinal Invariance CFA (using MLR) Example in Mplus v. 7.4 (N = 151; 6 items over 3 occasions) CLP 948 Example 7b page 1 These data measuring a latent trait of social functioning were collected at
Factor analysis. George Balabanis
 Factor analysis George Balabanis Key Concepts and Terms Deviation. A deviation is a value minus its mean: x - mean x Variance is a measure of how spread out a distribution is. It is computed as the average
Consequences of measurement error. Psychology 588: Covariance structure and factor models
 Consequences of measurement error Psychology 588: Covariance structure and factor models Scaling indeterminacy of latent variables Scale of a latent variable is arbitrary and determined by a convention
Investigating Population Heterogeneity With Factor Mixture Models
 Psychological Methods 2005, Vol. 10, No. 1, 21 39 Copyright 2005 by the American Psychological Association 1082-989X/05/$12.00 DOI: 10.1037/1082-989X.10.1.21 Investigating Population Heterogeneity With
CHAPTER 9 EXAMPLES: MULTILEVEL MODELING WITH COMPLEX SURVEY DATA
 Examples: Multilevel Modeling With Complex Survey Data CHAPTER 9 EXAMPLES: MULTILEVEL MODELING WITH COMPLEX SURVEY DATA Complex survey data refers to data obtained by stratification, cluster sampling and/or
Online Appendix for Sterba, S.K. (2013). Understanding linkages among mixture models. Multivariate Behavioral Research, 48,
. Understanding linkages among mixture models. Multivariate Behavioral Research, 48,") Online Appendix for, S.K. (2013). Understanding linkages among mixture models. Multivariate Behavioral Research, 48, 775-815. Table of Contents. I. Full presentation of parallel-process groups-based trajectory
Online Appendix for, S.K. (2013). Understanding linkages among mixture models. Multivariate Behavioral Research, 48, 775-815. Table of Contents. I. Full presentation of parallel-process groups-based trajectory
Estimating Multilevel Linear Models as Structural Equation Models
 Bauer & Curran, Psychometric Society Paper Presentation, 6/2/02 Estimating Multilevel Linear Models as Structural Equation Models Daniel J. Bauer North Carolina State University Patrick J. Curran University
Time-Invariant Predictors in Longitudinal Models
 Time-Invariant Predictors in Longitudinal Models Today s Topics: What happens to missing predictors Effects of time-invariant predictors Fixed vs. systematically varying vs. random effects Model building
SRMR in Mplus. Tihomir Asparouhov and Bengt Muthén. May 2, 2018
 SRMR in Mplus Tihomir Asparouhov and Bengt Muthén May 2, 2018 1 Introduction In this note we describe the Mplus implementation of the SRMR standardized root mean squared residual) fit index for the models
Confirmatory Factor Analysis: Model comparison, respecification, and more. Psychology 588: Covariance structure and factor models
 Confirmatory Factor Analysis: Model comparison, respecification, and more Psychology 588: Covariance structure and factor models Model comparison 2 Essentially all goodness of fit indices are descriptive,