Testing and Interpreting Interaction Effects in Multilevel Models
|
|
|
- Nancy Byrd
- 6 years ago
- Views:
Transcription

1 Testing and Interpreting Interaction Effects in Multilevel Models Joseph J. Stevens University of Oregon and Ann C. Schulte Arizona State University Presented at the annual AERA conference, Washington, DC, April, 2016 Stevens,
2 Contact Information: Joseph Stevens, Ph.D. College of Education 5267 University of Oregon Eugene, OR (541) Presentation available on NCAASE web site: This research was funded in part by a Cooperative Service Agreement from the Institute of Education Sciences (IES) establishing the National Center on Assessment and Accountability for Special Education NCAASE (PR/Award Number R324C110004); the findings and conclusions expressed do not necessarily represent the views or opinions of the U.S. Department of Education. 2
3 Presentation Purpose Demonstrate analysis and interpretation of interactions in multilevel models (MLM) Cross-level interactions of predictors at one level moderating growth parameters at a lower level Product term interactions at same level and across levels Results of our studies of mathematics achievement growth for students with learning disabilities (LD) and general education (GE) students used as illustrations Does LD status at level-2 interact with level-1 growth parameters (twoway, cross-level interaction)? Do student socio-demographic characteristics interact with LD status? Does the LD x Black race/ethnicity interaction at level-2 interact with level-1 growth parameters (three-way interaction)? 3
4 Cross-level Interactions in Multilevel Models While many MLM studies incorporate cross-level interactions, it is much less common for analysts to conduct complete post-hoc testing when interactions are significant Level-1 Model: Y ti = π 0i + π 1i *(Time ti ) + π 2i *(Time 2 ti) + e ti (1) Level-2 Model: π 0i = β 00 + β 01 *(Predictor i ) + r 0i (2) π 1i = β 10 + β 11 *(Predictor i ) + r 1i (3) π 2i = β 20 + β 21 *(Predictor i ) + r 2i (4) Mixed Model: Y ti = β 00 + β 01 *Predictor i + β 10 *Time ti + β 11 *Predictor i *Time ti + β 20 *Time 2 ti + β 21 *Predictor i *Time 2 ti + r 0i + r 1i *Time ti + r 2i *Time 2 ti + e ti (5) 4
5 Substantive Example: Interactions of Disability Status and Other Student Characteristics Many studies do not directly test the interaction of SWD status and other covariates thought to be related to student performance (e.g., LD status and sex of student) When these covariates are included as predictors (especially in regression and MLM models), only partial regression effects not the actual interactions are analyzed This can be very misleading and result in incorrect interpretations as well as incomplete understanding of group differences Interpretation also incomplete in MLM analyses when cross-level interactions are not probed and tested fully Stevens, J. J., & Schulte, A. C. (2016). The interaction of learning disability status and student demographic characteristics on mathematics growth. Journal of Learning Disabilities. DOI: /
6 Examples of Interaction Testing Student scores on the mathematics subtest of the Arizona Instrument to Measure Standards (AIMS) used to examine crosslevel interaction of level-2 LD status with level-1 growth parameters (Grades 3 to 5) Student scores on the mathematics subtest of the North Carolina state test used to demonstrate three-way interaction of level-2 LD x Black race/ethnicity with level-1 growth parameters Grades 3 to 7) Details on sample, methods and procedures available in full papers 6
7 Cross-level Interaction with Level-1 Growth Parameters When a level-2 predictor (e.g., LD status) is used to predict growth at level-1, a two-way, cross-level interaction is formed If the cross-level interaction is statistically significant, post-hoc tests needed to determine specific differences (e.g., between GE vs. LD groups? From one grade to another?) Equivalent to simple effects and simple slopes post hoc tests in ANOVA 7
8 Two-level Linear MLM Growth Model: AIMS Data Grades 3 to 5 Fixed Effect Coefficient SE t-ratio df p Intercept, β <0.001 LD, β <0.001 LD x Slope Cross-level Interaction LEP, β <0.001 LD X LEP, β <0.001 Slope, β <0.001 LD, β <0.001 LEP, β EB Means for the LD x Slope Cross-level Interaction LD X LEP, β Grade Group GE (39.92) (42.79) (45.72) LD (28.65) (31.03) (33.44) 8
9 Simple effects of slope for each separate group, horizontal analysis within each group Simple effects differences between the GE vs. LD trajectories, vertical analysis between groups at each time point Figure 1. Cross-level interaction of disability status and grade for the Arizona sample. 9
10 Simple effects of slope for each separate group Output provides test of simple slope for GE students, but need to test trajectory for LD students Simple effect of LD intercept or slope: t = β LD / SE βld Where general formula for SE at moderator value M is: SE β00ld = [SE 2 (β 00 ) + (2M)cov(β 00, β 11 ) + M 2 SE 2 (β 11 )] ½ Note. SE formula above for either continuous or dichotomous predictors; simplifies for dichotomous predictors. 10
11 Simple effect of intercept or slope for each separate group With our dichotomous moderator, when M = 1, intercept SE: Slope SE: SE β0,ld = [SE 2 (β 00 ) + 2cov(β 00, β 01 ) + SE 2 (β 01 )] ½ SE β1,ld = [SE 2 (β 10 ) + 2cov(β 10, β 11 ) + SE 2 (β 11 )] ½ Note. When M = 0, formulas simplify to SE β0,ge = [SE 2 (β 01 )] ½ or SE β1,ld = [SE 2 (β 01 )] ½. 11
12 Alpha Adjustment Repeated testing in post-hoc analysis can result in the inflation of Type I error (i.e., alpha slippage) We used Bonferroni's adjustment for post-hoc tests The nominal alpha level (.05) was divided by the number of tests within a family of comparisons (see Pedhazur, 1997, p. 435) to create a decision rule that took the number of comparisons tested into account
13 Simple Effects of GE vs. LD (Latent Class Analysis) Simple effect of GE vs. LD at selected time points (t ): Δ y = β 01 + β 11 (t) t Δy = Δ y / [SE 2 (β 01 ) + (2t)cov(β 01, β 11 ) + SE 2 (β 11 )] ½ When moderator is continuous, defines a region of significance where the two groups are significantly different (Potoff, 1964) 13
14 Example of MLM Three-way Interaction We were also interested in the product term interaction of student characteristics at level-2 (e.g., LD x Black race/ethnicity) and how those groups interacted with growth at level-1 To accomplish this we computed the product of the LD and Black dummy codes and then used LD, Black and LD x Black as predictors in a two-level MLM of NC math achievement growth The predictors were used to model all random growth parameters (intercept, linear change, curvilinear change) over five grades
15 MLM Curvilinear Growth Model with LD x Black Interaction Effect Fixed Effect Coefficient SE t df p Intercept, β <0.001 LD, β <0.001 BLACK, β <0.001 LDxBLACK, β Linear Slope, β <0.001 LD, β <0.001 BLACK, β <0.001 LDxBLACK, β Curvilinear, β <0.001 LD, β BLACK, β <0.001 LDxBLACK, β Note. Table presented for illustrative purposes. Complete results available in Stevens & Schulte (2016). 15
16 Conducting Statistical Tests Process is parallel to AIMS analysis above: Bonferroni-adjusted simple slope effects; each of the four interaction groups growth trajectories (see Figure below) calculated by rotating coding of the dichotomous predictors as described above Simple effect group differences, also a direct extension of presentation above (equivalent to a LCA with 3-way interactions) We also calculated pairwise comparisons of the four interaction groups at each point in time (Grade) to allow specific tests of group differences at each grade 16
17 Pairwise Comparisons of Group Differences at Each Grade Vertical comparisons of groups at each point in time: t = (β LDt - β Blackt ) / SE Group SE Group = [SE 2 (β LD ) + SE 2 (β Black ) - 2cov(β LD, β Black )] ½ 17
18 Level-2 Interaction Means In the MLM regression equation (LD, Black, and LD x Black, respectively), a 2 x 2 matrix of the interaction group means at each grade is: LD Status GE, 0 LD, 1 White, 0 β 0 β 0 + β LD Race/ ethnicity Black, 1 β 0 + β BL β 0 + β LD + β BL + β LDxBL There are six possible pairwise comparisons among these four interaction means (k[k-1]/2 = 4[3]/2 = 6) 18
19 Table of 3-Way EB Interaction Means Group Grade GE-White GE-Black LD-White LD-Black Six pairwise comparisons at each grade for each growth parameter. For example, at Grade 3 (wave 1), six comparisons of the four group intercepts (SE = ) LD-Black LD-White GE-Black GE-White GE-Black ns LD-White
20 Figure 2. Three-way interaction of LD status, black-white race/ethnicity, and grade for the North Carolina sample. 20
21 Brief Bibliography Aiken, L. S., & West, S. G. (1991). Multiple regression: Testing and interpreting interactions. Thousand Oaks, CA: Sage. Bauer, D. J., & Curran, P. J. (2005). Probing interactions in fixed and multilevel regression: Inferential and graphical techniques. Multivariate Behavioral Research, 40, Curran, P. J., Bauer, D. J, & Willoughby, M. T. (2004). Testing main effects and interactions in hierarchical linear growth models. Psychological Methods, 9, Hardy, M. A. (1993). Regression with dummy variables. Newbury Park, CA: Sage Publications. Hayes, A. F. (2013). Introduction to mediation, moderation, and conditional process analysis: A regression-based approach. New York, NY: Guilford Press. Jaccard, J., & Turrisi, R. (2003). Interaction effects in multiple regression (2nd ed.). Thousand Oaks, CA: Sage. Pedhazur, E. J. (1997). Multiple regression in behavioral research. Orlando, FL: Harcourt Brace. Potoff, R. (1964). On the Johnson-Neyman technique and some extensions thereof. Psychometrika, 29, Stevens, J. J., & Schulte, A. C. (2016). The interaction of learning disability status and student demographic characteristics on mathematics growth. Journal of Learning Disabilities. Advance online publication. doi: /
22 Software Support PROCESS software: Hayes, A. F. (2013). Introduction to mediation, moderation, and conditional process analysis: A regression-based approach. New York, NY: Guilford Press. Kristopher J. Preacher, interactive calculation tools for probing interactions in multiple linear regression, latent curve analysis, and hierarchical linear modeling: 22
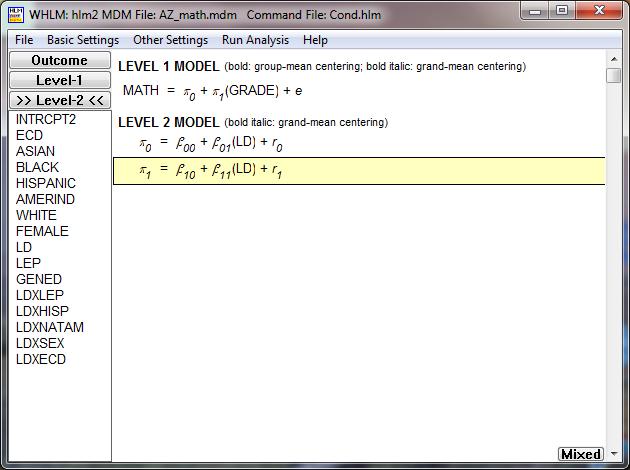
23 Appendices Comparison of partial and interaction effects HLM screens for obtaining variance-covariance matrix output variance-covariance matrix output for the HLM two-level AIMS model with LD status at level-2 23
24 Partial Effects vs. Interaction Effects Figure 1. Partial regression effects with the reference group (intercept) displayed in each panel and the partial effect of Black race/ethnicity on the left, LD status in the middle, and the LD x Black interaction effect on right.

25 HLM Screens Showing Request for Variance-covariance Matrix Output 25
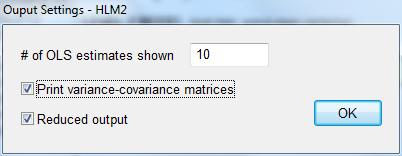
26 26
27 V-C Matrix Output for the AIMS Cross-level Interaction of LD Status with Intercept and Slope β00 LD, β01 β10 LD, β β00 LD, β01 β10 LD, β E E E E E E E E E E-002 r0 r1 LD0 LD1 r r LD LD Level-1,e
Multilevel Modeling: A Second Course
 Multilevel Modeling: A Second Course Kristopher Preacher, Ph.D. Upcoming Seminar: February 2-3, 2017, Ft. Myers, Florida What this workshop will accomplish I will review the basics of multilevel modeling
Research Design: Topic 18 Hierarchical Linear Modeling (Measures within Persons) 2010 R.C. Gardner, Ph.d.
 2010 R.C. Gardner, Ph.d.") Research Design: Topic 8 Hierarchical Linear Modeling (Measures within Persons) R.C. Gardner, Ph.d. General Rationale, Purpose, and Applications Linear Growth Models HLM can also be used with repeated
Research Design: Topic 8 Hierarchical Linear Modeling (Measures within Persons) R.C. Gardner, Ph.d. General Rationale, Purpose, and Applications Linear Growth Models HLM can also be used with repeated
Hierarchical Linear Models-Redux
 Hierarchical Linear Models-Redux Joseph Stevens, Ph.D., University of Oregon (541) 346-2445, stevensj@uoregon.edu Stevens, 2008 1 Overview and resources Overview Listserv: http://www.jiscmail.ac.uk/lists/multilevel.html
Mediation question: Does executive functioning mediate the relation between shyness and vocabulary? Plot data, descriptives, etc. Check for outliers
 Plot data, descriptives, etc. Check for outliers A. Nayena Blankson, Ph.D. Spelman College University of Southern California GC3 Lecture Series September 6, 2013 Treat missing i data Listwise Pairwise
Moderation & Mediation in Regression. Pui-Wa Lei, Ph.D Professor of Education Department of Educational Psychology, Counseling, and Special Education
 Moderation & Mediation in Regression Pui-Wa Lei, Ph.D Professor of Education Department of Educational Psychology, Counseling, and Special Education Introduction Mediation and moderation are used to understand
Data Analysis as a Decision Making Process
 Data Analysis as a Decision Making Process I. Levels of Measurement A. NOIR - Nominal Categories with names - Ordinal Categories with names and a logical order - Intervals Numerical Scale with logically
Lecture (chapter 13): Association between variables measured at the interval-ratio level
: Association between variables measured at the interval-ratio level") Lecture (chapter 13): Association between variables measured at the interval-ratio level Ernesto F. L. Amaral April 9 11, 2018 Advanced Methods of Social Research (SOCI 420) Source: Healey, Joseph F. 2015.
Lecture (chapter 13): Association between variables measured at the interval-ratio level Ernesto F. L. Amaral April 9 11, 2018 Advanced Methods of Social Research (SOCI 420) Source: Healey, Joseph F. 2015.
Technical Appendix C: Methods
 Technical Appendix C: Methods As not all readers may be familiar with the multilevel analytical methods used in this study, a brief note helps to clarify the techniques. The general theory developed in
Specifying Latent Curve and Other Growth Models Using Mplus. (Revised )
") Ronald H. Heck 1 University of Hawai i at Mānoa Handout #20 Specifying Latent Curve and Other Growth Models Using Mplus (Revised 12-1-2014) The SEM approach offers a contrasting framework for use in analyzing
Ronald H. Heck 1 University of Hawai i at Mānoa Handout #20 Specifying Latent Curve and Other Growth Models Using Mplus (Revised 12-1-2014) The SEM approach offers a contrasting framework for use in analyzing
Technical Appendix C: Methods. Multilevel Regression Models
 Technical Appendix C: Methods Multilevel Regression Models As not all readers may be familiar with the analytical methods used in this study, a brief note helps to clarify the techniques. The firewall
Time Metric in Latent Difference Score Models. Holly P. O Rourke
 Time Metric in Latent Difference Score Models by Holly P. O Rourke A Dissertation Presented in Partial Fulfillment of the Requirements for the Degree Doctor of Philosophy Approved June 2016 by the Graduate
An Efficient State Space Approach to Estimate Univariate and Multivariate Multilevel Regression Models
 An Efficient State Space Approach to Estimate Univariate and Multivariate Multilevel Regression Models Fei Gu Kristopher J. Preacher Wei Wu 05/21/2013 Overview Introduction: estimate MLM as SEM (Bauer,
Categorical Predictor Variables
 Categorical Predictor Variables We often wish to use categorical (or qualitative) variables as covariates in a regression model. For binary variables (taking on only 2 values, e.g. sex), it is relatively
Goals for the Morning
 Introduction to Growth Curve Modeling: An Overview and Recommendations for Practice Patrick J. Curran & Daniel J. Bauer University of North Carolina at Chapel Hill Goals for the Morning Brief review of
Jason W. Miller a, William R. Stromeyer b & Matthew A. Schwieterman a a Department of Marketing & Logistics, The Ohio
 This article was downloaded by: [New York University] On: 16 July 2014, At: 12:57 Publisher: Routledge Informa Ltd Registered in England and Wales Registered Number: 1072954 Registered office: Mortimer
HLM Models and Type VI Errors
 Models and Type VI Errors Understanding Models and Type VI Errors: The Need for Reflection Susan M. Tracz Isadore Newman David O. Newman California State University, Fresno Florida International University
Correlation and Regression Bangkok, 14-18, Sept. 2015
 Analysing and Understanding Learning Assessment for Evidence-based Policy Making Correlation and Regression Bangkok, 14-18, Sept. 2015 Australian Council for Educational Research Correlation The strength
Testing Main Effects and Interactions in Latent Curve Analysis
 Psychological Methods 2004, Vol. 9, No. 2, 220 237 Copyright 2004 by the American Psychological Association 1082-989X/04/$12.00 DOI: 10.1037/1082-989X.9.2.220 Testing Main Effects and Interactions in Latent
Outline
 2559 Outline cvonck@111zeelandnet.nl 1. Review of analysis of variance (ANOVA), simple regression analysis (SRA), and path analysis (PA) 1.1 Similarities and differences between MRA with dummy variables
The Application and Promise of Hierarchical Linear Modeling (HLM) in Studying First-Year Student Programs
 in Studying First-Year Student Programs") The Application and Promise of Hierarchical Linear Modeling (HLM) in Studying First-Year Student Programs Chad S. Briggs, Kathie Lorentz & Eric Davis Education & Outreach University Housing Southern Illinois
The Application and Promise of Hierarchical Linear Modeling (HLM) in Studying First-Year Student Programs Chad S. Briggs, Kathie Lorentz & Eric Davis Education & Outreach University Housing Southern Illinois
Time-Invariant Predictors in Longitudinal Models
 Time-Invariant Predictors in Longitudinal Models Today s Class (or 3): Summary of steps in building unconditional models for time What happens to missing predictors Effects of time-invariant predictors
This is the publisher s copyrighted version of this article.
 Archived at the Flinders Academic Commons http://dspace.flinders.edu.au/dspace/ This is the publisher s copyrighted version of this article. The original can be found at: http://iej.cjb.net International
Workshop Research Methods and Statistical Analysis
 Workshop Research Methods and Statistical Analysis Session 2 Data Analysis Sandra Poeschl 08.04.2013 Page 1 Research process Research Question State of Research / Theoretical Background Design Data Collection
Hacking PROCESS for Estimation and Probing of Linear Moderation of Quadratic Effects and Quadratic Moderation of Linear Effects
 Hacking PROCESS for Estimation and Probing of Linear Moderation of Quadratic Effects and Quadratic Moderation of Linear Effects Andrew F. Hayes The Ohio State University Unpublished White Paper, DRAFT
Review of Multiple Regression
 Ronald H. Heck 1 Let s begin with a little review of multiple regression this week. Linear models [e.g., correlation, t-tests, analysis of variance (ANOVA), multiple regression, path analysis, multivariate
Mplus Code Corresponding to the Web Portal Customization Example
 Online supplement to Hayes, A. F., & Preacher, K. J. (2014). Statistical mediation analysis with a multicategorical independent variable. British Journal of Mathematical and Statistical Psychology, 67,
Formula for the t-test
 Formula for the t-test: How the t-test Relates to the Distribution of the Data for the Groups Formula for the t-test: Formula for the Standard Error of the Difference Between the Means Formula for the
Warner, R. M. (2008). Applied Statistics: From bivariate through multivariate techniques. Thousand Oaks: Sage.
. Applied Statistics: From bivariate through multivariate techniques. Thousand Oaks: Sage.") Errata for Warner, R. M. (2008). Applied Statistics: From bivariate through multivariate techniques. Thousand Oaks: Sage. Most recent update: March 4, 2009 Please send information about any errors in the
Errata for Warner, R. M. (2008). Applied Statistics: From bivariate through multivariate techniques. Thousand Oaks: Sage. Most recent update: March 4, 2009 Please send information about any errors in the
Computational Procedures for Probing Interactions in OLS and Logistic Regression: SPSS and SAS Implementations. Andrew F. Hayes
 MODPROBE 1 This manuscript was accepted for publication in Behavior Research Methods on 4 March 2009. The copyright is held by Psychonomic Society Publications. This document may not exactly correspond
A Study of Statistical Power and Type I Errors in Testing a Factor Analytic. Model for Group Differences in Regression Intercepts
 A Study of Statistical Power and Type I Errors in Testing a Factor Analytic Model for Group Differences in Regression Intercepts by Margarita Olivera Aguilar A Thesis Presented in Partial Fulfillment of
DETAILED CONTENTS PART I INTRODUCTION AND DESCRIPTIVE STATISTICS. 1. Introduction to Statistics
 DETAILED CONTENTS About the Author Preface to the Instructor To the Student How to Use SPSS With This Book PART I INTRODUCTION AND DESCRIPTIVE STATISTICS 1. Introduction to Statistics 1.1 Descriptive and
Utilizing Hierarchical Linear Modeling in Evaluation: Concepts and Applications
 Utilizing Hierarchical Linear Modeling in Evaluation: Concepts and Applications C.J. McKinney, M.A. Antonio Olmos, Ph.D. Kate DeRoche, M.A. Mental Health Center of Denver Evaluation 2007: Evaluation and
Washington State Test
 Technical Report # 1101 easycbm Reading Criterion Related Validity Evidence: Washington State Test 2009-2010 Daniel Anderson Julie Alonzo Gerald Tindal University of Oregon Published by Behavioral Research
Assessing the relation between language comprehension and performance in general chemistry. Appendices
 Assessing the relation between language comprehension and performance in general chemistry Daniel T. Pyburn a, Samuel Pazicni* a, Victor A. Benassi b, and Elizabeth E. Tappin c a Department of Chemistry,
DESIGNING EXPERIMENTS AND ANALYZING DATA A Model Comparison Perspective
 DESIGNING EXPERIMENTS AND ANALYZING DATA A Model Comparison Perspective Second Edition Scott E. Maxwell Uniuersity of Notre Dame Harold D. Delaney Uniuersity of New Mexico J,t{,.?; LAWRENCE ERLBAUM ASSOCIATES,
Time Invariant Predictors in Longitudinal Models
 Time Invariant Predictors in Longitudinal Models Longitudinal Data Analysis Workshop Section 9 University of Georgia: Institute for Interdisciplinary Research in Education and Human Development Section
Hierarchical Generalized Linear Models. ERSH 8990 REMS Seminar on HLM Last Lecture!
 Hierarchical Generalized Linear Models ERSH 8990 REMS Seminar on HLM Last Lecture! Hierarchical Generalized Linear Models Introduction to generalized models Models for binary outcomes Interpreting parameter
Designing Multilevel Models Using SPSS 11.5 Mixed Model. John Painter, Ph.D.
 Designing Multilevel Models Using SPSS 11.5 Mixed Model John Painter, Ph.D. Jordan Institute for Families School of Social Work University of North Carolina at Chapel Hill 1 Creating Multilevel Models
Daniel Boduszek University of Huddersfield
 Daniel Boduszek University of Huddersfield d.boduszek@hud.ac.uk Introduction to moderator effects Hierarchical Regression analysis with continuous moderator Hierarchical Regression analysis with categorical
Area1 Scaled Score (NAPLEX) .535 ** **.000 N. Sig. (2-tailed)
 .535 ** **.000 N. Sig. (2-tailed)") Institutional Assessment Report Texas Southern University College of Pharmacy and Health Sciences "An Analysis of 2013 NAPLEX, P4-Comp. Exams and P3 courses The following analysis illustrates relationships
Institutional Assessment Report Texas Southern University College of Pharmacy and Health Sciences "An Analysis of 2013 NAPLEX, P4-Comp. Exams and P3 courses The following analysis illustrates relationships
Ann Lazar
 Ann Lazar ann.lazar@ucsf.edu Department of Preventive and Restorative Dental Sciences Department of Epidemiology and Biostatistics University of California, San Francisco February 21, 2014 Motivation Rheumatoid
Models for Clustered Data
 Models for Clustered Data Edps/Psych/Soc 589 Carolyn J Anderson Department of Educational Psychology c Board of Trustees, University of Illinois Spring 2019 Outline Notation NELS88 data Fixed Effects ANOVA
Models for Clustered Data
 Models for Clustered Data Edps/Psych/Stat 587 Carolyn J Anderson Department of Educational Psychology c Board of Trustees, University of Illinois Fall 2017 Outline Notation NELS88 data Fixed Effects ANOVA
Supplemental material to accompany Preacher and Hayes (2008)
") Supplemental material to accompany Preacher and Hayes (2008) Kristopher J. Preacher University of Kansas Andrew F. Hayes The Ohio State University The multivariate delta method for deriving the asymptotic
Supplemental material to accompany Preacher and Hayes (2008) Kristopher J. Preacher University of Kansas Andrew F. Hayes The Ohio State University The multivariate delta method for deriving the asymptotic
An Introduction to Multilevel Models. PSYC 943 (930): Fundamentals of Multivariate Modeling Lecture 25: December 7, 2012
: Fundamentals of Multivariate Modeling Lecture 25: December 7, 2012") An Introduction to Multilevel Models PSYC 943 (930): Fundamentals of Multivariate Modeling Lecture 25: December 7, 2012 Today s Class Concepts in Longitudinal Modeling Between-Person vs. +Within-Person
An Introduction to Multilevel Models PSYC 943 (930): Fundamentals of Multivariate Modeling Lecture 25: December 7, 2012 Today s Class Concepts in Longitudinal Modeling Between-Person vs. +Within-Person
MLMED. User Guide. Nicholas J. Rockwood The Ohio State University Beta Version May, 2017
 MLMED User Guide Nicholas J. Rockwood The Ohio State University rockwood.19@osu.edu Beta Version May, 2017 MLmed is a computational macro for SPSS that simplifies the fitting of multilevel mediation and
One-Way ANOVA. Some examples of when ANOVA would be appropriate include:
 One-Way ANOVA 1. Purpose Analysis of variance (ANOVA) is used when one wishes to determine whether two or more groups (e.g., classes A, B, and C) differ on some outcome of interest (e.g., an achievement
SC705: Advanced Statistics Instructor: Natasha Sarkisian Class notes: Introduction to Structural Equation Modeling (SEM)
") SC705: Advanced Statistics Instructor: Natasha Sarkisian Class notes: Introduction to Structural Equation Modeling (SEM) SEM is a family of statistical techniques which builds upon multiple regression,
SC705: Advanced Statistics Instructor: Natasha Sarkisian Class notes: Introduction to Structural Equation Modeling (SEM) SEM is a family of statistical techniques which builds upon multiple regression,
Longitudinal and Panel Data: Analysis and Applications for the Social Sciences. Table of Contents
 Longitudinal and Panel Data Preface / i Longitudinal and Panel Data: Analysis and Applications for the Social Sciences Table of Contents August, 2003 Table of Contents Preface i vi 1. Introduction 1.1
I L L I N O I S UNIVERSITY OF ILLINOIS AT URBANA-CHAMPAIGN
 Introduction Edps/Psych/Stat/ 584 Applied Multivariate Statistics Carolyn J Anderson Department of Educational Psychology I L L I N O I S UNIVERSITY OF ILLINOIS AT URBANA-CHAMPAIGN c Board of Trustees,
NELS 88. Latent Response Variable Formulation Versus Probability Curve Formulation
 NELS 88 Table 2.3 Adjusted odds ratios of eighth-grade students in 988 performing below basic levels of reading and mathematics in 988 and dropping out of school, 988 to 990, by basic demographics Variable
Dyadic Data Analysis. Richard Gonzalez University of Michigan. September 9, 2010
 Dyadic Data Analysis Richard Gonzalez University of Michigan September 9, 2010 Dyadic Component 1. Psychological rationale for homogeneity and interdependence 2. Statistical framework that incorporates
Investigating Models with Two or Three Categories
 Ronald H. Heck and Lynn N. Tabata 1 Investigating Models with Two or Three Categories For the past few weeks we have been working with discriminant analysis. Let s now see what the same sort of model might
CENTERING IN MULTILEVEL MODELS. Consider the situation in which we have m groups of individuals, where
 CENTERING IN MULTILEVEL MODELS JAN DE LEEUW ABSTRACT. This is an entry for The Encyclopedia of Statistics in Behavioral Science, to be published by Wiley in 2005. Consider the situation in which we have
How well do Fit Indices Distinguish Between the Two?
 MODELS OF VARIABILITY VS. MODELS OF TRAIT CHANGE How well do Fit Indices Distinguish Between the Two? M Conference University of Connecticut, May 2-22, 2 bkeller2@asu.edu INTRODUCTION More and more researchers
Correlation. A statistics method to measure the relationship between two variables. Three characteristics
 Correlation Correlation A statistics method to measure the relationship between two variables Three characteristics Direction of the relationship Form of the relationship Strength/Consistency Direction
Interactions among Continuous Predictors
 Interactions among Continuous Predictors Today s Class: Simple main effects within two-way interactions Conquering TEST/ESTIMATE/LINCOM statements Regions of significance Three-way interactions (and beyond
Prepared by: Prof. Dr Bahaman Abu Samah Department of Professional Development and Continuing Education Faculty of Educational Studies Universiti
 Prepared by: Prof Dr Bahaman Abu Samah Department of Professional Development and Continuing Education Faculty of Educational Studies Universiti Putra Malaysia Serdang M L Regression is an extension to
In Class Review Exercises Vartanian: SW 540
 In Class Review Exercises Vartanian: SW 540 1. Given the following output from an OLS model looking at income, what is the slope and intercept for those who are black and those who are not black? b SE
Suppose we obtain a MLR equation as follows:
 Psychology 8 Lecture #9 Outline Probing Interactions among Continuous Variables Suppose we carry out a MLR analysis using a model that includes an interaction term and we find the interaction effect to
Time-Invariant Predictors in Longitudinal Models
 Time-Invariant Predictors in Longitudinal Models Today s Topics: What happens to missing predictors Effects of time-invariant predictors Fixed vs. systematically varying vs. random effects Model building
Generalized Linear Models for Non-Normal Data
 Generalized Linear Models for Non-Normal Data Today s Class: 3 parts of a generalized model Models for binary outcomes Complications for generalized multivariate or multilevel models SPLH 861: Lecture
Longitudinal Data Analysis of Health Outcomes
 Longitudinal Data Analysis of Health Outcomes Longitudinal Data Analysis Workshop Running Example: Days 2 and 3 University of Georgia: Institute for Interdisciplinary Research in Education and Human Development
Module 2. General Linear Model
 D.G. Bonett (9/018) Module General Linear Model The relation between one response variable (y) and q 1 predictor variables (x 1, x,, x q ) for one randomly selected person can be represented by the following
APPENDICES TO Protest Movements and Citizen Discontent. Appendix A: Question Wordings
 APPENDICES TO Protest Movements and Citizen Discontent Appendix A: Question Wordings IDEOLOGY: How would you describe your views on most political matters? Generally do you think of yourself as liberal,
26:010:557 / 26:620:557 Social Science Research Methods
 26:010:557 / 26:620:557 Social Science Research Methods Dr. Peter R. Gillett Associate Professor Department of Accounting & Information Systems Rutgers Business School Newark & New Brunswick 1 Overview
Can you tell the relationship between students SAT scores and their college grades?
 Correlation One Challenge Can you tell the relationship between students SAT scores and their college grades? A: The higher SAT scores are, the better GPA may be. B: The higher SAT scores are, the lower
Psychological Methods
 Psychological Methods A Cautionary Note on Modeling Growth Trends in Longitudinal Data Goran Kuljanin, Michael T. Braun, and Richard P. DeShon Online First Publication, April 5, 011. doi: 10.1037/a003348
Estimating Multilevel Linear Models as Structural Equation Models
 Bauer & Curran, Psychometric Society Paper Presentation, 6/2/02 Estimating Multilevel Linear Models as Structural Equation Models Daniel J. Bauer North Carolina State University Patrick J. Curran University
Estimation and Centering
 Estimation and Centering PSYED 3486 Feifei Ye University of Pittsburgh Main Topics Estimating the level-1 coefficients for a particular unit Reading: R&B, Chapter 3 (p85-94) Centering-Location of X Reading
Course Introduction and Overview Descriptive Statistics Conceptualizations of Variance Review of the General Linear Model
 Course Introduction and Overview Descriptive Statistics Conceptualizations of Variance Review of the General Linear Model PSYC 943 (930): Fundamentals of Multivariate Modeling Lecture 1: August 22, 2012
Lecture Outline. Biost 518 Applied Biostatistics II. Choice of Model for Analysis. Choice of Model. Choice of Model. Lecture 10: Multiple Regression:
 Biost 518 Applied Biostatistics II Scott S. Emerson, M.D., Ph.D. Professor of Biostatistics University of Washington Lecture utline Choice of Model Alternative Models Effect of data driven selection of
Workshop on Statistical Applications in Meta-Analysis
 Workshop on Statistical Applications in Meta-Analysis Robert M. Bernard & Phil C. Abrami Centre for the Study of Learning and Performance and CanKnow Concordia University May 16, 2007 Two Main Purposes
Hierarchical Linear Modeling. Lesson Two
 Hierarchical Linear Modeling Lesson Two Lesson Two Plan Multivariate Multilevel Model I. The Two-Level Multivariate Model II. Examining Residuals III. More Practice in Running HLM I. The Two-Level Multivariate
A Re-Introduction to General Linear Models (GLM)
") A Re-Introduction to General Linear Models (GLM) Today s Class: You do know the GLM Estimation (where the numbers in the output come from): From least squares to restricted maximum likelihood (REML) Reviewing
A Re-Introduction to General Linear Models (GLM) Today s Class: You do know the GLM Estimation (where the numbers in the output come from): From least squares to restricted maximum likelihood (REML) Reviewing
Regression in R. Seth Margolis GradQuant May 31,
 Regression in R Seth Margolis GradQuant May 31, 2018 1 GPA What is Regression Good For? Assessing relationships between variables This probably covers most of what you do 4 3.8 3.6 3.4 Person Intelligence
Overview of Talk. Motivating Example: Antisocial Behavior (AB) Raw Data
 Raw Data") An Evaluative Comparison of Random Coefficient Growth Models for Individual Development May 6, 7 Association for Psychological Science Overview of Talk Motivating example Definition of Random Coefficient
An Evaluative Comparison of Random Coefficient Growth Models for Individual Development May 6, 7 Association for Psychological Science Overview of Talk Motivating example Definition of Random Coefficient
Research Design - - Topic 19 Multiple regression: Applications 2009 R.C. Gardner, Ph.D.
 Research Design - - Topic 19 Multiple regression: Applications 2009 R.C. Gardner, Ph.D. Curve Fitting Mediation analysis Moderation Analysis 1 Curve Fitting The investigation of non-linear functions using
The Effect of TenMarks Math on Student Achievement: Technical Supplement. Jordan Rickles, Ryan Williams, John Meakin, Dong Hoon Lee, and Kirk Walters
 The Effect of TenMarks Math on Student Achievement: Technical Supplement Jordan Rickles, Ryan Williams, John Meakin, Dong Hoon Lee, and Kirk Walters AUGUST 2017 The Effect of TenMarks Math on Student
LONGITUDINAL STUDIES OF ACHIEVEMENT GROWTH USING LATENT VARIABLE MODELING
 LONGITUDINAL STUDIES OF ACHIEVEMENT GROWTH USING LATENT VARIABLE MODELING BENGT O. MUTHI~N UNIVERSITY OF CALIFORNIA, LOS ANGELES SIEK-TOON KHO0 ARIZONA STATE UNIVERSITY ABSTRACT: This article gives a pedagogical
Introduction and Background to Multilevel Analysis
 Introduction and Background to Multilevel Analysis Dr. J. Kyle Roberts Southern Methodist University Simmons School of Education and Human Development Department of Teaching and Learning Background and
Time-Invariant Predictors in Longitudinal Models
 Time-Invariant Predictors in Longitudinal Models Topics: What happens to missing predictors Effects of time-invariant predictors Fixed vs. systematically varying vs. random effects Model building strategies
Sociology 593 Exam 2 March 28, 2002
 Sociology 59 Exam March 8, 00 I. True-False. (0 points) Indicate whether the following statements are true or false. If false, briefly explain why.. A variable is called CATHOLIC. This probably means that
Exploiting TIMSS and PIRLS combined data: multivariate multilevel modelling of student achievement
 Exploiting TIMSS and PIRLS combined data: multivariate multilevel modelling of student achievement Second meeting of the FIRB 2012 project Mixture and latent variable models for causal-inference and analysis
Review of CLDP 944: Multilevel Models for Longitudinal Data
 Review of CLDP 944: Multilevel Models for Longitudinal Data Topics: Review of general MLM concepts and terminology Model comparisons and significance testing Fixed and random effects of time Significance
Hierarchical Linear Models (HLM) Using R Package nlme. Interpretation. 2 = ( x 2) u 0j. e ij
 Using R Package nlme. Interpretation. 2 = ( x 2) u 0j. e ij") Hierarchical Linear Models (HLM) Using R Package nlme Interpretation I. The Null Model Level 1 (student level) model is mathach ij = β 0j + e ij Level 2 (school level) model is β 0j = γ 00 + u 0j Combined
Hierarchical Linear Models (HLM) Using R Package nlme Interpretation I. The Null Model Level 1 (student level) model is mathach ij = β 0j + e ij Level 2 (school level) model is β 0j = γ 00 + u 0j Combined
Structural equation modeling
 Structural equation modeling Rex B Kline Concordia University Montréal E ISTQL Set E SR models CFA vs. SR o Factors: CFA: Exogenous only SR: Exogenous + endogenous E2 CFA vs. SR o Factors & indicators:
Analysis of Covariance. The following example illustrates a case where the covariate is affected by the treatments.
 Analysis of Covariance In some experiments, the experimental units (subjects) are nonhomogeneous or there is variation in the experimental conditions that are not due to the treatments. For example, a
Simple, Marginal, and Interaction Effects in General Linear Models
 Simple, Marginal, and Interaction Effects in General Linear Models PRE 905: Multivariate Analysis Lecture 3 Today s Class Centering and Coding Predictors Interpreting Parameters in the Model for the Means
Types of Statistical Tests DR. MIKE MARRAPODI
 Types of Statistical Tests DR. MIKE MARRAPODI Tests t tests ANOVA Correlation Regression Multivariate Techniques Non-parametric t tests One sample t test Independent t test Paired sample t test One sample
Parametric Test. Multiple Linear Regression Spatial Application I: State Homicide Rates Equations taken from Zar, 1984.
 Multiple Linear Regression Spatial Application I: State Homicide Rates Equations taken from Zar, 984. y ˆ = a + b x + b 2 x 2K + b n x n where n is the number of variables Example: In an earlier bivariate
1 Introduction. 2 Example
 Statistics: Multilevel modelling Richard Buxton. 2008. Introduction Multilevel modelling is an approach that can be used to handle clustered or grouped data. Suppose we are trying to discover some of the
Simple, Marginal, and Interaction Effects in General Linear Models: Part 1
 Simple, Marginal, and Interaction Effects in General Linear Models: Part 1 PSYC 943 (930): Fundamentals of Multivariate Modeling Lecture 2: August 24, 2012 PSYC 943: Lecture 2 Today s Class Centering and
Annual Performance Report: State Assessment Data
 Annual Performance Report: 2005-2006 State Assessment Data Summary Prepared by: Martha Thurlow, Jason Altman, Damien Cormier, and Ross Moen National Center on Educational Outcomes (NCEO) April, 2008 The
Simple Linear Regression
 Simple Linear Regression 1 Correlation indicates the magnitude and direction of the linear relationship between two variables. Linear Regression: variable Y (criterion) is predicted by variable X (predictor)
Difference in two or more average scores in different groups
 ANOVAs Analysis of Variance (ANOVA) Difference in two or more average scores in different groups Each participant tested once Same outcome tested in each group Simplest is one-way ANOVA (one variable as
An Introduction to Path Analysis
 An Introduction to Path Analysis PRE 905: Multivariate Analysis Lecture 10: April 15, 2014 PRE 905: Lecture 10 Path Analysis Today s Lecture Path analysis starting with multivariate regression then arriving
Describing Change over Time: Adding Linear Trends
 Describing Change over Time: Adding Linear Trends Longitudinal Data Analysis Workshop Section 7 University of Georgia: Institute for Interdisciplinary Research in Education and Human Development Section
Time-Invariant Predictors in Longitudinal Models
 Time-Invariant Predictors in Longitudinal Models Topics: Summary of building unconditional models for time Missing predictors in MLM Effects of time-invariant predictors Fixed, systematically varying,
Multilevel Structural Equation Modeling
 Multilevel Structural Equation Modeling Joop Hox Utrecht University j.hox@uu.nl http://www.joophox.net 14_15_mlevsem Multilevel Regression Three level data structure Groups at different levels may have