Section 3 Analyzing Your Data
|
|
|
- Quentin Lang
- 5 years ago
- Views:
Transcription
1 Section 3 Analyzing Your Data Key Concept Scientists analyze data in order to answer questions, understand results, and make predictions. What You Will Learn Mathematics is an important tool for understanding and summarizing large quantities of information. The accuracy and reproducibility of data affect the results and conclusions of scientific studies. The mean, median, and mode are terms used to describe and analyze an entire set of data. Slope is the degree of slant, or steepness, of a straight line. The slope of a linear graph represents a constant that can be used to help analyze a set of data. Why It Matters Knowing how to analyze data can help you understand the results and predictions made in scientific studies. One way to analyze data is to use mathematics. Mathematical models in the form of computer simulations can answer questions about how rockets, such as the one in Figure 1, will fly and react to different conditions before the rockets even leave the ground.

2 Figure 1 Mathematics was used to design the White Knight carrier plane and the SpaceShipOne rocket at right. Why Mathematics? Just like making observations, conducting experiments, and organizing data, mathematics is used to answer questions. Mathematics helps determine important properties of substances, such as area, volume, and density. Mathematics also allows scientists to understand and sum up a lot of information. As a result, scientists can make predictions. For example, a meteorologist gathers data on hurricane movement. Mathematics helps her to see patterns in the data. Then, she uses these patterns to predict where future hurricanes might hit land. There are scientists in every country around the world. They speak many different languages. Mathematics is often called the language of science because it allows scientists to easily share their findings with each other in a language that everyone understands: numbers!
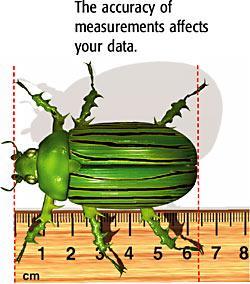
3 Accuracy of Data When scientists conduct experiments, they want to collect accurate data. In other words, they want the values to be correct. If you place 525 g on a balance and get a mass reading of 450 g, your reading is not accurate. Some reasons why a value is inaccurate include using broken equipment, using the wrong tool, or using a tool incorrectly. Choosing Tools and Using Them Correctly You have probably made measurements using the tools shown in Figure 2. Using a graduated cylinder to measure volume can provide a more accurate measurement than using a measuring cup found in a kitchen. But your data will still be inaccurate if you do not read the volume at the bottom of the meniscus at eye level. Likewise, to get an accurate reading using a ruler, you should look straight down on the end of the thing you are measuring. If you move your head to either side, you will get a slightly different measurement. Figure 2 Using Tools Correctly

4 Reproducibility of Data Imagine that you and a friend do an experiment using the same procedure and equipment. You d expect to get data that are very similar. When scientists conduct investigations, they want their results to be able to be repeated, or reproduced, by other scientists. If the data are not reproducible, then there is no way for the results of
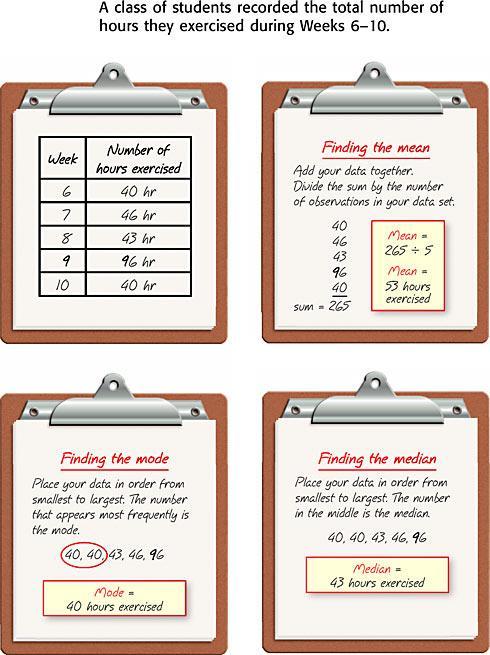
5 the experiment to be supported and accepted by other scientists. Data must be reproducible in order for other people to agree with your conclusions. Explain what it means to say that the data from a scientific investigation are reproducible. Describing the Entire Set of Data When scientists analyze data, they often find it helpful to use a single number to describe the entire set of data. Three terms that are used for this purpose are mean, median, and mode. Figure 3 shows how to find each one. The mean, or average, is found by adding all the data points together, then dividing the sum by the total number of data points. The median is the value of the data point in the middle when the data are placed in order from smallest to largest. The median is especially helpful when one data point is much smaller or larger than the rest of the data points, as in Week 9 below. The mode is the number that appears most often in a data set. Figure 3 Analyzing the Entire Set of Data
6

7 Slope of a Line What do you think of when you hear the word slope? You might think of how something slants uphill or downhill. Figure 4 shows a skier moving down a slanted mountainside. Imagine drawing a straight line under the skier that runs along the mountainside. The steepness of the line representing the slant of the mountainside is called the slope of the line. In math, slope is defined as the degree of slant of a line. Figure 4 In skiing, the term slope refers to a slanted mountainside. The steeper a slope is, the higher its difficulty rating will be for a skier. In math, slope is calculated by dividing the rise by the run. Calculating Slope To calculate the slope of a line, it is helpful to use the terms rise and run, as shown in Figure 4. The rise represents a vertical change. The run represents a horizontal change. For a line on the coordinate plane, the change in y, or the rise, indicates the number of units moved up or down. The change in x, or the run, is the number of units moved to the right or left. Slope is calculated by dividing the vertical change (the change in y) by the horizontal change (the change in x). In other words, the slope of a straight line is found by dividing the rise by the run, often described as rise over run. Using Slope to Analyze Data The slope of a line graphed from data can help you analyze the data. Look at Figure 5. Three sets of data result in three different lines, each with a different slope. For each line, the value of the slope between any two points on that line will be a constant number. Here, the slope (rise over run) represents the speed (meters over seconds) of an object moving at a constant rate. Figure 5 shows that slope can have a positive, negative, or zero value. The slope of all horizontal lines is zero.
8 Figure 5 The results from three sets of data can be graphed to analyze the data. Here, the slope of a line on a position versus time graph represents the speed of the object. rise and run. Define the slope of a straight line using the terms Slope as the Constant in y = kx Scientists sometimes find that their data form a straight line that includes the point that has x and y values of zero. They can then use the equation y = kx to represent their data. Figure 6 is a graph representing the density of lead. Here, y represents measurements of mass. And x represents measurements of volume. Then, k represents the constant term, which is the slope of the line. The slope of this line (rise divided by run) represents the density (mass divided by volume) of lead. If you rearrange the formula for density into the form y = kx, the equation is m = DV. So, density is the constant, k, which is the slope of the line.

9 Figure 6 The line in the graph at left represents the constant density of lead. When plotting the mass and volume measurements for the two lead fishing weights above, the data points fall on the line shown in the graph. Comparing Linear and Nonlinear Graphs The lines on a graph can help you draw conclusions about your data. The slope of a straight line shows how much one factor (y) always changes in relation to another factor (x). A straight line shows that a constant linear relationship exists between the factors you are studying. In other words, y always changes the same amount in relation to x. But what
10 if your data do not form a straight line? Many relationships that scientists study are not linear. In a nonlinear graph, each unit change in one factor (y) does not always bring about the same change in another factor (x). The graph of this relationship will be a curve instead of a straight line. So, there is a nonlinear relationship between the factors you are studying. Section Summary Mathematics is an important tool for understanding and summarizing data. The accuracy and reproducibility of data used in scientific investigations affect the results. Mean, median, and mode summarize an entire set of data. Slope is the degree of slant of a straight line. The slope of a straight line represents a constant that can be used to understand and analyze data. Linear and nonlinear graphs result from different relationships in the data. Chapter Summary The Big Idea Scientists use tools to collect, organize, and analyze data while conducting investigations. Section 1 Tools and Models in Science Key Concept Scientists use tools and models to increase their ability to investigate the natural

11 world. Tools are used to make accurate measurements while collecting data. The International System of Units (SI) is a system of measurement used by most scientists. A model uses familiar things to describe unfamiliar things. Physical, conceptual, and mathematical models are commonly used in science. Models help scientific progress through their use in theories and laws. Section 2 Organizing Your Data Key Concept Scientists organize data to make quantitative statements about the relationships between the variables in an investigation. Scientists use data tables and graphs to organize information. The independent variable is the factor or parameter that the investigator can change. The dependent variable is the factor or parameter that the investigator measures. Graphs help show patterns in data. Linear and nonlinear graphs show different relationships between the variables.

12 Section 3 Analyzing Your Data Key Concept Scientists analyze data in order to answer questions, understand results, and make predictions. Mathematics is an important tool for understanding and summarizing large quantities of information. The accuracy and reproducibility of data affect the results and conclusions of scientific studies. The mean, median, and mode are terms used to describe and analyze an entire set of data. Slope is the degree of slant, or steepness, of a straight line. The slope of a linear graph represents a constant that can be used to help analyze a set of data.
13
1 Tools and Models in Science
 CHAPTER 2 SECTION Data in Science 1 Tools and Models in Science 8.9.b, 8.9.f California Science Standards BEFORE YOU READ After you read this section, you should be able to answer these questions: How
Significant Digits and Measurement
 Significant Digits and Measurement What digits are significant when recording a measurement? Scientists do a lot of measuring. When scientists use an instrument (such as a ruler, graduated cylinder, spectrophotometer
Describing Mo tion. Speed and Velocity. What is speed?
 CHAPTER 1 LESSON 2 Describing Mo tion Speed and Velocity Key Concepts What is speed? How can you use a dis tance-time graph to calculate average speed? What are ways velocity can change? What do you think?
Problem: What affect does the force of launch have on the average speed of a straw rocket?
 Describing Motion and Measuring Speed A Straw Rocket Lab Background: An object is in motion when its distance from another object is changing. Whether an object is moving or not depends on your point of
Lesson 7: Slopes and Functions: Speed and Velocity
 Lesson 7: Slopes and Functions: Speed and Velocity 7.1 Observe and Represent Another way of comparing trend lines is by calculating the slope of each line and comparing the numerical values of the slopes.
INTRODUCTION TO SCIENCE CHAPTER 1
 INTRODUCTION TO SCIENCE CHAPTER 1 1 Science is the study of Everything!! A way of learning about the natural world. Scientist: a person who studies, or has expert WHAT IS SCIENCE? knowledge of a natural
POGIL: Significant Figures and Measurement Why? Model 1 Ruler A
 Name: Date: Period: Chemistry POGIL: Significant Figures and Measurement Why? Scientists do a lot of measuring. When scientists use an instrument (such as a ruler, graduated cylinder, spectrophotometer
Activity 8. Title: Measuring Volume
 Activity 8 Title: Measuring Volume Read A-32 Problem: How do you measure volume of a solid object? Hypothesis/Initial Thoughts: Unit A Vocabulary Metric System The measuring system used by scientists and
SCIENCE 1206 Unit 3. Physical Science Motion
 SCIENCE 1206 Unit 3 Physical Science Motion Section 1: Units, Measurements and Error What is Physics? Physics is the study of motion, matter, energy, and force. Qualitative and Quantitative Descriptions
3 Organizing Data. What is scientific notation? How are precision and accuracy different? How do scientists use graphs to show data?
 CHAPTER 1 Introduction to Science 3 Organizing Data SECTION KEY IDEAS As you read this section, keep these questions in mind: What is scientific notation? How are precision and accuracy different? How
Directed Reading B. Section: Tools and Models in Science TOOLS IN SCIENCE MAKING MEASUREMENTS. is also know as the metric system.
 Skills Worksheet Directed Reading B Section: Tools and Models in Science TOOLS IN SCIENCE 1. What is a tool? a. anything with a handle b. anything that gives off energy c. anything that requires electricity
Using Scientific Measurements
 Section 3 Main Ideas Accuracy is different from precision. Significant figures are those measured precisely, plus one estimated digit. Scientific notation is used to express very large or very small numbers.
6-1 Slope. Objectives 1. find the slope of a line 2. use rate of change to solve problems
 6-1 Slope Objectives 1. find the slope of a line 2. use rate of change to solve problems What is the meaning of this sign? 1. Icy Road Ahead 2. Steep Road Ahead 3. Curvy Road Ahead 4. Trucks Entering Highway
Investigating Factors that Affect Erosion
 Investigating Factors that Affect Erosion On your erosion walk and while you were reading the cases, you may have noticed that the type of soil or other Earth materials can make a difference in how and
Graphing and Density
 Graphing and Density In addition to values that you can directly measure like length, mass, or volume, chemistry is filled with values that must be calculated. The most common of these is density. Density
Velocity, Speed, and Acceleration. Unit 1: Kinematics
 Velocity, Speed, and Acceleration Unit 1: Kinematics Speed vs Velocity Speed is a precise measurement of how fast you are going. It is your distance traveled over time. Speed is a scalar quantity. To measure
Foundation Package THE END OF EDUCATION IS CHARACTER. Foundation Package 1
 Foundation Package THE END OF EDUCATION IS CHARACTER Foundation Package 1 Foundation Package 2 Foundation Package 3 Laws of Indices Foundation Package 4 Logarithms Consider the following a x = b x is called
3 Acceleration. positive and one is negative. When a car changes direction, it is also accelerating. In the figure to the
 What You ll Learn how acceleration, time, and velocity are related the different ways an object can accelerate how to calculate acceleration the similarities and differences between straight line motion,
Measurement & Lab Equipment
 Measurement & Lab Equipment Abstract This lab reviews the concept of scientific measurement, which you will employ weekly throughout this course. Specifically, we will review the metric system so that
Scientific Inquiry. Deborah Turner
 Scientific Inquiry Deborah Turner CHAPTER 1 Scientific Inquiry The Scientific inquiry is a process of steps that scientist use in order to explain and idea. Steps normally are in order for the following
Physics Motion Math. (Read objectives on screen.)
") Physics 302 - Motion Math (Read objectives on screen.) Welcome back. When we ended the last program, your teacher gave you some motion graphs to interpret. For each section, you were to describe the motion
Physics 302 - Motion Math (Read objectives on screen.) Welcome back. When we ended the last program, your teacher gave you some motion graphs to interpret. For each section, you were to describe the motion
UNIT 1: The Scientific Method Chapter 1: The Nature of Science (pages 5-35)
") CORNELL NOTES Directions: You must create a minimum of 5 questions in this column per page (average). Use these to study your notes and prepare for tests and quizzes. Notes will be turned in to your teacher
CORNELL NOTES Directions: You must create a minimum of 5 questions in this column per page (average). Use these to study your notes and prepare for tests and quizzes. Notes will be turned in to your teacher
The Methods of Science
 1 The Methods of Science What is Science? Science is a method for studying the natural world. It is a process that uses observation and investigation to gain knowledge about events in nature. 1 The Methods
Unit 1 Science Models & Graphing
 Name: Date: 9/18 Period: Unit 1 Science Models & Graphing Essential Questions: What do scientists mean when they talk about models? How can we get equations from graphs? Objectives Explain why models are
a) Use the graph above and calculate the slope of the line for each case. Explain how you calculated the slope. How is the slope similar to the index?
 Use the graph above and calculate the slope of the line for each case. Explain how you calculated the slope. How is the slope similar to the index?") Slopes and Expressions: Speed and Velocity 5.1 Observe and Represent Another way of comparing trend lines is by calculating the slope of each line and comparing the numerical values of the slopes. a) Use
Slopes and Expressions: Speed and Velocity 5.1 Observe and Represent Another way of comparing trend lines is by calculating the slope of each line and comparing the numerical values of the slopes. a) Use
Significant Digits What digits are important when recording a measurement?
 Significant Digits What digits are important when recording a measurement? Why? Scientists do a lot of measuring. When scientists use an instrument (ruler, graduated cylinder, spectrophotometer, balance
Achievement Standard (Physics 2.1)
") Achievement Standard 91168 (Physics 2.1) Guidelines What follows is an interpretation of the standard. It has not been approved by the NZQA. Aim Aim The aim of the experiment will be to find the relationship
Achievement Standard 91168 (Physics 2.1) Guidelines What follows is an interpretation of the standard. It has not been approved by the NZQA. Aim Aim The aim of the experiment will be to find the relationship
Chapter Introduction. Motion. Motion. Chapter Wrap-Up
 Chapter Introduction Lesson 1 Lesson 2 Lesson 3 Describing Motion Graphing Motion Forces Chapter Wrap-Up What is the relationship between motion and forces? What do you think? Before you begin, decide
2.4 Slope and Rate of Change
 2.4 Slope and Rate of Change Learning Objectives Find positive and negative slopes. Recognize and find slopes for horizontal and vertical lines. Understand rates of change. Interpret graphs and compare
Unit 2 mid term review
 Unit 2 mid term review Modified True/False Indicate whether the sentence or statement is true or false. If false, change the identified word or phrase to make the sentence or statement true. 1. Motion
This is a one-week excerpt from the Starfall Kindergarten Mathematics Teacher s Guide. If you have questions or comments, please contact us.
 UNIT WEEK This is a one-week excerpt from the Starfall Kindergarten Mathematics Teacher s Guide. If you have questions or comments, please contact us. Email: helpdesk@starfall.com Phone: -888-857-8990
H #1 - Measurement & Place Value
 1. What are the only 2 distances that you can be certain of on the ruler in Model 1? 2. Six students used the ruler in Model 1 to measure the length of a metal strip. Their measurements are shown at the
Scientific Method: a logical approach to understanding or solving problems that needs solved.
 Chapter 2 Section 1 Section 2-1 Objectives Describe the purpose of the scientific method. Distinguish between qualitative and quantitative observations. Describe the differences between hypotheses, theories,
Grady Middle School Science 6th Grade Summer Packet Date. How do scientists measure things?
 Student name LESSON 1 Grady Middle School Science 6th Grade Summer Packet Date How do scientists measure things? How much do you weigh? What is your height? How many tiles will cover your kitchen floor?
2 The Way Science Works
 CHAPTER 1 Introduction to Science 2 The Way Science Works SECTION KEY IDEAS As you read this section, keep these questions in mind: How can you use critical thinking to solve problems? What are scientific
Alex s Guide to Word Problems and Linear Equations Following Glencoe Algebra 1
 Alex s Guide to Word Problems and Linear Equations Following Glencoe Algebra 1 What is a linear equation? It sounds fancy, but linear equation means the same thing as a line. In other words, it s an equation
Copyright 2014 Edmentum - All rights reserved.
 Study Island Copyright 2014 Edmentum - All rights reserved. Generation Date: 12/09/2014 Generated By: Cheryl Shelton Title: Grade 6 Blizzard Bag 2014-2015 Science -Day 1 1. A reference point is an object
Interactive Chalkboard
 1 Interactive Chalkboard 1 Table of Contents Unit 1: Energy and Motion Chapter 1: The Nature of Science 1.1: The Methods of Science 1.2: Standards of Measurement 1.3: Communicating with Graphs 1.1 The
The Nature of Science
 chapter 1 The Nature of Science section 2 Standards of Measurement Before You Read If someone asked you how wide your desk is, how would you measure it? Would you measure using inches, centimeters, feet,
Chapter 3 Kinematics
 Chapter 3 Kinematics GOALS When you have mastered the content of this chapter, you will be able to achieve the following goals: Definitions Use the following terms to describe the physical state of a system:
Map reading made easy
 Map reading made easy 1. What is a map? A map is simply a drawing or picture (in 2-D) of a landscape or area of a country (in 3-D). It could be anything from a sketch map for a visitor to find your school
12-1 Graphing Linear Equations. Warm Up Problem of the Day Lesson Presentation. Course 3
 Warm Up Problem of the Day Lesson Presentation Warm Up Solve each equation for y. 1. 6y 1x = 4. y 4x = 0 3. y 5x = 16 4. 3y + 6x = 18 y = x + 4 y = x 10 y = 5 x + 8 y = x + 6 Problem of the Day The same
Allows us to work with very large or small numbers more easily. All numbers are a product of 10.
 Unit 1: Measurements Scientific Notation : Allows us to work with very large or small numbers more easily. All numbers are a product of 10. M x 10n M= signif. digit [ 1 < M < 10 ] n = an integer move the
Volume vs. Diameter. Teacher Lab Discussion. Overview. Picture, Data Table, and Graph
 5 6 7 Middle olume Length/olume vs. Diameter, Investigation page 1 of olume vs. Diameter Teacher Lab Discussion Overview Figure 1 In this experiment we investigate the relationship between the diameter
Map reading made easy
 Map reading made easy Maps can be great fun and they can lead you to all sorts of discoveries. They can help you get to know an area really well, because they pinpoint interesting places that are often
Unit 1 Our Dynamic Universe
 North Berwick High School Higher Physics Department of Physics Unit 1 Our Dynamic Universe Section 1 Equations of Motion Section 1 Equations of Motion Note Making Make a dictionary with the meanings of
2016 Junior Lesson One
 2016 Junior Lesson One To complete this lesson make sure you answer all the questions in bold and do one of the projects at the end of the lesson. Parts marked ADVANCED are for the curious. This year we
Principles and Problems. Chapter 1: A Physics Toolkit
 PHYSICS Principles and Problems Chapter 1: A Physics Toolkit CHAPTER 1 A Physics Toolkit BIG IDEA Physicists use scientific methods to investigate energy and matter. CHAPTER 1 Table Of Contents Section
AP Physics 1 Review. On the axes below draw the horizontal force acting on this object as a function of time.
 P Physics Review. Shown is the velocity versus time graph for an object that is moving in one dimension under the (perhaps intermittent) action of a single horizontal force. Velocity, m/s Time, s On the
MATH 1130 Exam 1 Review Sheet
 MATH 1130 Exam 1 Review Sheet The Cartesian Coordinate Plane The Cartesian Coordinate Plane is a visual representation of the collection of all ordered pairs (x, y) where x and y are real numbers. This
Section 1: The Nature of Science
 Section 1: The Nature of Science Preview Key Ideas Bellringer How Science Takes Place The Branches of Science Scientific Laws and Theories Key Ideas How do scientists explore the world? How are the many
Distinguishing Glass Fragments
 Activity 2 Distinguishing Glass Fragments GOALS In this activity you will: Experimentally determine the density of a solid without a definite shape. Understand the difference between intensive and extensive
Notes: Unit 1: Math and Measurement
 Name: Regents Chemistry: Notes: Unit 1: Math and Measurement www.chempride.weebly.com Key Ideas Major Understandings: o Chemistry is the study of matter: Matter takes up space and has mass. (K- 4, 3.1a)
Notes: Unit 1: Math and Measurement
 Name: Regents Chemistry: Notes: Unit 1: Math and Measurement www.chempride.weebly.com Key Ideas Major Understandings: o Chemistry is the study of matter: Matter takes up space and has mass. (K- 4, 3.1a)
7 th Grade Math Scope and Sequence Student Outcomes (Objectives Skills/Verbs)
") own discovery of the Big BIG IDEA: How are different types of numbers used to represent real life situations? Why is it necessary to have different types of numbers for different situations? Pg 762 1-4(no
own discovery of the Big BIG IDEA: How are different types of numbers used to represent real life situations? Why is it necessary to have different types of numbers for different situations? Pg 762 1-4(no
Curriculum Scope & Sequence Subject/Grade Level: MATHEMATICS/GRADE 7 Course: MATH 7
 BOE APPROVED 3/12/13 Curriculum Scope & Sequence Subject/Grade Level: MATHEMATICS/GRADE 7 Course: MATH 7 Unit Duration NJCCCS / Unit Goals Transfer Goal(s) Enduring Review of 10 Days Unit Goals: There
Metric Prefixes UNITS & MEASUREMENT 10/6/2015 WHY DO UNITS AND MEASUREMENT MATTER?
 UNITS & MEASUREMENT WHY DO UNITS AND MEASUREMENT MATTER? Chemistry In Action On 9/3/99, $15,000,000 Mars Climate Orbiter entered Mar s atmosphere 100 km (6 miles) lower than planned and was destroyed by
Research is when you look up the answer to your question. Sources (places you look for your answer)
") 1 1.1 Science is the knowledge obtained by observing the natural world in order to discover facts and formulate laws and principles that can be verified or tested. 1) Scientists start by asking questions.
1 1.1 Science is the knowledge obtained by observing the natural world in order to discover facts and formulate laws and principles that can be verified or tested. 1) Scientists start by asking questions.
Chapter Introduction. Motion. Motion. Chapter Wrap-Up
 Chapter Introduction Lesson 1 Lesson 2 Lesson 3 Describing Motion Graphing Motion Forces Chapter Wrap-Up What is the relationship between motion and forces? What do you think? Before you begin, decide
Chemistry Lab Mr. Zamojski Q1 Mass & Volume PRE-LAB ASSIGNMENT
 Name: Date: Chemistry Lab Mr. Zamojski Q1 Mass & Volume PRE-LAB ASSIGNMENT Required Safety Data Sheets (SDS): 1) Copper 2) Tin These 2 safety data sheets (SDS) are attached at the end of this pre-lab assignment.
Lab: Density of Substances
 Name: Date: Unit 1: Measuring the Earth - 2 Lab Hours Period: Lab: Density of Substances Introduction: You often hear statements like lead is heavier than water, or gold is the heaviest material on earth.
A-Level Notes CORE 1
 A-Level Notes CORE 1 Basic algebra Glossary Coefficient For example, in the expression x³ 3x² x + 4, the coefficient of x³ is, the coefficient of x² is 3, and the coefficient of x is 1. (The final 4 is
2 Standards of Measurement
 What You ll Learn the SI units and symbols for length, volume, mass, density, time, and temperature how to convert related SI units 2 Standards of Measurement (A), 2(D), 2(C), 2(E) Before You Read If someone
Question 8.1 Sign of the Energy II
 Question 8. Sign of the Energy II Is it possible for the gravitational potential energy of an object to be negative? a) yes b) no Question 8. Sign of the Energy II Is it possible for the gravitational
Significant Digits and Measurement
 Significant Digits and Measurement Question: What digits are significant when recording a measurement? When scientists use an instrument, such as a ruler or graduated cylinder, the scientist can only measure
CHAPTER 2. Motion Notes
 CHAPTER 2 Motion Notes DISTANCE AND DISPLACEMENT Distance and displacement are two quantities which may seem to mean the same thing, yet have distinctly different definitions and meanings. DISTANCE Distance
Representing Motion Chapter 2
 Phenomena Representing Motion Chapter 2 Pop Quiz! How fast are you moving at this moment? o A.) 0m/s o B.) 783 mi/h o C.) 350m/s o D.) 30 km/s Pop Quiz! How fast are you moving? oa.) 0m/s ob.) 783 mi/h
Mix It Up: Correlated Mathematics and Science Texas State University San Marcos Correlated Lesson Plan
 File Name: Algebraic Reasoning_Geometry_Physics_Distance vs Displacement_5-27-2011.docx Lesson Title: Distance vs. Displacement Targeted Grade Band: 4 5 6 7 X 8 9 10 11 12 Targeted Mathematics Strand:
Calculus 140, section 4.7 Concavity and Inflection Points notes by Tim Pilachowski
 Calculus 140, section 4.7 Concavity and Inflection Points notes by Tim Pilachowski Reminder: You will not be able to use a graphing calculator on tests! Theory Eample: Consider the graph of y = pictured
Part D: Kinematic Graphing - ANSWERS
 Part D: Kinematic Graphing - ANSWERS 31. On the position-time graph below, sketch a plot representing the motion of an object which is.... Label each line with the corresponding letter (e.g., "a", "b",
Position time graph Type of motion Example
 Acceleration Some theme parks have rides in which you are slowly carried up in a seat to the top of a tower, and then suddenly released (Figure 1). On the way down, your arms and hair may fly upward as
Name Class Date. The ocean floor has varied and distinct surfaces much like those found on land.
 6 Explore the Seafloor BigIdeas The ocean floor has varied and distinct surfaces much like those found on land. Satellites orbiting Earth, as well as sonar technology, are used to map the seafloor. The
accuracy inverse relationship model significant figures dependent variable line of best fit physics scientific law
 A PHYSICS TOOLKIT Vocabulary Review Write the term that correctly completes the statement. Use each term once. accuracy inverse relationship model significant figures dependent variable line of best fit
Physics 115 Experiment 1. Introduction to Measurement and Error Analysis (PHY 115 and 117)
") Physics 115 Experiment 1 Introduction to Measurement and Error Analysis (PHY 115 and 117) Introduction In the sciences, measurement plays an important role. The accuracy of the measurement, as well as
Physics 115 Experiment 1 Introduction to Measurement and Error Analysis (PHY 115 and 117) Introduction In the sciences, measurement plays an important role. The accuracy of the measurement, as well as
Lesson 11: Motion of a Falling Object
 Lesson 11: Motion of a Falling Object 11.1 Observe and find a pattern using your choice of one of the following: 1. The video at this web site: http://paer.rutgers.edu/pt3/experiment.php?topicid=2&exptid=38
MATH CALCULUS I 2.2: Differentiability, Graphs, and Higher Derivatives
 MATH 12002 - CALCULUS I 2.2: Differentiability, Graphs, and Higher Derivatives Professor Donald L. White Department of Mathematical Sciences Kent State University D.L. White (Kent State University) 1 /
Making Measurements. On a piece of scrap paper, write down an appropriate reading for the length of the blue rectangle shown below: (then continue )
") On a piece of scrap paper, write down an appropriate reading for the length of the blue rectangle shown below: (then continue ) 0 1 2 3 4 5 cm If the measurement you made was 3.7 cm (or 3.6 cm or 3.8 cm),
On a piece of scrap paper, write down an appropriate reading for the length of the blue rectangle shown below: (then continue ) 0 1 2 3 4 5 cm If the measurement you made was 3.7 cm (or 3.6 cm or 3.8 cm),
Section Distance and displacment
 Chapter 11 Motion Section 11.1 Distance and displacment Choosing a Frame of Reference What is needed to describe motion completely? A frame of reference is a system of objects that are not moving with
Counting Out πr 2. Teacher Lab Discussion. Overview. Picture, Data Table, and Graph. Part I Middle Counting Length/Area Out πrinvestigation
 5 6 7 Middle Counting Length/rea Out πrinvestigation, page 1 of 7 Counting Out πr Teacher Lab Discussion Figure 1 Overview In this experiment we study the relationship between the radius of a circle and
QuickCheck. A cart slows down while moving away from the origin. What do the position and velocity graphs look like? Slide 2-65
 QuickCheck A cart slows down while moving away from the origin. What do the position and velocity graphs look like? Slide 2-65 QuickCheck A cart speeds up toward the origin. What do the position and velocity
Section Objectives: Recognize some possible benefits from studying biology. Summarize the characteristics of living things.
 Section Objectives: Recognize some possible benefits from studying biology. Summarize the characteristics of living things. The Science of Biology The concepts, principles, and theories that allow people
Scientific Literacy & the Scientific Method
 Scientific Literacy & the Scientific Method What does it mean to be? You ve probably hear that term before, and you might be thinking that literate means the ability to and. But what does it mean to be
How is an object s density related to its volume, mass, and tendency to sink or float? Materials
 Investigation 2B 2B How is an object s density related to its volume, mass, and tendency to sink or float? You may be familiar with the trick question Which is heavier: a pound of feathers or a pound of
Physics 6A Lab Experiment 6
 Biceps Muscle Model Physics 6A Lab Experiment 6 Introduction This lab will begin with some warm-up exercises to familiarize yourself with the theory, as well as the experimental setup. Then you ll move
Welcome to Physics 211! General Physics I
 Welcome to Physics 211! General Physics I Physics 211 Fall 2015 Lecture 01-1 1 Physics 215 Honors & Majors Are you interested in becoming a physics major? Do you have a strong background in physics and
Mahopac Central School District Curriculum Introduction to Science 8
 Introduction to Science 8 A. The goal of science is to understand the natural world 1. As you make new observations and test new explanations your view of the natural world may change again and again 2.
BIOSTATISTICS NURS 3324
 Simple Linear Regression and Correlation Introduction Previously, our attention has been focused on one variable which we designated by x. Frequently, it is desirable to learn something about the relationship
Notes and Summary pages:
 Topographic Mapping 8.9C Interpret topographical maps and satellite views to identify land and erosional features and predict how these shapes may be reshaped by weathering ATL Skills: Communication taking
3.3 Acceleration An example of acceleration Definition of acceleration Acceleration Figure 3.16: Steeper hills
 3.3 Acceleration Constant speed is easy to understand. However, almost nothing moves with constant speed for long. When the driver steps on the gas pedal, the speed of the car increases. When the driver
Fall Final Exam Review: 8 th grade Independent variable: Dependent variable: Scientific Investigations:
 Name: Due Date: Class Per. Fall Final Exam Review: 8 th grade 2015 Scientific Investigations: 1. What is Qualitative data? Give an example. 2. What is Quantitative Data? Give an example. 3. Explain the
Chapter 1, section 2. Measurement. Note: It will probably take 2-3 class periods to get through this entire presentation.
 Chapter 1, section 2 Measurement Note: It will probably take 2-3 class periods to get through this entire presentation. All measurements contain a number and a unit. The English system of measurement is
AP Physics Summer Assignment
 AP Physics Summer Assignment Your Name Complete this before you show up for the first class in August. This assignment will be graded for accuracy, and there will be a test on the contents of this packet
Section 11.1 Distance and Displacement (pages )
") Name Class Date Section 11.1 Distance and Displacement (pages 328 331) This section defines distance and displacement. Methods of describing motion are presented. Vector addition and subtraction are introduced.
Name Class Date Section 11.1 Distance and Displacement (pages 328 331) This section defines distance and displacement. Methods of describing motion are presented. Vector addition and subtraction are introduced.
 (numerical value) In calculating, you will find the total distance traveled. Displacement problems will find the distance from the starting point to the ending point. *Calculate the total amount traveled
What Is Itatter? Matter and Volume
 Objectives Describe the two properties of all matter. Identify the units used to measure volume and mass. Compare mass and weight. Explain the relationship between mass and inertia. Terms to Learn matter
MPM1D - Practice Mastery Test #6
 Name: Class: Date: ID: A MPMD - Practice Mastery Test #6 Multiple Choice Identify the choice that best completes the statement or answers the question.. Calculate 0% of 00. a. b. 0 c. 000 d. 00. Seyran's
Introduction to Mechanics Unit Conversions Order of Magnitude
 Introduction to Mechanics Unit Conversions Order of Magnitude Lana Sheridan De Anza College Sept 28, 2017 Last time symbols for scaling units scientific notation precision and accuracy dimensional analysis
Chapter 4: Forces and Newton's Laws of Motion Tuesday, September 17, :00 PM
 Ch4 Page 1 Chapter 4: Forces and Newton's Laws of Motion Tuesday, September 17, 2013 10:00 PM In the first three chapters of this course the emphasis is on kinematics, the mathematical description of motion.
Map reading made easy
 Map reading made easy 1 1. What is a map? A map is simply a drawing or picture (in 2-D) of a landscape or area of a country (in 3-D). It could be anything from a sketch map for a visitor to find your school
1. In Activity 1-1, part 3, how do you think graph a will differ from graph b? 3. Draw your graph for Prediction 2-1 below:
 PRE-LAB PREPARATION SHEET FOR LAB 1: INTRODUCTION TO MOTION (Due at the beginning of Lab 1) Directions: Read over Lab 1 and then answer the following questions about the procedures. 1. In Activity 1-1,