Foundation Package THE END OF EDUCATION IS CHARACTER. Foundation Package 1
|
|
|
- Alexandrina Black
- 5 years ago
- Views:
Transcription

1 Foundation Package THE END OF EDUCATION IS CHARACTER Foundation Package 1
2 Foundation Package 2
3 Foundation Package 3
4 Laws of Indices Foundation Package 4
5 Logarithms Consider the following a x = b x is called the power or index. a is called the base. b is called the value or number. So, by definition: The log (short for logarithm) of a number is the power to which the base must be raised to equal the given number. Foundation Package 5
6 So log a b = x Read as the log of b to the base a equals x. e.g. If 10 2 = 100 Then log = 2. If log = 2, then the anti-log (2 nd function log in calculator) of 2 is 100. Any number can be chosen as the base, but base 10 and base e are commonly used. When the base is 10, it is written as log (or lg) where the 10 is understood. When the base is e (called natural logs), it is written as ln, where base e is understood. The number e is a special number. Foundation Package 6

7 Laws of Logs Foundation Package 7
8 Equation of a Straight Line The general equation of a straight line is y = mx + c. Where m is the slope of the graph, and c is the value of y when x = 0 Note: anything. 1. m, the slope, is the coefficient of the variable plotted on the x-axis, which could be 2. c is NOT the intercept on the y-axis. This is so only if the x-axis starts at zero. If the x-axis does not start at zero, then c has to be worked out, from the equation. Foundation Package 8

9 Note the Following Special Lines. 1. y = mx This is a straight line passing through the origin and going through first and third quadrants. 2. y = mx This is a line passing through the origin, going through the second and fourth quadrants. Foundation Package 9
10 3. y = x has a positive slope of 1. (bisecting first and third quadrants) 4. y = x Foundation Package 10

11 5. y = k A horizontal line, parallel to the x-axis i.e. slope is zero. 6. x = k A line parallel to the y-axis i.e. infinite slope. 7. y = 0 This is the x-axis. 8. x = 0 This is the y-axis. Foundation Package 11
12 Guidelines for Practicals Display of results (1) Use of table: Columns with appropriate headings, and units (2) Use of graph: Foundation Package 12
13 Plotting Graphs Students must be familiar with equations of the form: (a) y = ax n Using logs to obtain a straight line, a graph of log y vs log x is drawn. log y = log a + log x n log y = n log x + log a. Where n is the slope of the line, and log a is the intercept. Foundation Package 13
14 Note: when columns and axes are to be labelled with log or ln, they should be written as LOG (T/S) (1) It should be noted that unless otherwise stated, quantities should be given and used in S.I. units. (2) When logs are taken it is possible for all numbers to be negative. The graph may be entirely in the third quadrant. (3) You may not need to start a graph at the origin even if intercept is asked to be determined. Use an appropriate scale to make the graph as big as possible. The intercept is found by finding slope and substituting a point on the line in the equation of the line. DO NOT USE BROKEN SCALES Foundation Package 14
15 (b) Equations of the form: y = ae kx This time take natural logs i.e. ln. ln y = kx + ln a Students must be able to manipulate any type of equation to give a straight line if necessary and must be able to recognise the shape of a graph from the equation, if given. Foundation Package 15
16 Plotting Points It is recommended that points be plotted with small x s, and must be accurate within 2.0 mm on the graph page. So even if there are decimal places, one must still be able to determine within one small box. Drawing the Best Fit It should be noted that a graph is not just a connection of points, but a smooth curve is drawn through as many points as possible. If points do not fall exactly on the curve, then as far as possible, the sum of the deviations on either side of the curve is about the same. However, if a point is way off then you should recheck it and if no adjustment is made then neglect it. A smooth curve is drawn with a fine point pencil by drawing once without lifting the hand. If the graph is a straight line then a ruler must be used. If not, the graph is drawn free hand or with whatever curve-drawing instrument is available. Foundation Package 16
17 Calculations From the Graph (a) Slope: You can be asked to calculate the slope of the line or if it is a curve, the slope at a point. If you have to calculate the slope of the line then more than three quarters of the line must ( form the hypotenuse of an indicated 3 4) right-angled triangle. The points chosen must be points on the line and NOT necessarily points on the table. The units of the slope must be obtained from the units of the axes and the number of significant figures must be consistent with the number of significant figures in the observed results. Note: If it is a curve, and the slope has to be determined at a point, a tangent is drawn and the slope of the tangent is found. (b) Intercept: If the origin is not included in the graph then the intercept has to be calculated using the equation of the line. After the slope is found, choose a point on the line and substitute in the equation of the line to find intercept. Foundation Package 17
18 Scaling the Graph Page (i) Use the thick lines on the graph page as boundary lines for the axes. (ii) Use values for each centimetre or two centimetre blocks, such that it is easy to interpolate and determine what the value 2 mm on each axis represents. Foundation Package 18
19 Graph Analysis 1. Take note of the names and units of the axes. 2. Determine and interpret intercepts on the axes. 3. Determine and interpret the slope of the graph. The units will help. 4. Determine and interpret the area under a graph. The units will help. 5. Determine turning points maximum and minimum. 6. Determine and interpret any asymptotes. Foundation Package 19
20 The Nine Point Code of Conduct for Planning and Design Questions Physics Practicals 1. Identify the task this includes identifying or formulating the hypothesis to be tested. This becomes the aim of the experiment. 2. Identify the variables that are involved and identify which ones would have to be constant and which ones will vary. The aim will give a guide to this. Identify appropriate instruments to measure the variables that will be involved in the analysis. 3. Identify the independent and the dependent variables. Foundation Package 20
21 4. Identify appropriate operating equations and method of analysis that will be used to achieve the aim. 5. Brainstorm the difficulties that can arise if the experiment is to be done and find ways to overcome them. 6. Draw a diagram (or diagrams) of the set up. 7. For procedure: Write in sequence what is to be done. Identify what is to be measured and how. What difficulties are likely to be experienced and what steps can be taken to overcome them. 8. Calculations: Say how your results will be used to achieve the aim use of formula, graph and its analysis, etc. 9. Analysis/interpretation and conclusion. Foundation Package 21
22 Plotting of Linear Graphs You should be able to: rearrange relationships between physical quantities so that linear graphs may be plotted. Suppose we want to study the relationships between the time taken, t, for a ball that is thrown upwards to reach the ground and the ball s initial height, h, above the ground. We form a hypothesis that t is related to h by the equation 1 t = kh, where k is a constant of unknown value. How do 2 we test the validity of this equation? First, a few sets of readings of h and their corresponding t values have to be obtained. Then a graph of t versus h is plotted. If the above equation is true, we should obtain a curve. However, since many other equations will also give curves when plotted, we cannot conclude based on the curve alone, that the equation is valid. Figure 1 Graphs of t vs. h We cannot conclude from 1 this graph that t = kh, 2 as other equations might also give a similar curve. Foundation Package 22
, where y = t, x = h, and m (the gradient of the graph) = k.")
23 To confirm the validity of the equation, we need to plot t versus h. If 1 the graph of t versus h gives a straight-line graph that passes through the origin, we know that the equation is valid. This is because the equation is now in the form of Y = mx (which is the equation of a straight line passing through the origin), where y = t, x = h, and m (the gradient of the graph) = k. So if the plotted graph gives a straight line passing through the origin, we know that the equation is valid. 1 2 Figure 2 Graphs of t vs. h With this graph, we can conclude that the equation t = kh, is valid Foundation Package 23

24 In general, we can only conclude that a certain equation is valid, after we convert it into a straight-line equation, and upon plotting it, obtain a straight-line graph. The gradient and vertical intercept of the graph might yield useful information; in the above example, we are able to get the value of k from the gradient. Convert the following equations so as to get straight line graphs. Foundation Package 24

25 SOLUTION Foundation Package 25

26 Foundation Package 26
27 Measurement Techniques Errors and Uncertainties In an experimental work there will always be some uncertainty in measurements that we take. There are two categories of errors that we can talk about (1) random errors and (2) systematic errors. In scientific terminology, measurements and readings have different meanings. Reading: Is a single determination of the value of an unknown quantity. It s the actual reading taken during an experiment. Foundation Package 27
28 Measurement: Is the final result of the analysis of a series of reading. A measurement is only accurate up to a certain degree depending on the instrument used and the physical constraint of the observer. Any quantity measured has an amount of uncertainty or error in the value obtained. Note: If a rod is measured and its length is 34.7 cm, it indicates that it is only accurate to 0.1 cm, therefore to indicate the uncertainty of this value, it may be written as 34.7 ± 0.1 cm. The value of 0.1 cm is the absolute error in the measurement of the length of 34.7 cm. Error can also be stated in the form of fractional error. The fractional error in measurement of (34.7 ± 0.1)cm is whereas the error Foundation Package 28
29 Systematic Errors Systematic errors are uncertainties in the measurement of physical quantities due to instrument faults in the surrounding conditions. One important characteristic of systematic errors is that the size of the error is roughly constant and the measurement obtained is always greater or less than the actual value. Foundation Package 29
30 Sources of Systematic Errors 1. Zero Errors: Occurs if the reading on an instrument is not zero even when it is not used to make any measurements e.g. hand of stopwatch does not point to zero but 0.2 seconds. 2. Personal error: results from physical constraints or limitation of an individual e.g. the reaction time. 3. Errors due to Instruments: (i) A fast watch (ii) an ammeter which is used under different conditions from which it had been calibrated e.g. Ammeter made in Japan has been calibrated under diff. Temp and earth s magnetic fields from Singapore where it is used. 4. Errors due to wrong assumption: Assuming g = 10 ms 2 whereas in reality it is 9.81 ms 2. Systematic errors cannot be reduced by taking a large number of readings using the same method, same instrument and by the same observer. Foundation Package 30
31 Random errors Random errors are uncertainties in a measurement made by the observer or person who takes the measurements. The characteristic of random errors is that it can be positive or negative and its magnitude is not constant. Thus the reading can be sometimes greater than the actual value and some times smaller than the actual value. Foundation Package 31
32 Examples of random errors: 1. Errors due to parallax when reading a scale. 2. Changes in temperature during an experiment can result in measurements being sometimes bigger and sometimes smaller than the actual value. Accuracy means that the mean value of the reading taken is close to the correct value even if the spread is wide. Precision means that there is little spread about the mean position of the values even though the mean of the values. Foundation Package 32

33 Error Calculations Percentage error in a calculated value is the sum of the % errors in the measured values. Foundation Package 33
34 Foundation Package 34

35 Foundation Package 35


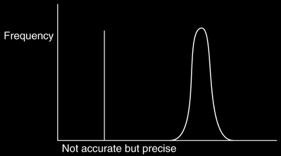
36 Graphs showing Accuracy and Precision Foundation Package 36

37 Foundation Package 37
38 How to reduce random errors: 1. In the case of low battery, replace the battery. 2. Repeat the experiment many times. How to reduce systematic errors: 1. Recalibrate instruments frequently. Foundation Package 38
39 Units and Dimensions Most physical quantities have units. Systeme Internationale (SI) Units The International System Of Units (French: Le Systemme International d Unites) was established by international agreement, and is widely used in many countries. The Caribbean has adopted this system. Foundation Package 39

40 S.I. Base Units Foundation Package 40

41 Derived units come from the base units. e.g. Change Pascals to base units. Foundation Package 41
42 Equations must be dimensionally consistent i.e. the net units on the right hand side must be equal to the net units on the left hand side. Because equations must be homogeneous, units can be used to check equations and even derive equations. Only like quantities can be added to each other or subtracted from each other. Foundation Package 42

43 Foundation Package 43

44 Foundation Package 44

45 Foundation Package 45
46 The Mole and the Avogadro Constant The Avogadro constant is a number that is often used by chemists. It is defined as the number of atoms in 12 g of carbon-12. This number is (to 3 significant figures). The mole is the SI unit for the amount of substance. One mole is defined to be the quantity of substance containing a number of particles equal to the Avogadro constant. The idea behind the mole is similar to that of a dozen. One dozen of apples is 12 apples. One mole of atoms is atoms. The mass of one mole of atoms or molecules of a substance is called the molar mass of the substance. Foundation Package 46
47 Example One mole of oxygen molecules has a mass of 32 g. Find: 1. the number of moles in 1.0 kg of oxygen, 2. the number of molecules in 1.0 kg of oxygen. Solution 1. Number of moles = Number of molecules = = Foundation Package 47

48 Prefixes Scientists deal with quantities that are very big, for example the mass of the Earth, and quantities that are very small, for example the size of an atom. In order to facilitate recording these values as well as reading them, scientists use certain prefixes. Prefixes are used to denote multiplication by factors of 10. The prefixes with the corresponding factors of 10 are shown below: Foundation Package 48
49 Foundation Package 49

50 Questions on Units and Dimensions Foundation Package 50

51 Foundation Package 51
Experimental Uncertainty (Error) and Data Analysis
 and Data Analysis") Experimental Uncertainty (Error) and Data Analysis Advance Study Assignment Please contact Dr. Reuven at yreuven@mhrd.org if you have any questions Read the Theory part of the experiment (pages 2-14) and
Experimental Uncertainty (Error) and Data Analysis Advance Study Assignment Please contact Dr. Reuven at yreuven@mhrd.org if you have any questions Read the Theory part of the experiment (pages 2-14) and
Achievement Standard (Physics 2.1)
") Achievement Standard 91168 (Physics 2.1) Guidelines What follows is an interpretation of the standard. It has not been approved by the NZQA. Aim Aim The aim of the experiment will be to find the relationship
Achievement Standard 91168 (Physics 2.1) Guidelines What follows is an interpretation of the standard. It has not been approved by the NZQA. Aim Aim The aim of the experiment will be to find the relationship
x y
 (a) The curve y = ax n, where a and n are constants, passes through the points (2.25, 27), (4, 64) and (6.25, p). Calculate the value of a, of n and of p. [5] (b) The mass, m grams, of a radioactive substance
Appendix A. Common Mathematical Operations in Chemistry
 Appendix A Common Mathematical Operations in Chemistry In addition to basic arithmetic and algebra, four mathematical operations are used frequently in general chemistry: manipulating logarithms, using
College Physics 201 Graphing Review and Analysis
 Northern Michigan University Graphing Review and Analysis Page-1 College Physics 201 Graphing Review and Analysis Materials: Graph paper, ruler, pencil and calculator. 1 Purpose The goal of these laboratory
How do physicists study problems?
 What is Physics? The branch of science that studies the physical world (from atoms to the universe); The study of the nature of matter and energy and how they are related; The ability to understand or
Experimental Uncertainty (Error) and Data Analysis
 and Data Analysis") E X P E R I M E N T 1 Experimental Uncertainty (Error) and Data Analysis INTRODUCTION AND OBJECTIVES Laboratory investigations involve taking measurements of physical quantities, and the process of taking
E X P E R I M E N T 1 Experimental Uncertainty (Error) and Data Analysis INTRODUCTION AND OBJECTIVES Laboratory investigations involve taking measurements of physical quantities, and the process of taking
SCIENCE 1206 Unit 3. Physical Science Motion
 SCIENCE 1206 Unit 3 Physical Science Motion Section 1: Units, Measurements and Error What is Physics? Physics is the study of motion, matter, energy, and force. Qualitative and Quantitative Descriptions
AUSTRALIAN CURRICULUM PHYSICS GETTING STARTED WITH PHYSICS GRAPHS
 AUSTRALIAN CURRICULUM PHYSICS GETTING STARTED WITH PHYSICS GRAPHS Graphs play a very important part in any science. Graphs show in pictorial form the relationship between two variables and are far superior
TY Physics Measurement Module 1
 TY Physics Measurement Module 1 Introduction Units of measure were among the earliest tools invented by humans, they were needed for many tasks, such as constructing dwellings, fashioning clothes, or bartering
accuracy inverse relationship model significant figures dependent variable line of best fit physics scientific law
 A PHYSICS TOOLKIT Vocabulary Review Write the term that correctly completes the statement. Use each term once. accuracy inverse relationship model significant figures dependent variable line of best fit
IB Physics STUDENT GUIDE 13 and Processing (DCP)
") IB Physics STUDENT GUIDE 13 Chapter Data collection and PROCESSING (DCP) Aspect 1 Aspect Aspect 3 Levels/marks Recording raw data Processing raw data Presenting processed data Complete/ Partial/1 Not at
IB Physics STUDENT GUIDE 13 Chapter Data collection and PROCESSING (DCP) Aspect 1 Aspect Aspect 3 Levels/marks Recording raw data Processing raw data Presenting processed data Complete/ Partial/1 Not at
SPH3U1 Lesson 03 Introduction. 6.1 Expressing Error in Measurement
 SIGNIFICANT DIGITS AND SCIENTIFIC NOTATION LEARNING GOALS Students will: 6 ERROR Describe the difference between precision and accuracy Be able to compare values quantitatively Understand and describe
Knowledge Organiser Year 12 Semester 1: Measurements and Movement
 Knowledge Organiser Year 12 Semester 1: Measurements and Movement 1.1 Practical Skills (assessed in the written exam) Show understanding of experimental design, including to solve problems set in a practical
Analyzing Data. Click a hyperlink or folder tab to view the corresponding slides. Exit
 Analyzing Data Section 2.1 Units and Measurements Section 2.2 Scientific Notation and Dimensional Analysis Section 2.3 Uncertainty in Data Section 2.4 Representing Data Click a hyperlink or folder tab
Reference Guide. Science Reference 9/25/ Copyright 1996 Gary Lewis Revisions 2007 by John Pratte
 Reference Guide Contents...1 1. General Scientific Terminology...2 2. Types of Errors...3 3. Scientific Notation...4 4. Significant Figures...6 5. Graphs...7 6. Making Measurements...8 7. Units...9 8.
Algebra. Topic: Manipulate simple algebraic expressions.
 30-4-10 Algebra Days: 1 and 2 Topic: Manipulate simple algebraic expressions. You need to be able to: Use index notation and simple instances of index laws. Collect like terms Multiply a single term over
Notes: Unit 1: Math and Measurement
 Name: Regents Chemistry: Notes: Unit 1: Math and Measurement www.chempride.weebly.com Key Ideas Major Understandings: o Chemistry is the study of matter: Matter takes up space and has mass. (K- 4, 3.1a)
Notes: Unit 1: Math and Measurement
 Name: Regents Chemistry: Notes: Unit 1: Math and Measurement www.chempride.weebly.com Key Ideas Major Understandings: o Chemistry is the study of matter: Matter takes up space and has mass. (K- 4, 3.1a)
11.1 Uncertainty and error in measurement (1 Hour) 11.2 Uncertainties in calculated results (0.5 Hour) 11.3 Graphical techniques (0.
 11.2 Uncertainties in calculated results (0.5 Hour) 11.3 Graphical techniques (0.") Chapter 11 Measurement and Data Processing Page 1 Students are to read and complete any part that requires answers and will submit this assignment on the first day of class. You may use internet sources
Chapter 11 Measurement and Data Processing Page 1 Students are to read and complete any part that requires answers and will submit this assignment on the first day of class. You may use internet sources
Introduction to Uncertainty and Treatment of Data
 Introduction to Uncertainty and Treatment of Data Introduction The purpose of this experiment is to familiarize the student with some of the instruments used in making measurements in the physics laboratory,
These variables have specific names and I will be using these names. You need to do this as well.
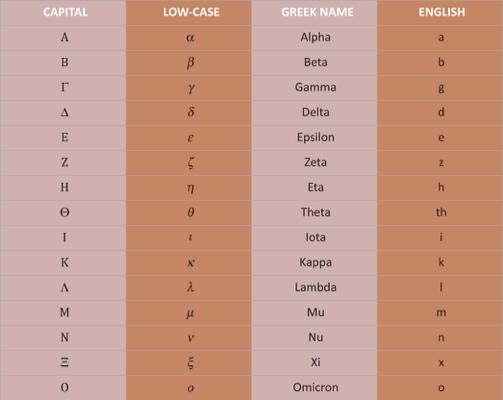
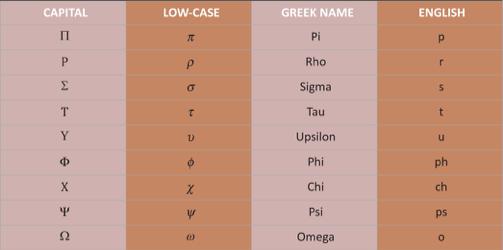
 Greek Letters In Physics, we use variables to denote a variety of unknowns and concepts. Many of these variables are letters of the Greek alphabet. If you are not familiar with these letters, you should
All measurement has a limit of precision and accuracy, and this must be taken into account when evaluating experimental results.
 Chapter 11: Measurement and data processing and analysis 11.1 Uncertainty and error in measurement and results All measurement has a limit of precision and accuracy, and this must be taken into account
see page 8 of these notes )
") UNIT 1 Note Packet INTRODUCTION TO CHEMISTRY Name: METRICS AND MEASUREMENT In the chemistry classroom and lab, the metric system of measurement is used, so it is important to know what you are measuring,
UNIT 1 Note Packet INTRODUCTION TO CHEMISTRY Name: METRICS AND MEASUREMENT In the chemistry classroom and lab, the metric system of measurement is used, so it is important to know what you are measuring,
Appendix B: Skills Handbook
 Appendix B: Skills Handbook Effective communication is an important part of science. To avoid confusion when measuring and doing mathematical calculations, there are accepted conventions and practices
Physics Skills (a.k.a. math review)
") Physics Skills (a.k.a. math review) PART I. SOLVING EQUATIONS Solve the following equations for the quantity indicated. 1. y = 1 at Solve for t. x = vot + 1 at Solve for v o 3. v = ax Solve for x v 4.
Physics Skills (a.k.a. math review) PART I. SOLVING EQUATIONS Solve the following equations for the quantity indicated. 1. y = 1 at Solve for t. x = vot + 1 at Solve for v o 3. v = ax Solve for x v 4.
Graphs. 1. Graph paper 2. Ruler
 Graphs Objective The purpose of this activity is to learn and develop some of the necessary techniques to graphically analyze data and extract relevant relationships between independent and dependent phenomena,
Measurement: The Basics
 I. Introduction Measurement: The Basics Physics is first and foremost an experimental science, meaning that its accumulated body of knowledge is due to the meticulous experiments performed by teams of
UNIT 1 - STANDARDS AND THEIR MEASUREMENT: Units of Measurement: Base and derived units: Multiple and submultiples of the units: 1
 AS Physics 9702 unit 1: Standards and their Measurements 1 UNIT 1 - STANDARDS AND THEIR MEASUREMENT: This unit includes topic 1 and 2 from the CIE syllabus for AS course. Units of Measurement: Measuring
TSOKOS CHAP 1 TEST REVIEW
 IB PHYSICS Name: DEVIL PHYSICS Period: Date: BADDEST CLASS ON CAMPUS TSOKOS CHAP TEST REVIEW ORDERS OF MAGNITUDE AND UNITS 2. The resistie force F acting on a sphere of radius r moing at speed through
Section 3 Analyzing Your Data
 Section 3 Analyzing Your Data Key Concept Scientists analyze data in order to answer questions, understand results, and make predictions. What You Will Learn Mathematics is an important tool for understanding
PHYS 281 General Physics Laboratory
 King Abdul-Aziz University Faculty of Science Physics Department PHYS 281 General Physics Laboratory Student Name: ID Number: Introduction Advancement in science and engineering has emphasized the microscopic
CHAPTER 1, TEST REVIEW
 IB PHYSICS Name: Period: Date: # Marks: XX Raw Score: IB Curve: DEVIL PHYSICS BADDEST CLASS ON CAMPUS 1. Which of the following is equivalent to the joule? A. N m 2 B. N m 2 C. kg m s 2 D. kg m 2 s 2 CHAPTER
Physics Unit 3 Investigative and Practical Skills in AS Physics PHY3T/P09/test
 Surname Other Names Leave blank Centre Number Candidate Number Candidate Signature General Certificate of Education June 2009 Advanced Subsidiary Examination Physics Unit 3 Investigative and Practical
PHYS 212 PAGE 1 OF 6 ERROR ANALYSIS EXPERIMENTAL ERROR
 PHYS 212 PAGE 1 OF 6 ERROR ANALYSIS EXPERIMENTAL ERROR Every measurement is subject to errors. In the simple case of measuring the distance between two points by means of a meter rod, a number of measurements
Chapter 1: Chemical Foundations A Summary
 Chapter 1: Chemical Foundations A Summary 1.1 Chemistry: An Overview A. Reaction of hydrogen and oxygen 1. Two molecules of hydrogen react with one molecule of oxygen to form two molecules of water 2H
1 Measurement Uncertainties
 1 Measurement Uncertainties (Adapted stolen, really from work by Amin Jaziri) 1.1 Introduction No measurement can be perfectly certain. No measuring device is infinitely sensitive or infinitely precise.
11 SEPTEMBER This document consists of printed pages.
 S 11 SEPTEMBER 2017 6 Write your name, centre number, index number and class in the spaces at the top of this page and on all work you hand in. Write in dark blue or black pen on both sides of the paper.
Physics: Uncertainties - Student Material (AH) 1
 1") UNCERTAINTIES Summary of the Basic Theory associated with Uncertainty It is important to realise that whenever a physical quantity is being measured there will always be a degree of inaccuracy associated
UNCERTAINTIES Summary of the Basic Theory associated with Uncertainty It is important to realise that whenever a physical quantity is being measured there will always be a degree of inaccuracy associated
AQA Physics A-level Section 1: Measurements and Their Errors
 AQA Physics A-level Section 1: Measurements and Their Errors Key Points The base units are the set of seven units of measure from which all other SI units can be derived. Units All other units can be expressed
Example 1: What do you know about the graph of the function
 Section 1.5 Analyzing of Functions In this section, we ll look briefly at four types of functions: polynomial functions, rational functions, eponential functions and logarithmic functions. Eample 1: What
2012 Assessment Report. Mathematics with Calculus Level 3 Statistics and Modelling Level 3
 National Certificate of Educational Achievement 2012 Assessment Report Mathematics with Calculus Level 3 Statistics and Modelling Level 3 90635 Differentiate functions and use derivatives to solve problems
Mathematics Review. Sid Rudolph
 Physics 2010 Sid Rudolph General Physics Mathematics Review These documents in mathematics are intended as a brief review of operations and methods. Early in this course, you should be totally familiar
Applied Science Maths & Measuring
 Applied Science Maths & Measuring 1 P age SJG Standard Form and Unit Prefixes In Physics we need to work with some very small numbers (like the mass on an electron) and some very large numbers (like the
Measurements and Data Analysis
 Measurements and Data Analysis 1 Introduction The central point in experimental physical science is the measurement of physical quantities. Experience has shown that all measurements, no matter how carefully
21-Jan-2018 Chemsheets A Page 1
 www.chemsheets.co.uk 21-Jan-2018 Chemsheets A2 1001 Page 1 SECTION 1 Recap of AS Kinetics What is reaction rate? The rate of a chemical reaction is a measure of how fast a reaction takes place. It is defined
Physics 11. Unit 1 Mathematical Toolkits
 Physics 11 Unit 1 Mathematical Toolkits 1 1.1 Measurement and scientific notations Système International d Unités (SI Units) The base units for measurement of fundamental quantities. Other units can be
Pittsfield High School Summer Assignment Contract Intensive 9 / Honors 9 / Honors Physics
 Pittsfield High School Summer Assignment Contract Intensive 9 / Honors 9 / Honors Physics Welcome to Physics! The study of physics takes us on a journey investigating matter, energy, and how they interact.
GCE A level 1326/01-D PHYSICS PH6 Data Analysis Task
 Surname Centre Number Candidate Number Other Names 2 GCE A level 1326/01-D PHYSICS PH6 Data Analysis Task S16-1326-01D FRIDAY, 11 March 2016 Time Allowed 45 minutes For Examiner s use only Maximum Mark
Methods and Tools of Physics
 Methods and Tools of Physics Order of Magnitude Estimation: Essential idea: Scientists aim towards designing experiments that can give a true value from their measurements, but due to the limited precision
Uncertainties in AH Physics
 Advanced Higher Physics Contents This booklet is one of a number that have been written to support investigative work in Higher and Advanced Higher Physics. It develops the skills associated with handling
PLC Papers. Created For:
 PLC Papers Created For: Algebra and proof 2 Grade 8 Objective: Use algebra to construct proofs Question 1 a) If n is a positive integer explain why the expression 2n + 1 is always an odd number. b) Use
INTRODUCTION TO LABORATORY EXPERIMENT AND MEASUREMENT
 INTRODUCTION TO LABORATORY EXPERIMENT AND MEASUREMENT Purpose Theory a. To take some simple measurements to use for statistical analysis b. To learn how to use a Vernier caliper and a micrometer screw
Uncertainties [49 marks]
![Uncertainties [49 marks]](/thumbs/96/128299279.jpg "Uncertainties [49 marks]") Uncertainties [49 marks] 1. How many significant figures are there in the number 0.0450? A. 2 B. 3 C. 4 D. 5 2. An object is positioned in a gravitational field. The measurement of gravitational force
Uncertainties [49 marks] 1. How many significant figures are there in the number 0.0450? A. 2 B. 3 C. 4 D. 5 2. An object is positioned in a gravitational field. The measurement of gravitational force
Summative Practical: Motion down an Incline Plane
 Summative Practical: Motion down an Incline Plane In the next lesson, your task will be to perform an experiment to investigate the motion of a ball rolling down an incline plane. For an incline of 30,
Notes from the Marking Centre - Mathematics Extension 2
 Notes from the Marking Centre - Mathematics Extension Question (a)(i) This question was attempted well, with most candidates able to calculate the modulus and argument of the complex number. neglecting
A-level MATHEMATICS. Paper 2. Exam Date Morning Time allowed: 2 hours SPECIMEN MATERIAL
 SPECIMEN MATERIAL Please write clearly, in block capitals. Centre number Candidate number Surname Forename(s) Candidate signature A-level MATHEMATICS Paper 2 Exam Date Morning Time allowed: 2 hours Materials
Using Scientific Measurements
 Section 3 Main Ideas Accuracy is different from precision. Significant figures are those measured precisely, plus one estimated digit. Scientific notation is used to express very large or very small numbers.
The total time traveled divided by the total time taken to travel it. Average speed =
 Unit 3: Motion V = d t Average speed The total time traveled divided by the total time taken to travel it Mathematically: Average speed = Total Distance Travelled Total Time Traveled So just how fast were
Answers to test yourself questions
 nswers to test yourself questions Topic Measurement in physics 5 Taking the diameter of a proton to be order m 5 we find 3 8 3 = 3 = 3 s 7 The mass of the Earth is about kg and the mass of a hydrogen atom
Table 2.1 presents examples and explains how the proper results should be written. Table 2.1: Writing Your Results When Adding or Subtracting
 When you complete a laboratory investigation, it is important to make sense of your data by summarizing it, describing the distributions, and clarifying messy data. Analyzing your data will allow you to
CHEM 121 Introduction to Fundamental Chemistry. Summer Quarter 2008 SCCC. Lecture 2
 CHEM 121 Introduction to Fundamental Chemistry Summer Quarter 2008 SCCC Lecture 2 Could Stephanie, Liqingqing, Huong, Sophia and Yumiko see me after class for a few minutes. Thanks. Matter, Measurements
Chapter 2 - Analyzing Data
 Chapter 2 - Analyzing Data Section 1: Units and Measurements Section 2: Scientific Notation and Dimensional Analysis Section 3: Uncertainty in Data Section 4: Representing Data Chemists collect and analyze
Example: Plot the points (0, 0), (2, 1), ( 1, 3), , ( 1, 0), (3, 0) on the Cartesian plane: 5
, (2, 1), ( 1, 3), , ( 1, 0), (3, 0) on the Cartesian plane: 5") Graphing Equations: An Ordered Pair of numbers is two numbers (x, y) that is used to represent coordinate of points in the Cartesian plane. The first number is the x coordinate and the second number is
Graphing Equations: An Ordered Pair of numbers is two numbers (x, y) that is used to represent coordinate of points in the Cartesian plane. The first number is the x coordinate and the second number is
Physics 10 Scientific Measurement Workbook Mr. Proctor
 Physics 10 Scientific Measurement Workbook Mr. Proctor Name: MEASUREMENT OF MATTER - Science 10 textbook reference pages 344-351 The Seven Fundamental Measurements (with units) in Physics are: meter (m)
Allows us to work with very large or small numbers more easily. All numbers are a product of 10.
 Unit 1: Measurements Scientific Notation : Allows us to work with very large or small numbers more easily. All numbers are a product of 10. M x 10n M= signif. digit [ 1 < M < 10 ] n = an integer move the
1. Thermal energy is transferred through the glass windows of a house mainly by. D. radiation and convection. (1)
") 1. Thermal energy is transferred through the glass windows of a house mainly by A. conduction. B. radiation. C. conduction and convection. D. radiation and convection. 2. The specific latent heat of vaporization
1. Thermal energy is transferred through the glass windows of a house mainly by A. conduction. B. radiation. C. conduction and convection. D. radiation and convection. 2. The specific latent heat of vaporization
Uncertainty, Error, and Precision in Quantitative Measurements an Introduction 4.4 cm Experimental error
 Uncertainty, Error, and Precision in Quantitative Measurements an Introduction Much of the work in any chemistry laboratory involves the measurement of numerical quantities. A quantitative measurement
Working Scientifically Physics Equations and DfE Maths skills BOOKLET 1
 Working Scientifically Physics Equations and DfE Maths skills BOOKLET 1 Published date: Summer 2016 version 1 3 Working scientifically Science is a set of ideas about the material world. We have included
Chapter 3 - Measurements
 Chapter 3 - Measurements You ll learn it in the summer, If not, it ll be a bummer. You ll need to know conversions, For units, Euro version. Metrics are powers of ten, And you might cry when, You re forced
Practice paper Set 2 MAXIMUM MARK 100 FINAL. A Level Physics B (Advancing Physics) H557/03 Practical skills in physics MARK SCHEME
 H557/03 Practical skills in physics MARK SCHEME") Practice paper Set 2 A Level Physics B (Advancing Physics) H557/03 Practical skills in physics MARK SCHEME Duration: hour 30 minutes MAXIMUM MARK 00 FINAL This document consists of 8 pages Question Solution
Practice paper Set 2 A Level Physics B (Advancing Physics) H557/03 Practical skills in physics MARK SCHEME Duration: hour 30 minutes MAXIMUM MARK 00 FINAL This document consists of 8 pages Question Solution
Name: Chapter 2: Analyzing Data Note Taking Guide This worksheet is meant to help us learn some of the basic terms and concepts of chemistry.
 Chemistry Name: Section ANALYZE DATA KEY Date: Chapter 2: Analyzing Data Note Taking Guide This worksheet is meant to help us learn some of the basic terms and concepts of chemistry. Most, but not all,
ERROR AND GRAPHICAL ANALYSIS WORKSHEET
 Student Names: Course: Section: Instructor: ERROR AND GRAPHICAL ANALYSIS WORKSHEET Instructions: For each section of this assignment, first read the relevant section in the Yellow Pages of your Lab Manual.
Kinematics Unit. Measurement
 Kinematics Unit Measurement The Nature of Science Observation: important first step toward scientific theory; requires imagination to tell what is important. Theories: created to explain observations;
Principles and Problems. Chapter 1: A Physics Toolkit
 PHYSICS Principles and Problems Chapter 1: A Physics Toolkit CHAPTER 1 A Physics Toolkit BIG IDEA Physicists use scientific methods to investigate energy and matter. CHAPTER 1 Table Of Contents Section
Data and Error Analysis
 Data and Error Analysis Introduction In this lab you will learn a bit about taking data and error analysis. The physics of the experiment itself is not the essential point. (Indeed, we have not completed
Year 11 IB MATHEMATICS SL EXAMINATION PAPER 2
 Year 11 IB MATHEMATICS SL EXAMINATION PAPER Semester 1 017 Question and Answer Booklet STUDENT NAME: TEACHER(S): Mr Rodgers, Ms McCaughey TIME ALLOWED: Reading time 5 minutes Writing time 90 minutes INSTRUCTIONS
In chemistry we use metric units (called SI units after the French term for Systeme internationale.
 Metric system / SI units: In chemistry we use metric units (called SI units after the French term for Systeme internationale. SI units: The SI units we ll be primarily concerned with are shown here: Base
JUST THE MATHS UNIT NUMBER 5.3. GEOMETRY 3 (Straight line laws) A.J.Hobson
 A.J.Hobson") JUST THE MATHS UNIT NUMBER 5.3 GEOMETRY 3 (Straight line laws) by A.J.Hobson 5.3.1 Introduction 5.3.2 Laws reducible to linear form 5.3.3 The use of logarithmic graph paper 5.3.4 Exercises 5.3.5 Answers
JUST THE MATHS UNIT NUMBER 5.3 GEOMETRY 3 (Straight line laws) by A.J.Hobson 5.3.1 Introduction 5.3.2 Laws reducible to linear form 5.3.3 The use of logarithmic graph paper 5.3.4 Exercises 5.3.5 Answers
VERTICAL PROJECTILE MOTION (LIVE) 08 APRIL 2015 Section A: Summary Notes and Examples
 08 APRIL 2015 Section A: Summary Notes and Examples") VERTICAL PROJECTILE MOTION (LIVE) 08 APRIL 2015 Section A: Summary Notes and Examples Equations of Motion When an object is thrown, projected or shot upwards or downwards, it is said to be a projectile.
VERTICAL PROJECTILE MOTION (LIVE) 08 APRIL 2015 Section A: Summary Notes and Examples Equations of Motion When an object is thrown, projected or shot upwards or downwards, it is said to be a projectile.
Interactive Chalkboard
 1 Interactive Chalkboard 1 Table of Contents Unit 1: Energy and Motion Chapter 1: The Nature of Science 1.1: The Methods of Science 1.2: Standards of Measurement 1.3: Communicating with Graphs 1.1 The
CISC - Curriculum & Instruction Steering Committee. California County Superintendents Educational Services Association
 CISC - Curriculum & Instruction Steering Committee California County Superintendents Educational Services Association Primary Content Module The Winning EQUATION Algebra I - Linear Equations and Inequalities
Performance Task: Concentration vs. Time
 NAME DATE : Concentration vs. Time Goal of task Target concept: Understand reaction rates in both qualitative and quantitative terms For this task you will be evaluated on your ability to: Construct an
Uncertainty and Graphical Analysis
 Uncertainty and Graphical Analysis Introduction Two measures of the quality of an experimental result are its accuracy and its precision. An accurate result is consistent with some ideal, true value, perhaps
National 5 Learning Checklist - Relationships
 National 5 Learning Checklist - Relationships Topic Skills Extra Stud / Notes Straight Line Gradient Represented b m Measure of steepness of slope Positive gradient the line is increasing Negative gradient
AP PHYSICS C: ELECTRICITY AND MAGNETISM 2015 SCORING GUIDELINES
 AP PHYSICS C: ELECTRICITY AND MAGNETISM 2015 SCORING GUIDELINES Question 2 15 points total Distribution of points (a) i. 2 points Using Ohm s law: V = IR For a correct application of Kirchhoff s loop rule
Example 1: The mass of the earth is 5.98 x kg. What is its order of magnitude? What is the order of magnitude for 400?
 Physics 11 Realms of Physics Physics attempts to model the behavior of the universe from the very large scale (entire universe, 10 52 kg, 10 26 m, 10 19 s) to the very small (components of a proton, 10-28
A-Level Notes CORE 1
 A-Level Notes CORE 1 Basic algebra Glossary Coefficient For example, in the expression x³ 3x² x + 4, the coefficient of x³ is, the coefficient of x² is 3, and the coefficient of x is 1. (The final 4 is
AP Physics 1 Summer Assignment
 Name: Email address (write legibly): AP Physics 1 Summer Assignment Packet 3 The assignments included here are to be brought to the first day of class to be submitted. They are: Problems from Conceptual
6/28/11. Avogadro s Number and the Mole. The Mole. The Mole. The Mole (mol)
") Avogadro s Number and the Mole Molecular weight: The sum of atomic weights of all atoms in a molecule. Formula weight: The sum of atomic weights of all atoms in one formula unit of any compound. Mole:
Avogadro s Number and the Mole Molecular weight: The sum of atomic weights of all atoms in a molecule. Formula weight: The sum of atomic weights of all atoms in one formula unit of any compound. Mole:
 Twitter: @Owen134866 www.mathsfreeresourcelibrary.com Prior Knowledge Check 1) Find the point of intersection for each pair of lines: a) y = 4x + 7 and 5y = 2x 1 b) y = 5x 1 and 3x + 7y = 11 c) 2x 5y =
PHYSICS LAB: CONSTANT MOTION
 PHYSICS LAB: CONSTANT MOTION Introduction Experimentation is fundamental to physics (and all science, for that matter) because it allows us to prove or disprove our hypotheses about how the physical world
Student Book links Specification links Links to prior learning Suggested teaching order
 Teaching plan 2.1.1 Velocity and acceleration Student Book links Specification links Links to prior learning Suggested teaching order 2.1.1 9 Learning objectives 12 Students should be able to: explain
MAT100 OVERVIEW OF CONTENTS AND SAMPLE PROBLEMS
 MAT100 OVERVIEW OF CONTENTS AND SAMPLE PROBLEMS MAT100 is a fast-paced and thorough tour of precalculus mathematics, where the choice of topics is primarily motivated by the conceptual and technical knowledge
Algebra II. Slide 1 / 261. Slide 2 / 261. Slide 3 / 261. Linear, Exponential and Logarithmic Functions. Table of Contents
 Slide 1 / 261 Algebra II Slide 2 / 261 Linear, Exponential and 2015-04-21 www.njctl.org Table of Contents click on the topic to go to that section Slide 3 / 261 Linear Functions Exponential Functions Properties
MATH HANDBOOK. Handbook. Math
 MATH HANDBOOK ematics is a language used in science to express and solve problems. Calculations you perform during your study of chemistry require arithmetic operations, such as addition, subtraction,
Year 12 Physics INDUCTION WORK XKCD. Student. Class 12 A / B / C / D / E Form
 Year 12 Physics 2018-19 INDUCTION WORK XKCD Student Class 12 A / B / C / D / E Form DYP 2018 1. Physical Quantities Maths and Physics have an important but overlooked distinction by students. Numbers in
AP Physics 1 Review. On the axes below draw the horizontal force acting on this object as a function of time.
 P Physics Review. Shown is the velocity versus time graph for an object that is moving in one dimension under the (perhaps intermittent) action of a single horizontal force. Velocity, m/s Time, s On the
Chemical Kinetics -- Chapter 14
 Chemical Kinetics -- Chapter 14 1. Factors that Affect Reaction Rate (a) Nature of the reactants: molecular structure, bond polarity, physical state, etc. heterogeneous reaction: homogeneous reaction:
Physics and Chemistry UNIT 1: SCIENCE. THE SCIENTIFIC METHOD. QUANTITIES AND UNITS
 UNIT 1: SCIENCE. THE SCIENTIFIC METHOD. QUANTITIES AND UNITS 1. SCIENCE AND THE SCIENTIFIC METHOD A G In this unit we will learn how scientists work, make new discoveries and explain unknown phenomena