Model-Based synthesis of indicators Statistical Composite Indicators to convey consistent policy messages
|
|
|
- Ernest Dean
- 5 years ago
- Views:
Transcription

1 Model-Based synthesis of indicators Statistical Composite Indicators to convey consistent policy messages Carlo Cavicchia, Maurizio Vichi Department of Statistical Sciences Sapienza University of Rome em: Workshop:THE IMPACTS AND METHODOLOGY OF INDICATORS AND SCOREBOARDS -3 March 018
2 Outline of the Presentation FROM DATA to KNOWLEDGE by Dimensionality Reduction: a model-based Composite Indicator (CI) is the result of the dimensional reduction of the observed multivariate data. We will start from Properties on which a Composite Indicator should be based We will discuss HCI : Hierarchical Composite Indicator Model Application study: Human Development Index; Multidimensional Poverty Index SDGs for Europe with data by EUROSTAT


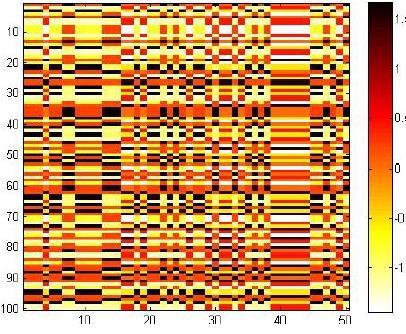

3 From DATA to KNOWLEDGE via GENERAL COMPOSITE INDICATOR Data Dimensionality Reduction KNOWLEDGE for DECISION MAKING SPECIFIC COMPOSITE INDICATORS INFORMATION Heat-map DATA 3
4 Moving from DATA to KNOWLEDGE by a Dimensionality Reduction 4
5 Let us start from the Observed Data (Manifest Indicators) on the multidimensional concept formed by DATA 5 Observed set of indicators
6 Specific Composite Indicators (1/) for detecting the specific concepts describing the phenomenon First Level Synthesis First Order Specific Composite Indicators COMPOSITE INDICATOR DATA 6 Each SCI synthesises a set of indicators Each SCI synthesises a set of indicators
7 Specific Composite Indicators (/) for detecting the main concepts describing the phenomenon Second Level Synthesis Second Order Specific Composite Indicators COMPOSITE INDICATOR DATA 7 Each SCI synthesises a set of indicators Each SCI synthesises a set of indicators or factors
8 General Composite Indicator (for decision making) Third Level Synthesis General Composite Indicator GENERAL COMPOSITE INDICATOR Second Order Specific Composite Indicators COMPOSITE INDICATOR DATA Each SCI synthesises a set of Indicators Each SCI synthesises a set of indicators or SCIs 8 Hierarchical CI model to move from DATA to KNWOLEDGE
9 PROPERTIES of CI FIRST PART Model-Based & Statistically estimated (non-normative) Confirmatory, Exploratory or Mixed Reflective and/or Formative Model assessment SECOND PART Scale-invariance Non-Compensability & Non-Negativity Reliability Unidimensionality, forming a General CI 9
10 PROPERTIES of CI FIRST PART Model-Based & Statistically estimated (non-normative) Confirmatory, Exploratory or Mixed Reflective and/or Formative Model assessment SECOND PART Scale-invariance Non-Compensability & Non-Negativity Reliability Unidimensionality, forming a General CI 10
11 Statistical Model: Hierarchical CI Model-based CI & its statistical estimation (i.e., non-normative): Data = Hierarchical CI model + error Manifest Indicators Measurement error + residual Advantages Statistical estimation (LS, MLE, ) Validation: Goodness of Fit (to confirm the model) Inference on the weights, GoF, Which typology of constructive approach: - Confirmatory a Scientific Theory (ST) is assumed and has to be confirmed by the observed indicators; - Exploratory no clear ST is known, thus, regularities are searched in the data; - Mixed Confirmatory & Exploratory part of the ST is known, but it is not completely known Which typology of relations between indicators: - Reflective - Formative 11
12 Confirmatory, Exploratory, Mixed-Confirmatory/Exploratory Confirmatory model: if a theory on the model of the CI is available, i.e., all relationships between manifest variables and latent variables are and a priori known; Exploratory model: all relationships between manifest variables and latent variables are not a priori known; Mixed-confirmatory/exploratory : some relationships are known according to a theory and some are unknown and must be achieved by exploratory analysis. A GCI B GCI C?? SCI1 SCI SCI1 SCI SCI1 GCI SCI????????? e 1 e e 3 e 4 e 5 e 6 e 1 e e 3 e 4 e 5 e 6 e 1 e e 3 e 4 e 5 e 6 1

13 Relations between Composite Indicators (GCI & SCIs) and Manifest Indicators A) Reflective B) Formative GCI GCI A B SCI1 SCI SCI1 SCI e 1 e e 3 e 4 e 5 e 6 The General Composite Indicator is a determinant (causes) the Specific Composite Indicators & these last are determinant (causes) of the Manifest Indicators, i.e., The GCI reconstructs the SCIs that reconstruct the MI e 1 e e 3 e 4 e 5 e 6 Independent Manifest Indicators are determinant (cause, explain) of independent Specific Composite indicators that are determinant of the General Composite Indicator) 13
14 Hierarchical Composite Indicator (HCI) a model to identify the latent Hierarchical Composite Indicator and the set of specific Composite Indicators that best reconstruct the observed data SOME METODOLOGICAL CONSIDERATIONS GCI SCI SCI 3 1 SCI V = b 1 b 4 b 5 b 6 b 7 b b 3 c e 1 e e 3 e 8 e e 9 e 10 4 e 5 e 6 e 7 g c c 3 c b 8 b 9 b 10 Data MODEL ERROR X=gc' V' B+E Parameters of the model c weights for SCIs V relations between MIs & SCIs Weights for variables B = diag(b) b 1, b,, b 10 14
15 Special cases of HDFA(1/) g=arithmetic mean of MIs if :c 1 =c = =c Q =1; b 1 =b = b J =1 (equal weights) g M = X(1 H V ) + = X1 J + = 1 J (x 1 + x +...+xj), GCI SCI SCI 3 1 SCI e 1 e e 3 e 4 e 5 e 6 e 7 e 8 e 9 e 10 g c c 1 =1 c =1 c3 =1 b 1 =1 b =1 b 3 =1 b 4 =1 b 5 =1 b 6 =1 b 7 =1 b 8 =1 b9 =1 b 10 =1 Data MODEL ERROR X=gc' V' B+E Parameters of the model c weights for SCIs V relations between MIs & SCIs V = Weights for variables B = diag(b) b 1, b,, b 10 14
16 Special cases of HCI (/) g = weighted arithmetic mean of MIs (i.e., different weights) g WM =X( B V c)( c V B1 J ) -1 Data MODEL ERROR c 1 GCI SCI SCI 3 1 SCI e 1 e e 3 e 4 e 5 e 6 e 7 e 8 e 9 e 10 g c c c 3 b 1 b b 3 b 4 b 5 b 6 b 7 b 8 b 9 b 10 X=gc' V' B+E Parameters of the model c weights for SCIs V relations between MIs & SCIs V = Weights for MIs B = diag(b) b 1, b,, b 10 14
17 PROPERTIES of CI FIRST PART Model-Based & Statistically estimated (non-normative) Confirmatory, Exploratory or Mixed Reflective and/or Formative Model assessment SECOND PART Scale-invariance Non-Compensability & Non-Negativity Reliability Unidimensionality, forming a General CI 17
18 MODEL ASSESSMENT The goodness of fit of the CI model: R GCI = 1 SS res = 1 tr(x X) tr( B V SS tot tr(x X) c g g( c V B)) R SCI = 1 SS res = 1 tr(x X) tr( B V Y Y V B) SS tot tr(x X) R SCIh = 1 SS res Yh SS toth = 1 tr(x h X h ) tr( B h v h y h y h v h B h ) tr(x h X h ) The Information criteria AIC -log Ol(, ) + d BIC -log Ol(, ) + d log n 19


19 Example 1 : Assessment of the Model-Based CI X=gc' V' B+E Case of ARITHMETIC MEAN g GCI 1 1 c 1 g N(0,1) SCI 1 SCI SCI 3 X s = X m = X L = B e 1 e e 3 e e 8 e 9 e 10 4 e 5 e 6 e 7 if c=1 3 and B =I 10, V = X s X m X L Error: R GCI R SCI1 Small Medium Large R SCI R SCI3 Arithmetic mean is a good GCI only when the MIs are very similar 0
20 Example : Assessment of the Model-Based CI Case of ARITHMETIC MEAN GCI SCI 1 SCI SCI 3 X= e 1 e e 3 e e 8 e 9 e 10 4 e 5 e 6 e 7 X divided in three blocks R GCI = SS mod SS tot = R SCI1 R SCI R SCI In a situation like this is better to stop at an intermediate level of synthesis (i.e., SCIs level) because a GCI built as the arithmetic mean of MIs is not a good representation of the phenomenon to describe 1
21 Example : Assessment of the Model-Based CI Case of ARITHMETIC MEAN GCI SCI 1 SCI SCI 3 X= e 1 e e 3 e e 8 e 9 e 10 4 e 5 e 6 e 7 R GCI = SS mod SS tot = R SCI1 R SCI R SCI In a situation like this is better to stop at an intermediate level of synthesis (i.e., SCIs level) because a GCI built as the arithmetic mean of MIs is not a good representation of the phenomenon to describe
 because a GCI built as the arithmetic mean of MIs is not a good representation of the phenomenon to describe")
22 Example : Assessment of the Model-Based CI Case of ARITHMETIC MEAN Final correct description SCI 1 SCI SCI 3 X= e 1 e e 3 e e 8 e 9 e 10 4 e 5 e 6 e 7 R GCI = SS mod SS tot = R SCI1 R SCI R SCI In a situation like this is better to stop at an intermediate level of synthesis (i.e., SCIs level) because a GCI built as the arithmetic mean of MIs is not a good representation of the phenomenon to describe
23 PROPERTIES of CI FIRST PART Model-Based & Statistically estimated (non-normative) Confirmatory, Exploratory or Mixed Reflective and/or Formative Model assessment SECOND PART Scale-invariance Non-Compensability & Non-Negativity Reliability Unidimensionality, forming a General CI 3
24 Scale-invariance Data are normalized in order to allow the comparison and the combination of the MIs into the SCIs and GCI. Standardization Z = JXdiag(dg(Σ X )) 1/ with J=I n (1/n) 1 n 1 n Min-max normalization Z = X 1 n minx./(1 n maxx-1 n minx) Normalized dispersion Z = JXdiag(μ X ) -1 with J=I n -(1/n) 1 n 1' n A scale-invariant CI is a latent Indicator that is not sensitive to linear transformations such as normalization methods. 4
25 PROPERTIES of CI FIRST PART Model-Based & Statistically estimated (non-normative) Confirmatory, Exploratory or Mixed Reflective and/or Formative Model assessment SECOND PART Scale-invariance Non-Compensability & Non-Negativity Reliability Unidimensionality, forming a general CI 5
26 Non-Compensability & Non-Negativity. The CI satisfies the non-compensability property if its relationships with latent and/or MIs are all positives. Thus, the effect of the SCIs and/or MIs do not compensate each other. Ranking of the not compensated model: GCI SCI1 SCI e 1 e e 3 e 4 e 5 e 6 So non-negativity and non-compensability are strictly connected. 6
27 Non-Compensability & Non-Negativity. The CI satisfies the non-compensability property if its relationships with latent and/or MIs are all positives. Thus, the effect of the SCIs and/or MIs do not compensate each other. Ranking of the not compensated model: GCI Ranking of the compensated model: SCI1 SCI e 1 e e 3 e 4 e 5 e 6 So non-negativity and non-compensability are strictly connected. 7
28 PROPERTIES of CI FIRST PART Model-Based & Statistically estimated (non-normative) Confirmatory, Exploratory or Mixed Reflective and/or Formative Model assessment SECOND PART Scale-invariance Non-Compensability & Non-Negativity Reliability Unidimensionality, forming a general CI 8
29 Reliability, Unidimensionality & General Factor Reliability of a CI is the global consistency of MIs based on the correlations between different MIs on the same CI. It is frequently called internal consistency and it is usually measured with Cronbach's alpha (Cronbach, 1951) Unidimensionality evaluates to which extend a single latent indicator, generally a SCI, has been measured with a set of MIs. Unidimensionality is more realistic for SCIs, while Revelle and Zinbarg, (009) hypothesize that there is a general factor, i.e., a GCI that can be tested by nested confirmatory SCIs. A measure of unidimensionality for each SCI might be the variance of the second component of the the set of MIs explained by the related SCI. Example: GCI Factor 1 Factor Unidimensionality Reliability SCI 1 SCI SCI Factor 1 Factor Factor 3 Unidimensionality Reliability e 1 e e 3 e 4 e 5 e 6 e 7 e 8 e 9 e 10 8
30 30 APPLICATIONS

31 Human Development Index - HDI The HDI is the geometric mean of the previous three normalized indices; and we can measure the goodness of fit of the HDI by considering that the logarithm of the geometric mean is equal to the arithmetic mean of the logarithm of MIs. Each dimension is represented by a specific index(normalized with a own method): Life Expectancy Index (LEI), Education Index (EI) and Income Index (II). Let us consider: B = V = I 3 R HDI = SS mod = SS tot c = 1 3 = tr B V c log g HDI log g HDI c V B tr( log X log X ) Based on the above informations: Life Expectancy Index (LEI) = Actual LE 0/(85-0) Income Index (II) = {ln(gni pc)- ln(100)}/{ln(75,000) ln(100)} Education Index (EI) = MYSI+EYSI / Mean Years of Schooling Index (MYSI) = MYS-0 / 15-0 Expected Years of Schooling Index (EYSI) = EYS-0 / 18-0 Now, HDI is the geometric mean of previous three indices i.e. HDI= where log X is a matrix where each column is the logarithmic transformation of the respectively column of X.

32 Multidimensional Poverty Index- MPI The global Multidimensional Poverty Index (MPI) is an international measure of acute poverty covering over 100 developing countries developed by OPHI and the United Nations Development Programme. The index uses the same three dimensions as the Human Development Index: health, education, and standard of living. These are measured using ten indicators divided in three dimensions. Let us consider: B = diag( ) V = c = ( ) R MPI = SS mod SS tot = tr(( c V B B V c) 1 B V c g MPI g MPI ( c V B)( c V B B V c) 1 ) tr(x X) =
33 Application to Sustainable Development Goals 30


34 SDGs Europe: 100 Indicators, 17 Goals Goal1: 1- People at risk of poverty or social exclusion People at risk of poverty after social transfers Severely materially deprived people People living in households with very low work intensity Housing cost overburden rate Share of total population living in a dwelling with a leaking roof, damp walls, floors or foundation, or rot in window frames or floor 01. Goal3: 13- Life expectancy at birth Self-perceived health Death rate due to chronic diseases Suicide death rate Smoking prevalence Self-reported unmet need for medical examination and care Goal: 7- Obesity rate Agricultural factor income per annual work unit (AWU) Government support to agricultural research and development Area under organic farming Ammonia emissions from agriculture Gross nutrient balance on agricultural land 0.54 Goal4: 19- Early childhood education and care Early leavers from education and training Tertiary educational attainment Employment rate of recent graduates Adult participation in learning Underachievement in reading, maths and science Goal5: 5- Gender pay gap Gender employment gap Proportion of seats held by women in national parliaments and local government Proportion of women in senior management positions Physical and sexual violence by a partner or a non-partner Inactivity rates due to caring responsibilities Goal7: 37- Percentage of people affected by fuel poverty (inability to keep home adequately warm) Share of renewable energy in gross final energy consumption Primary energy consumption; final energy consumption by sector Final energy consumption in households per capita Energy dependence Energy productivity Goal6: 31- Share of total population having neither a bath, nor a shower, nor indoor flushing toilet in their household Population connected to urban wastewater treatment with at least secondary treatment Biochemical oxygen demand in rivers Nitrate in groundwater Phosphate in rivers Water exploitation index (WEI) Goal8: 43- Real GDP per capita - growth rate Young people neither in employment nor in education and training Total employment rate Long-term unemployment rate Involuntary temporary employment Fatal accidents at work by sex (NACE Rev., A, C-N) - Unstandardised incidence rate
35 35 Goal9: 49- Gross domestic expenditure on R&D Employment in high- and medium-high technology manufacturing sectors and knowledgeintensive service sectors Total R&D personnel Patent applications to the European Patent Office (EPO) Share of collective transport modes in total passenger land transport Share of rail and inland waterways activity in total freight transport Goal11: 61- Overcrowding rate by degree of urbanisation Distribution of population by level of difficulty in accessing public transport People killed in road accidents Urban population exposure to air pollution by particulate matter Proportion of population living in households considering that they suffer from noise Recycling rate of municipal waste 11.5 Goal13: 73- Greenhouse gas emissions (indexed totals and per capita) Greenhouse gas emissions intensity of energy consumption Global (and European) near surface average temperature Economic losses caused by climate extremes (consider climatological, hydrological, meteorological) Contribution to the 100bn international commitment on climate related expending (public finance) Share of EU population covered by the new Covenant of Mayors for Climate and Energy (integrating mitigation, adaptation, and access to clean and affordable energy) Goal15: 84- Forest area as a proportion of total land area Artificial land cover per capita Change in artificial land cover per year Common bird index Sufficiency of terrestrial sites designated under the EU habitats directive Estimated soil erosion by water Goal17: 96- Official development assistance as share of gross national income EU financing for developing countries EU Imports from developing countries General government gross debt Shares of environmental and labour taxes in total tax revenues Goal10: 55- GDP per capita in PPS Real adjusted gross disposable income of households per capita in PPS Relative median at-risk-of-poverty gap Gini coefficient of equivalised disposable income Income growth of the bottom 40 per cent of the population and the total population Number of first time asylum applications (total and accepted) per capita Goal1: 67- Generation of waste excluding major mineral wastes Recycling and landfill rate of waste excluding major mineral wastes Consumption of toxic chemicals Resource productivity Average CO emissions per km from new passenger cars Volume of freight transport relative to GDP 1.54 Goal14: 79- Bathing water quality Sufficiency of marine sites designated under the EU habitats directive Ocean acidification (CLIM 043) Catches in major fishing areas Assessed fish stocks exceeding fishing mortality at maximum sustainable yield (Fmsy) Goal16: 90- Death due to homicide, assault, by sex (tps00146) 91- Share of population which reported occurrence of crime, violence or vandalism in their area General government total expenditure on law courts Corruption Perception Index Perceived independece of the justice system Level of citizens' confidence in EU institutions 16.6

 Reliability: 8 goals are not reliable (low Cronbach's")
36 ASSESSMENT of HCI model: 17 goals BIC= Polarity: 38 MIs need to change polarity 100 Manifest Indicators 6 for each goal 33 MIs are not statistically significant for the model (correlation 0) (They are STATISTICS, but not INDICATORS) Reliability: 8 goals are not reliable (low Cronbach's alpha) Unidimensionality: only the goal 14 is unidimensional 33

37 Exploratory model: 8 factors BIC= SCI SCI SCI SCI 7 SCI 3 SCI 6 * 8 MIs are not statistically significant for the model SCI 4 SCI 5 34
38 Thank you for your kind attention.
BUILDING SOUND AND COMPARABLE METRICS FOR SDGS: THE CONTRIBUTION OF THE OECD DATA AND TOOLS FOR CITIES AND REGIONS
 BUILDING SOUND AND COMPARABLE METRICS FOR SDGS: THE CONTRIBUTION OF THE OECD DATA AND TOOLS FOR CITIES AND REGIONS STATISTICAL CAPACITY BUILDING FOR MONITORING OF SUSTAINABLE DEVELOPMENT GOALS Lukas Kleine-Rueschkamp
European Regional and Urban Statistics
 European Regional and Urban Statistics Dr. Berthold Feldmann berthold.feldmann@ec.europa.eu Eurostat Structure of the talk Regional statistics in the EU The tasks of Eurostat Regional statistics Urban
CHILD SAFETY COUNTRY PROFILE Croatia
 CHILD SAFETY COUNTRY PROFILE 2012 Croatia The Child Safety Country Profile 2012 for Croatia highlights the burden of child and adolescent injury and examines socio-demographic determinants to provide a
CHILD SAFETY COUNTRY PROFILE Slovenia
 CHILD SAFETY COUNTRY PROFILE 2012 Slovenia The Child Safety Country Profile 2012 for Slovenia highlights the burden of child and adolescent injury and examines socio-demographic determinants to provide
WORLD COUNCIL ON CITY DATA
 WORLD COUNCIL ON CITY DATA WCCD ISO 37120 STANDARDIZED CITY DATA TO MEET UN SDG TARGETS UN WORLD DATA FORUM Presented by: James Patava www.dataforcities.org @wccitydata PUBLICATION OF THE FIRST ISO STANDARD
Summary prepared by Amie Gaye: UNDP Human Development Report Office
 Contribution to Beyond Gross Domestic Product (GDP) Name of the indicator/method: The Human Development Index (HDI) Summary prepared by Amie Gaye: UNDP Human Development Report Office Date: August, 2011
Measuring Disaster Risk for Urban areas in Asia-Pacific
 Measuring Disaster Risk for Urban areas in Asia-Pacific Acknowledgement: Trevor Clifford, Intl Consultant 1 SDG 11 Make cities and human settlements inclusive, safe, resilient and sustainable 11.1: By
Topic 4: Changing cities
 Topic 4: Changing cities Overview of urban patterns and processes 4.1 Urbanisation is a global process a. Contrasting trends in urbanisation over the last 50 years in different parts of the world (developed,
Poverty statistics in Mongolia
 HIGH-LEVEL SEMINAR ON HARMONISATION OF POVERTY STATISTICS IN CIS COUNTRIES SOCHI (RUSSIAN FEDERATION) Poverty statistics in Mongolia Oyunchimeg Dandar Director Population and Social Statistics Department,
The Socio Economic Development of the Marine Sector in the Atlantic Area. Stephen Hynes
 The Socio Economic Development of the Marine Sector in the Atlantic Area Stephen Hynes Overview SEMRU and its role in Marine Socioeconomic analysis Defining Ocean and Coastal Economies in the Atlantic
Geography - Grade 8. Unit A - Global Settlement: Patterns and Sustainability
 Geography - Grade 8 Geographical Thinking: Spatial Significance Patterns and Trends Interrelationships Geographic Perspective Geographic Inquiry: STEP 1 - Formulate Questions STEP 2 - Gather and Organize
KENYA NATIONAL BUREAU OF STATISTICS Workshop on
 KENYA NATIONAL BUREAU OF STATISTICS Workshop on Capacity Building in Environment Statistics: the Framework for the Development of Environment Statistics (FDES 2013) Coordination with Sector Ministries
Key Indicators for Territorial Cohesion and Spatial Planning in Preparing Territorial Development Strategies
 ESPON Evidence in a North European Context Challenges and Opportunities for Territorial Development and Cohesion in a North European Macro Region, 10-11 April, 2014, Vilnius, Lithuania Key Indicators for
Introduction to Development. Indicators and Models
 Introduction to Development Indicators and Models First World vs. Third World Refers to economic development Diversity and complexity of economy High per capita income Developed during the Cold War First
REPUBLIC OF ZAMBIA STATEMENT THE HONOURABLE LUCKY MULUSA, M.P., MINISTER OF NATIONAL DEVELOPMENT PLANNING,
 REPUBLIC OF ZAMBIA Permanent Mi$sion of Zambia to the United Nations, 237 East 52nd Street, New York, NY 10022 Tex: (212) 888-5770 Fax: (212) 888-5213 E-mail: zambia@un.int Please check against delivery
How to measure Territorial Cohesion and Cooperation?
 How to measure territorial cohesion and cooperation? How to measure Territorial Cohesion and Cooperation? Brussels: 21 February Growth, Development or Cohesion? Economic Competitiveness Social Cohesion
Data Requirements in Multidimensional Poverty Measurement
 Data Requirements in Multidimensional Poverty Measurement Oxford Poverty & Human Development Initiative (OPHI) University of Oxford Rabat, 4 June 2014 Limits of the current global MPI surveys: DHS, MICS
Evaluation Model for the Sustainable Development of European Coastal Zones
 Evaluation Model for the Sustainable Development of European Coastal Zones SUMMARY Interreg IIIC - South 2 INDEX 1.- INTRODUCTION... 3 2.- CONTEXT OF DEDUCE... 4 3.- CURRENT SITUATION AND CHALLENGES...
Together towards a Sustainable Urban Agenda
 Together towards a Sustainable Urban Agenda The City We (Youth) Want Preliminary findings from youth consultations Areas Issue Papers Policy Units 1.Social Cohesion and Equity - Livable Cities 2.Urban
How rural the EU RDP is? An analysis through spatial funds allocation
 How rural the EU RDP is? An analysis through spatial funds allocation Beatrice Camaioni, Roberto Esposti, Antonello Lobianco, Francesco Pagliacci, Franco Sotte Department of Economics and Social Sciences
This table connects the content provided by Education Perfect to the NSW Syllabus.
 Education Perfect Geography provides teachers with a wide range of quality, engaging and innovative content to drive positive student learning outcomes. Designed by teachers and written by our in-house
European spatial policy and regionalised approaches
 Findings of the ESPON 2006 Programme COMMIN Final Conference 26-27 April 2007 European spatial policy and regionalised approaches by Dr. Kai BöhmeB ! Territory matters Structure of presentation! Territorial
Unit 6: Development and Industrialization. Day 1: What is development?
 Unit 6: Development and Industrialization Day 1: What is development? What is Development? The process of improving the material conditions of people through the diffusion of knowledge and technology More
E C O N O M I C R E V I E W
 UNDP NAMIBIA E C O N O M I C R E V I E W 2 0 0 7 1 Introduction 1 2 Overview of the Namibian Economy 2 2.1 Structure of the Economy 2 3 Economic Policy 5 4 Economic Trends 7 4.1 Primary Industry 7 4.2
2018 Review of SDGs implementation: SDG 11 Make cities and human settlements inclusive, safe, resilient and sustainable 1
 2018 Review of SDGs implementation: SDG 11 Make cities and human settlements inclusive, safe, resilient and sustainable 1 The pledge of Goal 11 to make cities and human settlements inclusive, safe, resilient
The System of Xiaokang Indicators: A Framework to Measure China's Progress
 Int. Statistical Inst.: Proc. 58th World Statistical Congress, 2011, Dublin (Session CPS020) p.6359 The System of Xiaokang Indicators: A Framework to Measure China's Progress Qingzhe Lv E-mail: lvqz@gj.stats.cn
Sustainability Science: The State of the Field
 Sustainability Science: The State of the Field Presented to The Sustainability Science Fellows Seminar Harvard University Sept. 17, 2012 by William C. Clark Sustainable Development Sustainable Development:
Megacity Research Project TP. Ho Chi Minh Adaptation to Global Climate Change in Vietnam: Integrative Urban and Environmental Planning Framework
 1. Organization 2. Global Warming 3. Starting Phase 4. Results, Transdisciplinarity, Low-Rise High Density 5. Risk of Flooding 6. Partners 7. Action Field 1 8. Action Field 2 9. Urban Development Trends
VII APPROACHES IN SELECTING A CORE SET OF INDICATORS
 HANDBOOK ON RURAL HOUSEHOLDS LIVELIHOOD AND WELL-BEING VII APPROACHES IN SELECTING A CORE SET OF INDICATORS VII.1 Introduction In Chapters III to VI of this Handbook, and in associated annexes, numerous
Presentation by Thangavel Palanivel Senior Strategic Advisor and Chief Economist UNDP Regional Bureau for Asia-Pacific
 Presentation by Thangavel Palanivel Senior Strategic Advisor and Chief Economist UNDP Regional Bureau for Asia-Pacific The High-Level Euro-Asia Regional Meeting on Improving Cooperation on Transit, Trade
BRITISH VIRGIN ISLANDS SECTORAL GROSS DOMESTIC PRODUCT MARKET PRICES (current prices) (US$M)
 (US$M)") SECTORAL GROSS DOMESTIC PRODUCT MARKET PRICES (current prices) Sector 1991 1992 1993 1994 1995 1996 1997 1998 1999 2000r 2001r 2002r 2003r 2004r 2005e Agriculture, Hunting & Forestry 1.36 1.50 1.63 1.77
SECTORAL GROSS DOMESTIC PRODUCT MARKET PRICES (current prices) Sector 1991 1992 1993 1994 1995 1996 1997 1998 1999 2000r 2001r 2002r 2003r 2004r 2005e Agriculture, Hunting & Forestry 1.36 1.50 1.63 1.77
How the science of cities can help European policy makers: new analysis and perspectives
 How the science of cities can help European policy makers: new analysis and perspectives By Lewis Dijkstra, PhD Deputy Head of the Economic Analysis Unit, DG Regional and European Commission Overview Data
Evidence on the impact of sustained exposure to air pollution on life expectancy from China s Huai River policy, Chen et al.
 Evidence on the impact of sustained exposure to air pollution on life expectancy from China s Huai River policy, Chen et al. 2013, PNAS 11.4.2017 Matti Liski Department of Economics, BIZ Research question
Apéndice 1: Figuras y Tablas del Marco Teórico
 Apéndice 1: Figuras y Tablas del Marco Teórico FIGURA A.1.1 Manufacture poles and manufacture regions Poles: Share of employment in manufacture at least 12% and population of 250,000 or more. Regions:
Opportunities and challenges of HCMC in the process of development
 Opportunities and challenges of HCMC in the process of development Lê Văn Thành HIDS HCMC, Sept. 16-17, 2009 Contents The city starting point Achievement and difficulties Development perspective and goals
Overview of proposed approach to the Desktop Study to inform discussion
 LTAS Phase 2: Climate Change Implications for the Human Settlements sector in South Africa Overview of proposed approach to the Desktop Study to inform discussion Project Team Project Lead: Crispian Olver
Land Use in the context of sustainable, smart and inclusive growth
 Land Use in the context of sustainable, smart and inclusive growth François Salgé Ministry of sustainable development France facilitator EUROGI vice president AFIGéO board member 1 Introduction e-content+
National Spatial Development Perspective (NSDP) Policy Coordination and Advisory Service
 Policy Coordination and Advisory Service") National Spatial Development Perspective (NSDP) Policy Coordination and Advisory Service 1 BACKGROUND The advances made in the First Decade by far supersede the weaknesses. Yet, if all indicators were
National Spatial Development Perspective (NSDP) Policy Coordination and Advisory Service 1 BACKGROUND The advances made in the First Decade by far supersede the weaknesses. Yet, if all indicators were
TERRITORIAL COHESION MEASUREMENT AT THE REGIONAL SCALE. A METHODOLOGICAL PROPOSAL AND APPLICATION IN ANDALUSIA
 Boletín Territorial de la Asociación cohesion measurement de Geógrafos at Españoles the regional N.º scale. 68-2015, A methodological págs. 455-459 proposal and application in Andalusia I.S.S.N.: 0212-9426
PROPOSED MST RESEARCH PROGRAM
 UNWTO Statistics and Tourism Satellite Account Programme COMMITTEE ON STATISTICS AND THE TOURISM SATELLITE ACCOUNT Seventeenth meeting UNWTO Headquarters, Madrid, Spain 24-25 January 2017 PROPOSED MST
The UN-GGIM: Europe core data initiative to encourage Geographic information supporting Sustainable Development Goals Dominique Laurent, France
 INSPIRE conference Strasbourg 6 September 2017 The UN-GGIM: Europe core data initiative to encourage Geographic information supporting Sustainable Development Goals Dominique Laurent, France Introduction
Land Accounts - The Canadian Experience
 Land Accounts - The Canadian Experience Development of a Geospatial database to measure the effect of human activity on the environment Who is doing Land Accounts Statistics Canada (national) Component
Towards an International Data Set for MST
 Towards an International Data Set for MST Carl Obst, UNWTO Consultant 15 October, 2018 Background and context The key role of the Measuring the Sustainability of Tourism (MST) project is to support more
ESPON public database
 ESPON public database - tables and indicators overview - NUTS-Reference: NUTS 0 reference NUTS 1 reference NUTS 2 reference NUTS 3 reference ESPON basic indicators: Area NUTS 2 Area in square kilometer
Global Atmospheric Circulation. Past climate change and natural causes. Global climate change and human activity
 GCSE Geography Edexcel B Revision Checklist Paper 1. Global Geographical Issues Topic 1. Hazardous Earth Key Idea I know/ understand The world s climate system Global Atmospheric Circulation Past climate
Indicators of sustainable development: framework and methodologies CSD Indicators of sustainable development 1996
 Indicators of sustainable development: framework and methodologies CSD Indicators of sustainable development 1996 Keywords: mountain areas, mountain development, natural resources management, sustainable
The Global Fundamental Geospatial Data Themes Journey. April Clare Hadley WG Chair
 The Global Fundamental Geospatial Data Themes Journey April 2018 Clare Hadley WG Chair The Road to here Why Global? Why Geospatial? Why Fundamental? Why Themes? The route we took Where does the road go
Sustainable tourism in for Sustaibale Danang
 Sustainable tourism in for Sustaibale Danang A case study of Balearic Ecotax in Spain toward Sustainable tourism Miki Yoshizumi Associate Professor College of Gastronomy Management Ritsumeikan University
Unit 3: Making Geographical Decisions. Do not return the Resource Booklet with the question paper
 Edexcel GCSE Geography B Unit 3: Making Geographical Decisions Sample Assessment Material Resource Booklet Paper 3F and 3H Paper Reference 5GB3F/01 5GB3H/01 Do not return the Resource Booklet with the
Jun Tu. Department of Geography and Anthropology Kennesaw State University
 Examining Spatially Varying Relationships between Preterm Births and Ambient Air Pollution in Georgia using Geographically Weighted Logistic Regression Jun Tu Department of Geography and Anthropology Kennesaw
Statistical-geospatial integration - The example of Sweden. Marie Haldorson Director, Statistics Sweden
 Statistical-geospatial integration - The example of Sweden Marie Haldorson Director, Statistics Sweden Spatial data and geospatial applications at Statistics Sweden Long tradition GI integrated in production
11/11/2016. Energy Impacts Research Coordination Network >>>
 Energy Impacts Research Coordination Network >>> www.energyimpacts.org Synergies and Innovations in Coordinating Energy Impacts Research: The Case of Shale Development Impacts November 10, 2016, 1:30 2:30
CERTIFIED RESOLUTION. introduction: and dated May 29, 2017, as attached, as appropriate
 15322 Buena Vista Avenue, White Rock BC, Canada V4B 1Y6 www.whiterockcity.ca City of White Rock P: 604.541.22121 F: 604.541.9348 /2tC% City Clerk s Office IT E ROC K June 13,2017 Stephanie Lam, Deputy
8 th Meeting of IAEG-SDGs 5 8 November 2018, Stockholm, Sweden. Meetings. Report
 Meetings 8 th Meeting of IAEG-SDGs Between April 2018 and November 2018, the Working Group on Geospatial Information of the IAEG- SDGs held two online meetings; presented a report to the United Nations
The European regional Human Development and Human Poverty Indices Human Development Index
 n 02/2011 The European regional Human Development and Human Poverty Indices Contents 1. Introduction...1 2. The United Nations Development Programme Approach...1 3. Regional Human Development and Poverty
Assessment of Sustainable Land Use within the Town Planning Process Experiences with a Multi Criteria Approach (MCA)
") Assessment of Sustainable Land Use within the Town Planning Process Experiences with a Multi Criteria Approach (MCA) Dipl.-Geogr. Sophie Schetke Dipl.-Ing. Benedikt Frielinghaus, University of Bonn, Germany
Assessment of Sustainable Land Use within the Town Planning Process Experiences with a Multi Criteria Approach (MCA) Dipl.-Geogr. Sophie Schetke Dipl.-Ing. Benedikt Frielinghaus, University of Bonn, Germany
Dr. Biliana Cicin-Sain President, Global Ocean Forum 1
 Towards a Sustainable Development Goal on Oceans and Seas: Healthy, Productive and Resilient Oceans and Seas- Prosperous and Resilient Peoples and Communities Dr. Biliana Cicin-Sain President, Global Ocean
Advancing Geoscientific Capability. Geological Survey of Finland
 Advancing Geoscientific Capability Geological Survey of Finland GTK in brief The Geological Survey of Finland (GTK) is one of the largest European centres of excellence in assessment, research and the
C/W Qu: How is development measured? 13/6/12 Aim: To understand how development is typically measured/classified and the pros/cons of these
 C/W Qu: How is development measured? 13/6/12 Aim: To understand how development is typically measured/classified and the pros/cons of these Starter: Comment on this image Did you spot these? Rubbish truck
Geospatial Technologies for Resources Planning & Management
 Geospatial Technologies for Resources Planning & Management Lal Samarakoon, PhD Director, Geoinformatics Center Asian Institute of Technology, Thailand Content Geoinformatics for SDG Information Integration
Mediterranean Sea and Territorial Development, Opportunities and Risks
 EESC Hearing Towards an EU Macro-Regional Strategy for the Mediterranean Mediterranean Sea and Territorial Development, Opportunities and Risks Michaela Gensheimer Structure of Intervention Part I: What
Resource efficiency and Geospatial data What EUROSTAT does. What could do.
 Resource efficiency and Geospatial data What EUROSTAT does. What could do. Pedro Díaz Muñoz Director Sectoral and Regional Statistics, Eurostat 29/06/2011 Statements - Large amount of information to understand
NÁRODOHOSPODÁŘSKÝ OBZOR REVIEW OF ECONOMIC PERSPECTIVES, VOL. 10, ISSUE 4, 2010, pp , DOI: /v
 NÁRODOHOSPODÁŘSKÝ OBZOR REVIEW OF ECONOMIC PERSPECTIVES, VOL. 10, ISSUE 4, 2010, pp. 151 173, DOI: 10.2478/v10135-011-0003-1 INNOVATION PERFORMANCE OF THE CZECH REGIONS Vladimír Žítek Masaryk University,
Concept note. High-Level Seminar: Accelerating Sustainable Energy for All in Landlocked Developing Countries through Innovative Partnerships
 Concept note High-Level Seminar: Accelerating Sustainable Energy for All in Landlocked Developing Countries through Innovative Partnerships Date: 24 and 25 October 2016 Venue: Conference Room C3, Vienna
Assessing Social Vulnerability to Biophysical Hazards. Dr. Jasmine Waddell
 Assessing Social Vulnerability to Biophysical Hazards Dr. Jasmine Waddell About the Project Built on a need to understand: The pre-disposition of the populations in the SE to adverse impacts from disaster
Difference in regional productivity and unbalance in regional growth
 Difference in regional productivity and unbalance in regional growth Nino Javakhishvili-Larsen and Jie Zhang - CRT, Denmark, Presentation at 26 th International input-output conference in Brazil Aim of
Poverty and Hazard Linkages
 Poverty and Hazard Linkages Global Risk Identification Programme Proposal Development Coordination Meeting Friday, 19 May 2006 CIESIN Earth Institute Columbia University www.ciesin.columbia.edu Data Improvements
Enquiry question: How does the world s climate system function, why does it change and how can this be hazardous for people?
 Content Topic 1: Hazardous Earth Enquiry question: How does the world s climate system function, why does it change and how can this be hazardous for people? 1.1 The atmosphere operates as a global system
INTEGRATING CLIMATE VULNERABILITY & RISK ASSESSMENT INTO URBAN SPATIAL PLANNING PROCESS
 INTEGRATING CLIMATE VULNERABILITY & RISK ASSESSMENT INTO URBAN SPATIAL PLANNING PROCESS (CASE STUDY: BLITAR CITY, EAST JAVA, INDONESIA) SHINTA MICHIKO PUTERI, ST, MT. DR. IR. DENNY ZULKAIDI, MUP. WRITER
A Framework for the Study of Urban Health. Abdullah Baqui, DrPH, MPH, MBBS Johns Hopkins University
 This work is licensed under a Creative Commons Attribution-NonCommercial-ShareAlike License. Your use of this material constitutes acceptance of that license and the conditions of use of materials on this
Real GDP Growth to Clock 6.75 Percent this Fiscal. Economic Survey Predicts Percent Growth in
 ETEN Enlightens-Daily current capsules (Prelims Prominence) 30 th Jan 2018 Economic Survey 2017-18 Real GDP Growth to Clock 6.75 Percent this Fiscal Economic Survey Predicts 7-7.5 Percent Growth in 2018-19
Multidimensional Poverty in Colombia: Identifying Regional Disparities using GIS and Population Census Data (2005)
") Multidimensional Poverty in Colombia: Identifying Regional Disparities using GIS and Population Census Data (2005) Laura Estrada Sandra Liliana Moreno December 2013 Aguascalientes, Mexico Content 1. Spatial
Multidimensional Poverty in Colombia: Identifying Regional Disparities using GIS and Population Census Data (2005) Laura Estrada Sandra Liliana Moreno December 2013 Aguascalientes, Mexico Content 1. Spatial
Multi-dimensional Human Development Measures : Trade-offs and Inequality
 Multi-dimensional Human Development Measures : Trade-offs and Inequality presented by Jaya Krishnakumar University of Geneva UNDP Workshop on Measuring Human Development June 14, 2013 GIZ, Eschborn, Frankfurt
World Geography. WG.1.1 Explain Earth s grid system and be able to locate places using degrees of latitude and longitude.
 Standard 1: The World in Spatial Terms Students will use maps, globes, atlases, and grid-referenced technologies, such as remote sensing, Geographic Information Systems (GIS), and Global Positioning Systems
Regional Plan 4: Integrating Ecosystem Services Mapping into Regional Land Use Planning
 Rural-Urban Outlooks: Unlocking Synergies (ROBUST) ROBUST receives funding from the European Union s Horizon 2020 research and innovation programme under grant agreement No 727988.* October 2018 Natural
Dar es Salaam - Reality Check Workshop
 Dar es Salaam - Reality Check Workshop hosted by GIZ and Dar es Salaam City Council Introduction: Key Urban Characteristics of Dar es Salaam Challenges and Opportunities for Resilient Development in the
BOSNIA AND HERZEGOVINA
 Studies to support the development of sea basin cooperation in the Mediterranean, Adriatic and Ionian, and Black Sea CONTRACT NUMBER MARE/2012/07 - REF. NO 2 REPORT 1 - ANNEX 2.2 COUNTRY FICHE - ANNEX
Experience and perspectives of using EU funds and other funding for the implementation of district renovation projects
 Experience and perspectives of using EU funds and other funding for the implementation of district renovation projects Ministry of the Interior of Lithuania Regional policy department Administration, coordination,
 Table 1. Answers to income and consumption adequacy questions Percentage of responses: less than adequate more than adequate adequate Total income 68.7% 30.6% 0.7% Food consumption 46.6% 51.4% 2.0% Clothing
Chapter 10 Human Settlement Geography Book 1 Class 12
 CHAPTER 10 HUMAN SETTLEMENTS 1. RURAL, SUB URBAN AND URBAN SETTLEMENTS: This classification is common worldwide but the criteria differ from country to country. 5. Criteria for classification differs from
16540/14 EE/cm 1 DG E 1A
 Council of the European Union Brussels, 5 December 2014 (OR. en) 16540/14 ENV 965 CULT 139 NOTE From: To: Subject: General Secretariat of the Council Delegations Charter of Rome on Natural and Cultural
The Economic and Social Health of the Cairngorms National Park 2010 Summary
 The Economic and Social Health of the Cairngorms National Park 2010 Published by Cairngorms National Park Authority The Economic and Social Health of the Cairngorms National Park 2010 This summary highlights
MEANING AND MEASURES OF DEVELOPMENT
 MEANING AND MEASURES OF DEVELOPMENT PROFESSOR RODDY FOX RODDY.FOX@HV.SE 1 Outcomes of this Module Demonstrate a reasoned understanding of spatial variations at the global scale of selected development
ES103 Introduction to Econometrics
 Anita Staneva May 16, ES103 2015Introduction to Econometrics.. Lecture 1 ES103 Introduction to Econometrics Lecture 1: Basic Data Handling and Anita Staneva Egypt Scholars Economic Society Outline Introduction
The Role of Inequality in Poverty Measurement
 The Role of Inequality in Poverty Measurement Sabina Alkire Director, OPHI, Oxford James E. Foster Carr Professor, George Washington Research Associate, OPHI, Oxford WIDER Development Conference Helsinki,
COSTA RICA Limon City-Port Project
 COSTA RICA Limon City-Port Project 2008 2013 photos by Stefania Abakerli Stefania Abakerli Cecilia Corvalan Context Costa Rica Well-known tourist destination in CA (8.4% GDP) Long tradition of political
Measuring Poverty. Introduction
 Measuring Poverty Introduction To measure something, we need to provide answers to the following basic questions: 1. What are we going to measure? Poverty? So, what is poverty? 2. Who wants to measure
Integrated Strategies in regional development
 Inspire policy making by territorial evidence ESPON Seminar Territories Acting for Economic Growth: Using territorial evidence to meet challenges towards 2020 Integrated Strategies in regional development
SUSTAINABILITY - RELATED STRATEGIES AND URBAN SETTLEMENTS
 SUSTAINABILITY - RELATED STRATEGIES AND URBAN SETTLEMENTS KEY CONCEPTS: In this session, we will consider the following: Rural Development Programmes & Strategies Rural Development Programmes & Strategies
9768 GEOGRAPHY. Mark schemes should be read in conjunction with the question paper and the Principal Examiner Report for Teachers.
 CAMBRIDGE INTERNATIONAL EXAMINATIONS Cambridge Pre-U Certificate MARK SCHEME for the May/June 2015 series 9768 GEOGRAPHY 9768/01 Paper 1 (Geographical Issues), maximum raw mark 105 This mark scheme is
UN-OHRLLS. Opening Statement for. Ms. Fekitamoeloa Katoa Utoikamanu. High Representative and Under-Secretary-General
 Please check against delivery UN-OHRLLS Opening Statement for Ms. Fekitamoeloa Katoa Utoikamanu High Representative and Under-Secretary-General Least Developed Countries, Landlocked Developing Countries
Migration Modelling using Global Population Projections
 Migration Modelling using Global Population Projections Bryan Jones CUNY Institute for Demographic Research Workshop on Data and Methods for Modelling Migration Associated with Climate Change 5 December
Role of SF-MST. A summary of SF-MST
 A summary of SF-MST UNWTO Committee on Statistics and TSA Madrid, 27 & 28 February 2018 Carl Obst, IDEEA Group Consultant to UNWTO Role of SF-MST Respond to the significant demand for robust measures of
The challenge of globalization for Finland and its regions: The new economic geography perspective
 The challenge of globalization for Finland and its regions: The new economic geography perspective Prepared within the framework of study Finland in the Global Economy, Prime Minister s Office, Helsinki
Challenges of Urbanisation & Globalisation
 Challenges of Urbanisation & Globalisation Prepared by: Khairul Hisyam Kamarudin, PhD Feb 2016 Based on original lecture note by: Wan Nurul Mardiah Wan Mohd Rani, PhD URBANIZATION What is Urbanization?
Are EU Rural Areas still Lagging behind Urban Regions? An Analysis through Fuzzy Logic
 Are EU Rural Areas still Lagging behind Urban Regions? An Analysis through Fuzzy Logic Francesco Pagliacci Department of Economics and Social Sciences Università Politecnica delle Marche Ancona (Italy)
GCE. Geography. Mark Scheme for June Advanced Subsidiary GCE Unit F762: Managing Change in Human Environments
 GCE Geography Advanced Subsidiary GCE Unit F762: Managing Change in Human Environments Mark Scheme for June 2011 Oxford Cambridge and RSA Examinations OCR (Oxford Cambridge and RSA) is a leading UK awarding
Disaster Risk Assessment: Opportunities for GIS and data management with Open DRI
 Disaster Risk Assessment: Opportunities for GIS and data management with Open DRI Jacob Opadeyi Department of Geomatics Engineering and Land Management, The University of the West Indies, St. Augustine,
International Journal of Advances in Management, Economics and Entrepreneurship. Available online at: RESEARCH ARTICLE
 International Journal of Advances in Management, Economics and Entrepreneurship Available online at: www.ijamee.info RESEARCH ARTICLE A Factor Analysis of Determinants of Human Development in Rural Odisha
Pathways. Pathways through the Geography Major
 Pathways through the Major majors may structure their course selections around a sub-field of. Pathways are suggestions for classes in, in related disciplines, and skills training. Each pathway includes