Appendix 10 Reliability Modeling
|
|
|
- Lynn Wilcox
- 5 years ago
- Views:
Transcription
1 Appendix 10 Reliability Modeling Reliability analysis is that part of the risk study that leads to an evaluation of the conditional probability of failure (i.e., reliability or fragility) of structures, systems, and components when they are exposed to the loads of a hurricane. The reliability analysis had three steps: (1) define and characterize the structures, components, and features constituting the hurricane protection system (HPS) for each drainage basin; (2) define failure and identify failure modes and limit states for each structure, system, component, and feature; and (3) assign conditional probabilities to HPS failure states for given water elevations and wave heights caused by hurricane conditions. Two conditions were analyzed for the reliability of levees, flood walls, and pumping stations: pre-katrina and post-reconstruction and repair as existing in June The appendices contain an inventory of the structures, systems, and components in each drainage basin that were considered in the reliability analysis. The reliability of the hurricane protection system under potential water elevations due to surge and waves was quantified using structural and geotechnical reliability models integrated within a larger systems description of each drainage basin. The reliability models for the HPS components were developed based on design and construction information as reported in the General Design Memoranda (GDM) for the specific projects, and on the results of the Performance Team and the Pump Stations Team on-site surveys of existing conditions. Reliability models were developed and evaluated to determine most likely failure modes for each reach in each drainage basin. The reliability models included uncertainties in structural material properties, geotechnical engineering properties, subsurface geological profiles, and engineering performance models of levees, floodwalls, and features. Uncertainties due to spatial and temporal variation, and those due to limited knowledge were tracked separately in the analysis, providing a best estimate of the frequency of failure under given hurricane loads, along with a measure of the uncertainty in that frequency. VIII-10-1
2 Failure and Failure Modes The HPS for each drainage basin has four components: (1) levees, (2) I-walls (which may be atop levees) and T-walls (which may be atop levees), (3) transitions and closures, and (4) pumping and drainage systems (Table 1). The reliability analysis examined the performance of the each of component, separately and in combination. Failures that lead to breach of the drainage basin perimeters were associated with four principal failure modes: (1) levee or levee foundation failure, (2) floodwall or floodwall foundation failure, (3) levee or floodwall erosion caused by overtopping and wave run-up, and (4) failure modes associated with point features such as transitions, junctions, and closures. The Performance Team found no failures in the HPS which originated in structural failure of the I-wall or T-wall components. All documented failures at I-wall and T-wall locations were geotechnical in nature, with structural damage resulting from the geotechnical failures. Table 1. Components in the Hurricane Protection System 1 Levees Embankment section (Reaches were defined on the basis of physical discontinuities - geometric, physical, soils, and construction characteristics) Foundation 2 Floodwalls Wall structure Joints within a wall section Transitions (joints and interfaces to other components) Wall-embankment interface Wall foundation 3 Closures Closure support structure Closure structures - logs, gate, or other Position open or closed 4 Pump Systems Pump and motors Power grid availability Emergency power (diesel generator) Diesel fuel availability Pump house structure Operators present or evacuated Intakes open or closed Each section within the drainage basin perimeter was analyzed and tracked separately, so that the number of failed sections and their location around the drainage basin perimeter was known for each repetition of the HPS risk model. The pumping system may have had a mitigating effect on the water elevation of each drainage basin. If the capacity of the pumping system was exceeded by the inflow volume from a single breach then the number and location of the breaches may not matter and the pumping system can be ignored in the risk analysis. If, however, the inflow volume is within the capacity of the pumping system to remove, then the probability that the pumps are operating must also be calculated. Technical input from other Teams informed the present effort to determine the level of detail with which failure states need to be represented. VIII-10-2
3 The following structures in the HPS were not independently evaluated for their failure modes: (1) concrete aprons associated with some I-walls, and (2) sheetpiles with a short (3 to 4 ft.) concrete cap. Either could be addressed with failure modes developed for I-walls, but were not included in the present study. The following failure modes or contributing factors were not considered in the reliability analysis: (1) Internal erosion (piping) of levees due to seepage; note, this is in contrast to high pore pressures in sand strata, which was considered, as in the vicinity of the London Avenue Canal or the northern end of the IHNC. Internal erosion may be reconsidered in later studies. (2) The effects of maintenance on the HPS capacity over time. Improper maintenance or neglect can lead to reduced capacity of the levees in particular; gates and other moving components also require maintenance. Trees, landscaping, and pools were observed on protected embankments after Hurricane Katrina, indicating a lack of code enforcement and maintenance of the levees. However, there was insufficient information to include maintenance considerations. (3) Impact by a barge, floating debris, or other large object on the floodwalls or levees. (4) Failure of 3-bulb water stops between I-wall sections. Component Performance For each component, a performance level was defined such that its occurrence corresponded to a failure to perform an intended function. The critical components within the HPS, as stated above, are the levees, I-walls, T-walls, and transitions and closures. These components can fail in a variety of modes. For each mode of failure a limit state was defined, which, if it were to occur would result in a failure to keep water out of the drainage basin. Engineering models of the mechanics of component performance are limited in their ability to explicitly model a failure state. As a result, an analysis is usually carried out for incipient failure by examining the limits of stability. If this state is equaled or exceeded, the structure or component is expected to fail to perform as intended. Incipient failure models were usually similar to design calculations, and in many cases were adapted from the GDM s. For the purpose of evaluating the performance of the levees and floodwalls, failure was defined as complete breaching, which allowed water to enter the drainage basin. This failure occurred in two ways: (1) loss of levee or wall stability when the strength of the levee or wall and its foundation was insufficient to withstand the forces placed upon the structure for a given water elevation below the top of the wall or levee (no overtopping); or (2) overtopping caused the protected side of the levee or wall to erode substantially and result in a wall or levee breach, which allowed water to flow freely into the drainage basin. VIII-10-3
4 System Failure Depending on the performance of individual components in the HPS, various outcomes may result. For purpose of evaluating the performance of the HPS, the outcome of most interest is whether a protected area was flooded or not. The HPS was assumed to fail if flooding occurred in a protected area, beyond that expected from rainfall and runoff which can be handled by pumping. Given this definition, a failure of the HPS occurred even if the components making up the system did not fail, for example, if levees or walls were overtopped but not breached. Flooding can occur as a result of chains of events occurring individually or in combination. Among these are: (1) Levee or floodwall breaching. (2) Inflow into an area due to levee or flood wall overtopping that does not result in breeching, and which exceeds the capacity of the pumping system. (3) Inflow to an area that occurs as a result of rainfall. (4) Inflow to an area that occurs when the capacity of the pump system is exceeded as a result of backflow through pump houses. Flooding that occurs as a result of rainfall or transient overtopping in most cases will not be as consequential and may be mitigated by the pumping system. HPS systems definition The HPS comprises levees, flood walls, levees with floodwalls on top, and various points of transition or localized features such as pumping stations, drainage works, pipes penetrating the barrier, and gates. Each drainage basin perimeter was divided into reaches, which were deemed to be homogeneous in four respects: (1) structural cross-section, (2) elevations in the cross section, (3) geotechnical cross-section, and (4) hurricane surge. In total, 135 such reaches, 197 point features and gates, and 178 section transitions were identified across all of the drainage basins for the pre-katrina conditions; and 138 such reaches with the above numbers of features and transitions were identified across all of the drainage basins for the current (June 2007) conditions. Geometric and engineering material properties were identified for each reach and summarized in systems definition tables (Table 2). Structural cross-sections were initially identified by review of as-built drawings, aerial photographs, and GIS overlays; and were subsequently confirmed in on-site reconnaissance. Elevations were assessed in the same reconnaissance, supplemented by LIDAR and field surveys provided to the Risk Team. Geotechnical cross-sections and corresponding soil engineering properties were derived from original USACE General Design Memoranda (GDM) for the respective project areas of each drainage basin, supplemented by site characterization data collected post-katrina at levee and VIII-10-4
5 flood wall failure sites (cone penetrometer and laboratory measurements on undisturbed samples). GDM s are available in PDF format at the IPET Project web site. Engineering performance models and calculations were adapted from the GDM s. Engineering parameter and model uncertainties were propagated through those calculations to obtain approximate fragility curves as a function of water height for components of the HPS. These results were calibrated against the analyses of the Performance Team, which applied more sophisticated analysis techniques to similar structural and geotechnical profiles in the vicinity of failures. Failure modes identified by the Performance Team were incorporated into the reliability analyses as those results became available. Reaches The HPS was divided into reaches. A reach is defined for the purpose of the reliability analysis as, Reach. A continuous length of levee or wall exhibiting homogeneity of construction, geotechnical conditions, hydrologic and hydraulic loading conditions, consequences of failure, and possibly other features relevant to performance and risk. Thus, reaches are homogeneous lengths of levee or wall that differ from neighboring reaches in at least one of the above properties, and which are considered internally homogeneous for the purposes of reliability modeling and risk analysis. All two-dimensional sections within a reach are considered to be the same with respect to those properties relevant to risk and reliability; thus, the fragility of the levee (i.e., probability of failure as a function of load) is modeled as the same everywhere within an individual reach. Reach information was summarized in a systems definition file, which is a flat-file data base summarizing physical characteristics of each reach. An example for the first 33 defined reaches is shown as Table 2. Fragility curves Reliability assessments were performed for individual parts of the HPS for given water elevations. This resulted in fragility curves by mode of failure. A fragility curve gives the probability of failure, conditional upon an event (water elevation in this study), at which a limiting failure state is exceeded (Table 2). VIII-10-5
6 Figure 1. The actual but unknown fragility curve for a section is a step function at the loading conditions that causes failure; this is approximated by an S-shaped probability curve reflecting what is known about the levee and loads. In actuality, the fragility at a particular cross section within a reach is a step function at that deterministic loading condition that initiates failure (Figure 1). Presumably, there is such a failure loading condition, which if it occurs will cause failure; however, that loading condition varies along the length of the reach and is not precisely known before a failure occurs. The S- shaped fragility curve reflects uncertainty about the unique loading condition that causes failure at a particular location. The S-shaped fragility curve reflects uncertainty about the unique loading condition that causes failure at a particular location. Part of the uncertainty in the S-shaped fragility curve has to with systematic uncertainties, such as the average soil strength or average permeability along the reach, or the simplifications introduced in the performance models that apply everywhere; but another part has to do with spatial variability within the reach. This separation of uncertainty in how fragility curves are modeled within a single reach introduced a length effect caused by the way we model uncertainty. The systematic uncertainties, which cause a bias in the modeling, affect every section within the reach in the same way: if the mean soil permeability is underestimated at one spot it is similarly underestimated everywhere. The spatial variability, on the other hand, does not affect every section in the same way: some spots are weaker and some stronger. Therefore, the longer the reach, the higher the probability of encountering a particularly weak variation. Note, this length effect is due to incomplete VIII-10-6
7 knowledge: collect enough information and it goes away, but there is seldom that much information. Systems definition in the risk model Reliability assessments for each reach and component of the drainage basin perimeter were combined in the HPS risk model. The risk model (Appendix 9) used water elevations from the hurricane hazard and HPS fragilities to calculate the probability of various volumes of water passing the HPS, and subsequently the depth of flooding within each drainage basin. The system risk model is structured around an event-tree description of the occurrence of hurricane events, corresponding water and wave heights, and the resulting response of the HPS. The risk model separately tracks natural variations and knowledge uncertainties from both the hurricane hazard and the structural and geotechnical response to give a best estimate of frequency and depth of flooding, along with measures of uncertainty in those frequencies. VIII-10-7
8 Table 2. Reach systems definition table (partial section, schematic only); showing geometric, material, and design properties to the left; and fragility estimates to the right as a function of still-water level with respect to design elevations. Reach Length (ft) Weighted Elevation (ft) (1) (NAVD ) Fragility Water Elevation (ft) (2) (NAVD ) Reach Type Foundation Material Type (H, C, S) Polder Reference Subpolder Reference (3) Erosion Modifier for W/L PF Fragility Curve (Breach/No Overtopping) Minimum Elevation for Pf=0 Design Elev. (L) 6 ft from TOW (W) Top of Levee/Top of Wall 1/2 ft Overtopping PF Fragility Curve (Breach/Overtopping) 1 ft Overtopping 2 ft Overtopping 1 2, W H 2 NOE L H 2 NOE , W H 2 NOE , L H 2 NOE , W H 2 NOE , L H 2 NOE , W H 2 NOE , L H 2 NOE L H 2 NOE L H 2 NOE , L H 2 NOE , L H 2 NOE , L H 2 NOE , L H 2 NOE W H 2 NOE W H 2 NOE , L H 2 NOE , L H 2 NOE , W H 2 NOE , L H 2 NOE W H 2 NOE W H 2 NOE , L H 2 NOE , W H 2 NOE , L H 2 NOE , W H 2 NOE , L H 2 NOE , L H 2 NOE W H 2 NOE L H 2 NOE ft Overtopping VIII-10-8
9 Uncertainties The Corps of Engineers Technical Letter ETL , Risk-Based Analysis in Geotechnical Engineering for Support of Planning Studies, (USACE 1999), and the detailed of epistemic uncertainties in Appendix 11 of this report, suggest that the principal sources of uncertainty in predictions of levee performance requiring evaluation are: a. Uncertainty in loadings. Loadings such as floods, earthquakes, and impacts are random events for which magnitude and time of occurrence may be modeled by probabilistic methods. This often involves the use of binomial or Poisson distributions fit to observed event data. b. Uncertainty in parameter values. Geotechnical parameters such as soil strength and permeability have several components of uncertainty. The value of a parameter at any point and the average value over any distance are inherently uncertain because of soil s natural spatial variability. Secondly, there is uncertainty due to testing errors and uncertainty in estimating the mean and variance of the properties due to the finite number of tests performed. The normal and lognormal distributions are often used to model parameter values, which may be the value at a point or the spatially averaged value calculated over some distance or area. c. Uncertainty in analytical models. Analytical models such as slope stability analysis methods, seepage equations, etc., have an inherent model uncertainty arising from the fact that they are mathematical simplifications of more complex problems, and unsatisfactory performance such as slope instability or piping may occur in the prototype at factors of safety above or below the limit state FS = 1.0 corresponding to these conditions in the model. Model uncertainty has not been systematically considered in most Corps studies to date. Where probabilistic methods are used to make economic comparisons of alternatives, probability values calculated using consistent models should provide a consistent basis for comparison even though model uncertainty is not included. d. Uncertainty in performance. As parameter values and analytical models both have inherent uncertainty, the performance of a structure with respect to some quantifiable performance mode (slope stability, seepage, settlement, etc.) is likewise uncertain. The probability of satisfactory or unsatisfactory performance for modes with well-defined models and parameters is often calculated using first-order, second-moment (FOSM) methods, such as the Taylor s series method, which yield a reliability index or probability of unsatisfactory performance Pr(U). This approach quantifies uncertainty in performance as a function of uncertainty in parameter values and the analytical model. e. Performance modes without defined limit states. In some cases, engineering models may not be formulated to include limit states (e.g., FS = 1) and hence may not be easily reformulated to provide a reliability index or probability of unsatisfactory performance. Instead, satisfactory performance is expected to be attained by the adoption of experienced-based practices. An example is the design of filter materials, where equations can be used to design filters expected to perform adequately and prevent internal erosion, but there is no measure such as the factor of safety on which to base a mathematical procedure for comparing the relative reliability of filters. These situations are not directly compatible with FOSM methods. To obtain VIII-10-9
10 required probability values for these modes, one must either use frequency models based on observed events or judgmental values based on expert elicitation. f. Frequency and magnitude of physical changes or failure events. Physical conditions may change at some uncertain time within the lifetime modeled in a simulation. These may directly lead to unsatisfactory performance or may require changing the values of parameters in an analytical model. Examples include scour of foundations, plugging of well screens by incrustation, failure of well screens by corrosion, development of seepage windows in sheet piling, and dislodging of fill material in rock joints. The occurrence of such events cannot be easily predicted by a model based on physical parameters. The occurrence may be modeled using a frequency-based approach such as those based on the exponential and Weibull distributions where sufficient data exist. g. Condition of unseen features. The condition of unseen features is inherently uncertain. Examples include the effects of unknown cracks, burrows, or other defects in levees, and the adequacy of grout cutoffs under dams. A similar uncertain, but non-calculable, situation would be determining the probability of locating and plugging the source of a piping channel in a foundation before destructive erosion occurs. Such situations may contribute considerable uncertainty regarding performance but often can only be accounted for in a risk assessment or reliability analysis by quantifying the experience and judgment of experts rather than estimating uncertainty in parameters or fitting distributions to historical data. ETL and Appendix 11 go on to observe that geotechnical problems have a number of unique aspects that also require consideration in reliability analyses: a. In geotechnical engineering, coefficients of variation are related to the variability of natural materials, which may need to be assessed on a site-specific basis. b. Geotechnical parameters may have relatively high coefficients of variation (the value for the coefficient of permeability may exceed 100 percent) and may be correlated. c. Soil strength parameters can be defined and analyses performed in either a total stress context or an effective stress context. In the former, the uncertainty in strength and pore pressure are lumped; in the latter, they are treated separately. d. Soils are continuous media where properties vary from point to point, requiring consideration of spatial correlation. For problems such as slope stability, the location of the critical free body must be searched out. Furthermore, its location varies with parameter values, and varying parameter values (in an FOSM or Monte Carlo analysis) results in different freebody locations for each set of parameter values. e. Although one slip surface may be critical, a slope can fail on any of an infinite number of slip surfaces; hence a slope is a system of possible failure surfaces which are correlated to some extent. f. Some earth structures such as levees may be exceedingly long, such as levees which may be tens of miles long. These can be treated as a number of equivalent independent structures; VIII-10-10
11 however, determining the appropriate length and number is problematical, and the reliability of the system may be sensitive to the assumptions made. The reliability analysis undertaken as part of IPET attempts to incorporate all of these uncertainties and considerations. Aleatory vs. epistemic uncertainty In modern practice, engineering risk analysis usually incorporates uncertainties of two distinct types: aleatory and epistemic. a. Aleatory uncertainty is attributed to inherent randomness, natural variation, or chance outcomes in the physical world; in principle, this uncertainty is irreducible because it is assumed to be a property of nature. Aleatory uncertainty is sometimes called random or stochastic variability. b. Epistemic uncertainty is attributed to lack of knowledge about events and processes; in principle, this uncertainty is reducible because it is a function of information. Epistemic uncertainty is sometimes called, subjective or internal uncertainty, and divides into two major sub-categories: model uncertainty and parameter uncertainty. An example of the interplay of aleatory and epistemic uncertainties in practice is the flood frequency curve (USACE 1998). The flood frequency curve describes natural variability or aleatory uncertainty of flood flows, while error bands about the curve describe epistemic uncertainty in the parameters of the flood frequency model. The frequency curve reflects the irresolvable variation of nature. The error bands reflect limited knowledge about the statistically estimated parameters of the frequency curve. Collecting more data would improve our estimates of the parameters, and thus reduce the error bands about the frequency curve, but no amount of data can reduce the underlying probability distribution represented by the exceedance curve. Separating uncertainty into aleatory and epistemic parts is a modeling decision. Consider drawing a flexible curve through a set of data. A high-order curve may fit the data closely, but the uncertainty in the parameters of the curve will be large because there are many parameters to be estimated. In contrast, a straight line may not fit the data as closely, but the uncertainty in the slope and intercept of the line will be small. The data scatter about the curve is aleatory; the uncertainty in the parameters of the curve is epistemic. This modeling decision on whether and how to separate aleatory and epistemic uncertainty has important implications in a levee safety analysis. A schematic example is given in Figure 2, in which the variability of some engineering property is shown as a function of location. This spatial variability of the property is divided into sections thought to be homogeneous, and averages (means) are estimated for each. When the variability is modeled this way, the variations about the respective means are assumed to be aleatory uncertainties, while that in the estimates of the means are assumed to be epistemic uncertainties. Additional information can reduce the error in the estimates of the means, but it will only better characterize the variance about the means within each zone and not reduce that variance itself. This standard model of spatial VIII-10-11
. The spatial variability is divided into sections assessed to be homogeneous, and means are estimated for each.")

12 variation has many implications, which are discussed in greater detail in Hartford and Baecher (2004). Figure 2. Schematic diagram showing the variability of some engineering property in space (e.g., soil strength, surge elevation, etc.). The spatial variability is divided into sections assessed to be homogeneous, and means are estimated for each. Aleatory and epistemic uncertainty affect the outcomes of a reliability analysis in different ways. Aleatory uncertainty manifests as variations, or frequencies of occurrence, over space or time. Epistemic uncertainties manifest as statistical error and systematic biases in probability estimates, and may introduce correlations among aleatory frequencies. Allowance for sea-level rise and subsidence In follow-on risk and reliability studies, for example those addressing the 100-year system, an allowance is made for a potential of two (2) feet of combined sea-level rise and subsidence. In the IPET risk and reliability studies of the pre-katrina conditions and current conditions as of June 2006, no allowance is made for future sea-level risk and subsidence. Engineering uncertainties Four categories of engineering uncertainty were included in the reliability analysis: a. Geological and geotechnical uncertainties, involving the spatial distribution of soils and soil properties within and beneath the HPS. b. Structural uncertainties, involving the performance of man-made systems such as levees, floodwalls, and point features such as drainage pipes; and the engineering modeling of that performance, including geotechnical performance modeling. c. Erosion uncertainties, involving the performance of levees and fills around floodwalls during overtopping, and at points of transition between levees and floodwall, in some cases leading to loss of grade or loss of structural support, and consequently to breaching. d. Mechanical equipment uncertainties, including gates, pumps, and other operating systems, and human operator factors affecting the performance of mechanical equipment. VIII-10-12
13 The reliability analysis takes water elevations and wave characteristics from the hurricane loading conditions as given, and calculates conditional probabilities of failure for specifically stated water elevations. Thus, hurricane effects, wind loads, water heights, and other factors of the loading conditions are not considered to be uncertainties in the reliability modeling. Uncertainties in water elevations from hurricane conditions are convoluted with the results of the reliability analysis in the systems risk model to generate marginal (i.e., unconditional) probabilities. Geological profile and soil conditions The engineering geology of the New Orleans area is discussed in IPET Volume V, The Performance of Levees and Floodwalls, Appendix 2. Description of New Orleans Area Geology, Environments of Deposition. The stratigraphy of the New Orleans area is Pleistocene and Holocene in age. Observed levee and floodwall failures during Katrina principally involved shallow Holocene aged sediments. Generally, sediments constituting the New Orleans area are less than 7,000 years old (Holocene). Formation of the present day New Orleans began with the rise in global sea level, beginning about 12,000 to 15,000 years before present. A typical profile for much of the New Orleans HPS shows a layer of fill at the top, underlain by organic clays ( marsh ), in turn underlain by lacustrine (distributary) plastic clays, in turn underlain by stiffer Pleistocene clays. Figure 3 shows the profile under the New Orleans East (NOE) Lakefront Levee, which is typical of this profile. The spatial variability of this typical section has to do with variations in thickness of the various strata, and inter-bedding of sand or silt lenses and other local conditions. In some places, for example, the marsh can be thicker than average, as for example in the vicinity of the 17th Street Canal failures. Equally important to the performance of levees in Orleans East Bank (OEB) and NOE is the Pine Island Beach deposit, a buried, barrier island or beach dating to ca. 5,000 years before present (Figure 4). This feature extends northeast along the southern shore of Lake Pontchartrain, adjacent to and north of the Metairie and Gentilly ridges, former natural levees of the Mississippi. Sea level was 10 to 15 ft lower than the current level when the beach ridge formed. Consequently, foundation soils beneath OEB and NOE are affected by this buried sand which provides a high permeability channel for pore pressures. Under the London Avenue Canal and the northern end of the IHNC, the sand rises close to the present ground surface. VIII-10-13
14 Figure 3. Typical geological profile, NOE lakefront section (USACE 1972). Figure 4. Pine Island (buried) beach ridge, and locations of the canal breaches (after Saucier 1994). The 17th Street breach is located behind the axis of the beach ridge while the London Canal breaches are located on the axis of the ridge. Bayou Metairie is identified in red and forms the Bayou Sauvage distributary course. VIII-10-14
15 Soil engineering properties It is important to note, that the risk team engaged in no new soil sampling, site characterization programs, or laboratory testing. All the geotechnical information available to the team needed to come from existing sources, the principal of which were the General Design Memoranda and the site investigation data taken during design and construction. Data collected post-katrina at the site of the drainage canal failures were used to supplement the pre-katrina data sources. The principal uncertainty contributing to probability of failure of the levee and I-wall sections in the reliability analysis is soil engineering properties, specifically undrained shear strength, Su. The uncertainties in this soil engineering properties are presumed to have two main components: (1) data scatter caused by actual variation of soil properties in space and by random measurement errors, and (2) systematic errors caused by limited numbers of measurements (i.e., statistical estimation error), and by measurement bias in the use of Q-test (UU) data (see Figure 5). Uncertainty model The variance in soil properties was assumed to be a composition of four terms, Var ( Su) = Var ( x) + Var ( e) + Var ( m) + Var ( b ) (1) in which Var( ) is variance, Su is the soil property as input to the analysis (in this case, undrained strength), x is the soil property in situ, e is measurement error (noise), m is the spatial mean of the soil property (which has some error due to the statistical fluctuations of small sample sizes), and b is a model bias or calibration term caused by systematic errors in measuring soil engineering properties. VIII-10-15
16 Soil Property Uncertainty Data Scatter Systematic Error Spatial Variation Measurement Noise Statistical Error Model Error Figure 5. Sources of soil property uncertainty in geotechnical reliability model. The NOE drainage basin is used here to describe the reliability analysis approach. Analyses of the other drainage basins are similar. The soil profile underlying NOE consists typically of clayey fill overlying marsh (OH, CH), in turn overlying distributary clays (CH), as shown in Figure 5. Critical sections in the GDMs and failures observed during Katrina occur in these uppermost strata. The engineering properties of deeper, stronger strata of the Pleistocene formations were not statistically characterized. Measured Q-test results reported in the GDMs of NOE are shown as histograms in Figure 6. Second-moment statistical properties of these data are shown in Table 3. Test values larger than 750 PCF were assumed to be local effects and removed from the statistics to the right in the table. These moments were used in subsequent calculations. A comparison of undrained soil strengths across the various parishes is shown in Figure 7. VIII-10-16
17 Fill Marsh Distributary Clay Undrained Shear Strength, Q-test (PCF) Figure 6. Histograms of undrained strength data (Q-tests), by soil type, NOE General Design Memoranda: (black) Fill, (gray) Marsh, (white) Distributary Clay. VIII-10-17
18 25% 20% Frequency of results. 15% 10% STB OEB JEF STC NOE Figure 7. 5% 0% Q-Test UU (tsf) More Histograms of undrained strength data (Q-tests), by parish, from USACE General Design Memoranda of various projects. These strength data were compared to post-katrina sampling and testing performed by Team 7 (IPET Vol V, 2006) at the sites of failures along the drainage canals of metro-orleans Parish. Those results, based on cone-penetration (CPTU) and laboratory results led to the socalled IPET Strength Model as a basis for the forensic analysis. Team 7 s conclusion was, The measured shear strengths of the levee fill scatter very widely, from about 120 psf to more than 5,000 psf, and cannot be interpreted without applying judgment. The values used are based on the combined judgment of the IPET team to make the most reasonable interpretation of the scattered data. Placing the greatest emphasis on data from UU tests on 5-in.-diameter samples, which appear to be the best-quality data available, su = 900 psf is a reasonable value to represent the levee fill. This strength can be compared to a value of 500 psf for the levee fill used in the design analyses. The marsh (or peat) deposit is stronger beneath the levee crest where it was consolidated under the weight of the levee, and weaker at the toe of the levee and beyond, where it less compressed. The measured shear strengths of the marsh scatter very widely, from about 50 psf to about 920 psf. Values of su = 400 psf beneath the levee crest and su = 300 psf beneath the levee toe appear to be representative of the measured values. These strengths can be compared to a value of 280 psf at all locations that was used in the design analyses. VIII-10-18
19 The clay (which has been found to be the most important material with respect to stability of the I-wall and levee) is normally consolidated. Its undrained shear strength increases with depth at a rate of 11 psf per foot of depth. This rate of increase of strength with depth corresponds to a value of su /p = There is very little scatter in the results of the CPTU tests, and these values provide a good basis for establishing undrained strength profiles in the clay. The undrained strength at the top of the clay is equal to 0.24 times the effective overburden pressure at the top of the clay. With this model, the undrained shear strength of the clay varies with lateral position, being greatest beneath the levee crest where the effective overburden pressure is greatest and least at the levee toe and beyond where the pressure is lowest, and varying with depth, increasing at a rate of 11 psf per foot at all locations. Spatial variation The spatial pattern of soil variability is characterized by auto-covariance functions. These describe the covariance of soil properties as a function of separation distance. Soils whose properties vary erratically from spot to spot display little spatial covariance, while soils whose properties vary with more waviness display more spatial covariance. The auto-covariance function of a soil property z is defined as, C z (δ) = E[z(i), z(i + δ)], in which E[ ] is expectation, z(i) is the soil property at some location i, and z(i+δ) is the property at another location at distance δ from the first. The autocorrelation function is found by normalizing the auto-covariance by the variance, R z (δ) = E[z(i), z(i + δ)]var 1 (z). The autocovariance distance is indexed as that separation distance at which R z (δ) = e 1. This is a representative or characteristic length of the spatial correlation. The auto-covariance function can only be estimated for distances at least as great as the minimum spacing among observations, that is the minimum boring spacing in the present case. The minimum boring spacings in NOE are on the order of many hundred feet, with some spacings between adjacent borings as much as several thousand feet. To supplement the information in the GDMs, post-katrina borings made in the vicinity of the 17th Street and London Avenue breaches were used to estimate auto-covariance functions, and correspondingly the magnitude of measurement noise and the autocorrelation distance. VIII-10-19
20 Figure 8. Typical auto-covariance function for CH soils in 17th Street Canal area post-katrina borings, undrained strength (PCF) from Q tests at uniform depth below grade. Statistical estimates of the auto-covariance were made using the ESRI Geostatistical Analyst, an application running in ArcMap. Results for the undrained strength (Q-tests) of London Avenue the Distributary Clay clays are shown in Figure 8. Analyses for Marsh and Fill show similar patterns. Table 3. Statistics of undrained strength data (Q-tests), NOE General Design Memoranda. COV is the coefficient of variation, or standard deviation divided by the mean. All data Data less than 750PCF Parameter Fill Marsh D.Clay Fill Marsh D.Clay Mean (PCF) Std Dev (PCF) COV (data scatter) Measurement noise Soil strength is measured destructively, therefore replicate measurements cannot be used to estimate the magnitude of random measurement error. However, the spatial covariance structure provides an indirect way to make the estimate (DeGroot 2006). Assuming that the measurement z of soil property x is corrupted by a zero-mean error e that is independent from one VIII-10-20
21 measurement to the another and independent of the value x, the measurement can be expressed as z=x+e. The auto-covariance function of z is the summation of the auto-covariance functions of x and of e: C(z)=C(x)+C(e). But, the auto-covariance function of e is a spike at the origin and zero otherwise. Thus, the difference between the intersection of the observed auto-covariance function of z extrapolated back to the origin, and the total variance Var(z), provides an estimate of the variance of the error, Var(e). The conclusions drawn from these auto-covariance analyses were: (1) the measurement noise (or fine-scale variation) in the Q-test data is roughly ½ to 3/4 the total variance of the data (suggesting the COVs in the top row of Table 4; (2) the representative auto-covariance distance in the horizontal direction is on the order of 1000 feet; (3) the representative auto-covariance distance in the vertical direction is assumed to be on the order of 1/100 of the horizontal distance, or about 10 feet, although there are too few Q-test data in individual borings to statistically estimate this value. Statistical error Statistical estimation error in the mean soil property is caused by limited numbers of data within a reach; and is approximated from the standard error of sampling. The variance of the error is approximated as Var(m) Var(x)/n, in which m is the mean soil property, x is the spatial variation component of data scatter, and n is the number of measurements (Table 4). Table 4. Estimates of component uncertainties to soil engineering property model. Component Fill Marsh D.Clay Spatial COV Number of measurements Statistical error in mean Measurement model bias Measurement model bias (systematic error) The correction factor, b, is a model bias or calibration term introduced to correct for systematic errors in measuring soil engineering properties, in this case by the use of Q-tests rather than more modern test procedures (Table 4). The predominant soil property test data available in the GDMs were unconsolidated-undrained tests. However, in the post-katrina investigations of floodwall failures along the metro-orleans drainage canals, Team 7 performed a large number of in situ cone-penetration, and laboratory tri-axial and direct simple shear tests on fill, marsh, and distributary clays, as summarized above. These test results were compared with Q-test data collected at the same sites and reported in the respective GDMs (IPET vol. V, 2006). The subsequent calibration factors were used to adjust the Q-test data per the measurement bias term, b, in the above equation. VIII-10-21
22 Fragility curves Fragility curves summarize the probability of components reaching their respective limit states (i.e., failure), conditioned on levels of water elevation from hurricane conditions. For example, the fragility curve of Figure 9 shows schematically the probability of failure by deepsliding instability of a levee reach as a function of water height. Design basis water elevation indicates the probability of failure at the design water level (i.e., 3 ft from the top of the levee). Fragility curves for levees and floodwalls were calculated for two conditions (Table 5): (1) global stability without overtopping, for which reliability was calculated at two water elevations, design elevation and top of levee, and a smooth curve approximated to lower water elevation at sea level; and (2) overtopping with subsequent erosion, for which reliability was estimated from empirical experience during Katrina at four water elevations of overtopping: ½ foot, 1 foot, 2 feet, and 3 feet above the top of levee or flood wall. The fragility curves for all reaches are attached in Appendix A at the end of this appendix. P(f Elevation), Probability of Failure Fractile Level Range of the System Reliability Median 0.15 Fractile Level Authorization Basis Figure 9. Elevation (ft) Schematic fragility curve with epistemic uncertainty bounds at the 0.15 and 0.85 fractiles. Once the fragility curves for each component failure mode were determined, they were input to the HPS risk model, which is based on event tree analysis. For each sequence in the event tree, a sequence fragility curve is determined by evaluating the event tree logic at each successive water elevation level. Once each sequence of events has been evaluated, the composite or total fragility for system failure can be determined for each system performance state of interest (e.g., no flooding has occurred in any area protected by the HPS, or flooding occurred as a result of levee or floodwall failure, or flooding occurred as a result of overtopping). Reliability assessments were performed for individual reaches of approximately homogeneous structural type, elevation, geotechnical conditions, and water elevations. This resulted in fragility curves for each reach by mode of failure. Such fragility curves represented the aleatory (i.e., random) uncertainties from one hurricane to another. VIII-10-22
23 Table 5. Summary of engineering models used in calculating fragility curves Failure Mode Hazard Models and Parameters Static instability Under seepage Still-water overtopping and scour Transition point feature erosion Wave run-up Still-water surge; weak foundation soils Still-water surge; high permeability soils Still-water surge; erodable fill Still-water surge; erodable fill Wave heights and periods; erodable fill Limiting equilibrium stability Flownet calculations; Limiting equilibrium stability Empirical correlations from post Katrina data Empirical observations during Katrina Empirical (Dutch) correlations and model test results Source of Inputs IPET v.iv, V; Soil test data; Design Memoranda; In situ surveys IPET v.iv, V; Soil test data; Design Memoranda; In situ surveys IPET v.iv, V; IPET v.v; IPET v.iv Principal Uncertainty Soil properties; Still water levels; Existing elevations; Geotechnical model Soil properties; Still water levels; Existing elevations; Geological profile geometry Still water levels Soil fill properties Existing elevations Scour model Still water levels Soil fill properties Existing elevations Scour model Wave height and period; Still water levels; Existing elevations Levee fragility, no overtopping Engineering performance models were adapted from the GDM for the respective reaches of levee. Engineering parameter and model uncertainties were propagated through those calculations using a first-order second-moment approximation to obtain approximate fragility curves as a function of water height. The geotechnical models used in the GDMs were calibrated against the analysis work of the Performance Team which used more refined calculations. The reliability analysis was based on limiting equilibrium calculations of factor of safety against instability. For levees, the analysis was based on GDM calculations of factor of safety against wedge instability (Table 5). The calculations were based on undrained (φ=0) failure conditions. Undrained strengths of soils underlying the levees and walls are based on Q-test (unconsolidated -undrained) results using the USACE Method of Planes (Figure 10). Model bias was calculated based on a comparison of the detailed modeling results of the Performance Team compared to the more simple general method of planes used in the GDMs. VIII-10-23
24 On average, the GDMs calculated factors of safety that were approximately 10% lower than more precise model analysis using the computer programs SLIDE 1 and UTEXAS4 2, varying from about 7% to about 18% (IPET v.v 2006). These model comparisons were summarized in a study conducted by Team 7 for Task Force Guardian. Best estimate calculations Best estimate calculations were based on average (mean) soil properties, adjusted from calculations in the GDMs, which used factored average soil properties (Table 6). That is, the calculation of factor of safety in the GDMs was not based on mean observed undrained strengths, but factored strengths, using a reduction factor of 1.2 to 1.3. These were corrected for the reliability analysis to yield a mean factor of safety. Table 6. Soil property uncertainty by parish Mean SU Parish (TSF) Point Cov Point Cov Less Noise Spatial Reduction Cov Averaged N Depth of Data Bound for Outliers Std Dev in Mean OEB to STB to NOE to STC to JEF to Uncertainties in undrained shear strength were propagated through the GDM calculations to estimate a coefficient of variation in the calculated factor of safety. The factor of safety was assumed to be normally distributed, and a fragility curve was approximated through a limited number (typically two) of calculation points. Soil property uncertainty in the form of coefficients of variation for undrained soil strengths underlying the levees and walls was propagated through the limiting equilibrium wedge stability calculations to obtain coefficients of variation on factors of safety, shown in Table 7. In most cases, the stability analyses were linear functions of undrained soil strength so that the coefficient of variation of the factor of safety was the same as the coefficient of variation of the input soil strengths. The mean factor of safety was taken as that calculated in the GDMs, adjusted for factored strengths. 1 Available from Rocscience Inc., 31 Balsam Avenue, Toronto, Ontario, Canada M4E 3B5. 2 Available from Shinoak Software, 3406 Shinoak Drive, Austin, TX VIII-10-24
25 Figure 10. Typical method-of-planes wedge stability analysis of levee section from GDM (USACE 1972). Table 7. Uncertainty analysis for example levee reach in NOE. Water level Design basis ¾ design basis Top of levee Mean FS Spatial COV Spatial average reduction factor Systematic COV Total COV Reliability Index, b Pf for specific 1000 ft reach Increase in Pf per 1000 feet reach 2% 0.0 5% Fragility curves summarize the conditional probability of levee or wall failure as a function of water elevation. Calculations were made for a three specific water elevations: typically design water level, some level lower than design (i.e. sea level), and at the top of the levee or wall. Uncertainty in realized factor of safety For a given water elevation, uncertainty in the realized factor of safety against sliding depends principally on the average soil strength, Su, across the area of the failure surface. This average strength varies from cross-section to cross-section because the soil properties themselves vary from spot to spot (Figure 11). The variability in the average soil strength is less than the variability in the point-to-point properties because, to some extent, the highs and lows of the soil strength balance against each other over the failure surface. The larger the failure surface relative to the autocorrelation of the soil properties, the greater the variance reduction from the local averages. VanMarcke (1977a,b) has shown that the variance of the spatial average for a unit- VIII-10-25

26 width plain strain cross section decreases approximately in proportion to (L/r L ), for L>r L, in which L is the cross-sectional length of the failure surface, and r L is an equivalent autocovariance distance of the soil properties across the failure surface weighted for the relative proportion of horizontal and vertical segments of the surface. For the wedge failure modes this is approximately the vertical auto-covariance distance. The variance across the full failure surface of width w along the axis of the levee is further reduced by averaging in the horizontal direction by an additional factor (w/r H ), forwb>r H, in which r H is the horizontal auto-covariance distance. At the same time that the variance of the average strength on the failure surface is reduced by the averaging process, so, too, the auto-covariance function of this averaged process stretches out from that of the point-to-point variation. Figure 11. Point variation in undrained strength and variation among locally averaged strength. For a failure length of approximately 1000 feet along the levee axis and 30 feet deep, with horizontal and vertical auto-covariance distances of 1000 feet and 10 feet, respectively, the corresponding variance reduction factors are approximately 0.75 for averaging over the crosssectional length L, and between 0.73 and 0.85 for averaging over the failure length b, assuming either an exponential or squared-exponential (Gaussian) auto-covariance. The corresponding reduction to the COV of soil strength based on averaging over the failure plane is the root of the product of these two factors, or between 0.74 and 0.8. The Reliability Index for the specific levee reach of length w is the number of standard deviations separating the mean condition from the limiting state, VIII-10-26
27 β b = E[FS] 1 Var(FS) = E[FS] 1 Ω FS E[FS] (2) in which E[FS] is the mean factor of safety, Var(FS) is the variance, and Ω FS is the COV. Seepage A number of seepage failure modes were considered for specific reaches of the HPS. These included: a. Increases in pore pressures in foundation or levee soils, leading to decreases in effective stress and thus reduced shear strength; b. Internal erosion ( piping ) caused by high seepage gradients in either foundation or levee soils, and either at the exit of the seepage or deep within the sold mass, leading to loss of material and the development of through-going channels; and c. Blowouts caused by pore pressures on the protected side of a levee exceeding existing overburden pressures caused by the weight of overlying soils, leading to voids or sinkholes and thus failure. Failures due to seepage pressures or erosion were observed during Katrina at the London Avenue Canal site and also present hazards at northern reaches of the IHNC. At London Avenue, a line of sinkholes was observed at the inland side of the distressed east I-wall, and a sand boil at the inboard embankment toe indicate[d] that erosive seepage and piping had occurred beneath the levee (IPET v.v 2006). In this area, the buried Pine Island Beach deposit, which is Holocene age (i.e., recent) sands, rises close to the present ground surface (Figure 12). The fragility curves for any reach in which the sands rise to within the critical failure zone under a levee or wall were adjusted for seepage pressure effects. These affected reaches included not only those in the vicinity of the Pine Island Sand, but also those suspected of crossing untreated buried stream channels in other sections of the HPS. The adjustment of the fragility curves was accomplished by estimating potential pore pressure rise in the affected reaches, and reducing effective strengths in the sand layers accordingly. This lowers the predicted mean factor of safety, and correspondingly increases the probability of failure at given still water levels. Length effect The HPS of New Orleans includes long lengths of embankment or wall extending many miles across ground that is poorly characterized from an engineering perspective. Levees fail at locations where loads are high and strengths are low. If these critical locations are identified ahead of time, traditional methods can be used to analyze stability and calculate factors of safety. In such situations, the overall length of levee is immaterial, because the weakest spots have been identified and dealt with. The probability that the levee fails is that of these weakest spots. VIII-10-27


28 Figure 12. Generalized contour map showing Pine Island Beach contour values are in ft MSL. Upper figure shows general trend of the contours of the top of beach ridge in the New Orleans area, lower figure shows detailed view at the canals. London Canal levee failures are located along the axis of the beach. The 17th Street Canal levee break is located on the protected or back barrier side of the beach ridge and consequently is dominated by fine-grained deposits corresponding to low-energy depositional type settings. Extent of beach ridge shown extends across the Spanish Fort, Chef Mentuer, and New Orleans 15-min. USGS topographic quadrangles. [From IPET v.v 2006]. The more common situation is that the levee system is not characterized with enough detail to know unambiguously where the weakest spots are. In this case, any reach of levee has some VIII-10-28


29 probability of experiencing higher than average loads or lower than average strengths, and as a result, of being a weak spot. Since this critical combination cannot be uniquely identified before a failure occurs, the longer the levee, the greater the chance that a critical combination exists somewhere, and thus the higher the probability of a failure somewhere. For a long levee, the chance of at least one failure is equivalent to the chance that the variations of the mean soil strength across the failure surface shown schematically in Figure 11 drop below that required for stability at least once along the length. VanMarcke (1977a,b) has shown that this can be determined by considering the first crossings of a random process. The approximation to the probability of at least one failure as provided by VanMarcke (1977) was used in the calculations. VanMarcke s derivation is approximately as follows: For a given loading condition, that is, height of water, uncertainty in the realized factor of safety against sliding depends principally on the average soil strength, Su, across the area of the failure surface. This average strength varies from cross-section to cross-section because the soil properties themselves vary from spot to spot. The variability in the average is less than the variability in the point-to-point properties, because to some extent the highs and lows of strength balance out each other over the failure surface. The larger the failure surface relative to the autocorrelation of the soil properties, the more the variance of the local averages is reduced. Figure 13. Division of levee system into reaches and characteristic lengths. VanMarcke has shown that the variance of the spatial average for a unit-width plain strain cross section decreases approximately in proportion to (L/r L ), for L>r L, in which L is the crosssectional length of the failure surface, and r L is an equivalent autocovariance distance of the soil properties across the failure surface weighted for the relative proportion of horizontal and vertical segments of the surface. The variance across the full failure surface of width b along the axis of the levee is further reduced by averaging in the horizontal direction by an additional factor (b/r H ), for b>r H, in which r H is the horizontal autocovariance distance. At the same time that the variance of the average strength on the failure surface is reduced by the averaging process, so, too, the autocovariance function of this averaged process stretches out from that of the point-to-point variation. VIII-10-29
30 The primary level of analysis of levee reliability is the two-dimensional levee section. The presumption is that this 2D section applies over a unit length of levee, defined approximately as the horizontal autocorrelation distance, and treated as a probabilistically independent characteristic length (Figure 13). As the total length of levee increases, the probability of systems failure rises in proportion to length, and soon displays a classic exponental saturation shape trending asypmtotically toward 1.0, according to the fomula, P f = 1 (1 p) n (3) in which, P f = 1 (1 p) n is the probability of system failure, p is the 2D probability of failure, and n is the number of characteristic lengths within the reach. Length effects for other failure modes are summarized in (Table 8). Table 8. Simplified list of failure modes of levee sections. Failure Mode Category Description H&H Overtopping leading to breach. H&&H H&H/GT H&H/GT GT GT Wave attack on floodway side and lateral erosion leading to breach Erosion around structural point features (e.g., pipes) or transitions. Wave erosion on protected side due to run-up and over-sloshing Internal erosion due to under seepage High pore pressures in or under protected side caused by under seepage Probability of Failure Dependent On Hydrological return periods Significant wave heights and mean periods, duration of loading, soil type. Velocity of overtopping, soil types, point feature details Significant wave heights and mean periods, duration of loading, soil type. Existence and severity of flaw High permeability zones in continuum, or point (flaw) features such as buried channels. GT Slope strength instability Continuum properties of levee or subsurface GT GT Other Internal erosion due through-seepage Transverse cracking of levee embankment. Animal burrows, cracking, etc., High permeability zones in continuum, or point (flaw) features. Critical gradient, existence and properties of flaw Existence of cracking, dimension and character, soil types. Existence of flaw Length Effect? Maybe: top elevations may vary, hydraulics may vary along length. Unlikely. Depends on most exposed sections. Yes, number of points per length Yes: top elevations may vary, hydraulics may vary, soil erodability may vary along length. Yes, number of flaws, or excursions of average properties per length Yes, number of flaws per length Yes, excursions of average properties Yes, number of flaws per length Yes, number of flaws per length Yes, number of flaws VIII-10-30
31 Wave run-up 1 Wave run-up for each reach was calculated by the approach summarized in TAW (2002). The average wave run-up and overtopping for levees according calculated according to the formula, q gh 3 m R 1 c = γξ b 0 exp 4.75 tanα 0 ξγγ 0 γβγ H m b f v q R with maximum: = 0.2 exp gh m0 H c m0 1 γ γ f β (4) (1) in which, q = overtopping rate [cft/s per ft] g = gravitational acceleration [= ft/s 2 ] H m0 = significant wave height at toe of the structure [ft] = surf similarity parameter [-] α = slope [-] R c = free crest height above still water line [ft] γ = influence factors for presence of berm (b), friction (f), wave incidence (β), vertical wall (v) The coefficients 4.75 and 2.6 are empirical mean values. The standard deviations aere 0.5 and 0.35, respectively and normally distributed. Equation (6) is valid for ξ 0 < 5 and slopes steeper than 1:8. For values of ξ 0 >7 the corresponding relationship is, q gh 3 m R c = 10 exp γ γβ 0( ξ0) f H m (5) (2) The coefficient is the empirical mean value, with standard deviation 0.24 and normally distributed. The overtopping rate in the range 5 < ξ 0 < 7 is obtained by linear interpolation of Equations (6) and (7) using the logarithmic value of the overtopping rates. The surf similarity parameter is defined as: tanα 2π H ξ = with s = m s0 g T 1,0 ( m ) (6) (3) 1 This section draws heavily on the internal USACE memorandum, van Ledden (2007), Wave overtopping IPET, dated 21 June. VIII-10-31
32 in which, s 0 = wave steepness [-] T m-1,0 = mean period [s] Eq. (1) - (3) contain levee parameters such as the slope and the crest height and several influence factors for angle of wave incidence, friction, the presence of a berm and a vertical wall. The hydraulic levee designs in the New Orleans area generally have two steep sloping sections of 1:3 1:5 and a wave berm in between. The wave berm is located at the design still water line. A common wave berm factor for these levee designs is γ b = Apart from specific cases, a grass-covered levees without floodwalls on top and perpendicular wave attack is assumed. Hence, there is no reduction of the overtopping rate due to friction, wave attack and vertical walls. Based on this, we suggest to use in the risk model the following settings: slope α = ¼, a berm factor γ b = 0.7 and γ f = γ β = γ v = 1 ( no effect ). The average wave overtopping over floodwalls is correspondingly, q gh 3 m0 R exp 3.0 H γ β 1γ = c m0 s (7) (4) in which, q = overtopping rate [cft/s per ft] significant wave height at toe of the structure [ft] free crest height above still water line [ft] γ = influence factors for wave incidence (β) and type of geometry (s) H m0 = R c = The coefficient 3.0 is the empirical mean value, with standard deviation 0.26, and a Normal distribution assumed. The influence factors are: γ s = 1 and γ β = 0.83 for plain impermeable floodwalls with perpendicular wave attack of short-crested waves. For both levees and floodwalls, the average wave overtopping can be computed using the still water level from ADCIRC and the wave information from STWAVE. The mean wave period T m-1,0 is derived directly from the STWAVE results at 600 ft in front of the levees/floodwalls 1. The significant wave height at the toe of the structure (H m0 ) is also derived from the STWAVE results, but is adapted because of depth-limited breaking in front the structure. The significant wave height based on the STWAVE results is limited to the maximum significant wave height according to: H m0,max = γ ( ζ z toe ); in which, γ = breaker parameter [-], ζ = still water level [ft], and z toe = bottom level at toe of structure [ft]. 1 Note that only the peak period T p is available for the 152 storm suite of the 2007 situation. The peak period T p can be converted easily into the mean period T m-1,0 using T m-1,0 = T p /1.1. VIII-10-32
33 The breaker parameter in Eq. (5) is set at γ = 0.4 in the design study. The bed level at the toe of most of the structures is assumed to be at z toe = 0 ft. The standard deviation for the significant wave height is assumed to be 10% of the value based on STWAVE (or after reduction due to depth-limited breaking according to Eq. (5)). The error in the wave period is set at 20% of the STWAVE result. The error is assumed to Normally distributed. Both errors are based on expert judgment due to lack of field data. I-Wall fragility, no overtopping The reliability analysis for I-walls was similarly based on limiting equilibrium calculations of factor of safety against instability. For I-walls, the analysis is based on the Performance Team s mechanism of cracks developing in the soil immediately behind the wall and sheetpile, allowing hydrostatic pressure on the sheetpile. The equilibrium of a soil wedge to the protected side of the wall (Figure 14) was calculated for this condition. The calculations were based on undrained (φ=0) failure conditions. Undrained strengths of soils underlying the levees and walls were based on Q-test results. The design consideration of balancing forces and moments on the sheet pile to determine depth of penetration was considered immaterial to the reliability analysis of the wall sections. Based on the results of the Performance Team s analyses, it was assumed that cracking initiated at 5 feet of water elevation on an I-wall. Thus, for water elevations lower than 5 feet, the factor of safety was that calculated in the GDMs. But at 5 feet, when a crack formed in the soil, the factor of safety underwent a step change to a forward (protected side) wedge failure. Figure 14. Failure by rotation of I-wall, reducing I-wall elevation (IPET Vol. V, 2006). VIII-10-33
34 If soil separations developed in front of the sheetpile or the levee, the condition resulted in increased hydrostatic forces on the flood side of the I-wall and the levee. If the separation was of sufficient depth, the hydrostatic forces on the wall may exceed the shear strength of the supporting soil and cause failure along wedge lines of least resistance behind the sheetpile. Reliability calculations were based on the probability that shear resistance of a wedge was exceeded by the loads on the levee and floodwall for a given hurricane. Levee and I-Wall fragility, with overtopping Reliability calculations were based on the probability of overtopping causing erosion of the protected side of a levee that led to a breach. Two approaches were considered: The first approach considered flow velocities over the levee. The second approach considered water elevation, which is estimated by the storm surge modeling, as an indirect parameter of flow velocity. Based on the Performance Team s results, the probability of erosion breaching was considered to be negligible for floodwall sections, and related to the presence of significant depth of hydraulic fill for levee sections. The fragility curve for levee sections was assumed to be that of the static failure analysis (above) up to the point of overtopping, and then a step function to Pf=1.0 for those sections with significant depths of hydraulic fill. For levee sections without significant hydraulic fill, the fragility curve remained flat at the top of wall fragility for overtopping. Scour and erosion The probability of overtopping of levees or floodwalls leading to scour and consequent failure was directly estimated based on empirically observed rates of failure during Katrina and documented in IPET Volume V (2006), and as shown in Table 9. These are consistent with later analyses by Briaud, et al. (2006). Table 9. Empirical frequency of overtopping scour failure of levees and walls as observed in Katrina, as a function of the velocity of overtopping flow (correlated to depth of overtopping) and soil type. Levees 0.5 foot 1.0 foot 2.0 feet 3 feet Hydraulic Fill Clay Protected Walls 0.5 foot 1.0 foot 2.0 feet 3 feet Hydraulic Fill Clay Protected VIII-10-34
35 Transitions and Point Structures A number of HPS breaches were observed at transitions between HPS components. These breaches were typically at levee to I-wall, levee to T-wall or I-wall to T-wall transitions. Many of the HPS breaches were at point structures such as gates (road and railroad), pump stations, or around drainage control structures. These transitions indicate a weak link in the HPS due to the differing stiffness of the components which permit them to become areas of significant erosion during a hurricane event. VIII-10-35

36 Figure 15. Example of Transition Zone for East Bank of INHC Many of these transitions zones failed use a wrap-in levee section to a more rigid wall structure. Instead, the levee sections sloped quickly away from the transition to expose the I- or T-wall. The steep slopes permitted a concentrated zone for the erosion of the levee that eventually exposed the I-wall or T-wall structure to additional loading and continued eroding. This dynamic process could lead to instability and collapse or damage to end sections of the VIII-10-36
37 wall. An example of a levee transition for a gate section on the east bank of the INHC is shown in Figure 15. The failure modes for these transitions zones are complex and dynamic. The failure modes use the qualitative erosion parameters developed by the Performance Team as the basis for change in the stability of components at the transition zones. That is, the fragility of the transitions was taken to be similar to that of overtopped levee sections, and to depend on the combination of height of overtopping water and the presence of hydraulic fill enlargement to the levee section. Reliability for point structures (gates, control structures, pump stations) was taken as a point probability of failure for design loading. Failure Mode 1 Scour and erosion caused point structure (i.e. drainage pipe) instability. A levee breach may occur due to loss of the I- or T-walls at a point structure and scour could create instability and collapse of the structure, resulting in a breached area. Failure Mode 2 Breach occurs at the water stop between the I-wall and T-wall panel junction. This failure mode may be caused by differential displacement between panels and may develop tensile and shear forces in the water stop and panels. This may be due to levee erosion on the flood side or different rotation point between panels, or to lateral displacement of the levee from a foundation shear failure. This failure mode was not explicitly included in the risk calculations. Failure Mode 3 Breach at the levee and I-wall transition. This failure mode occurs due to levee erosion on the protected side, where the erosion starts at the end of the levee transition and progresses back toward the I-wall, until the I-wall rotates toward the protected side. This was treated as Failure Mode 1. Pumping Stations The adverse performance of mechanical, electrical, and human elements of the HPS, such as pumps, the availability of power, and the closure of gates, is treated as random point (i.e., aleatory) events with discrete probabilities of failure based on the statistical record during Katrina and on information provided by other IPET teams. The pumping stations are critical HPS system components because they maintain the flood levels on the protected side. Unfortunately, many of the pumping stations during Katrina reached and exceeded their pumping capacity shortly into the storm. Their reliability during Katrina was not exceedingly high as the stations primarily failed due to rising waters at the plants, a lack of external or backup power source, or were shut down due to inefficient pumping. These systems are designed to handle specific level of rainfall and are easily overwhelmed when the levees are overtopped by a hurricane event. The following failure modes were possible for the pumping stations: no commercial power, back up generator failed, mechanical fuel unavailable, pumps not functioning at time of incident, mechanical failure of components, operator unavailability, debris blocking intakes, or reversed or back flow through outfall pipes. VIII-10-37
38 The reliability of the pumping stations was included in the risk model as point sources. The reliability is based on data collected by the Pumping Team, performance data maintained by Task Force Hope, and information from the dewatering plan for New Orleans developed by the New Orleans District. The fragility curves for each pumping stations will be limited to a specific elevation or volume of water within the drainage basin. These fragility curves will vary for each pumping station and will reflect the interior drainage areas and back flow potential as determined by the Interior Drainage Team. References Briaud, J.-L., Chen, H.-C., Govindasamy, A. V., and Storesund, R. (2007). Erosion tests on samples from the New Orleans levees, proceedings of the Geo-Denver national conference, edited by Harold Olsen, ASCE, Reston, Virginia, USA. DeGroot, D. (2006). Analyzing spatial variability of in situ soil properties, Uncertainty in the Geological Environment, ASCE Congress, Madison v2, pp IPET. (2006). Performance Evaluation of the New Orleans and Southeast Louisiana Hurricane Protection Systems, Final Report of the Interagency Performance Evaluation Task Force, Vol. V, Performance Levees and Floodwalls, Appendix 13, Levee erosion and scour from overtopping storm surge, U.S. Army Corps of Engineers, Washington, DC. IPET. (2006). Performance Evaluation of the New Orleans and Southeast Louisiana Hurricane Protection Systems, Final Report of the Interagency Performance Evaluation Task Force, Vol. V, Performance Levees and Floodwalls, Appendix 21, Regional geology and history overview, U.S. Army Corps of Engineers, Washington, DC. IPET. (2006). Performance Evaluation of the New Orleans and Southeast Louisiana Hurricane Protection Systems, Final Report of the Interagency Performance Evaluation Task Force, Vol. VI, Interior Drainage and Pumping, U.S. Army Corps of Engineers, Washington, DC. IPET. (2006). Performance Evaluation of the New Orleans and Southeast Louisiana Hurricane Protection Systems, Final Report of the Interagency Performance Evaluation Task Force, Vol. V, Performance Levees and Floodwalls, Appendix 21, Regional geology and history overview, U.S. Army Corps of Engineers, Washington, DC. Jack R. Benjamin & Associates. (2006). Initial technical framework paper levee stability, Delta Risk Management Strategy, Prepared for [the California] Department of Water Resources, September 6, 18pp. McDonald, L. (2002). Probabilities discussion on considerations, Working Paper, Dam Safety Interest Group. TAW. (2002). Technical report wave run-up and wave overtopping at dikes, Technical Advisory Committee on Flood Defence, The Netherlands. USACE. (1972). New Orleans East Lakefront Levee Paris Road to South Point, Lake Pontchartrain, Barrier Plan, DM 2 Supplement 5B, New Orleans District, June. VIII-10-38
39 USACE. (1999). Risk-Based Analysis in Geotechnical Engineering for Support of Planning Studies, ETL , U.S. Army Corps of Engineers, CECW-EG, Washington, DC, 28 May. USACE. (1998). Risk-based analysis for flood damage reduction studies, EM , U.S. Army Corps of Engineers, Washington, DC. VanMarcke, E. H. (1977a). Probabilistic modeling of soil profiles. J. Geotech. Engrg. Div., ASCE, 103(11), VanMarcke, E. H. (1977b). Reliability of earth slopes, Journal of the Geotechnical Engineering Division, ASCE, v.103(gt11): VIII-10-39


40 Appendix A Fragility Tables Table A-1. Jefferson Parish Pre-Katrina Fragilities VIII-10-40


41 Table A-2. New Orleans East Parish Pre-Katrina Fragilities VIII-10-41


42 Table A-3. Orleans Parish Pre-Katrina Fragilities VIII-10-42
43 Table A-4. Plaquemines Parish Pre-Katrina Fragilities VIII-10-43

44 Table A-5. St. Bernard Parish Pre-Katrina Fragilities Table A-6. St. Charles Pre-Katrina Fragilities VIII-10-44


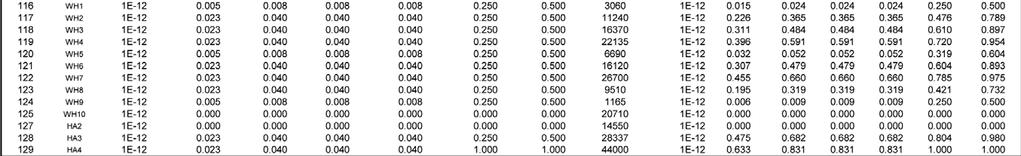
45 Table A-7. Jefferson Parish June 2007 Fragilities VIII-10-45


46 Table A-8. New Orleans East Parish June 2007 Fragilities VIII-10-46


47 Table A-9. Orleans June 2007 Fragilities VIII-10-47


48 Table A-10. Plaquemines Parish June 2007 Fragilities VIII-10-48


49 Table A-11. St. Bernard Parish June 2007 Fragilities Table A-12. St. Charles June 2007 Fragilities VIII-10-49
Appendix 9 Risk Methodology
 Appendix 9 Risk Methodology Introduction This Appendix describes the risk analysis philosophy and methodology used to evaluate the performance of the New Orleans hurricane protection system. Probabilistic
Three-Dimensional Seepage Effects at Three New Orleans Levee Breaches During Hurricane Katrina
 Three-Dimensional Seepage Effects at Three New Orleans Levee Breaches During Hurricane Katrina Diego Cobos-Roa Graduate Student Department of Civil & Environmental Engineering University of California
Appendix 15 Computational Methodology
 Appendix 15 Computational Methodology Introduction This Appendix describes the process used by the risk team to determine the final loss exceedence values in the risk analysis. The process involved the
PART 4 HURRICANE KATRINA STRIKES NEW ORLEANS AUGUST 2005
 PART 4 HURRICANE KATRINA STRIKES NEW ORLEANS AUGUST 2005 Hurricane Katrina Hurricane Katrina swept across southern Florida and lost momentum, then gained speed and water, showing the second lowest barometric
CHAPTER SEVEN: THE NEW ORLEANS EAST PROTECTED AREA
 7.1 Introduction CHAPTER SEVEN: THE NEW ORLEANS EAST PROTECTED AREA The New Orleans East (NEO) protected area includes some of the lowest ground in the metropolitan region. Therefore, it is not surprising
Greater New Orleans Hurricane and Storm Damage Risk Reduction System 101
 Greater New Orleans Hurricane and Storm Damage Risk Reduction System 101 René Poché New Orleans District U.S. Army Corps of Engineers US Army Corps of Engineers BUILDING STRONG 1878 Gentilly Ridge Metairie
Improvements to Southeast Louisiana s floodwalls and pump stations since Katrina: the Hurricane and Storm Damage Risk Reduction System (HSDRRS)
") Improvements to Southeast Louisiana s floodwalls and pump stations since Katrina: the Hurricane and Storm Damage Risk Reduction System (HSDRRS) Pat Fitzpatrick Mississippi State University Review of levee
Improvements to Southeast Louisiana s floodwalls and pump stations since Katrina: the Hurricane and Storm Damage Risk Reduction System (HSDRRS) Pat Fitzpatrick Mississippi State University Review of levee
CHAPTER FIVE: THE LOWER MISSISSIPPI REGION AND PLAQUEMINES PARISH
 CHAPTER FIVE: THE LOWER MISSISSIPPI REGION AND PLAQUEMINES PARISH 5.1 Overview Plaquemines Parish is the area where the last portion of the Mississippi River flows out into the Gulf of Mexico (see Figures
US Army Corps of Engineers BUILDING STRONG
 Greater New Orleans Hurricane and Storm Damage Risk Reduction System Robert Rowlette Senior Senior Program Manager Task Force Hope U.S. Army Corps of Engineers April 19, 2012 US Army Corps of Engineers
PART 4 GEOLOGIC SETTING AND FOUNDATION CONDITIONS IN NEW ORLEANS
 PART 4 GEOLOGIC SETTING AND FOUNDATION CONDITIONS IN NEW ORLEANS The modern Mississippi Delta has been deposited during the past 6000 years, in four major areas. Current interpretation of the modern delta.
Fil Failure Analysis of fthe Breached Levee System at the 17th Street Canal, New Orleans
 Fil Failure Analysis of fthe Breached hd Levee System at the 17th Street Canal, New Orleans Jay Wang, Ph.D., P.E. Department of Civil Engineering and Construction Engineering Technology Louisiana Tech
DRAFT ONONDAGA LAKE CAPPING AND DREDGE AREA AND DEPTH INITIAL DESIGN SUBMITTAL H.4 SEISMIC SLOPE STABILITY ANALYSES
 DRAFT ONONDAGA LAKE CAPPING AND DREDGE AREA AND DEPTH INITIAL DESIGN SUBMITTAL H.4 SEISMIC SLOPE STABILITY ANALYSES Parsons P:\Honeywell -SYR\444576 2008 Capping\09 Reports\9.3 December 2009_Capping and
Attachment 3: Fragility Curve Determinations DRAFT
 Attachment 3: Fragility Curve Determinations DRAFT CELRC-TS-DG 4 October 2017 MEMORANDUM FOR PM-PL SUBJECT: Fragility Curve Determination for McCook Levee North and South of 47 th Street Introduction 1.
PROBABILISTIC DESIGN METHOD OF LEVEE AND FLOODWALL HEIGHTS FOR THE HURRICANE PROTECTION SYSTEM IN THE NEW ORLEANS AREA
 PROBABILISTIC DESIGN METHOD OF LEVEE AND FLOODWALL HEIGHTS FOR THE HURRICANE PROTECTION SYSTEM IN THE NEW ORLEANS AREA Mathijs van Ledden Haskoning Inc., 1 Galleria Blvd., Metairie, LA70001, United States,
Hurricane KATRINA Lessons Learned for Managing Risk
 Hurricane KATRINA Lessons Learned for Managing Risk Steven L. Stockton, P.E. Deputy Director of Civil Works U.S. Army Corps of Engineers What Happened? Storm Path from August 23 to 31, 2005 Mon. August
The Stability of Flood Defenses on Permeable Soils: The London Avenue Canal Failures in New Orleans
 Missouri University of Science and Technology Scholars' Mine International Conference on Case Histories in Geotechnical Engineering (2008) - Sixth International Conference on Case Histories in Geotechnical
RESERVOIR DRAWDOWN RATES/RESERVOIR DRAWDOWN TEST Iron Gate, Copco (I & II), and JC Boyle Dams
, and JC Boyle Dams") TECHNICAL MEMORANDUM No. 1 TO: Michael Bowen California Coastal Conservancy Geotechnical & Earthquake Engineering Consultants CC: Eric Ginney Philip Williams & Associates PREPARED BY: Paul Grant SUBJECT:
TECHNICAL MEMORANDUM No. 1 TO: Michael Bowen California Coastal Conservancy Geotechnical & Earthquake Engineering Consultants CC: Eric Ginney Philip Williams & Associates PREPARED BY: Paul Grant SUBJECT:
Downtown Anchorage Seismic Risk Assessment & Land Use Regulations to Mitigate Seismic Risk
 Prepared for: The Municipality of Anchorage Planning Department and the Geotechnical Advisory Commission Downtown Anchorage Seismic Risk Assessment & Land Use Regulations to Mitigate Seismic Risk Prepared
IMPORTANCE OF GEOLOGIC CHARACTERIZATION FOR LEVEE FOUNDATION AND BORROW MATERIALS AS STUDIED AT THE INDIAN GRAVES LEVEE DISTRICT, ADAMS COUNTY, IL
 IMPORTANCE OF GEOLOGIC CHARACTERIZATION FOR LEVEE FOUNDATION AND BORROW MATERIALS AS STUDIED AT THE INDIAN GRAVES LEVEE DISTRICT, ADAMS COUNTY, IL Conor Watkins Missouri University of Science and Technology
Performance Evaluation of the New Orleans and Southeast Louisiana Hurricane Protection System
 Performance Evaluation of the New Orleans and Southeast Louisiana Hurricane Protection System Draft Final Report of the Interagency Performance Evaluation Task Force Volume VIII Engineering and Operational
HORIZONTAL TRANSLATIONAL FAILURES OF LEVEES DUE TO WATER FILLED GAPS
 HORIZONTAL TRANSLATIONAL FAILURES OF LEVEES DUE TO WATER FILLED GAPS Dr. Meindert A. Van Dr. Cor Zwanenburg John M. van Esch Deltares Deltares Deltares and Delft University of Delft, The Netherlands Delft,
Modeling Great Britain s Flood Defenses. Flood Defense in Great Britain. By Dr. Yizhong Qu
 Modeling Great Britain s Flood Defenses AIRCurrents Editor s note: AIR launched its Inland Flood Model for Great Britain in December 2008. The hazard module captures the physical processes of rainfall-runoff
Risk Analysis of a Protected Hurricane-Prone Region. I: Model Development
 Risk Analysis of a Protected Hurricane-Prone Region. I: Model Development Bilal M. Ayyub, P.E., F.ASCE 1 ; Jerry Foster, M.ASCE 2 ; and William L. McGill, P.E., M.ASCE 3 Abstract: A risk analysis methodology
LIQUEFACTION OF EARTH EMBANKMENT DAMS TWO CASE HISTORIES: (1) LIQUEFACTION OF THE EMBANKMENT SOILS, AND (2) LIQUEFACTION OF THE FOUNDATIONS SOILS
 LIQUEFACTION OF THE EMBANKMENT SOILS, AND (2) LIQUEFACTION OF THE FOUNDATIONS SOILS") LIQUEFACTION OF EARTH EMBANKMENT DAMS TWO CASE HISTORIES: (1) LIQUEFACTION OF THE EMBANKMENT SOILS, AND (2) LIQUEFACTION OF THE FOUNDATIONS SOILS Antonio Fernandez, Ph.D. 1 ABSTRACT Paul C. Rizzo Associates,
LIQUEFACTION OF EARTH EMBANKMENT DAMS TWO CASE HISTORIES: (1) LIQUEFACTION OF THE EMBANKMENT SOILS, AND (2) LIQUEFACTION OF THE FOUNDATIONS SOILS Antonio Fernandez, Ph.D. 1 ABSTRACT Paul C. Rizzo Associates,
Benchmarking of Hydrodynamic Models for Development of a Coupled Storm Surge Hazard-Infrastructure Modeling Method to improve Inundation Forecasting
 Benchmarking of Hydrodynamic Models for Development of a Coupled Storm Surge Hazard-Infrastructure Modeling Method to improve Inundation Forecasting Abstract Fragility-based models currently used in coastal
Appendix E Guidance for Shallow Flooding Analyses and Mapping
 Appendix E Guidance for Shallow Flooding Analyses and Mapping E.1 Introduction Different types of shallow flooding commonly occur throughout the United States. Types of flows that result in shallow flooding
Expert Report. Robert Glenn Bea, Ph.D., P.E.
 Expert Report of Robert Glenn Bea, Ph.D., P.E. Prepared for Plaintiffs in: Katrina Canal Breaches Consolidated Litigation [Civil Action Number: 05-4182 K (2)] United States District Court Eastern District
R.M.HARW & ASSOCIATES LTD. GEOTECHNICAL INVESTIGATION PROPOSED BRIDGE SITE. HELAVA CREEKl MILE MACKENZIE HIGHWAY E-2510 OCTOBER 16, 1973
 El R.M.HARW & ASSOCIATES LTD. GEOTECHNICAL INVESTIGATION PROPOSED BRIDGE SITE HELAVA CREEKl MILE 616.4 MACKENZIE HIGHWAY E-2510 OCTOBER 16, 1973 R,M,HARDV & ASSOCIATES LTD. CONSULTING ENGINEERING & TESTING
Probability - James Bay Case History
 1 Introduction Probability - James Bay Case History This article looks at the SLOPE/W probabilistic analysis capabilities relative to a published case history. The James Bay hydroelectric project in Northern
HURRICANE SANDY LIMITED REEVALUATION REPORT UNION BEACH, NEW JERSEY DRAFT ENGINEERING APPENDIX SUB APPENDIX A PRELIMINARY FLOODWALL DESIGN
 HURRICANE SANDY LIMITED REEVALUATION REPORT UNION BEACH, NEW JERSEY DRAFT ENGINEERING APPENDIX SUB APPENDIX A PRELIMINARY FLOODWALL DESIGN March 2014Revised March 2015 UNITED STATES ARMY CORPS OF ENGINEERS
Deep Foundations 2. Load Capacity of a Single Pile
 Deep Foundations 2 Load Capacity of a Single Pile All calculations of pile capacity are approximate because it is almost impossible to account for the variability of soil types and the differences in the
LRFD GEOTECHNICAL IMPLEMENTATION
 LRFD GEOTECHNICAL IMPLEMENTATION Ching-Nien Tsai, P.E. LADOTD Pavement and Geotechnical Services In Conjunction with LTRC WHY LRFD FHWA deadline - October 2007 LRFD is a better method Risk is quantified
Hurricane Surge Hazard Analysis for Southeast Louisiana
 Hurricane Surge Hazard Analysis for Southeast Louisiana SLFPA-E Coastal Advisory Committee and Invitees February 21, 2013 Presented by Bob Jacobsen PE, LLC Consulting Coastal Hydrologist Objective Review
New Orleans Levee System Performance during Hurricane Katrina: London Avenue and Orleans Canal South
 New Orleans Levee System Performance during Hurricane Katrina: London Avenue and Orleans Canal South Javier Ubilla, M.ASCE 1 ; Tarek Abdoun, M.ASCE 2 ; Inthuorn Sasanakul, M.ASCE 3 ; Michael Sharp, M.ASCE
Reliability-Based Underseepage Analysis in Levees Using Monte Carlo Simulation
 Utah State University DigitalCommons@USU All Graduate Theses and Dissertations Graduate Studies 5-21 Reliability-Based Underseepage Analysis in Levees Using Monte Carlo Simulation Lourdes Polanco Utah
STRUCTURAL STABILITY ASSESSMENT
 STRUCTURAL STABILITY ASSESSMENT CFR 257.73(d) Bottom Ash Pond Complex Cardinal Plant Brilliant, Ohio October, 2016 Prepared for: Cardinal Operating Company Cardinal Plant Brilliant, Ohio Prepared by: Geotechnical
Instructor : Dr. Jehad Hamad. Chapter (7)
") Instructor : Dr. Jehad Hamad Chapter (7) 2017-2016 Soil Properties Physical Properties Mechanical Properties Gradation and Structure Compressibility Soil-Water Relationships Shear Strength Bearing Capacity
Instructor : Dr. Jehad Hamad Chapter (7) 2017-2016 Soil Properties Physical Properties Mechanical Properties Gradation and Structure Compressibility Soil-Water Relationships Shear Strength Bearing Capacity
(Refer Slide Time: 01:15)
") Soil Mechanics Prof. B.V.S. Viswanathan Department of Civil Engineering Indian Institute of Technology, Bombay Lecture 56 Stability analysis of slopes II Welcome to lecture two on stability analysis of
Soil Mechanics Prof. B.V.S. Viswanathan Department of Civil Engineering Indian Institute of Technology, Bombay Lecture 56 Stability analysis of slopes II Welcome to lecture two on stability analysis of
Geotechnical Reconnaissance of the Mississippi River Delta Flood-protection System After Hurricane Katrina
 Geotechnical Reconnaissance of the Mississippi River Delta Flood-protection System fter Hurricane Katrina y Ronaldo Luna, David Summers, David Hoffman, J. David Rogers, dam Sevi, and Emitt C. Witt This
When Creek Meets Valley Wall: Prioritizing Erosion Mitigation alongside the Oshawa Landfill
 1 When Creek Meets Valley Wall: Prioritizing Erosion Mitigation alongside the Oshawa Landfill Robin McKillop 1, Dan McParland 1 & Cassie Scobie 2 TRIECA conference March 22-23, 2017 1 Palmer Environmental
Slope Stability Evaluation Ground Anchor Construction Area White Point Landslide San Pedro District Los Angeles, California.
 Slope Stability Evaluation Ground Anchor Construction Area White Point Landslide San Pedro District Los Angeles, California Submitted To: Mr. Gene Edwards City of Los Angeles Department of Public Works
June 9, R. D. Cook, P.Eng. Soils Engineer Special Services Western Region PUBLIC WORKS CANADA WESTERN REGION REPORT ON
 PUBLIC WORKS CANADA WESTERN REGION REPORT ON GEOTECHNICAL INVESTIGATION PROPOSED MARTIN RIVER BRIDGE MILE 306.7 MACKENZIE HIGHWAY Submitted by : R. D. Cook, P.Eng. Soils Engineer Special Services Western
Liquefaction assessments of tailings facilities in low-seismic areas
 Page 1 Liquefaction assessments of tailings facilities in low-seismic areas Holly Rourke SRK Consulting, Perth, WA, Australia Caroline Holmes SRK Consulting, Perth, WA, Australia This paper was first presented
Land subsidence due to groundwater withdrawal in Hanoi, Vietnam
 Land Subsidence (Proceedings of the Fifth International Symposium on Land Subsidence, The Hague, October 1995). 1AHS Publ. no. 234, 1995. 55 Land subsidence due to groundwater withdrawal in Hanoi, Vietnam
Monte Carlo Simulations for Probabilistic Flood Hazard Assessment
 Monte Carlo Simulations for Probabilistic Flood Hazard Assessment Jemie Dababneh, Ph.D., P.E., 1 and Mark Schwartz, P.E. 1 1 RIZZO Associates, Monroeville, Pennsylvania Presentation to PSA 2017 International
Prof. B V S Viswanadham, Department of Civil Engineering, IIT Bombay
 19 Module 5: Lecture -1 on Stability of Slopes Contents Stability analysis of a slope and finding critical slip surface; Sudden Draw down condition, effective stress and total stress analysis; Seismic
Landslide FE Stability Analysis
 Landslide FE Stability Analysis L. Kellezi Dept. of Geotechnical Engineering, GEO-Danish Geotechnical Institute, Denmark S. Allkja Altea & Geostudio 2000, Albania P. B. Hansen Dept. of Geotechnical Engineering,
A METHODOLOGY FOR ASSESSING EARTHQUAKE-INDUCED LANDSLIDE RISK. Agency for the Environmental Protection, ITALY (
 A METHODOLOGY FOR ASSESSING EARTHQUAKE-INDUCED LANDSLIDE RISK Roberto W. Romeo 1, Randall W. Jibson 2 & Antonio Pugliese 3 1 University of Urbino, ITALY (e-mail: rwromeo@uniurb.it) 2 U.S. Geological Survey
Lessons Learned from Analysis of the New Orleans Hurricane Protection System
 Lessons Learned from Analysis of the New Orleans Hurricane Protection System By Interagency Performance Evaluation Task Force Reported by Michael K. Sharp ABSTRACT This report, Performance Evaluation of
Introduction to Engineering Reliability
 Introduction to Engineering Reliability Robert C. Patev North Atlantic Division Regional Technical Specialist (978) 318-8394 Topics Reliability Basic Principles of Reliability Analysis Non-Probabilistic
Bridge Risk Modeling
 time good Bridge Risk Modeling Current Florida DOT Research condition bad Paul D. Thompson, Consultant Background Research team Florida State University John Sobanjo (PI) Paul D. Thompson (co-pi) Florida
CHAPTER SIX: THE ST. BERNARD AND LOWER NINTH WARD PROTECTED AREA
 CHAPTER SIX: THE ST. BERNARD AND LOWER NINTH WARD PROTECTED AREA 6.1 Introduction As described previously in Chapter 2, St. Bernard Parish and the Lower Ninth Ward are protected by a single continuous
PROBABILISTIC APPROACH TO DETERMINING SOIL PARAMETERS
 DGF Seminar in Cooperation with DONG Energy Wind Power DONG Energy Gentofte 1 April 2014 12:00 21:00 PROBABILISTIC APPROACH TO DETERMINING SOIL PARAMETERS Lars Vabbersgaard Andersen, John Dalsgaard Sørensen,
Slope Stability. loader
 Slope Stability Slope Stability loader Lower San Fernando Dam Failure, 1971 Outlines Introduction Definition of key terms Some types of slope failure Some causes of slope failure Shear Strength of Soils
Date: April 2, 2014 Project No.: Prepared For: Mr. Adam Kates CLASSIC COMMUNITIES 1068 E. Meadow Circle Palo Alto, California 94303
 City of Newark - 36120 Ruschin Drive Project Draft Initial Study/Mitigated Negative Declaration Appendix C: Geologic Information FirstCarbon Solutions H:\Client (PN-JN)\4554\45540001\ISMND\45540001 36120
SCOUR CHARACTERIZATION DUE TO WATER FREE FALL
 SCOUR CHARACTERIZATION DUE TO WATER FREE FALL Abdolreza Osouli, Corresponding Author, Ph.D., P.E. Assistant Professor of Civil Engineering, Southern Illinois University at Edwardsville, Engineering Building,
Surface Processes Focus on Mass Wasting (Chapter 10)
") Surface Processes Focus on Mass Wasting (Chapter 10) 1. What is the distinction between weathering, mass wasting, and erosion? 2. What is the controlling force in mass wasting? What force provides resistance?
Surface Processes Focus on Mass Wasting (Chapter 10) 1. What is the distinction between weathering, mass wasting, and erosion? 2. What is the controlling force in mass wasting? What force provides resistance?
DATA REPORT GEOTECHNICAL INVESTIGATION GALVESTON CRUISE TERMINAL 2 GALVESTON, TEXAS
 DATA REPORT GEOTECHNICAL INVESTIGATION GALVESTON CRUISE TERMINAL 2 GALVESTON, TEXAS SUBMITTED TO PORT OF GALVESTON 123 ROSENBERG AVENUE, 8TH FLOOR GALVESTON, TEXAS 77553 BY HVJ ASSOCIATES, INC. HOUSTON,
Countermeasure Calculations and Design
 Countermeasure Calculations and Design Summarized from Bridge Scour and Stream Instability Countermeasures, Experience, Selection, and Design Guidance, Second Edition, Publication No. FHWA NHI 01-003,
SLOPE STABILITY EVALUATION AND ACCEPTANCE STANDARDS
 INFORMATION BULLETIN / PUBLIC - BUILDING CODE REFERENCE NO.: LABC 7006.3, 7014.1 Effective: 01-01-2017 DOCUMENT NO.: P/BC 2017-049 Revised: 12-21-2016 Previously Issued As: P/BC 2014-049 SLOPE STABILITY
HISTORY OF CONSTRUCTION FOR EXISTING CCR SURFACE IMPOUNDMENT PLANT GASTON ASH POND 40 CFR (c)(1)(i) (xii)
(1)(i) (xii)") HISTORY OF CONSTRUCTION FOR EXISTING CCR SURFACE IMPOUNDMENT PLANT GASTON ASH POND 40 CFR 257.73(c)(1)(i) (xii) (i) Site Name and Ownership Information: Site Name: E.C. Gaston Steam Plant Site Location:
HISTORY OF CONSTRUCTION FOR EXISTING CCR SURFACE IMPOUNDMENT PLANT GASTON ASH POND 40 CFR 257.73(c)(1)(i) (xii) (i) Site Name and Ownership Information: Site Name: E.C. Gaston Steam Plant Site Location:
PRINCIPLES OF GEOTECHNICAL ENGINEERING
 PRINCIPLES OF GEOTECHNICAL ENGINEERING Fourth Edition BRAJA M. DAS California State University, Sacramento I(T)P Boston Albany Bonn Cincinnati London Madrid Melbourne Mexico City New York Paris San Francisco
Probabilistic Evaluation of a Meandering Low-Flow Channel. February 24 th, UMSRS
 Probabilistic Evaluation of a Meandering Low-Flow Channel February 24 th, 2014 2014 UMSRS 1 2 acknowledgments Low- Flow Channel (LFC) overview Proposed Diversion Channel collects runoff from: The Rush
H.1 SUMMARY OF SUBSURFACE STRATIGRAPHY AND MATERIAL PROPERTIES (DATA PACKAGE)
") DRAFT ONONDAGA LAKE CAPPING AND DREDGE AREA AND DEPTH INITIAL DESIGN SUBMITTAL H.1 SUMMARY OF SUBSURFACE STRATIGRAPHY AND MATERIAL PROPERTIES (DATA PACKAGE) Parsons P:\Honeywell -SYR\444576 2008 Capping\09
DRAFT ONONDAGA LAKE CAPPING AND DREDGE AREA AND DEPTH INITIAL DESIGN SUBMITTAL H.1 SUMMARY OF SUBSURFACE STRATIGRAPHY AND MATERIAL PROPERTIES (DATA PACKAGE) Parsons P:\Honeywell -SYR\444576 2008 Capping\09
The probabilistic optimisation of the revetment on the dikes along the Frisian coast
 The probabilistic optimisation of the revetment on the dikes along the Frisian coast M. Hussaarts, J.K. Vrijling, P.H.A.J.M. van Gelder Subfaculty of Civil Engineering, Delft University of Technology,
Todd N. Loar, PG, CEG
 1 USACE DAM RISK ASSESSMENT PROGRAM OVERVIEW AND HOW ENGINEERING GEOLOGY CONTRIBUTES TO THE LEVEL OF CONFIDENCE AND RESULTS 255 255 255 237 237 237 217 217 217 200 200 200 0 0 0 163 163 163 131 132 122
Table 5-1 Sampling Program Summary for Milltown Ford Avenue Redevelopment Area, NJ.
 Table 5- Sampling Program Summary for Milltown Ford Avenue Redevelopment Area, NJ. Transformer Pads (9 pads: PAD 9) Evaluate if PCBs presently exist in soils adjacent to, and/or beneath the transformer
B-1. Attachment B-1. Evaluation of AdH Model Simplifications in Conowingo Reservoir Sediment Transport Modeling
 Attachment B-1 Evaluation of AdH Model Simplifications in Conowingo Reservoir Sediment Transport Modeling 1 October 2012 Lower Susquehanna River Watershed Assessment Evaluation of AdH Model Simplifications
APPENDIX J. Dynamic Response Analysis
 APPENDIX J Dynamic Response Analysis August 25, 216 Appendix J Dynamic Response Analysis TABLE OF CONTENTS J1 INTRODUCTION... 1 J2 EARTHQUAKE TIME HISTORIES... 1 J3 MODEL AND INPUT DATA FOR SITE RESPONSE
*** ***! " " ) * % )!( & ' % # $. 0 1 %./ +, - 7 : %8% 9 ) 7 / ( * 7 : %8% 9 < ;14. " > /' ;-,=. / ١
 * % )!( & ' % # $. 0 1 %./ +, - 7 : %8% 9 ) 7 / ( * 7 : %8% 9 < ;14. > /' ;-,=. / ١") ١ ******!" #$ % & '!( ) % * ") +,-./ % 01. 3 ( 4 56 7/4 ) 8%9 % : 7 ;14 < 8%9 % : *7./ = ;-, >/'." Soil Permeability & Seepage ٢ Soil Permeability- Definition ٣ What is Permeability? Permeability is the
١ ******!" #$ % & '!( ) % * ") +,-./ % 01. 3 ( 4 56 7/4 ) 8%9 % : 7 ;14 < 8%9 % : *7./ = ;-, >/'." Soil Permeability & Seepage ٢ Soil Permeability- Definition ٣ What is Permeability? Permeability is the
Geotechnical Challenges New Orleans USACE
 35 th Southwest Geotechnical Engineering Conference Geotechnical Challenges New Orleans USACE Mark Woodward, PE Jehu Johnson, EI Geotechnical Branch New Orleans District 28 April 2010 Slide 1 New Orleans
[1] Performance of the sediment trap depends on the type of outlet structure and the settling pond surface area.
![[1] Performance of the sediment trap depends on the type of outlet structure and the settling pond surface area.](/thumbs/76/74245181.jpg "[1] Performance of the sediment trap depends on the type of outlet structure and the settling pond surface area.") Sediment Trench SEDIMENT CONTROL TECHNIQUE Type 1 System Sheet Flow Sandy Soils Type 2 System [1] Concentrated Flow Clayey Soils Type 3 System [1] Supplementary Trap Dispersive Soils [1] Performance of
Sediment Trench SEDIMENT CONTROL TECHNIQUE Type 1 System Sheet Flow Sandy Soils Type 2 System [1] Concentrated Flow Clayey Soils Type 3 System [1] Supplementary Trap Dispersive Soils [1] Performance of
Phase II Report: Project Definition Options. Dam Safety
 OSHPC BARKI TOJIK Phase II Report: Project Definition Options Dam Safety Part 1: Basic data & Dam Design DAM Safety 2 Geology / Geotechnics...: Tectonics / Seismicity : DAM Design - Dam Location - Type
patersongroup Consulting Engineers April 20, 2010 File: PG1887-LET.01R Novatech Engineering Consultants Suite 200, 240 Michael Cowpland Drive
 patersongroup April 20, 2010 File: PG1887-LET.01R Novatech Engineering Consultants Suite 200, 240 Michael Cowpland Drive Ottawa, Ontario K2M 1P6 Attention: Mr. Adam Thompson Consulting Engineers 28 Concourse
GEOLOGY, SOILS, AND SEISMICITY
 4.9 GEOLOGY, SOILS, AND SEISMICITY 4.9.1 Introduction Information about the geological conditions and seismic hazards in the study area was summarized in the FEIR, and was based on the Geotechnical Exploration
Defining Metrics for Reliability of Hydraulic Fracturing Operations in Shale Gas
 Defining Metrics for Reliability of Hydraulic Fracturing Operations in Shale Gas Richard E. Green, Director Unconventional Oil and Gas, Houston Hamed Hamedifar, Senior Consultant Ph.D., Houston Lars Sørum,
Module 9 : Foundation on rocks. Content
 FOUNDATION ON ROCKS Content 9.1 INTRODUCTION 9.2 FOUNDATION TYPES ON ROCKS 9.3 BEARING CAPCITY- SHALLOW FOUNDATION 9.3.1 Ultimate bearing capacity 9.3.2 Safe bearing pressure 9.3.3 Estimation of bearing
SLOSH New Orleans Basin 2012 Update
 SLOSH New Orleans Basin 2012 Update Michael Koziara Science and Operations Officer National Weather Service Slidell, LA The Basics What is storm surge? What is SLOSH? Details Assumptions Inundation = Storm
IV. ENVIRONMENTAL IMPACT ANALYSIS G. GEOLOGY AND SOILS
 IV. ENVIRONMENTAL IMPACT ANALYSIS G. GEOLOGY AND SOILS The following section is a summary of the geotechnical report conducted for the proposed project. The Report of Geotechnical Investigation Proposed
LAR BPWG. DWR Erosion Screening Process Application to LAR. May 17, water resource specialists
 LAR BPWG DWR Erosion Screening Process Application to LAR May 17, 2016 Presentation Outline Review of Erosion Screening Process Modifications for LAR Application ESP LAR Results Recommendations ESP Background
Run 028 (Note: error in UKC at start of exercise due incorrect tide input then corrected ok.)
") Run 027 RNZ Full Bridge Simulation Run Plots Final Report Be-Software August 2016 Prepared for Royal Haskoning DHV on behalf of Refining New Zealand Limited 27 Run 028 (Note: error in UKC at start of exercise
Run 027 RNZ Full Bridge Simulation Run Plots Final Report Be-Software August 2016 Prepared for Royal Haskoning DHV on behalf of Refining New Zealand Limited 27 Run 028 (Note: error in UKC at start of exercise
OSCILLATIONS OF SEMI-ENCLOSED WATER BODY INDUCED BY HURRICANES. Yuan-Hung Paul Tan 1 and Jiin-Jen Lee 1
 OSCILLATIONS OF SEMI-ENCLOSED WATER BODY INDUCED BY HURRICANES Yuan-Hung Paul Tan 1 and Jiin-Jen Lee 1 The primary focus of this research is to study the oscillations of semi-enclosed water body induced
Probability Estimation of River Channel Capacity
 1 Paper N 0 : V.07 Probability Estimation of River Channel Capacity Jaromir Riha Pavel Golik Abstract: Recently, the risk analysis of floodplain areas has been one of the most frequently used tools for
LANDSLIDES IN THE WHITE MOUNTAIN (GEOTECHNICAL STUDIES AND ENGINEERING TESTS)
") J. Al Azhar University Gaza 2004, Vol. 7, NO. 2 P 15-26 LANDSLIDES IN THE WHITE MOUNTAIN (GEOTECHNICAL STUDIES AND ENGINEERING TESTS) Isam G. Jardaneh (1), Jalal Al-Dabeek (2), Abdel hakeem Al-Jawhari
J. Al Azhar University Gaza 2004, Vol. 7, NO. 2 P 15-26 LANDSLIDES IN THE WHITE MOUNTAIN (GEOTECHNICAL STUDIES AND ENGINEERING TESTS) Isam G. Jardaneh (1), Jalal Al-Dabeek (2), Abdel hakeem Al-Jawhari
Scale of Fluctuation for Geotechnical Probabilistic Analysis
 834 Geotechnical Safety and Risk V T. Schweckendiek et al. (Eds.) 015 The authors and IOS Press. This article is published online with Open Access by IOS Press and distributed under the terms of the Creative
vulcanhammer.net This document downloaded from
 This document downloaded from vulcanhammer.net since 1997, your source for engineering information for the deep foundation and marine construction industries, and the historical site for Vulcan Iron Works
Hazard assessment in dynamic slope stability analysis
 Hazard assessment in dynamic slope stability analysis C. Cherubini 1, F. Santoro 2 & G. Vessia 1 1 Polytechnic of Bari 2 University of Bari Abstract The estimate of risk in urban planning activities should
Debris flow: categories, characteristics, hazard assessment, mitigation measures. Hariklia D. SKILODIMOU, George D. BATHRELLOS
 Debris flow: categories, characteristics, hazard assessment, mitigation measures Hariklia D. SKILODIMOU, George D. BATHRELLOS Natural hazards: physical phenomena, active in geological time capable of producing
Chapter 7 Mudflow Analysis
 Chapter 7 Mudflow Analysis 7.0 Introduction This chapter provides information on the potential and magnitude of mud floods and mudflows that may develop in Aspen due to rainfall events, snowmelt, or rain
SAN JACINTO RIVER / BAUTISTA CREEK LEVEE SYSTEM RIVERSIDE COUNTY, CALIFORNIA NLD ID #
 SAN JACINTO RIVER / BAUTISTA CREEK LEVEE SYSTEM RIVERSIDE COUNTY, CALIFORNIA NLD ID # 3805010019 PERIODIC INSPECTION REPORT NO 1 GENERALIZED EXECUTIVE SUMMARY FEBRUARY 2013 FINAL RATING: MINIMALLY ACCEPTABLE
THE ROLE OF MICROPALEONTOLOGY IN ASSISTING WITH THE CHARACTERIZATION OF THE GEOLOGY BENEATH FAILED NEW ORLEANS LEVEES, LOUISIANA
 THE ROLE OF MICROPALEONTOLOGY IN ASSISTING WITH THE CHARACTERIZATION OF THE GEOLOGY BENEATH FAILED NEW ORLEANS LEVEES, LOUISIANA Conor Watkins J. David Rogers Francisca Oboh-Ikuenobe Geological Sciences
J. Paul Guyer, P.E., R.A.
 J. Paul Guyer, P.E., R.A. Paul Guyer is a registered mechanical engineer, civil engineer, fire protection engineer and architect with over 35 years experience in the design of buildings and related infrastructure.
Redwood City Harbor, California, Navigation Improvement Feasibility Study. Appendix D. Geotechnical Engineering. DRAFT April 2015
 1 Redwood City Harbor, California, Navigation Improvement Feasibility Study Appendix D Geotechnical Engineering DRAFT April 2015 2 Contents 1 Purposes of Report... 3 2 Background... 3 3 References and
SURFACE GEOLOGY AND LIQUEFACTION SUSCEPTIBILITY IN THE INNER RIO GRANDE VALLEY NEAR ALBUQUERQUE, NEW MEXICO
 SURFACE GEOLOGY AND LIQUEFACTION SUSCEPTIBILITY IN THE INNER RIO GRANDE VALLEY NEAR ALBUQUERQUE, NEW MEXICO Keith I. Kelson, Christopher S. Hitchcock, and Carolyn E. Randolph William Lettis & Associates,
Class Principles of Foundation Engineering CEE430/530
 Class Principles of Foundation Engineering CEE430/530 1-1 General Information Lecturer: Scott A. Barnhill, P.E. Lecture Time: Thursday, 7:10 pm to 9:50 pm Classroom: Kaufmann, Room 224 Office Hour: I have
PART 5 MECHANISMS OF GROUND SETTLEMENT IN GREATER NEW ORLEANS
 PART 5 MECHANISMS OF GROUND SETTLEMENT IN GREATER NEW ORLEANS Predicted water depth in New Orleans flood inundation area based on water level of 2.37 ft in Lake Ponchartrain on Sept 2, 2005. Overlay on
Surface Water and Stream Development
 Surface Water and Stream Development Surface Water The moment a raindrop falls to earth it begins its return to the sea. Once water reaches Earth s surface it may evaporate back into the atmosphere, soak
Proceedings of the 6 th International Conference on the Application of Physical Modelling in Coastal and Port Engineering and Science (Coastlab16)
") Proceedings of the 6 th International Conference on the Application of Physical Modelling in Coastal and Port Engineering and Science (Coastlab16) Ottawa, Canada, May 10-13, 2016 Copyright : Creative Commons
Proceedings of the 6 th International Conference on the Application of Physical Modelling in Coastal and Port Engineering and Science (Coastlab16) Ottawa, Canada, May 10-13, 2016 Copyright : Creative Commons
14 Geotechnical Hazards
 Volume 2: Assessment of Environmental Effects 296 14 Geotechnical Hazards Overview This Chapter provides an assessment of the underlying geotechnical conditions to identify: any potential liquefaction
Chapter 7 Mudflow Analysis
 Chapter 7 Mudflow Analysis 7.0 Introduction This chapter provides information on the potential and magnitude of mud floods and mudflows that may develop in Aspen due to rainfall events, snowmelt, or rain