The Virtual Seismologist (VS) method: a Bayesian approach to earthquake early. warning. Georgia Cua 1, Thomas Heaton 2
|
|
|
- Sharleen Hampton
- 5 years ago
- Views:
Transcription
1 The Virtual Seismologist (VS) method: a Bayesian approach to earthquake early warning by Georgia Cua 1, Thomas Heaton 2 1. Puerto Rico Seismic Network, Univeristy of Puerto Rico Mayagüez, Puerto Rico, USA. 2. Department of Civil Engineering, California Institute of Technology, Pasadena, USA.
2 1. Introduction Subscribers attempting to use early warning information to reduce earthquake-related losses typically have a selected sequence of actions they would like to complete before damaging ground motions reach their site. These subscribers decide whether or not to initiate their damage-mitigating actions based on uncertain information. How to make optimal decisions with uncertain information is a fundamental question to these subscribers. Answering this question properly requires addressing a seismological and an economics problem in tandem. The seismological question is that of real-time earthquake source estimation, which can be phrased as follows: what are the best estimates of magnitude and location given the available data? The economics question is the user response problem, which can be phrased as follows: what is the optimal decision or course of action, given the current source estimates and its uncertainties? The Virtual Seismologist (VS) method is a Bayesian approach to earthquake early warning that addresses the source estimation and user response problems in tandem. In the source estimation problem, the VS method shares with other proposed methodologies (Nakamura, 1988; Allen and Kanamori, 2003; Wu and Kanamori, 2005a, 2005b) the use of relative frequency content or predominant period and attenuation relationships to estimate magnitude and/or location from available ground motion observations. The introduction of prior information into the earthquake source estimation problem distinguishes the VS method from other paradigms for early warning. Bayes theorem allows the use of a background state of knowledge to help in resolving trade-offs in magnitude and location that cannot be resolved due to the scarcity of observations at the initial stages of the earthquake rupture. Types of information that can be included in the Bayes prior include: state of health of the seismic network, previously observed seismicity, known fault locations, and the Gutenberg-Richter magnitude-frequency relationship. The benefits of prior information are largest in regions with low station density, where large inter-station distances result in initial early warning estimates based on a sparse set of observations. We illustrate the performance of the VS method with high station density using ground motions recorded from the M = 4.75 Yorba Linda, California earthquake, and with low station density using data from the M = 7.1 Hector Mine, California earthquake. The examples shown in this paper approximate the earthquake as a single point source. While this seems adequate for earthquakes with M < 6, this methodology needs to be modified to be effective for long ruptures where near-source ground motions are expected even at large distance from the epicenter. Yamada and Heaton (2006) present a strategy for extending VS to handle long ruptures. Aside from a method to estimate magnitude and location from sparse information from the initial stages of the earthquake rupture, it is equally important for earthquake early warning studies to address how subscribers might make optimal decisions using early warning information. Different subscribers will require different types of early warning estimates, depending on subscriber tolerance to missed and/or false alarms. Ultimately, the subscriber requirements dictate how the source estimation problem must be phrased.
3 This is not consistent with the traditional separation of the source estimation and user response problems in earthquake early warning research. The VS method facilitates an integrated approach that recognizes the role of the user decision-making process in formulating the source estimation problem. 2. Real-time earthquake source estimation 2.1 Review of Bayes Theorem Consider that we want to estimate the magnitude and location of an earthquake given an available set of observed ground motions. According to Bayes theorem, the state of belief regarding magnitude and location (M,loc) given a set of available observations Y obs is given by P(M,loc Y obs ) = P(Y obs M,loc) P(M,loc) (1) P(Y obs ) where M is magnitude, loc is a location parameter (epicentral distance, or epicentral location), and Y obs is the available set of observed ground motions. We can use the proportional form of Bayes theorem since P(Y obs ) is not a function of the parameters being estimated (M,loc): P(M,loc Y obs ) P(Y obs M,loc) P(M,loc) (2) P(M,loc Y obs ), is the posterior probability density function (pdf); it is the conditional probability that an earthquake of magnitude and location M,loc generated the set of observations Y obs. The VS estimates,( M,loc) VS, are the most probable source estimates given the available observations; they maximize P(M,loc Yobs). The spread of P(M,loc Y obs ) yields the uncertainties on the VS source estimates. On the right hand side, P(Y obs M,loc) is the likelihood function; it is the conditional probability of observing a set of ground motions Y obs given an earthquake with magnitude and location M,loc. The likelihood function requires ground motion models relating source descriptions (M,loc) to observed ground motion amplitudes. The VS method uses 1) relationships between ratios of peak ground motions and magnitude, and 2) ground motion attenuation relationships describing observed amplitudes as functions of magnitude and distance, to define the likelihood function P(Y obs M,loc). P(M,loc) is the Bayes prior; it represents a background state of knowledge, independent of the observations, on relative earthquake probabilities that we want to include in the estimation process. The degree of complexity that can be incorporated into the prior is flexible. The simplest prior we can use is the assumption that all magnitudes and all locations are equally probable. This simplifies the necessary calculations, at the cost of being an inaccurate representation of the general state of knowledge regarding earthquake occurrence. Alternatively, we could incorporate into the prior some generally accepted beliefs about earthquake occurrence: 1) the magnitudefrequency relationship of earthquakes follows the Gutenberg-Richter law, 2) many earthquakes occur on known faults, 3) and earthquakes often cluster in time and space. We can also include information about the state of health of the seismic network. The choice of prior information is most influential in the initial VS early warning estimates;
4 trade-offs between magnitude and location in the initial estimates are resolved in favor of the prior information. In real-time source estimation, the use of prior information is perhaps the most important distinction between the VS method and other proposed paradigms for early warning. The evolution of VS early warning source estimates as a function of available information mimics how reasonable and educated humans (as opposed to unreasonable and prejudiced humans) modify their beliefs in light of new information. Early VS estimates are typically based on a scarce set of observations, for instance, on the first few seconds of peak amplitude data available at the first triggered station. In these early estimates, there will be trade-offs in magnitude and location that cannot be resolved by the available observations alone. At any given time, the VS estimates (M,loc) VS are the most probable source estimates; they maximize P(M,loc Y obs ), and are consistent with the available observations, with trade-offs in magnitude and location resolved in favor of the given prior information. Initially, when observations are sparse, (M,loc) VS are strongly influenced by the prior; the observations become the dominant contributor as ground motions propagate to further stations. When sufficient observations are available to fully constrain the magnitude and location estimates, the choice of prior is irrelevant; (M,loc) VS are completely determined by the observations. 2.2 Defining the likelihood function, P(Y obs M,loc) Let us initially assume a uniform prior, P(M,loc) = c, a constant. Eqn.(2) yields P(M,loc Y obs ) P(Y obs M,loc) (3) Let Yobs be the set of log peak acceleration, velocity, and filtered (3-second high pass) displacement on horizontal and vertical channels available at a given time. Assuming the Y obs are independent and log normally distributed, maximizing P(M,loc Y obs ) is equivalent to maximizing the log of the likelihood function, L = log(p(y obs M,loc)), which, for the most general case of P- and/or S-wave amplitudes available at multiple stations, we define as follows L(Y obs, M,loc) = (Z obsij Z j (M )) L(Y obs, M,loc) ij = 2σ Z 2 2 n P,S i=1 j=1 L(M,loc) ij ( ) 2 (4) 4 Y obsij Y ijk (M,loc) + 2 (5) k=1 2σ ijk L(Y obs, M,loc) incorporates 6 channels of ground motion (maximum vertical and maximum of 2 horizontal channels of acceleration, velocity, and filtered displacement) per station. We assume that each station has 1 vertical and 2 horizontal sensors with
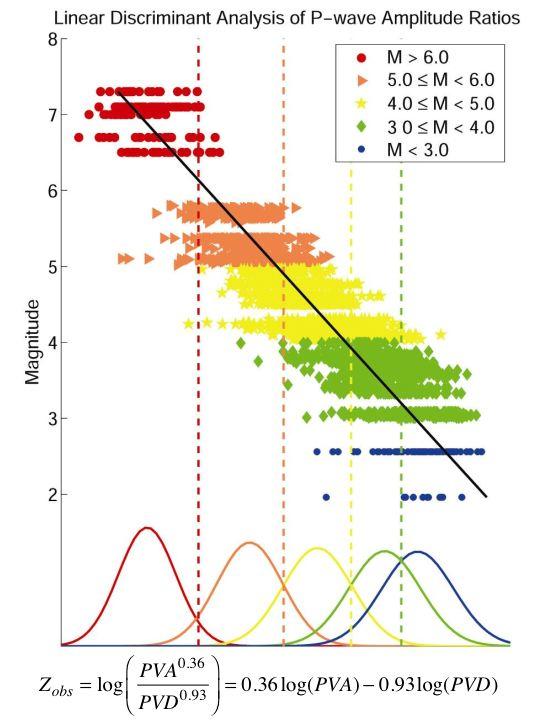
5 acceleration or broadband velocity output, and that recursive filters can be used to provide acceleration, velocity, and filtered displacement in real-time. In Eqns. (4) and (5), i is an index over the n stations with P-wave triggers, j is an index over the P- and S- wave phases, and k is an index over observed vertical velocity, and horizontal acceleration, velocity, and filtered displacement, the channels that contribute to the likelihood function via ground motion attenuation relationships. The remaining two channels, observed vertical acceleration and filtered displacement, are accounted for by the term involving. is the ratio of peak available vertical acceleration to peak Z obsij Z obsij available vertical filtered displacement found by Cua and Heaton (2006b) to be optimally indicative of magnitude; it is given by Z obsij = log PVA ij = 0.36 log(pva ij ) 0.93log(PVD ij ) (6) PVD ij In Eqn.(6), PVA ij and PVD ij denote peak available vertical acceleration and peak vertical th (filtered) displacement, respectively at the i station and for the body wave. is a measure of the relative frequency content of ground motion. Similar to methods based on predominant period (Nakamura, 1988; Allen and Kanamori, 2003; Wu and Kanamori, 2005ab), it is based on the idea that the relative frequency content of ground motions can be indicative of magnitude since small earthquakes involve small patches of slip and will radiate more high frequency energy, while large earthquakes involve finite rupture dimensions that contribute to longer period energy. The details on the linear discriminant analysis used to determine Z j th and its Z obsij relationship to magnitude are found in Cua (2005) and Cua and Heaton (2006b). There are different coefficients characterizing the magnitude dependence of Z obs (dropping the subscripts for brevity) for P- and S-waves. obs ij Z(M ) = 0.615M , σ Z = 0.17 for P-waves = 0.685M , σ Z = for S-waves (7) To use Eqns.(5), (6), and (7), it is necessary to estimate or assume whether the peak amplitudes at a given station are from a P- or S-wave. Cua (2005) and Cua and Heaton (2006b) developed the following criteria to distinguish between P- and S-waves PS = 0.43log(PVA) log(PVV ) 0.46log(PHA) 0.55log(PHV ) if PS > 0, amplitudes are most likely from a P-wave if PS < 0, amplitudes are most likely from an S-wave (8) In Eqn.(8), PVA denotes peak vertical acceleration, PVV peak vertical velocity, PHA peak horizontal acceleration, and PHV peak horizontal velocity. This criteria correctly identified P-waves 88% of the time in a database of ground motions from 70 Southern California earthquakes with 2 M 7.3, and epicentral distances R < 200 km. Figure 1
6 Z obs shows magnitude against from peak P-wave amplitudes from this dataset. Cua and Heaton (2006a) also used this database to develop the P- and S-wave amplitude attenuation relationships Y ijk (M, R), which define the second term of the likelihood function. The second term of the likelihood function represents the contribution of observed peak vertical velocity, peak horizontal acceleration, velocity, and displacement and their respective attenuation relationships Y ijk (M, R) in constraining both magnitude and location. Eqn.(5) is expressed in terms of the source parameters M,loc ; in the most general case, loc represents the epicentral latitude and longitude coordinates. Given, epicentral latitude and longitude coordinates, the epicentral distance R can be calculated. Thus, Y ijk (M,loc) is equivalent to Y ijk (M, R), which Cua and Heaton (2006a) modeled as Y ijk (M, R) = a jk M b jk (R 1i + C jk (M )) d jk log(r 1i + C jk (M )) + e jk + α ijk where R 1i = R i 2 + 9, where R i is the epicentral distance of the i th station (9) and C jk (M ) = c 1 jk (arctan(m 5) + π 2 ) exp(c 2 jk (M 5)) In VS method, the regression coefficients ( a,b,c 1,c 2,d,e) - dropping the subscripts - are known quantities (Table 1). There are different sets of regression coefficients for different channels of ground motion, for P- and S-waves, and for rock and soil sites. The station-specific site correction factors α ijk take into account systematic amplification or deamplification of ground motions observed at a given site relative to the mean ground motion levels predicted by the attenuation relationships. Cua and Heaton (2006b) determinedα ijk for 135 SCSN stations for horizontal and vertical acceleration, velocity, and filtered displacment; these are available online at The VS source estimates,( M,loc) VS, are the source parameters that maximize the posterior pdf P(M,loc Y obs ) ; in general, these estimates are a function of prior information and the available observations. Let (M,loc) L refer to the source parameters that maximize the log likelihood, L = log(p(y obs M,loc)) ; these are the source estimates most consistent with the available observations, whether data is available at single or multiple stations. A single-station estimate involves setting n = 1 and, if desired, using epicentral distance R as the loc parameter. With a uniform prior, (M,loc) VS = (M,loc) L. The VS method requires a minimum of 3 seconds of data following the P- arrival (or 2 seconds of data following the S-arrival) before a station contributes its amplitudes to the likelihood function. It is assumed that P-waves can be detected via short-term over long-term average methods. The S-wave arrival can be determined using Eqn. (8).
7 The (M,loc) L at any given time is the point source that best fits (in a least squares sense) the geographical distribution of observed P- and S-wave amplitudes and ground motion ratios. The location estimate from the likelihood function is an amplitude-based location; no arrival time information or velocity structure is included. It is comparable to the strong motion centroid (Kanamori, 1993). Amplitude-based locations, while not very accurate, are more robust than locations based on phase arrivals, and are an efficient means to convey the spatial distribution of ground motion observations post-earthquake response (Kanamori, 1993). The likelihood function develops a global maximum as the ground motions propagate to further stations. In the early stages of the estimation process, when the set of available observations is sparse (for instance, 3 seconds after the initial P detection at the first triggered station), the likelihood function may not have a global maximum; there are trade-offs between the source estimates (a small earthquake located close by, or a larger event further away) that may be unresolved by the available observations. The inclusion of prior information is most useful in these situations. 2.3 Defining the prior, P(M,loc) The Bayes prior is a statement of background knowledge relevant to the parameter estimation problem at hand. In the VS method, we use P (M,loc) to introduce information on relative earthquake probabilities and the state-of-health of the seismic network into the real-time source estimation problem. We enumerate the different types of information that can be included in the prior. - Long-term national hazard maps, or known fault traces, are good candidates to include in the Bayes prior since faults that have generated large earthquakes in the past, such as the San Andreas fault system in California, or the Northern Anatolian fault in Turkey, are likely to generate large events in the future. - The Gutenberg-Richter law states that small events occur more frequently than large earthquakes. Short-term seismicity-based earthquake forecasts take into account that the magnitude-frequency distribution of earthquakes follows the Gutenberg-Richter law, and that earthquakes cluster in space and time, with Omori s law governing the decay of number of aftershocks as a function of time after the mainshock (Reasenberg and Jones, 1989; Gerstenberger, Wiemer, and Jones, 2003). - The location of previously observed seismicity is important prior information since many large earthquakes have foreshocks. Abercrombie and Mori (1996) found that 44% of earthquakes in their dataset of 59 M > 5 California earthquakes had foreshocks. Jones (1984) found that 35% of earthquakes in a dataset of 20 San Andreas earthquakes had foreshocks within 1 day and 5 km of the mainshock. - For a region with no known faults or previously observed seismicity, we can assume that all locations have equal probability of being an earthquake epicenter. This implies that epicentral distances are more likely to be larger than smaller. - Nearest neighbor regions, or Voronoi cells, of operating stations provide useful constraints on earthquake locations. The Voronoi cell of a given station is the set of all location coordinates that are closer to the said station than any other station in the network. The initial P-wave detection from an event implies that the event nucleated within the Voronoi cell of the first triggered station. The denser the deployment of
8 stations within a seismic network, the smaller the area of the average station Voronoi cell, and the stronger the constraint on earthquake location. - The concept of not-yet-arrived data, as described by Horiuchi et al (2004) and Rydelek and Pujol (2004), can be used along with station Voronoi cells to describe the evolution of regions of possible location following the initial P detection. In this article, we refer to the region consistent with observed arrivals as the region of possible location. It is independent of the amplitude-based location estimate obtained from maximizing the likelihood function. From Rydelek and Pujol (2004), the locations consistent with the first two P-arrivals satisfy R 2 R 1 = V P (t 2 t 1 ) (10) where R 1 and R 2 are the respective epicentral distances of stations with the first 2 P- wave arrivals, t 1 and t 2 are the corresponding P-wave arrival times, and V P is an average P-wave velocity. Given the time between the first 2 P detections, Eqn. (10) constrains the earthquake location to a hyperbola passing between the two stations. As originally described by Horiuchi et al (2004) and Rydelek and Pujol (2004), notyet-arrived data can be used once two P-wave detections are available. In contrast, Voronoi cells, in conjunction with a slightly modified use of not-yet-arrived data, can be used to describe continuously evolving constraints on earthquake locations even before the second P-wave arrival. Consider the following situation: there is an initial P-wave detection at station 1, and Δt seconds later, there are no subsequent P-wave detections at the m stations sharing a Voronoi edge with station 1. The non-arrivals at each of the i = 1,K, m stations provide the inequality constraints R i R 1 > V P Δt (11) The region of possible location is the intersection of the Voronoi cell of station 1 (constraint on location from the first P detection) and the areas consistent with the m inequality constraints described by Eqn. (11); the area of this region of possible location is inversely proportional to Δt. Once the P-wave arrives at the second closest station, the region of possible location collapses to the Rydelek and Pujol hyperbola. A third arrival locates the epicenter. Voronoi cells are strictly prior information since they are derived from station locations, which are independent of the earthquake rupture process. In contrast, notyet-arrived data is not strictly prior information, since the time elapsed since the initial P detection, Δt, is an observed quantity. However, we do not include Δt in the likelihood function since it does not involve observed amplitudes. Prior information is particularly useful in regions with low station density, where time between the first and second P-wave detections may be relatively large.
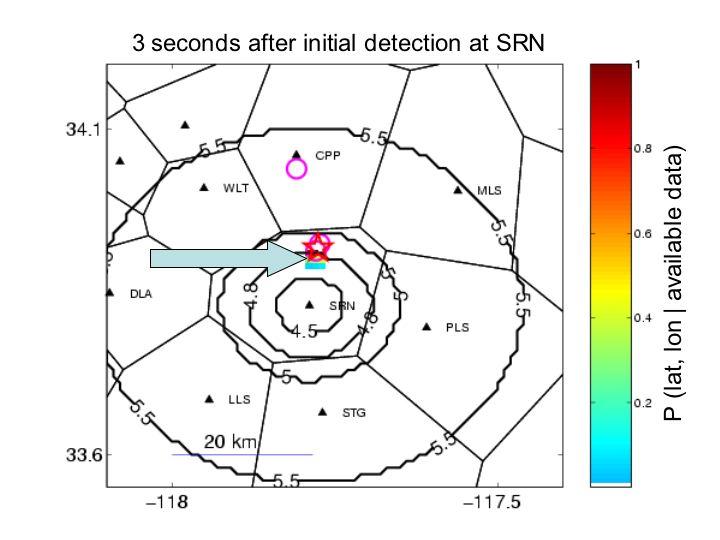
9 3. Applications of the VS method to selected Southern California earthquake datasets September 2002 M=4.75 Yorba Linda, California earthquake: high station density The Yorba Linda earthquake occurred on 3 September 2002 in suburban Los Angeles, a region with a high density of real-time Southern California Seismic Network (SCSN) stations. The mainshock was located by SCSN at 33.92N, W, at a depth of km (Hauksson et al, 2002). Two foreshocks (with magnitudes M=2.66 and M=1.6) occurred within 1 km of the mainshock epicenter in the 24 hours preceding the mainshock. The application of the VS method illustrates how the approach works in regions with high station density. Station Voronoi cells, previously observed seismicity, and the Gutenberg-Richter relationships will be included in the Bayes prior, although the prior information is for the most part unnecessary. Due to the high station density in the epicentral region, there are quickly enough observations to constrain the source estimates without resort to prior information. Figure 2 shows SCSN stations in the epicentral region. The triangles are the stations operational at the time of the mainshock; the polygons are the associated Voronoi cells. Circles are locations of M > 1 earthquakes recorded by SCSN in the 24 hours preceding the mainshock. Due to the high station density in this region, areas of Voronoi cells (those away from edges of the network) are relatively small, in the range of 250 to 700 km 2. The initial arrival at station SRN constrains the location to the area within its Voronoi cell (shaded polygon). Figure 3 shows the relative probabilities of epicentral distances consistent with the initial arrival at SRN. One of the simplest assumptions we can make given an initial P detection is that the event is located at the first triggered station. From Figure 3, the largest possible error with this assumption is 15 km. The initial VS estimate is based on peak amplitudes available 3 seconds after the initial P detection at station SRN. With data from a single station ( n = 1in Eqn.(4)), the source estimation problem can be parameterized in terms of magnitude and epicentral distance. Figure 4 shows contours of the likelihood function (no prior information) using peak amplitudes from 6 channels (horizontal and vertical acceleration, velocity, and filtered displacement) available at SRN 3 seconds after the initial P detection. The elongated contours of the likelihood function are indicative of trade-offs in magnitude and epicentral distance that are not fully resolved by the peak amplitudes at a single station. M = 5.5 and R = 33 km maximize the likelihood function. With the likelihood expressed in terms of M, R, we can include as prior information the range of epicentral distances consistent with the first arrival at SRN (Figure 3), as well as the Gutenberg- Richter relationship. Figure 5 shows the effects of including the Gutenberg-Richter relationship, in addition to the constraints on epicentral distance by the Voronoi cells, on contours of the posterior density function. Recall that the posterior pdf is the product of the likelihood and the prior pdfs, and that the source estimates that maximize the
10 posterior pdf are the most probable source estimates. ( M, R) VS, the most probable magnitude and epicentral distance estimates, are indicated in Figure 5. The 3-second VS estimates without the Gutenberg-Richter relationship in the prior are closer to the actual magnitude and epicentral distance obtained by using the SCSN arrival-based location than VS estimates including the Gutenberg-Richter relationship in the prior. As the ground motions propagate to other stations, it is more convenient to parameterize the early warning location estimate in terms geographic coordinates (latitude, longitude) as opposed to epicentral distances of n stations. Figure 6 shows locations consistent with the 3-second peak amplitudes at SRN for different magnitude ranges. The trade-offs here are similar to those in Figure 4; we cannot unambiguously distinguish between small events in close and large events at distance using only amplitude information at a single station. The situation is much improved when previously observed seismicity and Voronoi cell constraints are taken into account. The best way to include previously observed seismicity into the estimation process would be to use short-term, seismicitybased earthquake forecasts such as STEP (Gerstenberger, Wiemer, Jones, 2003) as part of the prior. In this example, we simply increase the probability that a particular location is the event location by a factor of 2 if it is within 5 km of an event that occurred in the preceding 24 hours. Figure 7 shows contours of the posterior pdf (as a function of magnitude, latitude, and longitude) using peak amplitudes at SRN 3 seconds following the initial P detection to define the likelihood and including previously observed seismicity and the Voronoi cell information in the prior. The VS location estimate agrees with the SCSN location. The VS magnitude estimate without the Gutenberg-Richter relationship in the prior is M = 4.8 ± 0.4, with the Gutenberg-Richter in the prior, it is M = 4.4 ± 0.4. The SCSN-reported magnitude is M = Figure 8 shows the evolution of magnitude estimates as a function of duration of data from the seismic network. Estimates labeled amplitudes only maximize the likelihood function (no prior information). We distinguish between 2 VS magnitude estimates (both with station geometry and previously observed seismicity included in the prior) differing in whether or not the Gutenberg-Richter relationship was used in the prior. All magnitude estimates converge to the SCSN solution at large times, when there are sufficient available observations. The differences in the magnitude estimates in the earlier estimates are due to the differences in the prior information included. The VS estimate without the Gutenberg-Richter relationship is within 0.05 magnitude units of the SCSN-reported magnitude 3 seconds after the initial P detection. At large time, t, after the event origin time, the location estimates that maximize the posterior pdf (which are identical to those that maximize the likelihood function at large t) are robust amplitude-based locations can be used to verify arrival-based locations. In Figure 8, the amplitude-based location (green contours) is derived from the distribution of peak P- and S-wave amplitudes at 89 stations. The arrival-based location is obtained from 89 P-wave arrivals and an average P-wave velocity of 6 km/sec. The star marks the SCSN-reported location. There is general agreement between the amplitude- and arrivalbased location estimates, indicating that the arrival-based location is most likely correct.
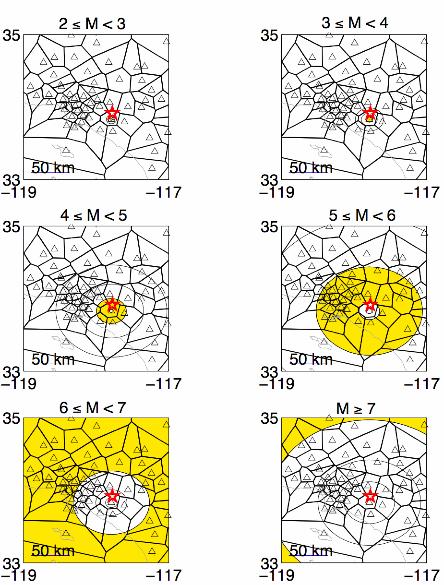
11 These estimates are independent of each other, as they are derived from different types of data October 1999 M7.1 Hector Mine, California earthquake: low station density The M7.1 Hector Mine, California earthquake occurred in a region with relatively low density of SCSN stations. The closest station, HEC, was located 27 km north of the hypocenter. The mainshock, located by SCSN at 34.59N, W, at a depth of 5 km, was preceded by a cluster of M 3.8 foreshocks within 1 km of the hypocenter in the previous 24 hours (Hauksson, 2002). The application of the VS method on the Hector Mine dataset illustrates the importance of prior information for regions with relatively low station density. Figure 10 shows the operating SCSN stations (triangles), Voronoi cells (polygons), and seismicity in the preceding 24 hours (open circles) at the time of the mainshock. The areas of Voronoi cells of station HEC and adjacent stations range from 880 km 2 to 8020 km 2 ; these are an order of magnitude larger than the Voronoi cells in the epicentral region of the Yorba Linda earthquake. The VS estimation process begins 3 seconds after the initial P detection at HEC, the first triggered station. Due to the large inter-station distances, the time between the initial P detection at station HEC and the P detection at the next closest station is 8 seconds. Figures 11(a) and 11(b) show the VS estimates at Δt = 3 and Δt = 7 seconds after the initial P detection at HEC. The regions of possible location consistent with HEC s Voronoi cell and the non-arrival information from the adjacent stations are shaded; these regions vary continuously as a function of time since the initial P detection. Within the regions of possible location, the most probable location estimates correspond to the locations where previously observed seismicity was concentrated. Thus, as early as 3 seconds after the initial P detection, with only one P arrival at the first triggered station, the VS location estimate agrees with the actual location (reported by SCSN). The 3- second magnitude estimate is M = 6.2 ± 0.45 ; the 7-second magnitude estimate is M = 7.2 ± Figure 12 shows the evolution of different magnitude estimates for the Hector Mine mainshock based on: 1) observed amplitudes only with no prior, 2) observed amplitudes with Voronoi cells, seismicity, and Gutenberg-Richter in the prior, and 3) similar to 2) but without the Gutenberg-Richter relationship. There are significant differences in these types of estimates in the early part of the estimation process, when observations are scarce; these different estimates converge and approach the SCSN-reported magnitude of M7.1 as more observations become available and the prior becomes less important with increasing t. When sufficient data is available, the estimates are driven by the observations (amplitudes and arrivals) and the choice of prior is irrelevant. The prior is important only in the early stages of the estimation process, where there is not sufficient data to adequately constrain the estimation process.
12 4. How subscribers might use early warning information Ultimately, the goal of seismic early warning is to provide users with information that can be used to determine the optimal course of action in the few seconds before the onset of damaging ground motion levels at their sites of interest. Consider the case of a subscriber who wants to initiate a predetermined set of damagemitigating actions if the peak ground motions at the site of interest exceed a threshold level, Y max > Y thresh. Given the early warning source estimates and their uncertainties, the expected ground motion levels can be predicted using attenuation relationships. The uncertainty on these predicted ground motion levels, σ pred, is a combination of uncertainties from the early warning source estimates and uncertainties from the attenuation relationships. As additional observations become available, the uncertainties from the source estimates decrease; σ pred approaches the uncertainty on the ground motion attenuation relationships. From Table 1, σ pred for various amplitude types (horizontal and vertical acceleration, velocity, and displacement for P- and S-waves on rock and soil sites) is on the order of 0.3 log units, or a factor of 2. The probability of observing a maximum ground motion level Y max, given the predicted ground motions from the early warning estimates, is Y pred P(Y max M,loc) = 1 exp (Y max Y pred (M,loc)) 2 2πσ pred 2σ pred In Eqn.(12), Y is the predicted maximum amplitude expected at the site of interest. pred These are given by the horizontal S-wave amplitude envelope attenuation relationships in Table 1. The probability of the ground motion threshold Ythresh being exceeded, P ex, given the early warning source estimates, is P ex = P(Y max > Y thresh Y pred ) = 2 (12) P(Y max M,loc) (13) Y thresh At the time when the subscriber must decide whether to initiate actions or not, the actual peak ground motions at the site, Y max, are of course unknown; the decision to initiate actions or not must be based on some function of the predicted ground motions, Y. The uncertainty in the relationship between Y and Y gives rise to the possibility of less than optimal decisions: 1) a false alarm corresponds to initiating action when it is ultimately unnecessary, or Ymax < Y thresh, and 2) a missed alarm corresponds to not initiating action when it is ultimately necessary, or Y max > Y thresh. The following is a simple cost-benefit analysis using basic decision theory for a subscriber who wants to initiate a set of actions if Y (Grigoriou, 1979). max > Y thresh max pred pred
13 Let H = h i, i = 1,K,n be the (exhaustive and mutually exclusive) set of possible states of nature. In our example, n = 2 ; the only possibilities are 1) Y max > Y thresh, or 2) Y max < Y thresh. Let B = b j, j = 1,K,m be the set of possible actions. In our example, m = 2 ; the possible actions we consider are 1) initiate actions, and 2) do nothing. Let C(b j,h i ) be the cost of action b j if the state of nature is h i. Let P i be the probability of. is the cost of damage incurred if no actions were taken and the peak ground h i C damage motions exceeded the threshold, Y max > Y thresh ; it is the cost of a missed alarm. is the cost of performing the damage-mitigating actions; it is also the cost of a false alarm. For simplicity, assume that C and are known. In practice, these are also damage C act uncertain, and probability models are required to describe these quantities. The cost table, expressed in terms of Cratio = C damage is shown in Table 2. The expected cost, E [C j ], C act of a particular action is given by n C act E [C j ] = C(b j,h i )P i (14) i=1 The optimal action given a particular early warning source estimate is the action with the minimum cost. If we set E["initiate action"] = E["do nothing"], we find the critical probability of exceedance, above which it is optimal to initiate action 1 P ex,crit = (15) C ratio Since P ex,crit is a probability, it takes on values between 0 and 1. This implies that C ratio 1; the cost of damage as a consequence of not acting must be equal to or greater than the cost of performing the actions, else early warning information provides no benefit to the subscriber. We can relate to the predicted level of ground motion, Y, above which it is P ex,crit optimal to act Y pred,crit = Y thresh σ pred 2 erf 1 1 2πσ pred C ratio pred,crit Thus, taking into account that there are uncertainties in the ground motion predictions from an early warning source estimate, the appropriate criteria for a subscriber to initiate action is Y pred > Y pred,crit where Y pred,crit depends both on subscriber-specific values Y thresh and C ratio, as well as the uncertainty on the predicted ground motions σ pred. Figure 19 shows Y pred,crit as a function of σ pred for various values of. Y thresh is simply a constant offset; in this plot, we set Ythresh = 0. For subscribers with C ratio ~1, (16) C ratio
14 false alarms are relatively expensive; when σ pred is large, it is sometimes optimal to do nothing even when the predicted ground motions exceed the threshold, Y pred > Y thresh. For subscribers withc ratio >> 1, false alarms are relatively inexpensive; it is optimal to initiate action even when Y pred < Y thresh. This highlights the importance of C ratio in optimizing use of early warning information. Simple applications, such as opening fire station doors, or stopping elevators at the closest floor, would have relatively high values of C ratio. Considerable application-specific efforts are required to determine what values of C ratio would be appropriate for more complex applications such as diverting airport traffic, putting nuclear plants into safe mode, or stopping sensitive manufacturing equipment. Each subscriber needs to invest efforts into determining its appropriate C ratio, and whether it is in fact a suitable candidate for early warning. 5. Station density and the evolution of estimate uncertainties The uncertainties on early warning source estimates translate to uncertainties in predicted ground motions, which play an important role for users in decision-making using early warning information. In the VS method, the posterior density function is a three dimensional function in magnitude, latitude, and longitude. How should the network transmit the source estimates and their uncertainties to the subscribers? If the posterior density function can be described as a Gaussian, it may be sufficient to transmit 6 parameters (3 means, and 3 standard deviations) to the subscribers. The marginal probability density (integrating over latitude and longitude) of the magnitude estimate can always be described as a Gaussian, whether or not the Gutenberg-Richter law is included (Figure 13a, Figure 14a). This is not always the case for the latitude and longitude estimates. The simplest location estimate is to assume that the earthquake is located at the first triggered station. In regions with relatively high station density, this is a relatively good assumption to make. The maximum possible errors on such location estimates depend on inter-station distances. In regions where instrumentation density is high (for instance, the epicentral region of the Yorba Linda mainshock), this is a reasonable assumption, with maximum possible errors on the order of 10 km. In contrast, this assumption is inappropriate in regions with low station density or regions on the outer boundaries of the network. In the epicentral region of the Hector Mine earthquake, the maximum possible error in assuming the event is located at the first triggered station is 60 km (the maximum epicentral distance consistent with the Voronoi cell geometry). In less instrumented regions within SCSN, the maximum possible location error associated with such an assumption can be as large as 120 km. When station density is high, the posterior density function can be described by 3 Gaussian functions since 1) assuming a location at the first triggered station is appropriate, and 2) prior information is not necessary, since there are quickly enough arrivals to properly constrain the location. When station density is low, assuming a location at the first triggered station can have very large errors. Prior information is important for the initial estimates in such regions, since large inter-station distances mean that it takes a while before there are enough observations to properly constrain the magnitude and location estimates. Prior information such as previously observed seismicity and known fault locations make the
15 latitude and longitude marginal density functions highly irregular and multimodal. It is prohibitive in terms of time and communications bandwidth for the network to transmit the full 3d posterior density function to subscribers. Nevertheless, it is necessary to provide this information to subscribers. An attractive alternative is for the network to transmit the likelihood function to the subscribers, and for the subscribers combine the prior and likelihood on site. This is alternative provides the subscriber added flexibility in: 1) defining its own prior (for instance, whether or not to include the Gutenberg- Richter relationship), 2) determining computational resources (for instance, maximizing the posterior density function could be implemented on parallel processors). It is particularly important for subscribers to have a control over whether or not the Gutenberg-Richter relationship should be included in the prior. Figure 16 shows the evolution of different magnitude estimates (amplitudes only, VS with Gutenberg-Richter in prior, VS without Gutenberg-Richter in prior) for 4 Southern California earthquakes. In all cases, the VS magnitude estimates converge to the magnitudes reported by SCSN once there are enough observations to properly constrain the estimates, regardless of the choice of prior. When there are trade-offs in the source parameters unresolved by the observed amplitudes, the VS magnitude estimates without the Gutenberg-Richter relationship have a smaller error compared to when the Gutenberg-Richter relationship is included. This seems to indicate that the information provided by the Gutenberg-Richter relationship is not useful. However, the Gutenberg-Richter relationship has been observed to hold in general worldwide. This apparent inconsistency is resolved by taking into account the user considerations. In these 4 cases, VS magnitude estimates with the Gutenberg-Richter relationship in the prior are smaller than the actual magnitude. Subscribers basing decisions on VS estimates with the Gutenberg-Richter relationship will lower their incidence of false alarms, at the cost of increasing their vulnerability to missed warnings. Thus, subscribers with C ratio ~1 should consider using the Gutenberg- Richter relationship in their prior. In contrast, subscribers with C ratio >>1 can exclude the Gutenberg-Richter relationship from their prior, and benefit from the smaller errors in the magnitude estimates. Such subscribers have relatively high costs for missed warnings. Since they place a premium on making the appropriate decisions during the large, infrequent events, they need to accept a certain level of false alarms dictated by C ratio. More studies regarding how VS estimates evolve with time are necessary. 6. Conclusions The Virtual Seismologist (VS) method is a Bayesian approach that provides a unified framework for addressing both the real-time source estimation and the user-response problems in earthquake early warning. Disparate types of information, such as previously observed seismicity, station locations, and the Gutenberg-Richter relationship, are included in the source estimation problem via the Bayes prior. The trade-offs in the initial source estimates that cannot be resolved by the available data are resolved in favor of the prior information. The evolution of source estimates as a function of available data is similar to how humans modify their opinions or judgments in light of new information; prior information is important when data is sparse, but decreases in influence as additional observations become available.
16 What type of information to include in the Bayes prior, and hence, what type of source estimates to solve for, is dependent on user-specific considerations, in particular, the relative cost of missed to false alarms. Users with relatively expensive false alarms should include the Gutenberg-Richter relationship in the prior, at the cost of increasing their vulnerability to missed warnings. Users with relatively expensive missed alarms should use source estimates excluding the Gutenberg-Richter relationship. A certain level of false alarms must be accepted if the aim is to act appropriately during the large, infrequent earthquakes. 7. Acknowledgements We wish to thank Hiroo Kanamori, Egill Hauksson, James Beck, and John Clinton for their stimulating discussions and for their comments on the thesis work on which this manuscript is based. This work was supported by the Department of Civil Engineering at the California Institute of Technology. The completion of the manuscript was made possible with support of the Puerto Rico Seismic Network and the Puerto Rico Strong Motion Program.
17 8. References Allen, R. M. and H. Kanamori (2003). The potential for earthquake early warning in Southern Californa. Science 300, Cua, G. (2005). Creating the Virtual Seismologist: developments in ground motion characterization and seismic early warning. PhD thesis, California Institute of Technology. Cua, G. and T. Heaton (2006). Characterizing average properties of Southern California ground motion envelopes. (in preparation) Cua, G. and T. Heaton (2006). Linear discriminant analysis in earthquake early warning. (in preparation) Gerstenberger, M., S. Wiemer, and L. Jones (2003). Real-time forecasts of tomorrow s earthquakes in California: a new mapping tool. United States Geological Survey Open File Report, Goltz, J. D. (2002). Introducing earthquake early warning in California: a summary of social science and public policy issues. Technical Report, Governor s Office of Emergency Services. Grazier, V., A. Shakal, C. Scrivner, E. Hauksson, J. Polet, and L. Jones (2002). TriNet strong-motion data from the M7.1 Hecor Mine, California earthquake of 16 October Bull. Seism. Soc. Am. 92, Grigoriu, M., D. Veneziano, and C. A. Cornell (1979). Probabilistic modeling as decision making. Journal of the Engineering Mechanics Division, ASCE EM4, Hauksson, E., K. Hutton, L. Jones, and D. Given (2002). The September 03, 2002 earthquake M4.6 near Yorba Linda. Hauksson, E., L. Jones, and K. Hutton (2002). The 1999 M w 7.1 Hector Mine, Caifornia earthquake sequence: complex conjugate strike-slip faulting. Bull. Seism. Soc. Am. 92, Heaton, T. (1985). A model for a seismic computerized alert network. Science 228, Horiuchi, S., H. Negishi, K. Abe, A. Kimimura, and Y. Fujinawa. An automatic processing system for broadcasting earthquake alarms. Bull. Seism. Soc. Am. 95, Jones, L. (1984). Foreshocks ( ) in the San Andreas system, California. Bull. Seism. Soc. Am. 74,
18 Kanamori, H. (1993). Locating earthquakes with amplitude: application to real-time seismology. Bull. Seism. Soc. Am. 83, Nakamura, Y. (1988). On the urgent earthquake detection and alarm system (UrEDAS). Proceedings of 9 th World Conference in Earthquake Engineering, Tokyo-Kyoto, Japan. Rydelek, P. and J. Pujol (2004). Real-time seismic warning with a 2-station subarray. Bull. Seism. Soc. Am. 94, Sivia, D.S. (1996). Data Analysis: a Bayesian tutorial. Oxford University Press. Wu, Y.M. and H. Kanamori (2005a). Experiment on an onsite early warning method for the Taiwan early warning system. Bull. Seism. Soc. Am. 95, Wu, Y.M. and H. Kanamori (2005b). Rapid assessment of damaging potential of earthquakes in Taiwan from the beginning of P waves, Bull. Seism. Soc. Am. 95, Yamada, M. and T. Heaton (2006). Early warning systems for large earthquakes: estimation from fault location using ground motion envelopes, Bull. Seism. Soc. Am. (submitted)
19 9. Figure captions Figure 1: Magnitude plotted against ground motion ratio Z obs = 0.36log(PVA) 0.93log(PVD) for P-wave amplitudes. Figure 2: Prior information for Yorba Linda, California earthquake: SCSN station locations (triangles), associated Voronoi cells (polygons), and seismicity in the preceding 24 hours (open circles) within 200 km of the mainshock (star). Two foreshocks occurred within the Voronoi cell of station SRN (shaded), the station closest to the epicenter. Figure 3: Range of possible Yorba Linda earthquake epicentral distances from station SRN consistent with a first P detection at SRN (scaled such that maximum on y axis is 1). The weights on various distances (y axis) are obtained by giving equal weight to all locations within SRN s Voronoi cell. The most probable epicentral distance (8 km) is that which occurs most often within SRN s Voronoi cell. If we had included seismicity information in the prior, that there were two foreshocks at the mainshock epicenter means this distribution would include an impulse function situated at the distance of the mainshock. Figure 4: Contours of the likelihood function for the M = 4.75 Yorba Linda earthquake expressed in terms of magnitude and epicentral distance using the peak amplitudes at SRN 3 seconds after the initial P detection (no prior information, only the peak amplitudes observed at SRN). The peak of the likelihood function is scaled to 1, and contours are drawn at 0.6, 0.1, and 0.01 levels. Regions where the likelihood function has a scaled value exceeding 0.6 are shaded. The likelihood function has a maximum at M = 5.5, R = 33 km. Elongated regions of equal probability indicate trade-offs in M, R unresolved by the available amplitudes and the attenuation relationships. The ground motion ratio term of the likelihood function constraints the possible magnitude to the approximate range 5 < M < 6. The star marks the actual magnitude and epicentral distance to SRN of the Yorba Linda mainshock, M = 4.75, R = 9.8 km. Figure 5: Contours of the posterior density function showing the effect of including the Gutenberg-Richter magnitude-frequency relationship in the prior on initial M, R estimates 3 seconds after the initial P detection. Figures 4a and 4b include the constraint on epicentral distance from the Voronoi cell of station SRN. Figure 4a includes the Gutenberg-Richter relationship as a constraint on magnitude, while Figure 4.b does not. The star marks the actual magnitude and epicentral distance of the Yorba Linda mainshock. The cross marks the VS estimates in M.R space. The Gutenberg-Richter relationship favors smaller magnitude events located at smaller epicentral distances from the station. While inclusion of the Gutenberg-Richter relationship (a) produces magnitude estimates that are systematically smaller than the actual magnitudes, Bayesian statistics assure us that this is the most probable solution. Figure 6: Snapshots of the likelihood function expressed as a function of magnitude and epicentral location at various magnitude ranges. The shaded regions in each subplot are locations consistent with the peak amplitudes available at station SRN 3 seconds after the
20 initial P detection. The trade-offs in magnitude and location are similar to those shown in Figure 3. If no prior information regarding station geometries, previously observed seismicity, or the Gutenberg-Richter relationship is included, we cannot distinguish between a small event at small epicentral distance from a large event at large distance. Figure 7: VS estimates 3 seconds after the initial P detection at SRN for the Yorba Linda earthquake. Colors scale with probability that the event is located at the given location. The VS location estimate (indicated by an arrow) is within 2 km of the SCSN reported location. Prior information includes previously observed seismicity (open circles), Voronoi cell information, and available arrivals at adjacent stations. Contours show the VS magnitude estimates at a given location without the Gutenberg-Richter relationship in the prior. The VS magnitude estimate without the Gutenberg-Richter relationship ( M = 4.8 ± ) is in good agreement with the SCSN-reported magnitude of M = Figure 8: Comparison of amplitude- and arrival-based location estimates 80 seconds after the origin time of the Yorba Linda earthquake. The amplitude-based location (green contours) is derived from the distribution of peak P- and S-wave amplitudes at 89 stations. The arrival-based location is obtained from 89 P-wave arrivals and an average P- wave velocity of 6 km/sec. The star marks the SCSN-reported location. There is general agreement between the amplitude- and arrival-based location estimates. These estimates are independent of each other, as they are derived from independent datasets. Figure 9: The evolution of various magnitude estimates for the Yorba Linda earthquake as a function the duration of data from the seismic network. Estimates labeled amplitudes only correspond to magnitude estimates obtained by maximizing the likelihood function (no prior information). We distinguish between 2 VS magnitude estimates (both with station geometry and previously observed seismicity included in the prior) with and without the Gutenberg-Richter magnitude-frequency relationship in the Bayes prior. All magnitude estimates converge to the SCSN solution at large times, when there are sufficient available observations. The differences in the magnitude estimates in the earlier estimates are due to the differences in prior information included. The VS estimate without the Gutenberg-Richter relationship is within 0.05 magnitude units of the SCSN-reported magnitude 3 seconds after the initial P detection. Figure 10: Operational SCSN stations (triangles), associated Voronoi cells (polygons), and seismicity in the preceding 24 hours (open circles) within 200 km of the M=7.1 Hector Mine, California mainshock (star). Eighteen earthquakes occurred within 1-km epicentral distance of the mainshock hypocenter. Figure 11: VS estimates 3 and 7 seconds after the initial P detection at HEC for the Hector Mine earthquake. Colors scale with the probability that the earthquake is located at a given location. The shaded regions are the regions of likely location consistent with the initial P arrival at HEC, and no subsequent arrivals at adjacent stations 3 and 7 seconds later. Within the regions of likely location, the most probable locations are where there was a concentration of seismic activity in the preceding 24 hours. With Voronoi
21 cells and not-yet-arrived data, the VS location estimates continually evolve, even before the second P arrival. The likelihood function is based on peak amplitudes available at HEC 3 seconds after the initial P detection. Contours show the VS magnitude estimates at a given location without the Gutenberg-Richter relationship in the prior. Figure 12: The evolution of various magnitude estimates for the Hector Mine earthquake as a function of duration of data from the network. The estimates labeled amplitude only correspond to the magnitudes that maximize the likelihood function (that is, no prior information included). VS magnitude estimates with and without the Gutenberg- Richter relationship in the Bayes prior are also shown. Figure 13: In regions with high station density, such as the epicentral region of the Yorba Linda earthquake, assuming that the earthquake is located at the first triggered station is a valid assumption. The marginal pdfs for the VS magnitude and location estimates can be approximated as Gaussian distributions. The relevant information about the early warning estimates can be summarized by 6 parameters (3 means, and 3 standard deviations), which can be easily transmitted to subscribers. Figure 14: In regions with low station density, such as the epicentral region of the Hector Mine earthquake, the initial VS estimates are heavily influenced by prior information. While the marginal pdf for the magnitude estimate can still be expressed as a Gaussian distribution, the marginal pdfs for the location estimates are non-gaussian, due to the influence of previously observed seismicity. Figure 15: The critical predicted level of ground motion above which early warning subscribers should initiate action, Y pred,crit, as a function of uncertainty on predicted ground motions σ pred and C ratio. Depending on the value of C ratio, it may be costeffective for an early warning subscriber to initiate action even when the predicted ground motion levels are below the threshold at which damage occurs, Y. thresh Figure 16: The evolution of different magnitude estimates (amplitudes only, amplitudes with prior including Gutenberg-Richter relationship, and amplitudes with prior excluding the Gutenberg-Richter relationship) as a function of duration of data from the network for selected Southern California earthquake datasets. Estimates with the Gutenberg-Richter relationship in the prior reduce the probability of false alarms. Subscribers should have the flexibility to decide which type of magnitude estimates are best suited to their applications, based on their relative cost of missed to false alarms.
22 10. Tables and Figures Table 1: Attenuation relationships for peak P- and S-wave amplitudes Y (M, R) = am + b(r 1 + C(M )) + d(r 1 + C(M )) + e + α R 1 = R + 9 C(M ) = c 1 arctan(m 5) + π 2 exp(c 2 (M 5)) a b c 1 c 2 d e σ Acceleration rock x soil x Root mean square horizontal amplitudes S-wave P-wave velocity displacement acceleration velocity displacement rock x soil x rock x soil x rock x soil x rock x soil x rock x soil x acceleration rock x soil x Vertical amplitudes S-wave P-wave velocity displacement acceleration velocity rock x soil x rock x soil x rock x soil x rock x soil x displacement rock x soil x
23 Table 2: Cost table for early warning subscriber h i P i = P(h i Y pred ) Do nothing Initiate actions Y > Y thresh P ex C ratio 1 Y < Y thresh 1 P ex 0 1
24 Figure 1
25 Figure 2
26 Figure 3
27 Figure 4
28 Figure 5
29 Figure 6
30 Figure 7
31 Figure 8
32 Figure 9
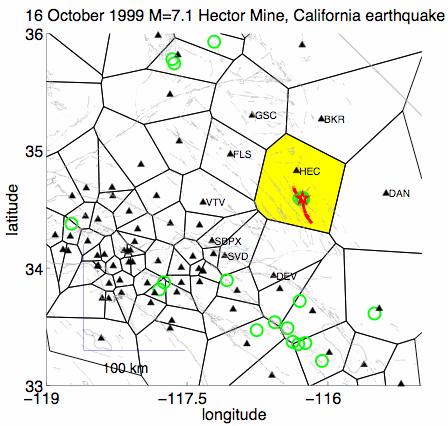
33 Figure 10

34 (a) Figure 11 (b)
10.1 A summary of the Virtual Seismologist (VS) method for seismic early warning
 method for seismic early warning") 316 Chapter 10 Conclusions This final Chapter is made up of the following: a summary of the Virtual Seismologist method for seismic early warning, comments on implementation issues, conclusions and other
316 Chapter 10 Conclusions This final Chapter is made up of the following: a summary of the Virtual Seismologist method for seismic early warning, comments on implementation issues, conclusions and other
2πσpred. The probability of exceedance, or the probability of the actual ground motions a exceeding the threshold a thresh, is given by.
 299 Chapter 9 information How to use early warning Ultimately, the goal of seismic early warning is to provide users with information that will help them in deciding the optimal course of action in the
Bayesian earthquake early warning: a dispatch from one of many frontiers of real-time seismology
 Bayesian earthquake early warning: a dispatch from one of many frontiers of real-time seismology Georgia Cua 1, Thomas Heaton 2, Stefan Wiemer 1, CISN Early Warning Group, SAFER WP2 1 Swiss Seismological
Parkfield, California, earthquake
 243 Chapter 7 28 September 2004 M=6.0 Parkfield, California, earthquake A M=6.0 earthquake along the Parkfield segment of the San Andreas fault struck Central California on 28 September 2004 at 17:15:26
Earthquake early warning for informationbased
 Earthquake early warning for informationbased societies Georgia Cua Swiss Seismological Service ETH Zürich, Switzerland EOST-IPGS Universite Louis Pasteur 22 November 2007 Outline What is early warning
Exploring the feasibility of on-site earthquake early warning using close-in records of the 2007 Noto Hanto earthquake
 LETTER Earth Planets Space, 60, 155 160, 2008 Exploring the feasibility of on-site earthquake early warning using close-in records of the 2007 Noto Hanto earthquake Yih-Min Wu 1 and Hiroo Kanamori 2 1
Southern California ground motion envelopes over ranges of magnitudes, distances, and site conditions
 55 Chapter 3 Average properties of Southern California ground motion envelopes over ranges of magnitudes, distances, and site conditions In this chapter, I use the envelope attenuation relationships derived
Determination of earthquake early warning parameters, τ c and P d, for southern California
 Geophys. J. Int. (2007) 170, 711 717 doi: 10.1111/j.1365-246X.2007.03430.x Determination of earthquake early warning parameters, τ c and P d, for southern California Yih-Min Wu, 1 Hiroo Kanamori, 2 Richard
CALIFORNIA INSTITUTE OF TECHNOLOGY
 CALIFORNIA INSTITUTE OF TECHNOLOGY EARTHQUAKE ENGINEERING RESEARCH LABORATORY CHARACTERIZING AVERAGE PROPERTIES OF SOUTHERN CALIFORNIA GROUND MOTION AMPLITUDES AND ENVELOPES BY GEORGIA CUA AND THOMAS H.
Rapid Source Parameter Estimations of Southern California Earthquakes Using Preseis
 Rapid Source Parameter Estimations of Southern California Earthquakes Using Preseis Nina Köhler, Georgia Cua, Friedemann Wenzel, and Maren Böse Nina Köhler, Georgia Cua, 2 Friedemann Wenzel, and Maren
CALIFORNIA INSTITUTE OF TECHNOLOGY
 CALIFORNIA INSTITUTE OF TECHNOLOGY EARTHQUAKE ENGINEERING RESEARCH LABORATORY SEISMIC EARLY WARNING SYSTEMS: PROCEDURE FOR AUTOMATED DECISION MAKING BY VERONICA F. GRASSO, JAMES L. BECK AND GAETANO MANFREDI
 This article was published in an Elsevier journal. The attached copy is furnished to the author for non-commercial research and education use, including for instruction at the author s institution, sharing
Geophysical Research Letters. Supporting Information for
 Geophysical Research Letters Supporting Information for A P-wave based, on-site method for earthquake early warning S. Colombelli(1), A. Caruso(1), A. Zollo(1), G. Festa(1) and H. Kanamori(2) (1) Department
A GLOBAL MODEL FOR AFTERSHOCK BEHAVIOUR
 A GLOBAL MODEL FOR AFTERSHOCK BEHAVIOUR Annemarie CHRISTOPHERSEN 1 And Euan G C SMITH 2 SUMMARY This paper considers the distribution of aftershocks in space, abundance, magnitude and time. Investigations
Lab 6: Earthquake Focal Mechanisms (35 points)
") Lab 6: Earthquake Focal Mechanisms (35 points) Group Exercise 1. Drawing Nodal Planes (8 pts) The outline map below labeled Figure 4.60a shows the positions of two earthquakes recorded on the Mid-Atlantic
Lab 6: Earthquake Focal Mechanisms (35 points) Group Exercise 1. Drawing Nodal Planes (8 pts) The outline map below labeled Figure 4.60a shows the positions of two earthquakes recorded on the Mid-Atlantic
Magnitude determination using strong groundmotion attenuation in earthquake early warning
 Click Here for Full Article GEOPHYSICAL RESEARCH LETTERS, VOL. 3,, doi:10.1029/2010gl042502, 2010 Magnitude determination using strong groundmotion attenuation in earthquake early warning Ting Li Lin 1
FEASIBILITY STUDY ON EARTHQUAKE EARLY WARNING SYSTEM FOR THE CITY OF LIMA, PERU, USING A NEWLY DEPLOYED STRONG-MOTION NETWORK
 FEASIBILITY STUDY ON EARTHQUAKE EARLY WARNING SYSTEM FOR THE CITY OF LIMA, PERU, USING A NEWLY DEPLOYED STRONG-MOTION NETWORK Cinthia CALDERON MEE1771 Supervisor: Takumi HAYASHIDA Toshiaki YOKOI ABSTRACT
Module 7 SEISMIC HAZARD ANALYSIS (Lectures 33 to 36)
") Lecture 34 Topics Module 7 SEISMIC HAZARD ANALYSIS (Lectures 33 to 36) 7.3 DETERMINISTIC SEISMIC HAZARD ANALYSIS 7.4 PROBABILISTIC SEISMIC HAZARD ANALYSIS 7.4.1 Earthquake Source Characterization 7.4.2
Lecture 34 Topics Module 7 SEISMIC HAZARD ANALYSIS (Lectures 33 to 36) 7.3 DETERMINISTIC SEISMIC HAZARD ANALYSIS 7.4 PROBABILISTIC SEISMIC HAZARD ANALYSIS 7.4.1 Earthquake Source Characterization 7.4.2
Soil Dynamics and Earthquake Engineering
 Soil Dynamics and Earthquake Engineering ] (]]]]) ]]] ]]] Contents lists available at ScienceDirect Soil Dynamics and Earthquake Engineering journal homepage: www.elsevier.com/locate/soildyn Earthquake
Updated Graizer-Kalkan GMPEs (GK13) Southwestern U.S. Ground Motion Characterization SSHAC Level 3 Workshop 2 Berkeley, CA October 23, 2013
 Southwestern U.S. Ground Motion Characterization SSHAC Level 3 Workshop 2 Berkeley, CA October 23, 2013") Updated Graizer-Kalkan GMPEs (GK13) Southwestern U.S. Ground Motion Characterization SSHAC Level 3 Workshop 2 Berkeley, CA October 23, 2013 PGA Model Our model is based on representation of attenuation
Updated Graizer-Kalkan GMPEs (GK13) Southwestern U.S. Ground Motion Characterization SSHAC Level 3 Workshop 2 Berkeley, CA October 23, 2013 PGA Model Our model is based on representation of attenuation
revised October 30, 2001 Carlos Mendoza
 Earthquake Sources in the circum-caribbean Region Puerto Rico Tsunami Mitigation and Warning Program Federal Emergency Management Agency Preliminary Report: Task 3 revised October 30, 2001 Carlos Mendoza
Deterministic and Non-deterministic Behavior of Earthquakes and Hazard Mitigation Strategy
 Deterministic and Non-deterministic Behavior of Earthquakes and Hazard Mitigation Strategy Hiroo Kanamori Seismological Laboratory, California Institute of Technology Earthquake Process Deterministic Non-deterministic
SEISMIC HAZARD ANALYSIS. Instructional Material Complementing FEMA 451, Design Examples Seismic Hazard Analysis 5a - 1
 SEISMIC HAZARD ANALYSIS Instructional Material Complementing FEMA 451, Design Examples Seismic Hazard Analysis 5a - 1 Seismic Hazard Analysis Deterministic procedures Probabilistic procedures USGS hazard
Effects of Surface Geology on Seismic Motion
 4 th IASPEI / IAEE International Symposium: Effects of Surface Geology on Seismic Motion August 23 26, 2011 University of California Santa Barbara LONG-PERIOD (3 TO 10 S) GROUND MOTIONS IN AND AROUND THE
Analysis Of Earthquake Records of Istanbul Earthquake Rapid Response System Stations Related to the Determination of Site Fundamental Frequency
 Analysis Of Earthquake Records of Istanbul Earthquake Rapid Response System Stations Related to the Determination of Site Fundamental Frequency A. C. Zulfikar, H. Alcik & E. Cakti Bogazici University,Kandilli
Part 2 - Engineering Characterization of Earthquakes and Seismic Hazard. Earthquake Environment
 Part 2 - Engineering Characterization of Earthquakes and Seismic Hazard Ultimately what we want is a seismic intensity measure that will allow us to quantify effect of an earthquake on a structure. S a
GEOPHYSICAL RESEARCH LETTERS, VOL. 34, LXXXXX, doi: /2007gl031077, 2007
 Click Here for Full Article GEOPHYSICAL RESEARCH LETTERS, VOL. 34, LXXXXX, doi:10.1029/2007gl031077, 2007 2 Magnitude scaling relations from P-waves in southern California 3 Louisa L. H. Tsang, 1,2 Richard
Time-varying and long-term mean aftershock hazard in Wellington
 Time-varying and long-term mean aftershock hazard in Wellington A. Christophersen, D.A. Rhoades, R.J. Van Dissen, C. Müller, M.W. Stirling, G.H. McVerry & M.C. Gerstenberger GNS Science, Lower Hutt, New
Earthquakes and Earthquake Hazards Earth - Chapter 11 Stan Hatfield Southwestern Illinois College
 Earthquakes and Earthquake Hazards Earth - Chapter 11 Stan Hatfield Southwestern Illinois College What Is an Earthquake? An earthquake is the vibration of Earth, produced by the rapid release of energy.
Geotechnical Earthquake Engineering
 Geotechnical Earthquake Engineering by Dr. Deepankar Choudhury Humboldt Fellow, JSPS Fellow, BOYSCAST Fellow Professor Department of Civil Engineering IIT Bombay, Powai, Mumbai 400 076, India. Email: dc@civil.iitb.ac.in
- Information before strong ground motion -
 -Earthquake Early Warning - Information before strong ground motion - Mitsuyuki HOSHIBA Japan Meteorological Agency January 12, 2007 1 Distribution of Earthquakes Causing Tsunami (1896~2004) in Japan Distribution
Bayesian Learning Using Automatic Relevance Determination Prior with an Application to Earthquake Early Warning
 Bayesian Learning Using Automatic Relevance Determination Prior with an Application to Earthquake Early Warning Chang Kook Oh 1 ; James L. Beck 2 ; and Masumi Yamada 3 Abstract: A novel method of Bayesian
Quantifying the effect of declustering on probabilistic seismic hazard
 Proceedings of the Ninth Pacific Conference on Earthquake Engineering Building an Earthquake-Resilient Society 14-16 April, 2011, Auckland, New Zealand Quantifying the effect of declustering on probabilistic
Relevance Vector Machines for Earthquake Response Spectra
 2012 2011 American American Transactions Transactions on on Engineering Engineering & Applied Applied Sciences Sciences. American Transactions on Engineering & Applied Sciences http://tuengr.com/ateas
CHARACTERIZATION OF DIRECTIVITY EFFECTS OBSERVED DURING 1999 CHI-CHI, TAIWAN EARTHQUAKE
 th World Conference on Earthquake Engineering Vancouver, B.C., Canada August -6, 4 Paper No. 74 CHARACTERIZATION OF DIRECTIVITY EFFECTS OBSERVED DURING 999 CHI-CHI, TAIWAN EARTHQUAKE Vietanh PHUNG, Gail
Estimation of Peak Ground Acceleration for Delhi Region using Finsim, a Finite Fault Simulation Technique
 215 Estimation of Peak Ground Acceleration for Delhi Region using Finsim, a Finite Fault Simulation Technique NEELIMA SATYAM. D* and K. S. RAO** * Earthquake Engineering Research Centre, International
Short-Term Properties of Earthquake Catalogs and Models of Earthquake Source
 Bulletin of the Seismological Society of America, Vol. 94, No. 4, pp. 1207 1228, August 2004 Short-Term Properties of Earthquake Catalogs and Models of Earthquake Source by Yan Y. Kagan Abstract I review
Synergistic combination of systems for structural health monitoring and earthquake early warning for structural health prognosis and diagnosis
 Synergistic combination of systems for structural health monitoring and earthquake early warning for structural health prognosis and diagnosis Stephen Wu* a, James L. Beck* a a California Institute of
EARTHQUAKE CLUSTERS, SMALL EARTHQUAKES
 EARTHQUAKE CLUSTERS, SMALL EARTHQUAKES AND THEIR TREATMENT FOR HAZARD ESTIMATION Gary Gibson and Amy Brown RMIT University, Melbourne Seismology Research Centre, Bundoora AUTHORS Gary Gibson wrote his
Mechanics of Earthquakes and Faulting
 Mechanics of Earthquakes and Faulting Lecture 20, 30 Nov. 2017 www.geosc.psu.edu/courses/geosc508 Seismic Spectra & Earthquake Scaling laws. Seismic Spectra & Earthquake Scaling laws. Aki, Scaling law
Empirical Green s Function Analysis of the Wells, Nevada, Earthquake Source
 Nevada Bureau of Mines and Geology Special Publication 36 Empirical Green s Function Analysis of the Wells, Nevada, Earthquake Source by Mendoza, C. 1 and Hartzell S. 2 1 Centro de Geociencias, Universidad
A discriminant for P- and
 351 Appendix E S-waves A discriminant for P- and In the application of the Virtual Seismologist method, it is important to be able to distinguish between P- and S-waves. In Chapter 4, we discussed how
Some notes on processing: causal vs. acausal low-cut filters version 1.0. David M. Boore. Introduction
 File: c:\filter\notes on processing.tex Some notes on processing: causal vs. acausal low-cut filters version. David M. Boore Introduction These are some informal notes showing results of some procedures
ACCOUNTING FOR SITE EFFECTS IN PROBABILISTIC SEISMIC HAZARD ANALYSIS: OVERVIEW OF THE SCEC PHASE III REPORT
 ACCOUNTING FOR SITE EFFECTS IN PROBABILISTIC SEISMIC HAZARD ANALYSIS: OVERVIEW OF THE SCEC PHASE III REPORT Edward H FIELD 1 And SCEC PHASE III WORKING GROUP 2 SUMMARY Probabilistic seismic hazard analysis
RELATION BETWEEN RAYLEIGH WAVES AND UPLIFT OF THE SEABED DUE TO SEISMIC FAULTING
 13 th World Conference on Earthquake Engineering Vancouver, B.C., Canada August 1-6, 24 Paper No. 1359 RELATION BETWEEN RAYLEIGH WAVES AND UPLIFT OF THE SEABED DUE TO SEISMIC FAULTING Shusaku INOUE 1,
The Length to Which an Earthquake will go to Rupture. University of Nevada, Reno 89557
 The Length to Which an Earthquake will go to Rupture Steven G. Wesnousky 1 and Glenn P. Biasi 2 1 Center of Neotectonic Studies and 2 Nevada Seismological Laboratory University of Nevada, Reno 89557 Abstract
Special edition paper Development of Shinkansen Earthquake Impact Assessment System
 Development of Shinkansen Earthquake Impact Assessment System Makoto Shimamura*, Keiichi Yamamura* Assuring safety during earthquakes is a very important task for the Shinkansen because the trains operate
Short Note Source Mechanism and Rupture Directivity of the 18 May 2009 M W 4.6 Inglewood, California, Earthquake
 Bulletin of the Seismological Society of America, Vol. 100, No. 6, pp. 3269 3277, December 2010, doi: 10.1785/0120100087 Short Note Source Mechanism and Rupture Directivity of the 18 May 2009 M W 4.6 Inglewood,
Southern California Earthquake Center Collaboratory for the Study of Earthquake Predictability (CSEP) Thomas H. Jordan
 Thomas H. Jordan") Southern California Earthquake Center Collaboratory for the Study of Earthquake Predictability (CSEP) Thomas H. Jordan SCEC Director & Professor, University of Southern California 5th Joint Meeting of
Southern California Earthquake Center Collaboratory for the Study of Earthquake Predictability (CSEP) Thomas H. Jordan SCEC Director & Professor, University of Southern California 5th Joint Meeting of
Operational Earthquake Forecasting: Proposed Guidelines for Implementation
 Operational Earthquake Forecasting: Proposed Guidelines for Implementation Thomas H. Jordan Director, Southern California S33D-01, AGU Meeting 14 December 2010 Operational Earthquake Forecasting Authoritative
SURFACE WAVES AND SEISMIC RESPONSE OF LONG-PERIOD STRUCTURES
 4 th International Conference on Earthquake Geotechnical Engineering June 25-28, 2007 Paper No. 1772 SURFACE WAVES AND SEISMIC RESPONSE OF LONG-PERIOD STRUCTURES Erdal SAFAK 1 ABSTRACT During an earthquake,
Earthquakes Chapter 19
 Earthquakes Chapter 19 Does not contain complete lecture notes. What is an earthquake An earthquake is the vibration of Earth produced by the rapid release of energy Energy released radiates in all directions
I. Locations of Earthquakes. Announcements. Earthquakes Ch. 5. video Northridge, California earthquake, lecture on Chapter 5 Earthquakes!
 51-100-21 Environmental Geology Summer 2006 Tuesday & Thursday 6-9:20 p.m. Dr. Beyer Earthquakes Ch. 5 I. Locations of Earthquakes II. Earthquake Processes III. Effects of Earthquakes IV. Earthquake Risk
Historical Maximum Seismic Intensity Maps in Japan from 1586 to 2004: Construction of Database and Application. Masatoshi MIYAZAWA* and Jim MORI
 Annuals of Disas. Prev. Res. Inst., Kyoto Univ., No. 4C, 25 Historical Maximum Seismic Intensity Maps in Japan from 6 to 24: Construction of Database and Application Masatoshi MIYAZAWA* and Jim MORI *
A Closer Look At Body Wave Magnitude & Introduction To Moment Magnitude
 A Closer Look At Body Wave Magnitude & Introduction To Moment Magnitude Previously we have learned the mechanics of calculating earthquake magnitudes with several magnitude scales: Duration Magnitude,
Limitations of Earthquake Triggering Models*
 Limitations of Earthquake Triggering Models* Peter Shearer IGPP/SIO/U.C. San Diego September 16, 2009 Earthquake Research Institute * in Southern California Why do earthquakes cluster in time and space?
Geophysical Journal International
 Geophysical Journal International Geophys. J. Int. (2010) 183, 1014 1030 doi: 10.1111/j.1365-246X.2010.04774.x Probabilistic prediction of rupture length, slip and seismic ground motions for an ongoing
RELOCATION OF THE MACHAZE AND LACERDA EARTHQUAKES IN MOZAMBIQUE AND THE RUPTURE PROCESS OF THE 2006 Mw7.0 MACHAZE EARTHQUAKE
 RELOCATION OF THE MACHAZE AND LACERDA EARTHQUAKES IN MOZAMBIQUE AND THE RUPTURE PROCESS OF THE 2006 Mw7.0 MACHAZE EARTHQUAKE Paulino C. FEITIO* Supervisors: Nobuo HURUKAWA** MEE07165 Toshiaki YOKOI** ABSTRACT
Comparison of Short-Term and Time-Independent Earthquake Forecast Models for Southern California
 Bulletin of the Seismological Society of America, Vol. 96, No. 1, pp. 90 106, February 2006, doi: 10.1785/0120050067 Comparison of Short-Term and Time-Independent Earthquake Forecast Models for Southern
14 State of the Art and Progress in the Earthquake Early Warning System in Taiwan
 14 State of the Art and Progress in the Earthquake Early Warning System in Taiwan Yih-Min Wu 1, Nai-Chi Hsiao 2, William H.K. Lee 3, Ta-liang Teng 4, Tzay-Chyn Shin 2 1 Department of Geosciences, National
arxiv:physics/ v2 [physics.geo-ph] 18 Aug 2003
![arxiv:physics/ v2 [physics.geo-ph] 18 Aug 2003](/thumbs/90/101580441.jpg "arxiv:physics/ v2 [physics.geo-ph] 18 Aug 2003") Is Earthquake Triggering Driven by Small Earthquakes? arxiv:physics/0210056v2 [physics.geo-ph] 18 Aug 2003 Agnès Helmstetter Laboratoire de Géophysique Interne et Tectonophysique, Observatoire de Grenoble,
Is Earthquake Triggering Driven by Small Earthquakes? arxiv:physics/0210056v2 [physics.geo-ph] 18 Aug 2003 Agnès Helmstetter Laboratoire de Géophysique Interne et Tectonophysique, Observatoire de Grenoble,
Occurrence of negative epsilon in seismic hazard analysis deaggregation, and its impact on target spectra computation
 Occurrence of negative epsilon in seismic hazard analysis deaggregation, and its impact on target spectra computation Lynne S. Burks 1 and Jack W. Baker Department of Civil and Environmental Engineering,
Seismic Source Mechanism
 Seismic Source Mechanism Yuji Yagi (University of Tsukuba) Earthquake Earthquake is a term used to describe both failure process along a fault zone, and the resulting ground shaking and radiated seismic
Wave Dispersion in High-Rise Buildings due to Soil-Structure Interaction ABSTRACT
 Earthquake Engineering and Structural Dynamics. DOI: 10.1002/eqe.2454, Final Draft. First published online on June 23, 2014, in press Article available at: http://onlinelibrary.wiley.com/doi/10.1002/eqe.2454/abstract.
Synthetic Earthquake Ground Motions for the Design of Long Structures
 Published in Davis, C.A., X. Du, M. Miyajima, and L. Yan (Ed.) International Efforts in Lifeline Earthquake Engineering, ASCE, TCLEE Monograph 38; pp. 592-599; doi: 10.1061/9780784413234.076; Copyright
Establishment and Operation of a Regional Tsunami Warning Centre
 Establishment and Operation of a Regional Tsunami Warning Centre Dr. Charles McCreery, Director NOAA Richard H. Hagemeyer Pacific Tsunami Warning Center Ewa Beach, Hawaii USA Why A Regional Tsunami Warning
Aftershock From Wikipedia, the free encyclopedia
 Page 1 of 5 Aftershock From Wikipedia, the free encyclopedia An aftershock is a smaller earthquake that occurs after a previous large earthquake, in the same area of the main shock. If an aftershock is
Earthquakes. Earthquake Magnitudes 10/1/2013. Environmental Geology Chapter 8 Earthquakes and Related Phenomena
 Environmental Geology Chapter 8 Earthquakes and Related Phenomena Fall 2013 Northridge 1994 Kobe 1995 Mexico City 1985 China 2008 Earthquakes Earthquake Magnitudes Earthquake Magnitudes Richter Magnitude
UGRC 144 Science and Technology in Our Lives/Geohazards
 UGRC 144 Science and Technology in Our Lives/Geohazards Session 3 Understanding Earthquakes and Earthquake Hazards Lecturer: Dr. Patrick Asamoah Sakyi Department of Earth Science, UG Contact Information:
Journal of Asian Earth Sciences
 Journal of Asian Earth Sciences 7 (0) 09 8 Contents lists available at SciVerse ScienceDirect Journal of Asian Earth Sciences journal homepage: www.elsevier.com/locate/jseaes Maximum magnitudes in aftershock
Earthquake early warning: Adding societal value to regional networks and station clusters
 Earthquake early warning: Adding societal value to regional networks and station clusters Richard Allen, UC Berkeley Seismological Laboratory rallen@berkeley.edu Sustaining funding for regional seismic
Shaking Hazard Compatible Methodology for Probabilistic Assessment of Fault Displacement Hazard
 Surface Fault Displacement Hazard Workshop PEER, Berkeley, May 20-21, 2009 Shaking Hazard Compatible Methodology for Probabilistic Assessment of Fault Displacement Hazard Maria Todorovska Civil & Environmental
Coulomb stress changes due to Queensland earthquakes and the implications for seismic risk assessment
 Coulomb stress changes due to Queensland earthquakes and the implications for seismic risk assessment Abstract D. Weatherley University of Queensland Coulomb stress change analysis has been applied in
BROADBAND STRONG MOTION SIMULATION OF THE 2004 NIIGATA- KEN CHUETSU EARTHQUAKE: SOURCE AND SITE EFFECTS
 Third International Symposium on the Effects of Surface Geology on Seismic Motion Grenoble, France, 30 August - 1 September 2006 Paper Number: 105 BROADBAND STRONG MOTION SIMULATION OF THE 2004 NIIGATA-
Earthquakes. Building Earth s Surface, Part 2. Science 330 Summer What is an earthquake?
 Earthquakes Building Earth s Surface, Part 2 Science 330 Summer 2005 What is an earthquake? An earthquake is the vibration of Earth produced by the rapid release of energy Energy released radiates in all
Overview of Seismic PHSA Approaches with Emphasis on the Management of Uncertainties
 H4.SMR/1645-29 "2nd Workshop on Earthquake Engineering for Nuclear Facilities: Uncertainties in Seismic Hazard" 14-25 February 2005 Overview of Seismic PHSA Approaches with Emphasis on the Management of
A TESTABLE FIVE-YEAR FORECAST OF MODERATE AND LARGE EARTHQUAKES. Yan Y. Kagan 1,David D. Jackson 1, and Yufang Rong 2
 Printed: September 1, 2005 A TESTABLE FIVE-YEAR FORECAST OF MODERATE AND LARGE EARTHQUAKES IN SOUTHERN CALIFORNIA BASED ON SMOOTHED SEISMICITY Yan Y. Kagan 1,David D. Jackson 1, and Yufang Rong 2 1 Department
Low-Latency Earthquake Displacement Fields for Tsunami Early Warning and Rapid Response Support
 Low-Latency Earthquake Displacement Fields for Tsunami Early Warning and Rapid Response Support Hans-Peter Plag, Geoffrey Blewitt Nevada Bureau of Mines and Geology and Seismological Laboratory University
Earthquake Stress Drops in Southern California
 Earthquake Stress Drops in Southern California Peter Shearer IGPP/SIO/U.C. San Diego September 11, 2009 Earthquake Research Institute Lots of data for big earthquakes (rupture dimensions, slip history,
Joint inversion of InSAR and broadband teleseismic waveform data with ABIC: application to the 1997 Manyi, Tibet earthquake
 Joint inversion of InSAR and broadband teleseismic waveform data with ABIC: application to the 1997 Manyi, Tibet earthquake Gareth Funning 1, Yukitoshi Fukahata 2, Yuji Yagi 3 & Barry Parsons 4 1 University
Effects of Surface Geology on Seismic Motion
 4 th IASPEI / IAEE International Symposium: Effects of Surface Geology on Seismic Motion August 23 26, 2011 University of California Santa Barbara ESTIMATION OF SITE EFFECTS BASED ON RECORDED DATA AND
Magnitude 8.2 NORTHWEST OF IQUIQUE, CHILE
 An 8.2-magnitude earthquake struck off the coast of northern Chile, generating a local tsunami. The USGS reported the earthquake was centered 95 km (59 miles) northwest of Iquique at a depth of 20.1km
Widespread Ground Motion Distribution Caused by Rupture Directivity during the 2015 Gorkha, Nepal Earthquake
 Widespread Ground Motion Distribution Caused by Rupture Directivity during the 2015 Gorkha, Nepal Earthquake Kazuki Koketsu 1, Hiroe Miyake 2, Srinagesh Davuluri 3 and Soma Nath Sapkota 4 1. Corresponding
Appendix O: Gridded Seismicity Sources
 Appendix O: Gridded Seismicity Sources Peter M. Powers U.S. Geological Survey Introduction The Uniform California Earthquake Rupture Forecast, Version 3 (UCERF3) is a forecast of earthquakes that fall
Earthquake Lab Introduction: Purpose: Method: Equipment needed: Fundamental Concepts and Key Terms:
 Earthquake Lab Introduction: Seismology is that branch of the geological sciences which is concerned with the study of earthquakes. Purpose: The purpose of this exercise is to introduce some fundamental
Simulation of earthquake rupture process and strong ground motion
 Simulation of earthquake rupture process and strong ground motion Takashi Miyatake (1) and Tomohiro Inoue (2) (1) Earthquake Research Institute, University of Tokyo, Yayoi, Bunkyo, Tokyo, 113-0032, Japan
RELOCATION OF LARGE EARTHQUAKES ALONG THE PHILIPPINE FAULT ZONE AND THEIR FAULT PLANES
 RELOCATION OF LARGE EARTHQUAKES ALONG THE PHILIPPINE FAULT ZONE AND THEIR FAULT PLANES Rey M. Lumbang MEE12608 Supervisor: Nobuo Hurukawa ABSTRACT We relocated large magnitude (Mw 7.0) earthquakes that
Soil Dynamics and Earthquake Engineering
 Soil Dynamics and Earthquake Engineering 36 (2012) 32 37 Contents lists available at SciVerse ScienceDirect Soil Dynamics and Earthquake Engineering journal homepage: www.elsevier.com/locate/soildyn The
Seismic Characteristics and Energy Release of Aftershock Sequences of Two Giant Sumatran Earthquakes of 2004 and 2005
 P-168 Seismic Characteristics and Energy Release of Aftershock Sequences of Two Giant Sumatran Earthquakes of 004 and 005 R. K. Jaiswal*, Harish Naswa and Anoop Singh Oil and Natural Gas Corporation, Vadodara
Earthquakes Earth, 9th edition, Chapter 11 Key Concepts What is an earthquake? Earthquake focus and epicenter What is an earthquake?
 1 2 3 4 5 6 7 8 9 10 Earthquakes Earth, 9 th edition, Chapter 11 Key Concepts Earthquake basics. "" and locating earthquakes.. Destruction resulting from earthquakes. Predicting earthquakes. Earthquakes
STUDYING THE IMPORTANT PARAMETERS IN EARTHQUAKE SIMULATION BASED ON STOCHASTIC FINITE FAULT MODELING
 STUDYING THE IMPORTANT PARAMETERS IN EARTHQUAKE SIMULATION BASED ON STOCHASTIC FINITE FAULT MODELING H. Moghaddam 1, N. Fanaie 2* and H. Hamzehloo 1 Professor, Dept. of civil Engineering, Sharif University
Uncertainties in a probabilistic model for seismic hazard analysis in Japan
 Uncertainties in a probabilistic model for seismic hazard analysis in Japan T. Annaka* and H. Yashiro* * Tokyo Electric Power Services Co., Ltd., Japan ** The Tokio Marine and Fire Insurance Co., Ltd.,
Characteristics and introduction of Earthquake in Asia-Pacific region
 Characteristics and introduction of Earthquake in Asia-Pacific region 1906 San Francisco 2011 Tohoku 1999 Chi-Chi 1985 Mexico City 2004 Sumatra Chung-Han Chan 詹忠翰 2011 Christchurch To understand the characteristics
Figure Locations of the CWB free-field strong motion stations, the epicenter, and the surface fault of the 1999 Chi-Chi, Taiwan earthquake.
 2.2 Strong Ground Motion 2.2.1 Strong Ground Motion Network The world densest digital strong ground motion network of Taiwan with the station mesh of 3 km in the urban areas (Shin et al., 2) monitored
Module 7 SEISMIC HAZARD ANALYSIS (Lectures 33 to 36)
") Lecture 35 Topics Module 7 SEISMIC HAZARD ANALYSIS (Lectures 33 to 36) 7.4.4 Predictive Relationships 7.4.5 Temporal Uncertainty 7.4.6 Poisson Model 7.4.7 Other Models 7.4.8 Model Applicability 7.4.9 Probability
Lecture 35 Topics Module 7 SEISMIC HAZARD ANALYSIS (Lectures 33 to 36) 7.4.4 Predictive Relationships 7.4.5 Temporal Uncertainty 7.4.6 Poisson Model 7.4.7 Other Models 7.4.8 Model Applicability 7.4.9 Probability
Early magnitude and potential damage zone estimates for the great Mw 9 Tohoku-Oki earthquake
 GEOPHYSICAL RESEARCH LETTERS, VOL. 39,, doi:10.1029/2012gl053923, 2012 Early magnitude and potential damage zone estimates for the great Mw 9 Tohoku-Oki earthquake Simona Colombelli, 1 Aldo Zollo, 1 Gaetano
VALIDATION AGAINST NGA EMPIRICAL MODEL OF SIMULATED MOTIONS FOR M7.8 RUPTURE OF SAN ANDREAS FAULT
 VALIDATION AGAINST NGA EMPIRICAL MODEL OF SIMULATED MOTIONS FOR M7.8 RUPTURE OF SAN ANDREAS FAULT L.M. Star 1, J. P. Stewart 1, R.W. Graves 2 and K.W. Hudnut 3 1 Department of Civil and Environmental Engineering,
AN OVERVIEW AND GUIDELINES FOR PROBABILISTIC SEISMIC HAZARD MAPPING
 CO 2 TRACCS INTERNATIONAL WORKSHOP Bucharest, 2 September, 2012 AN OVERVIEW AND GUIDELINES FOR PROBABILISTIC SEISMIC HAZARD MAPPING M. Semih YÜCEMEN Department of Civil Engineering and Earthquake Studies
The 2016, October 26, Central Italy Earthquake Origin Time 17:10:36 UTC, M L(ISNet) =5.3; M W(ISNet) =5.6
 =5.3; M W(ISNet) =5.6") The 2016, October 26, Central Italy Earthquake Origin Time 17:10:36 UTC, M L(ISNet) =5.3; M W(ISNet) =5.6 RISSC-Lab: Laboratorio di RIcerca in Sismologia Sperimentale e Computazionale The event as seen
The 2016, October 26, Central Italy Earthquake Origin Time 17:10:36 UTC, M L(ISNet) =5.3; M W(ISNet) =5.6 RISSC-Lab: Laboratorio di RIcerca in Sismologia Sperimentale e Computazionale The event as seen
Design of Safety Monitoring and Early Warning System for Buried Pipeline Crossing Fault
 5th International Conference on Civil Engineering and Transportation (ICCET 2015) Design of Safety Monitoring and Early Warning System for Buried Pipeline Crossing Fault Wu Liu1,a, Wanggang Hou1,b *, Wentao