Flow Unit Characterization of the Early Cretaceous Missisauga Formation Using Venture B-13 Well
|
|
|
- Clara McKenzie
- 6 years ago
- Views:
Transcription

1 1 Flow Unit Characterization of the Early Cretaceous Missisauga Formation Using Venture B-13 Well Lori Manoukian Supervisor: Grant Wach Submitted in Partial Fulfillment of the Requirements for the Degree of Bachelor of Science, Honors Department of Earth Science, Dalhousie University, Halifax Nova Scotia March 2013
Iiy ( <~H\" ' j\" Htll w ) 1' 111} I ~ 4>i! L~ J'i I A), I'Jti J i I'H J;~IP i AUTHOR: TITLE: Degree: BSc.")


2 2 \UIIDALHOUSIE '\fi' UN lve RS ITY Inspiring Mi1tds Dt:fiiH'fllli.tJ!I uf l(lfrth l':iti j;jij.~> llll/ij;p. NJj,.ll)J.I)Iiy ( <~H" ' j" Htll w ) 1' 111} I ~ 4>i! L~ J'i I A), I'Jti J i I'H J;~IP i AUTHOR: TITLE: Degree: BSc. Year: 2iJJ S Permission is herewith granted to Dalhousie University to circulate and to llav11 >:ilplcj for non-commercial purposes, at its discretion, the above title upon the request of Jndi vidllilh ur institutions. THE AUTHOR RESERVES OTHER PUBLICATION RIGHTS, AND NElTl!FR 'rille THESIS NOR EXTENSIVE EXTRACTS FROM IT MAY BE PIUNTED'OR OTI IERWJSI: REPRODUCED WITHOUT THE AUTHOR'S W'fUTTEN PERMISSION. THE AUTHOR ATTESTS THA TPERMlSSfON HAS BEEN OBTAINED FOR THE USE OF ANY COPYRIGHTED MATERIAL APPEARING IN THIS THESIS (0'ITIER 'ITIAN BRIEF EXCERPTS REQUIRINGONLY PROPER ACKNOWLEDGEMENT JN SCHOLARLY WRITING) AND THAT ALL SUCH USE IS CLEARLY ACKNOWL!:::IJ(i)JJ
3 3 Table of Contents List of Figures... I List of Tables... III Acknowledgements... V Abstract... VI Chapter Introduction Problem Statement Regional Geology Stratigraphy Mobil Texaco PEX Venture B Missisauga Formation Petroleum System Elements Reservoir Seals and Traps Source Rocks and Migration Diagenesis Flow Units Chapter Lithofacies Core Description Analysis Methodology Ranking Potential Differences in Flow Units Flow Unit Strength: Influence on Preferential Flow Chapter Mobil Texaco Pex Venture B-13 Lithofacies: Thin Section Classification Lithofacies 1: Oolitic Limestone Thin section analysis of facies Lithofacies 1 Interpretation: Shallow marine, sub-tidal zone... 35
4 4 3.3 Lithofacies 2: Shale Thin section analysis of facies Burrowed Clay Lithofacies 2 Interpretation: Shallow Marine Open Shelf Lithofacies 3: Heterolithic and Cyclic Sandstone and Shales Thin section interpretation of facies Lithofacies 3 Interpretation: Tide-Influenced Nearshore Shallow Marine Shelf Deposits Lithofacies 4: Cross-Stratified Calcareous Micaceous Sandstone Thin section interpretation of facies Lithofacies 4 Interpretation: Shoreface Deposits Chapter Trace Fossils-Venture B-13 Well Cruziana Ichnofacies Skolithos Ichnofacies Summary of Trace fossils Chapter Permeability in Venture B-13 Cores TinyPermII Core Plug Permeability TinyPermII and Core Plug Permeability Porosity in Venture B Porosity vs. Permeability Chapter Results Flow units Flow Unit Strength: Influence on Preferential Flow Chapter Discussion Porosity Horizontal Permeability Porosity vs. Permeability Flow Unit Differentiation... 91
5 Flow Unit Characterization Conclusions Future Work References Appendix A: Pictures of Core Boxes Appendix B: Horizontal core plug data points Appendix C: Thin section data points
6 I List of Figures Figure 1.1 Location map of eastern North America Atlantic margin 2 Figure 1.2 Location map of Offshore Nova Scotia 3 Figure 1.3 Location map of Sable Island area and wells 3 Figure 1.4 Stratigraphic column, Scotian Basin, offshore Nova Scotia 5 Figure 1.5 Venture B-13 stratigraphic column 6 Figure 1.6 Cores of Venture B-13 tied to petrophysical data 7 Figure 1.7 Image from Mayaro Beach, Trinidad demonstrating concept of second order flow units 11 Figure 1.8 Graphical representation of flow unit scales 12 Figure 2.1 Histogram of permeability values of well Venture B Figure 2.2 Histogram of porosity values in Venture B-13 well 17 Figure 2.3 Visual representation and classification of bioturbation with increased grade & intensity 20 Figure 2.4 Chart for determining approximate modal percentages in rocks 22 Figure 2.5 Permeability values assigned to specific types of rocks 23 Figure 3.1 Folk's carbonate classification chart 29 Figure 3.2 Core photo of facies 1 oolitic limestone ( m m) 30 Figure 3.3 Crinoid shell fragments found in oolitic limestone of lithofacies 1 ( m) 30 Figure 3.4 Thin section from a depth of m 31 Figure 3.5 Thin section from a depth of m (A) and (B) 32 Figure 3.6 Thin section from a depth of depth of 4693m 32 Figure 3.7 Thin section from a depth of m 33 Figure 3.8 Thin section from a depth of m 34 Figure 3.9 Core photo of lithofacies 2 shales from interval m to m 35 Figure 3.10 Thin section photo of facies 2 offshore muds from m 37 Figure 3.11 Interlayered heterolithic sands and shales from 4732 m 39
7 II Figure 3.12 Thin section of facies 3 interbedded siltstone and intramicrite from m 40 Figure 3.13 Thin section of facies 3 interbedded siltstone and intramicrite from m 41 Figure 3.14 Oscillatory-flow cross-laminations in lithofacies 4 42 Figure 3.15 Climbing ripples 42 Figure 3.16 Fine sands with parallel shale laminaee 42 Figure 3.17 Laminaeted argillaceous sands 42 Figure 3.18 Thin section from m 45 Figure 3.19 Thin section from m 45 Figure 3.20 Thin sections from m 47 Figure 3.21 Thin section from m 49 Figure 3.22 Flexible grain deformation 49 Figure 3.23 Thin section from m 49 Figure 3.24 Thin section from m 50 Figure 3.25 Thin section from m 50 Figure 3.26 Thin section from m 51 Figure 3.27 Thin section from m 52 Figure 3.28 Thin section from m 53 Figure 4.1 Trace fossils and their respective ichnofacies and environments 55 Figure 4.2 Sands and shales from facies 3 with Planolites burrows 57 Figure 4.3 Rosselia socialis burrow of the Cruziana ichnofacies 57 Figure 4.4 Coarse grained sandstone of facies 4 with 3 cm Ophiomorpha nodosa burrow 58 Figure 5.1 TinyPermII from New England Research Inc. 61 Figure 5.2 Core 1 depth (m) vs. permeability (md) 64 Figure 5.3 Core 2 depth (m) vs. permeability (md) 65 Figure 5.4 Core 3 depth (m) vs. permeability (md) 66
8 III Figure 5.5 Core 4 depth (m) vs. permeability (md) 67 Figure 5.6 Porosity fraction of cores 1&2 plotted against well depth (m) 69 Figure 5.7 Porosity fraction of core 3 plotted against depth of well (m) 69 Figure 5.8 Porosity fraction of core 4 plotted against depth of well (m) 69 Figure 5.9 Porosity fraction versus permeability (md) through Venture B Figure 6.1 Colors assigned to flow unit strength values. 81 Figure 6.2 Core 1 description sheet 82 Figure 6.3 Core 2 description sheet 84 Figure 6.4 Core 3 description sheet 85 Figure 6.5 Core 4 description sheet 87 List of Tables Table 1.1 Cores of Venture B-13 Well 6 Table 2.1 Permeability and assigned values for flow unit differentiation 15 Table 2.2 Porosity and assigned values for flow unit differentiation 17 Table 2.3 Udenn-Wentworth grain size chart 18 Table 2.4 Grain size and assigned values for flow unit differentiation 18 Table 2.5 Change in lithofacies and assigned values for flow unit differentiation 19 Table 2.6 Variation in bioturbation and assigned values for flow unit differentiation 19 Table 2.7 Variation in cementation and assigned values for flow unit differentiation 21 Table 2.8 Flow unit characterization Integration table 22 Table 2.9 Assigned values for amount of clay for flow unit characterization 24 Table 2.10 Assigned values for amount of cement for flow unit characterization 24 Table 2.11 Assigned values for grain size for flow unit characterization 25 Table 2.12 Assigned values for bioturbation index for flow unit characterization 25 Table 2.13 Assigned values for porosity for flow unit characterization 26
9 IV Table 2.14 Flow unit strength integration 27 Table 3.1 Thin section sample list 28 Table 3.2 Paragenesis of bio-oosparite and oobiosparite 35 Table 3.3 Paragenesis of burrowed clay microlithofacies 36 Table 3.4 Paragenesis of interbedded siltstone and clay microlithofacies 40 Table 3.5 Paragenesis of fine-grained calcareous sandstone with ooid fragments 46 Table 3.6 Paragenesis of very fine- to medium-grained calcareous sandstone 46 Table 3.7 Paragenesis of fine- to coarse-grained calcareous silt 53 Table 4.1 Trace fossils of Venture B-13 and ethology 59 Table 4.2 Trace fossils, associated lithofacies and average permeability measurements 59 Table 5.1 Physical size of TinyPermII parts 61 Table 5.2 Average permeability measurements of lithofacies from core plugs and range of values 63 Table 5.3 Average permeability measurements of lithofacies from TinyPermII and range of values 63 Table 5.4 Average porosity from core plugs for each lithofacies and the number of values 69 Table 6.1 Table ranking potential differences in flow units of core 1 73 Table 6.2 Table ranking potential differences in flow units of core 2 74 Table 6.3 Table ranking potential differences in flow units of core 3 75 Table 6.4 Table ranking potential differences in flow units of core 4 76 Table 6.5 Table demonstrating strength of flow units within core 1 77 Table 6.6 Table demonstrating strength of flow units within core 2 78 Table 6.7 Table demonstrating strength of flow units within core 3 79 Table 6.8 Table demonstrating strength of flow units within core 4 80 Table 7.1 Identified lithofacies within Venture B-13 and interpreted depositional environments 93 Table 7.2 Microlithofacies in Venture B-13 and associated lithofacies 94 Table 7.3 Average porosity and permeability measurements throughout Venture B-13 94
10 V Acknowledgements My sincere gratitude towards Dr. Martin Gibling who helped me throughout this thesis with his genuine interest and constructive feedback. I also want to thank Dr. Isabelle Coutand, my first geology teacher, who with her passion and dedication to sciences captivated me, stimulating my interest and propelling me into the field of Earth Sciences. Moreover, the successful completion and personal reward of this thesis could not have been achieved without the encouragement and constant support of my family. I give special credit to my wonderful brothers who continue to inspire and motivate me throughout my academic tenure. Finally, thank you to my friends and supervisor Dr. Grant Wach.
11 VI Flow Unit Characterization of the Early Cretaceous Missisauga Formation Using Cores From The Venture B-13 Well By Lori Manoukian Abstract Reservoir characterization through the identification of flow units is an important step in resolving challenges faced in the production of oil and gas. This study investigated the vertical variations in reservoir quality and heterogeneity of the Lower Missisauga Formation, penetrated by the Venture B- 13 Well of the Sable Subbasin, offshore Nova Scotia. Core logging, thin section analysis, permeability and porosity data were used to: 1) identify lithofacies and microlithofacies within the Venture B-13 Well, 2) identify and analyse factors that lead to reservoir heterogeneity, and 3) recognize vertical permeability variations. Flow units could be defined on the basis of measurements of permeability and porosity corresponding to grain size, bioturbation, lithology, cementation, and clay content. A semi-quantitative system was designed to allow the factors to be rated relative to each other. Application allowed for detection of potential flow units and their individual strengths. The Lower Missisauga Formation at Venture B-13 corresponds to four depositional environments. Lithofacies 1 consists of oolitic limestone interpreted to be of a shallow marine sub-tidal zone. Microlithofacies subgroups of lithofacies 1 include bio-oosparite and oobiosparite. Facies 2 contains shales of an interpreted shallow marine setting. Lithofacies 3 comprises interbedded sandstone and shale of a tide-influenced nearshore shallow marine setting. Lithofacies 4 consists cross-stratified calcareous and micaceous sandstone. Its depositional environment is interpreted as a low-energy shoreface. Associated microlithofacies range from medium-grained sandstone to fine grained silt, with a slight variation in mineralogy. A steady increase in porosity and permeability values from lithofacies 1 to 4 is observed. Facies 4 micaceous sandstones have the highest potential for reservoir rocks. Fifty-six potential flow units and 48 major flow units were identified with a wide range of preferential flow values. Changes in permeability and porosity are attributed to a change in depositional environment, diagenetic processes and activity of paleo-organisms. Enhanced flow unit definition could allow for strategic drilling in order to improve long term hydrocarbon production rates. Keywords: Lower Missisauga Formation, Sable Subbasin, Offshore Nova Scotia, permeability, diagenesis, lithofacies, microlithofacies.
12 1 Chapter Introduction The study area of this project is located in the Scotian Basin, specifically the Sable Subbasin located offshore of Nova Scotia (Fig. 1.1). The Scotian Basin was a sediment depositional center during the Mesozoic and Cenozoic and is a 125 to 225 km wide continental margin (Wade & MacLean, 1990). In terms of scale, the Scotian Basin covers an area of approximately km 2 (Ings et al., 2005). Gas production by ExxonMobil's Sable Offshore Energy Project (SOEP) in the Sable Subbasin comes from five fields: Thebaud, Venture, North Triumph, South Venture, and Alma. These fields contain a significant amount of natural gas and crude oil (Mukhopadhyay et al., 2003). To date, a total of 205 wells have been drilled in the Scotian Basin: 124 exploration, 27 delineation, 51 production, and 5 exploration / development or other types (CNSOPB, 2013). Although approximately 75% of the original gas-in-place reserves discovered offshore Nova Scotia are within the Missisauga Formation (Canada Nova Scotia Offshore Petroleum Board, 2013), only a few researchers have studied its sedimentology in great detail (eg. Cummings & Arnott, 2005). This thesis will discuss and examine the contributing factors to fluid flow characterisation and flow strength within the Lower Missisauga Formation. Evaluation criteria to conduct this analysis include grain size, permeability, bioturbation and cementation. Following a geological overview of the Scotian Shelf and Sable Subbasin (Chapter 1), critical examination of the hydrocarbon reservoir characteristics, methodology for flow unit analysis is thoroughly explained (Chapter 2). Core lithofacies and thin section microlithofacies are identified (Chapter 3), trace fossils and individual abundance are analysed (Chapter 4) and this information is used in identification and classification of flow units within the Missisauga Formation (Chapter 5).

13 2 1.2 Problem Statement Since 2009, gas production from the five SOEP fields has been in continuous decline (Canada Nova Scotia Offshore Petroleum Board, 2013). This thesis specifically analyses and critically assesses the Lower Missisauga Formation at well Venture B-13 to highlight and resolves fundamental limitations in the conventional permeability modeling workflow. Core and thin sections from Venture B-13 are analysed to thoroughly define and characterise flow units providing details about reservoir characteristics and the depositional environment. This study further serves to develop best practices for future projects in the areas of high resolution reservoir modeling of the greater Scotian Basin. 1.3 Regional Geology The Scotian Basin demonstrates distinctive geology that is a product of tectonic cyclicity. Extensional faulting in this region was the result of the rifting that separated Africa from North America during the breakup of Pangea (Sable Offshore Energy, 1996). This rifting was initiated approximately 225 million years ago when the region of Nova Scotia bordered present day Morocco. Prior to the breakup of supercontinent Pangea, Nova Scotia was located at ~15 N in a semi-arid, subtropical to humid climate (Kidston et al., 2005). Figure 1.1. Map of the continental margin of northeastern United States and Atlantic Canada showing location of Sable Island (Sable Offshore Energy, 1996).

. Figure 1.2.")
14 3 Within the Scotian Basin, ridge and platform tectonic elements define the subsidiary subbasins and grabens; e.g. La Have and Banquereau platforms, Orpheus Graben, and the Sable, Shelburne, Abenaki and Laurentian subbasins (CNSOPB, 2013).Interestingly, the boundaries of these subbasins are thought to be rooted in oceanic fracture zones (Welsink et al., 1990). Figure 1.2. Location map for the central Scotian Shelf, offshore Nova Scotia. Figure 1.3. Map of Sable Island area showing the location of the ExxonMobil 3D seismic Megamerge, Venture B-13 and surrounding wells.
15 4 1.4 Stratigraphy Stratigraphic units of the Scotian Basin were first defined by McIver (1972). Minor changes were made to the regional stratigraphy in 1975 and 1995 by Jansa and Wade (1975), Wade and MacLean (1990) and Wade et al., (1995). Cambro-Ordovician metamorphosed sediments, as well as Devonian granites form the basement of the Scotian Shelf and Mesozoic-Cenozoic sediments compose the cover (Sable Offshore Energy, 1996). The Argo and Eurydice formations were deposited during Late Triassic to Early Jurassic and comprise mainly evaporites and siliciclastic strata. Following continental breakup, rift grabens that formed during the synrift of the Upper Triassic were subsequently filled with continental clastics of the Mohican Formation and dolomites of the Iroquois Formation (Wade and MacLean, 1990). The Middle to Late Jurassic Abenaki Formation was deposited when marine conditions were predominant in the southwest margin and comprises reefal and platformal carbonates and shales. During the post-breakup stage, the Late Jurassic to Early Cretaceous Mic Mac, Missisauga and Logan Canyon formations were deposited as a progradational sequence (Wade and MacLean, 1990). The Mic Mac Formation is representative of the first phase of the delta progradation. Distributary channels and delta front sands interfinger with the Verrill Canyon Shales (Kidston et al., 2005). The "O" Marker is a regional seismic marker of variable thickness (up to 122 metres) composed of a series of shallow water oolitic limestones and calcareous sandstones (CNSOPB, 2013). It is found within the Missisauga Formation and is relatively continuous throughout the basin, pinching out towards the northwest. The Late Cretaceous Dawson Canyon Formation shales and limestones are overlain by the Wyandot Formation which consists of limestone with chalk intervals. The marine shelf mudstones, shelf sands and conglomerates forming the Banquereau Formation later covered the Wyandot Formation.

16 5 Age NW Lithology SE Major Lithofacies Figure 1.4. Stratigraphic chart of offshore Nova Scotia showing lithological units from NW to SE. Progradation, aggradation and retrogradation of units may be observed (Fensome et al., 2008).
17 6 1.5 Mobil Texaco PEX Venture B-13 Mobil Texaco PEX Venture B-13 was operated by Mobil Oil Limited and is located northnorthwest of Sable Island at coordinates N and W. Drilling began in August 1980 and the well was plugged and abandoned in February The total driller s depth reached was 5368 m and total logger s depth reached 5227m. Four conventional cores were cut in the Missisauga Formation (details in Table 1.1) and stored in Calgary and at the Canada Nova Scotia Offshore Petroleum Board's Geoscience Research Centre in Dartmouth, Nova Scotia. Depth Recovered Core # m 17.3m Core # m 5.8m Core # m 18.0m Core # m 18.3m Table 1.1 Cores of Venture B-13 Well Figure 1.5. Formation depths in the Venture B-13 well. Core locations are indicated by the blue circles (Sable Offshore Energy, 1996).

18 7
19 8 1.6 Missisauga Formation As previously mentioned, the Sable Subbasin is a Mesozoic to Cenozoic depositional center that is part of a passive-margin basin offshore Nova Scotia (Wade, 1991). The Venture Field is found in a rollover anticline that was formed by syndepositional listric growth faults within this basin (Wade, 1991). Named after the North American Native tribe Mississauga, the Kimmeridgian to Barremian Missisauga Formation is bounded by bounded below and above by the Mic Mac and Logan Canyon formations respectively and interfingers with the Verrill Canyon (Wade, 1991). The Missisauga Formation comprises upper, middle and lower members (Wade, 1991). The Lower Missisauga Formation is analysed in detail in this thesis. The lower member contains the reservoir sands of the Venture Field and ranges from the shale beds to limestone beds of the MicMac Formation. The middle member ranges from the base of the O Marker to the top of Berriasian-Valanginian shales and the upper member ranges from the top of the formation to the base of the O marker. The main gas reservoirs are found between 4406 m to 5101 m (Karim et al., 2011). The deeper reservoirs are known to be overpressured. The O Marker is representative of a succession of Hauterivian-Barremian limestones and calcareous shales(wade, 1991). It is generally found at a depth of 300 m from the top of the Missisauga Formation and is about 46 m thick. In the Sable Subbasin, over 2270 meters of the Missisauga Formation have been drilled in about 200 wells. The Missisauga Formation is represented by a succession of argillaceous sandstones that are separated by shale and siltstone beds deposited in a deltaic depositional sequence (Williams et al., 1985) at the terminus of a river system drained the northeastern part of the Canadian Shield (Wade, 1991). 1.7 Petroleum System Elements Reservoir The main gas reservoirs of the Sable Delta complex are within the Mic Mac and Missisauga Formations. This research focuses on the Lower Mississauga Formation. The sands of the Mic Mac and
20 9 Missisauga formations were deposited in a delta that prograded towards the south (Sable Offshore Energy, 1996). With change in sediment supply and direction, and relative sea level, the Sable Delta complex varied in morphology, and advanced and retreated numerous times. The reservoirs show coarsening-upward successions (Sable Offshore Energy, 1996) Seals and Traps The seals present in the petroleum system are Late Jurassic shales of the Mic Mac Formation, Cretaceous Naskapi Member/Logan Canyon formations and the Tertiary Banquereau Formation. Syndepositional listric growth faults are present throughout the Sable Subbasin creating rollover anticlinal traps. These syndepositional growth faults were created after deposition of the Mic Mac and Missisauga formations increasing sediment loading Source Rocks and Migration The source rocks of this region are identified as the Verrill Canyon Shales (Sable Offshore Energy, 1996). As observed on the stratigraphic chart (Fig. 1.4), these shales occur in a more distal marine setting to the proximal and coeval Missisauga and Mic Mac formations (Sable Offshore Energy, 1996). The Verrill Canyon Shales have low total organic content (TOC) values (average ~1.0%), are gas and condensate-prone and are Type III source rocks (Mukhopahyay & Brown, 2003). These source rocks contain terrestrially-derived organic matter deposited in a slightly anoxic environment (Mukhopahyay & Brown, 2003). Deep reservoirs of the Thebaud, Venture and South Venture are overpressured (Sable Offshore Energy, 1996). Previous research suggests that there have been three stages of hydrocarbon generation and migration at Ma, Ma, and Ma (Sable Offshore Energy, 1996). 1.8 Diagenesis Diagenesis is defined as the chemical, physical or biological post-depositional change that sediments undergo at low temperatures and pressures as a result of burial and compaction (Boggs, 2006). Porosity values decrease as a result of diagenesis and some minerals may be dissolved. In effect,
21 10 silica overgrowths on detrital quartz grains are present throughout the Venture Field, except where chlorite rims are present (Karim et al., 2009). Sandstones and siltstones of the lower Missisauga Formation have been subjected to variable degrees of diagenesis with pores filled with illite, chlorite and carbonates reducing their original porosity and permeability. The process of compaction, cementation and dissolution of the original rock fabric degraded the horizontal and vertical variations in reservoir quality of the Lower Missisauga Formation. The products of physical and chemical changes related to diagenesis were analysed for nine wells and studies have determined the influence of cements and framework minerals on reservoir rocks (Karim et al., 2009). They suggested, by linking the distribution of diagenetic minerals to depositional facies and sequence stratigraphy researchers can predict the spatial and temporal evolution of diagenetic minerals in reservoir rocks and concluded that depositional lithofacies, sea-level changes, chemistry of basinal sediments and fluid flux during burial were influencing factors of diagenesis for offshore Nova Scotia (Karim et a.l, 2009). This research and analysis was conducted with the use of optical petrography, back-scattered electron images and the electron microprobe. Higher porosity intervals were determined to be directly related to the formation of chlorite rims, specifically in the Missisauga Formation because they prevent silica overgrowths (Jansa & Noguera, 1990). Lower porosity in reservoirs is related to cementation by quartz, kaolinite or carbonates. In the Sable Subbasin, siderite is abundant in carbonates and is common in prodelta facies due to the high amount of iron released when ilmenite is broken down (Karim et al., 2009). Interestingly, in certain locations siderite has contributed to the increase in porosity because it has been dissolved as a result of diagenesis. However, the presence of Fe-rich carbonates prevents the formation of quartz overgrowths during early diagenesis and may be related to transgressive systems tracts (Karim et al., 2009).
. A flow unit is a rock volume with identifiable fluid flow characteristics that can be modeled (Schlumberger, 2013).")
22 Flow Units Second order flow units Figure 1.7. Image from Mayaro Beach, Trinidad demonstrating concept of second order, outcrop scale flow units. A clear change in lithology is observed (Modified from Wach et al., 2007). A flow unit is a rock volume with identifiable fluid flow characteristics that can be modeled (Schlumberger, 2013). In other words, flow units are volumes of rock that are internally consistent yet predictably different from properties of other rock volumes. A difference in grain size, permeability, porosity, mineralogy and bioturbation is observed between flow units of a reservoir. For example, the image along Mayaro Beach in Trinidad of delta front and prodelta sediments of the Pliocene Mayaro Formation illustrate (Fig. 1.7) outcrop-scale flow units that show a clear change in grain size, permeability and lithology (Wach et al., 2007). Flow units are primarily analysed on a scale of a few decimeters to meters (core) and are supplemented with an understanding on a much finer millimetre scale, based on thin sections analysis.
23 Figure 1.8. Graphical representation of flow unit scale resolution. Second order and third order flow units will be analysed in this research. Petrophysical data is not analysed in this thesis. 12
24 13 Chapter Lithofacies A facies is described by Reading (1978) as a body of rock with specified characteristics such as colour, bedding, composition, sedimentary structures and fossil assemblage. A geologist must define lithofacies objectively based on physical lithological evidence and features that may be measured (Reading, 1978). No concrete rules exist for the selection of lithofacies since variation occurs for all sets of rocks and boundaries; however, each lithofacies must be defined objectively on observable and measurable features. For this thesis, lithofacies were defined within Venture B-13 through core description and interpretations of depositional environments were made. 2.2 Core Description Analysis Approximately 57.3 m of core were described at the Canada Nova Scotia Petroleum Board Geoscience Data Centre in Dartmouth, Nova Scotia. Sedimentary structures, ichnofacies, lithofacies and potential flow units were identified. Detailed photographs of core were taken and Corel Draw was used to create a graphic interpretation of the core description. Numerous steps are required to carry out a thorough description of the cores in order to identify lithofacies and define a depositional environment. Once physical and biogenic sedimentary structures, surfaces, grain size, and lithology were described, lithofacies were assigned to specific intervals of strata (Reading, 1978). Well-log data, seismic data and trace fossils may be used to define and assign a depositional environment to the lithofacies. Retrogradational, progradational or aggradational parasequences may be identified to aid in the prediction of the distribution of depositional environments. 2.3 Methodology Flow units are defined as volumes of rock that are internally consistent yet predictably different from surrounding rocks (Shepherd, 2009). Reservoir properties that influence flow units include grain
25 14 size, porosity, permeability, and lithology. In this section, the importance of each component will be discussed with regards to their influence on identification and quality of flow units. This approach to understanding flow units was developed for this research as data were collected and evaluated. It became apparent that flow units could be defined on the basis of measurements of permeability and porosity corresponding to grain size, bioturbation, lithology, cementation, and clay content. These data were available for specific log intervals that were assigned to sedimentological lithofacies identified in the cores. However, in order to understand more fully the relative contributions of numerous factors to potential fluid flow, a semi-quantitative system was designed to allow the factors to be rated relative to each other. The numerical system set out below for the Lower Missisauga Formation is relative, based on analysis of the available data for each factor. Specifically, this methodology is separated into two parts. The first part identifies potential flow units and their associated depths, and the second critically evaluates the flow potential of each unit. Values were assigned to intervals typically of 0.92m thickness. Working upward through the core data allows intervals with strong potential changes in flow character to be identified and understood. The method also allows the thickness of flow units to be assessed Ranking Potential Differences in Flow Units The following section explains how grain size, permeability, porosity, clay content, cementation and bioturbation data were key in understanding how to differentiate flow units. These data were assigned values relative to their impact on change of flow unit. Summing these scores, a relative ranking of flow units was created. This number indicated the relative probability of having different flow units in a specific section of the well based on the top and lower boundary. It does not rank the ability of fluid to flow in each flow unit.
26 Frequency Permeability Permeability is the key factor affecting movement of fluids through a volume of rock. For this thesis, permeability was measured with TinyPermII and values of core plug permeability data from previous Venture B-13 core analyses (Venture B-13 Well History Report, CNSOPB Data Management Centre). A histogram was created demonstrating the frequency of core plug permeability values of the Lower Missisauga Formation within Venture B-13 (Fig. 2.1). Ranges assigned to Amount of variation in permeability in Table 2.1 were chosen from this histogram (Fig. 2.1). Units were assigned values relative to the change of permeability they display. The assigned permeability values for the overlying and underlying rock volumes were added to give a value for a specific volume of rock. A unit showing >50mD difference in permeability with overlaying and underlying units received a value of Permeability Values Venture B to to to to to to to to to to to 350 Permeability intervals (md) Figure 2.1. Histogram of permeability values of well Venture B-13.
27 16 PERMEABILITY Assigned value Amount of variation in permeability 0 No variation in permeability 1 Difference of 0.01 to 0.51 md between potential flow units 2 Difference of 1 to 10 md between potential flow units 3 Difference of md between potential flow units 4 Difference of >50 md between potential flow units Table 2.1. Permeability and assigned values for flow unit differentiation Porosity Porosity is the void space in a volume of rock and is measured by dividing the volume of void space V V by the total volume of material (V t ): Φ=V V /V t Porosity can be described as primary, secondary, intergranular, intragranular. Intergranular porosity means there is porosity between grains whereas intragranular porosity defines porosity inside sedimentary grains (Ramm & Bjorlykke, 1993). Primary porosity is the original pore space created during deposition. Secondary porosity is pore space formed as a result of dissolution or fracturing (Ramm & Bjorlykke, 1993). However, porosity observed in this research was primary intergranular and secondary intergranular and intragranular. Variation of porosity in a vertical section is representative of different flow units. A histogram was created demonstrating the frequency of porosity values of the Lower Missisauga Formation within Venture B-13 (Fig. 2.2). These values were then used in assigning values for the ranges in Table 2.2. Volumes of rock that show great amounts of variation in porosity were assigned higher values than rocks that show little variation in porosity. The assigned porosity values for the overlying and underlying rock volumes were added to give a maximum value of 8 for a specific unit.
28 Frequency Porosity Values Venture B Porosity Fraction Figure 2.2. Histogram of porosity values in Venture B-13 well. Assigned value POROSITY Amount of variation in porosity 0 No variation in porosity 1 Difference of 1 to 5 % between potential flow units 2 Difference of 5.1 to 10% between potential flow units 3 Difference of 11 to 20% between potential flow units 4 Difference of 21 to 30% and above between potential flow units Table 2.2. Porosity and assigned values for flow unit differentiation Grain Size Grain size and permeability are normally correlated (Boggs, 2006). An increased grain size is equivalent to an increase in permeability when cementation is not involved (Boggs, 2006). Moreover, a change in grain size and permeability in the reservoir is indicative of change in flow unit. A greater grain size or permeability value will yield better flow units. Grain sizes distribution was analysed throughout
29 18 the Lower Missisauga Formation of Venture B-13 well and were compared against rock type classifications (Table 2.3). Table 2.3. Udenn-Wentworth grain size chart showing ranges in grain size and associated rock types (Modified from Boggs, 2006). Values from 0 to 4 were assigned to volumes of rock relative to the amount of grain size change with bordering units. A higher value is indicative of evident change of grain size from one unit to another (Table 2.4). A value of 0 is indicative of similar grain size from unit to another. The assigned grain size values for the overlying and underlying rock volumes were both added to give a value for a specific volume of rock. Therefore, a flow unit could be assigned a minimum value of 0 and a maximum of 8
30 19 Assigned value Grain size Amount of variation in size class 0 Same grain size (top and bottom lithology) 1 Change in one size class 2 Change in two size classes 3 Change in three size classes 4 Change in four or more size classes Table 2.4. Grain size and assigned values for flow unit differentiation Lithofacies Since the Lower Missisauga Formation is not homogeneous, changes in lithologies must be annotated. The assigned change in lithofacies values for the overlying and underlying rocks were added to give a maximum value of 8 for a specific unit. Lithofacies of Venture B-13 will be further discussed in Chapter 3. Assigned value Change in lithofacies Lithofacies 0 Recurring lithofacies between potential flow units 2 Different lithofacies below, same lithofacies on top or vice versa 4 Clear change in lithofacies between potential flow units Table 2.5. Change in lithofacies and assigned values for flow unit differentiation Bioturbation The bioturbation index (BI) (Fig. 2.3) was used to characterize the influence of bioturbation on potential flow units. Degree of variation of bioturbation between potential flow units was assigned values with higher numbers indicating an increasing change in bioturbation. The assigned bioturbation values for the overlying and underlying rock volumes were added to give a maximum value of 8 for a
31 20 specific volume of rock. An increased intensity of bioturbation mixes sand and mud laminaee, thus bringing finer matrix into coarser beds and reducing porosity. Assigned value Bioturbation Bioturbation 0 No variation in bioturbation 1 Difference of 1 BI between potential flow units 2 Difference of 2 BI between potential flow units 3 Difference of 3 BI between potential flow units 4 Difference of 4 BI between potential flow units Table 2.6. Variation in bioturbation and assigned values for flow unit differentiation. Figure 2.3. Visual representation and classification bioturbation with increased grade and intensity (Modified from Pearson & Gingras, 2006).
32 Cementation Cementation, a diagenetic process, involves the chemical precipitation of ions forming new crystalline material between grains (Boggs, 2006), thereby lowering porosity and degrading flow units reservoir properties. Variability of cementation leads to varying zones of permeability. Cementation ranges were picked on the basis of average cementation values in thin sections (Chapter 3).The assigned cementation values for the overlying and underlying rock volumes were added to give a maximum value for a specific volume of rock. Assigned value Cementation Variation in cement percentage 0 No variation in percentage of cement between potential flow units % variation of cement between potential flow units % variation of cement between potential flow units % variation of cement between potential flow units 4 31% variation of cement between potential flow units Table 2.7. Variation in cementation and assigned values for flow unit differentiation Estimating Percentages Throughout thin section analysis, mineral, porosity and cementation percentages were estimated with the use of the following chart (Fig. 2.4).

33 22 Figure 2.4. Chart for determining approximate modal percentages in rocks. (Terry et al., 1955) Ranking values Once values were assigned for changes in lithology, grain size, permeability, cementation, porosity and bioturbation, they were summed to give a value indicative of the relative ranking of a flow unit (Table 2.8). Values close to 48 are indicative definite change in flow units, whereas those closer to 0 indicate that there is no change of flow units with given depth change. Depth Lithology Grain Size Porosity Permeability Cementation Bioturbation Rel. Ranking of flow unit out of 48 Top Bottom Table 2.8. Tabulation of flow unit ranking parameters used for the differentiation of flow units.

34 Flow Unit Strength: Influence on Preferential Flow The following section explains how the interrelationships between grain size, permeability, porosity, clay content, cementation and bioturbation data are keys to understanding the strength of flow units. Flow unit strength is mainly controlled by permeability which is most accurately measured by core plugs. For a total of 57.3 m of core, 42 core plug permeability measurements were taken. This subject is further discussed in Chapter 5. Generally, large grain size, high porosity, low bioturbation, low clay content and low cementation contribute to high permeability values and an increased flow potential. For this research, it was assumed that all these criteria equally contributed in equal parts to permeability variation. Therefore all criteria were assigned a maximum value of 4. Oil reservoir rocks have permeability measurements from 100 to 10,000 md, other sandstones have permeability measurements from 1 to 10 md and limestones 0.01 to 0.1mD (Bjorlykke, 1993). Figure 2.5. Permeability values assigned to specific types of rocks (Modified from Geomore, 2012). Areas of higher and lower permeability are identified throughout Venture B-13 core indicative of excellent to poor quality flow units. Barriers to flow include interbedded shales and stylolitic horizons. Clay content, cementation, grain size and bioturbation were analysed to understand the degree of difference between adjacent rock volumes. Permeability values were compared to values of other parameters in order to determine why differences in flow potential exist.
35 Clay Content Authigenic and detrital clays in the Missisauga Formation have contributed to the reduction of primary porosity (Karim et al., 2009). Clay minerals identified in thin section include chlorite, muscovite, biotite. Research by Jansa and Noguera (1990) states that kaolinite is also present; however, this was not observed in thin section. A rock with 100% clay content will be a very poor flow unit and a rock with no clay will likely be a good flow unit. Since a maximum value of 4 and a minimum value of 0 can be assigned to clay content, ranges were subdivided into five groups (Table 2.9). A higher amount of clay corresponds to a lower assigned value. Clay content Assigned value Amount of clay 0 100%-80% 1 80%-60% 2 60%-40% 3 40%-20% 4 20%-0% Table 2.9. Assigned value for amount of clay for flow unit characterization Cementation Increased cementation decreases porosity and permeability. Low percentages of cementation are assigned higher values. A rock with 100% cementation will be a very poor flow unit and a rock with no cementation will be a good flow unit. Since a maximum value of 4 and a minimum value of 0 can be assigned to cementation, ranges were subdivided into five groups (Table 2.10).
36 25 Cementation Assigned value Amount of cementation 0 100%-80% 1 80%-60% 2 60%-40% 3 40%-20% 4 20%-0% Table Assigned values for amount of cement for flow unit characterization Grain Size An increase in grain size leads to increased permeability. Finer particles are assigned lower values than coarser particles. Assigned value Grain Size Grain size 0 Clay 1 Fine silt- coarse silt 2 Fine sand 3 Medium sand 4 Coarse sand Table Assigned values for grain size for flow unit characterization Bioturbation In marine sedimentary rocks, three-dimensional burrow connectivity can increase the amount of fluid-flow pathways through rock (LaCroix et al., 2012). However, analysis of Venture B-13 cores has demonstrated that bioturbation has decreased permeability as a result of sediment mixing. As such, a higher bioturbation index has a lower assigned value.
37 26 Bioturbation Assigned value Bioturbation index (BI) Table Assigned values for bioturbation index for flow unit characterization Porosity Increased porosity in a volume of rock accompanied by high permeability, leads to an increased amount of preferential flow through the unit. Reservoir rock porosity values range from 5-40% (Ramm & Bjorlykke, 1993). Values between 0-5% are considered insignificant, 5-10% poor, 10-15% fair, 15-20% good and porosity values above 20% are considered excellent (Hyne, 2001). Porosity Assigned value Percentage of Porosity Rank 0 0-5% Insignificant % Poor % Fair % Good 4 >20% Excellent Table Assigned values for porosity for flow unit characterization Ranking Flow Unit Strength Once values were assigned for grain size, clay content, bioturbation and cementation, these values were summed to represent the strength of a flow unit. These numbers were then compared to permeability values (Table 2.14).
38 27 Flow units Top Bottom Permeability Grain Size Porosity Clay Content Bioturbation Cementation Ability to flow within unit Table Tabulation of flow unit ranking parameters used for the differentiation of flow units. Flow unit strength criteria are assigned values, summed, and given a value out of 20 that represents their strength as a flow unit. These numbers were then compared to average permeability value of lithofacies. For this reason, ability to flow within unit and permability values were highlighted in red. The objective of this research is to determine whether the permeability values correlate with quantified flow unit strengths.
39 28 Chapter Mobil Texaco Pex Venture B-13 Lithofacies: This study integrates core descriptions (57.3 m), thin section analysis (21 thin sections) and paleontological data (details in Chapter 4). Venture B-13 well core was described in ~3cm detail, four specific lithofacies were identified characteristic of various depositional settings, and sedimentary textures and trace fossils were noted. Thin section analysis allowed a better understanding of mineralogical composition of lithofacies and diagenesis. Photos of characteristic features in thin sections were taken under plain-polarized and cross-polarized light. Table 3.1 provides details on each available thin section studied. Thin sections have a width of approximately 3 mm, are unstained but are impregnated with orange epoxy to highlight porosity. The following section will qualitatively analyse identified lithofacies and associated microlithofacies in cores from the Venture B-13 well. Sample Core Depth (m) Table 3.1. Thin section sample list.

40 Thin Section Classification The lithofacies identified from core analysis overlook certain characteristic microscopic features. As such, thin sections descriptions identifying microscopic features supplemented core descriptions and gave rise to microlithofacies assemblages discussed in the following section. Folk s classification (Boggs, 2006) for limestones was used in naming carbonate lithofacies. Where two or more of the constituents that form the basis for Folk s classification were used, names were combined. For example, if both intraclasts (70%) and ooids (30%) are present with sparite, the lithology will be called an intra-oosparite. Figure 3.1. Folk's classification chart (Modified from Boggs, 2006) 3.2 Lithofacies 1: Oolitic Limestone This lithofacies is composed of black, grey and dark brown oolitic limestone. Rounded ooids of calcium carbonate are the dominant feature of facies 1. Nuclei of ooids are upper to lower coarse grain size quartz or shell fragments. Intergranular calcite, small amounts of detrital chlorite, and traces of intergranular porosity are present. As such, there is a strong to medium reaction with hydrochloric acid. Crinoids, shell fragments and laminaee are found throughout this facies.
 spines are evident as well. 3.2.1")
, shell fragments (25-27%), mud (3-14%), intragranular micritic(minor) and sparry calcite (15-35%), quartz (13-20%), chlorite (0-2%), framboidal")
41 30 Figure 3.2. Core photo of lithofacies 1 oolitic limestone at a depth of m to approximately m. Figure 3.3. Crinoid (Cr) shell fragments found in oolitic limestone layer (lithofacies 1) in Venture B-13 at a depth of m. The core in this photo has been sprayed with water to make the shell fragments more evident. Echinoderm (Ec) spines are evident as well Thin section analysis of facies Bio-oosparite Thin sections from Core 1 from sample points m, 4693 m, m, 4698 m. This is a sedimentary rock that contains ooids (20%), shell fragments (25-27%), mud (3-14%), intragranular micritic(minor) and sparry calcite (15-35%), quartz (13-20%), chlorite (0-2%), framboidal pyrite (2%), and muscovite (0-2%). Composition and ooid size is slightly variable throughout four thin sections. Calcite cement totals about 15-30% representing the original volume of porosity before cementation. Rounded to subrounded ooids are the dominant features of this microlithofacies. Concentric layering is evident in most ooids that are typically 1-2mm in diameter and are cemented with sparry
. Nuclei of ooids are composed of quartz or bioclastic fragments.")
42 31 calcite. About 1% of the ooids display radial features yet have maintained relict concentric layering. This is likely isopachous cementation which is representative of a seafloor diagenetic environment (Boggs, 2006). Nuclei of ooids are composed of quartz or bioclastic fragments. Different shell fragments include pelmatozoans, crinoids, foraminifera, bivalves and bryozoans. Degree of packing varies throughout the thin section as some areas are grain-supported, whereas others are matrix-supported. Sparite cement shows two phases of formation. The finer-sized phase formed first around ooids, minerals and bioclasts, and a later coarser phase formed within particle voids. A minimal amount of micrite matrix is also present. Intergranular voids that were filled with mud at an earlier stage were not affected by the carbonate infill. Patchy replacement of some fossils by botryoidal or blocky calcite is evident. Figure 3.4. Sample 1 (Core 1, m) under plain-polarized light. Foraminifera (F) is identified as a nucleus of ooid creating intragranular porosity. Quartz grains show evidence for compaction as they indent into ooids. Micritic muds present between grains. Detrital chlorite grains(c) on the bottom right of the photo show ductile deformation as a result of compaction. Ooids were dissolved as a result of diagenesis but quartz grains were not. Evidence for sediment compaction is observed where quartz grains indent into the ooids. Stylolites, which are carbonate dissolution features, are evident throughout the sample. Minimal grain distortion of platy

43 32 minerals (chlorite, muscovite) was also observed. Dark micritic rims or envelopes around fossils fragments and some detrital quartz are results of fine micrite and siderite packing around the grains. Lastly, framboidal pyrite, an early diagenetic mineral commonly occurring in anaerobic marine sediments, was abundant in thin sections (Boggs, 2006). It is a product of microbial reduction within shallow buried sediments. Figure 3.5. Photo of thin section under plain-polarized light (A) and cross-polarized light (B) of Sample 4 (Core 1, m). Carbonate ooids with quartz nucleus(q) and shelly fragments are characteristic of lithofacies 1. A set of stylolites, indicative of dissolution after lithification, are identified between two blue dashed lines. Black arrows point at partially dissolved ooids.
 shows evident crinoid and bivalve shell fragments and")
 under plainpolarized light. Bryozoan, bivalve and other unidentifiable shell fragments are observed.")
44 33 500µm Figure 3.6. Thin section under plain-polarized of Sample 2 (Core 1, 4693 m) shows evident crinoid and bivalve shell fragments and intergranular sparry cement. Quartz grains and shell fragments are enclosed in a thin layer of Fe-rich muds. Figure 3.7. Sample 4 (Core 1, m) under plainpolarized light. Bryozoan, bivalve and other unidentifiable shell fragments are observed. Microscopic stylolites, dissolved ooids and quartz grains indenting into ooids serve as evidence of middiagenetic stage of sample. 2mm

45 Oobiosparite Thin sections from Core 1 from sample points m and m Thin sections representative of oobiosparite lithofacies have similar textures, features and paragenesis as bio-oosparite microlithofacies; however, the ooid to bioclast ratio is higher. These two thin section are composed of muscovite and biotite (5%), pyrite (5%), quartz(20-40%), ooids(20-40%), sparry intragranular calcite(25%), and bioclasts(5%).the quartz grains forming the nucleus of ooids in these thin sections are slightly larger than the bio-oosparite nuclei. 2mm Figure 3.8. Thin section from a depth of m under plane-polarized light. A bivalve shell is surrounded by <1mm quartz grains that are enclosed by Fe-rich muds as a result of compaction. Sparry cement has infilled the original pore space. Lastly, the original fabric of the bivalve has been replaced by sparry carbonate.

46 35 Time Paragenesis 1 Deposition of sediments and organism shells and ooid formation as a result of suitable water chemistry and environmental factors 2 Primary minor carbonate cemention 3 Formation of pyrite in reducing environment 4 Physical compaction, where grain packing occurs and porosity is reduced 5 Chemical compaction, partial dissolution of ooids and shell fragments and creation of stylolites 6 Secondary precipitation of carbonate cement between pore spaces 7 Mineral replacement of some shell fragments and quartz nuclei by botryoidal or blocky calcite. Table 3.2. Diagenetic history of bio-oosparite and oobiosparite microlithofacies. After deposition of sediments and shells, minor early cements (carbonate and pyrite) were formed. Chemical compaction followed physical compaction. Secondary precipitation of carbonate cements and mineral replacements are representative of later stages of diagenesis Lithofacies 1 Interpretation: Shallow marine, sub-tidal zone The depositional environment of this lithofacies is a shallow marine, agitated and probably tide dominated setting. Shell fragments or small quartz grains form a nucleus for growth of ooids. When currents start to wash the nucleus back and forth, precipitated calcite accumulates on the nucleus in a concentric fashion. The shallow tidal zone is always submerged by water except during low tide (Boggs, 2006). As such, various organisms such as crinoids and other metazoans are able to thrive in this type of setting. 3.3 Lithofacies 2: Shale This facies comprises fissile and micaceous black to dark grey shale. Bioturbation caused mainly by Planolites and Thalassinoides, and burrows are filled with fine upper and fine lower grey calcareous sands. Bioturbation index varies from 0 to 3 throughout this facies. Muddy linings of these trace fossils are approximately 1 to 2 mm thick. The siltstone does not always react with hydrochloric acid. Bedding surfaces were not clearly identifiable. These muds have parallel layers with surfaces variably at angles of 0-5, indicative of depositional dips. Sedimentary structures were not observed within this facies. This facies occurs in thinner intervals than the other lithofacies. Figure 3.9. Core photo from Venture B-13 well showing lithofacies 2 shale between m to m.
47 Thin section analysis of facies Burrowed Shale Thin section from Core 1 from sample m This microlithofacies is comprised solely of microscopic clay grains (<0.062mm) and demonstrates minimal bioturbation. The grains are not visible in thin section and no additional information can be obtained. The proposed diagenetic history (Table 3.3) suggests that reworked sediments were deposited in a low energy environment followed by some physical compaction, burrowing and lithification of the mud-rich material. It is important to note that physical compaction increases with depth. Time Paragenesis 1 Deposition of reworked sediments in a low energy environment 2 Minimal physical compaction 3 Burrowing 4 Physical compaction 5 Lithification of mud-rich material Table 3.3. Diagenetic history of burrowed clay microlithofacies. After deposition of muds and minimal compaction, organisms were able to burrow through the microlithofacies. Physical compaction is continuous throughout paragenesis.

48 37 Figure Thin section of facies 2 offshore muds illustrating microscopic burrows in the sediments (Sample11, Core 1, m) Lithofacies 2 Interpretation: Shallow Marine Open Shelf Lithofacies 2 is interpreted as muds that have been deposited in a submerged, low energy setting. Based on presence of regular parallel laminaetions, these muds seem to have been gradually deposited out of suspension, in a shallow marine open shelf setting or potentially as part of the prodelta bottomset. Bioturbation is variable in intensity perhaps indicating change in sedimentation rate or variation in
49 38 environmental stresses such as salinity, oxygen or acidity. Low bioturbation intensities are indicative of rapid sedimentation rates, whereas high bioturbation intensities indicate slow sedimentation rates. From the apparent absence of erosional surfaces and bedforms, this facies was deposited below fairweather and storm wave base. Trace fossils in lithofacies 2 are not indicative of a specific environment. Planolites burrows can be found in virtually all environments, from freshwater to deep marine, and Ophiomorpha burrows are found in numerous marine shoreface environments (Pemberton et al.,1992).

50 Lithofacies 3: Heterolithic and Cyclic Sandstone and Shales This heterolithic lithofacies is composed primarily of massive and parallel laminaeted sandstone and shale. No vertical grain size trends are observed; however, shale laminae show upward thickness change from ~5 mm to 1mm over 15 cm. Sands are moderately to well-sorted with the presence of some wavey beds. Calcareous and argillaceous red mudstone is common and garnet grains are also observed in thin laminae. Detrital garnets generally lie on top of cross-stratified calcareous sands of facies 4. Scour surfaces separate lithofacies 3 and 4 where detrital garnets are present. These heterolithic sands and shales show low-angles of repose with low intensity (0-3) bioturbation index (Fig. 2.3). Organisms forming Planolites, Skolithos, and Ophiomorpha are present. Micro-syndepositional slumping and microfaults have generated interesting pinch-off structures named loop bedding are observable in Figure 3.11 (Calvo et al., 1998). Figure Interlayered heterolithic sands and shales from Core 1 (4732 m m) Venture B-13 well of facies 3 showing possible spring and neap cycles. Paired mud drapes on the top of this core sample. Thickening and thinning of beds and laminaee are representative of these spring and neap bundles. Microfaults have generated pinchoff structures termed loop bedding.

51 Thin section interpretation of facies Interbedded siltstone and clay Thin sections from Core 1 from sample point m and Core 2, sample point m This rock is composed of separate quartz rich and mica rich bands. Bedding and parallel accumulation of clays are both observed in these samples. The quartz rich bands comprise quartz (60%), intergranular micritic calcite cement (30%), chlorite and muscovite (8%), and pyrite (2%). The brown bands comprise primarily of microscopic platy minerals(75%), quartz grains (15%), pyrite (5%) and possibly organic matter(5%). Physical compaction is evident in these thin sections; however, chemical compaction is nearly nonexistent. As such, these samples have undergone a low degree of diagenesis. Figure Thin section of facies 3 interbedded siltstone and intramicrite Sample 11 (Core 1, m). Time Paragenesis 1 Successive deposition of coarser and finersediments 2 Formation of authigenic pyrite in a reducing environment 3 Physical compaction of grains, alignment of platy minerals 4 Cementation by precipitation of carbonates in coarser bands Table 3.4. Paragenesis of interbedded siltstone and clay microlithofacies. After deposition of sediments, minor early cements (carbonate and pyrite) were formed. Physical compaction and cementation are the final stages of diagenesis observed.

52 Lithofacies 3 Interpretation: Tide-Influenced Nearshore Shallow Marine Shelf Deposits The nature and diversity of trace fossils is indicative of marine conditions and the cyclic appearance of sands and shales provides evidence of a tidally influenced setting. The heterolithic and cyclic nature of the sediments in this facies, with some systematic variation in laminae thickness, is suggestive of spring and neap tidal bundles, although bundles are not well defined. Loop bedding, as observed on Figure 24, is representative of compaction followed by microdeformation near the boundary between the ductile-brittle deformation fields (Calvo et al., 1998). Appearance of garnets in thin (~2-4mm) laminaee suggests events capable concentrate these denser minerals during the deposition of lithofacies 3. Provenance of heavy minerals in the Scotian Basin is likely from the dominantly metamorphic Meguma Terrane of the Appalachians (Tsikouras et al., 2011). Figure Thin section of facies 3 interbedded siltstone and intramicrite of Sample 15 (Core 3, m).

 (Fig. 3.16).")
53 Lithofacies 4: Cross-Stratified Calcareous Micaceous Sandstone This lithofacies is composed of relatively clean, micaceous sands with calcareous cement. Thin dark-grey to black siltstone interbeds are present throughout this lithofacies with common detrital and authigenic chlorite. These sands are moderately to well sorted and rarely show coarsening upward laminae and beds. Argillaceous red mudstones are rarely present. Slightly finer grained sands overlie organic laminaee (~2mm) (Fig. 3.16). Low angle oscillatory-flow cross-laminaetion, truncated surfaces, and ripple-drift cross-stratification are present throughout the facies. Ophiomorpha nodosa and Rosselia socialis burrows are observed in the clean sandy intervals. Figure Oscillatory-flow crosslaminaetion observed in sands of facies 4 between m from Core 3. The base of the sandstone shows evidence of scouring and is bounded by facies 2 shale beds. Low angle truncations are present within the sandstone. Figure Calcareous micromicaceous sands of facies 4 showing symmetrical inclined layers and climbing ripples/ ripple-drift crossstratification. Since the angle of climb is greater than the stoss side angle, these are called supercritical climbing ripples (Boggs, 2006).


54 43 Figure Calcareous fine-grain sand with shale laminaee having a less than 5o dip with possible organic debris within. This section is found between m and m. Figure Medium to coarse grained argillaceous sands, laminated with minor tabular cross-bedding and minor bioturbation. Some cryptoturbation is identified along the shale laminae that is rich in organic material for opportunistic feeding organisms.
55 44 Intervals of lithofacies 4 bedsets may reach meters (>3m) in thickness. Some shale laminaee with low angle dips (~0-5 ) were observed. Bioturbation index is variable (0-3 intensity range) throughout this lithofacies. Where bioturbation occurs, Asterosoma, Skolithos, Ophiomorpha, Rosselia and Cylindrichnus are present. Asterosoma shows groups of concentric banding around the central shaft (Pemberton et al, 1992) whereas Ophiomorpha burrows are lined with dark shales. Planolites burrows are evident in the siltstone interbeds Thin section interpretation of facies Fine to medium-grained calcareous sandstone with ooids and shell fragments Thin sections from core 1 from sample points m, m These thin sections comprise quartz grains (50-70%), shell fragments (bivalve fragments, crinoids and echinoid spines) (5-10%), ooids (5-15%), lime mud clasts (5%), muds (6%), intragranular micritic calcite cement (10-18%), pyrite (0-2%), chlorite (0-2%), muscovite and biotite (0-2%) The average grain size in both thin sections ranges from 0.15 to 0.25 mm. Although larger grains ( 0.25mm) are found in m, both samples are grain-supported and contain lime mud. The average ooid size is 0.2mm. Quartz grains are rounded ( ) to subrounded ( m) and samples are generally well sorted. Platy minerals such as chlorite, muscovite and biotite have been deformed as a result of compaction. Burrows with mud linings are observed in Sample 7 (Core 1, m). Although both thin sections are part of the same microlithofacies, it is evident that Sample 6 (Core 1, m) has undergone an increased amount of diagenesis. Whereas replacement of quartz by calcite is observed in Sample 6 (Core 1, m) by nibbled grain contacts, this diagenetic feature is absent in Sample 7 (Core 1, m). As silica is released, it becomes available for diagenesis. Dark micritic rims around quartz grains and fossils, as a result of iron rich carbonates packing around grains during compaction and burial, are present in both thin sections.

 under plain-polarized light.")
56 45 Figure Thin section of Sample 6 (Core 1, m) under cross-polarized light. Quartz grains and micritic calcite infilling the intergranular pore space. Calcite replacement of quartz grains is evident by observation of curved/nibbled quartz grains. These are evidence of late stage diagenesis. Figure Thin section of Sample 6 (Core 1, m) under plain-polarized light. Bivalve shell with fibrous unaltered texture is surrounded by embedded quartz grains. Calcite cement lies within pore spaces, and darker material is siderite. Quartz fragments indent bivalve shell as a result of compaction.
57 46 Time Paragenesis 1 Deposition of sediments and shell fragments 2 Bioturbation creating mottled bedding 3 Formation of micritic rims around quartz creating embedded grains 4 Formation of authigenic pyrite in a reducing environment 5 Physical compaction and increased grain packing 6 Precipitation of calcium carbonate in intragranular spaces 7 Minimal replacement of quartz by calcium carbonate (only in m) Table 3.5. Paragenesis of fine-grained calcareous sandstone with ooid fragments. After deposition of sediments, and minor physical compaction, organisms create burrows and minor early cements (carbonate and pyrite) are formed. Physical compaction, cementation and replacement of quartz by calcium carbonate are the final stages of diagenesis observed Very fine- to medium-grained calcareous sandstone Thin sections from Core 3 from samples m and m This rock is composed of quartz (85%), intergranular micritic calcite (10%), a few small ooids (5%), pyrite (3%), and microcline (2%). Quartz grains demonstrate sub-rounded, convex/concave grain boundaries. Their size is variable throughout the thin sections, from very fine- to fine-grained sand (0.091mm-0.227mm). Some of the quartz grains in these thin sections are microcrystalline. Some coherent patches of the samples show carbonate cementation. Intergranular secondary porosity of about 25% is evident. Finally, early clay mineral (chlorite) growth over quartz grains is observed. Time Paragenesis 1 Deposition of sediments 2 Early clay mineral growth 3 Formation of authigenic pyrite in a reducing environment 4 Physical compaction of grains 5 Chemical compaction of grains where silicate grains are partially dissolved 6 Cementation by precipitation of carbonates 7 Minor dissolution by pore fluids Table 3.6. Paragenesis of very fine- to medium-grained calcareous sandstone. After deposition of sediments, and minor physical compaction, minor early cements (carbonate and pyrite) are formed. Physical compaction, cementation and dissolution by pore fluids are the final stages of diagenesis observed.
 under plain-polarized and cross-polarized light showing quartz grains and high amount of")
58 Figure Sample 4 (Core1, m) under plain-polarized and cross-polarized light showing quartz grains and high amount of secondary or ineffective porosity highlighted by orange resin. 47
59 Fine- to coarse-grained calcareous silt Thin sections from Core 1 from samples m, m, m, from Core 2 from sample m, from Core 3 from samples m, m, m, Quartz (40-70%) predominates, with detrital chlorite (10%), framboidal pyrite (1-7%), muscovite (4-7%), biotite (0-5%), plagioclase (0-5%), and micritic cement mixed in with mud (10%-26%). No bioclasts or ooids are observed in these thin sections. Sample 19 (Core 3, m) and Sample 20 (Core 3, m) have a bioturbation index of 3 (Fig. 2.3.) whereas the rest of the thin sections are unbioturbated. Pyrite seems to be lining these burrow walls. Grain size is variable from fine silt ( mm) to coarse silt (0.053mm). Muscovite and biotite grains are aligned forming microscopic laminaee, particularly in Sample 14 (Core 2, m). Grains in all thin sections are subrounded to angular and moderately sorted. Opaque material in thin sections (Fig. 3.24) is likely siderite, an iron-rich calcite cement, or organic debris mixed with pyrite. The plagioclase present is the calcium-rich end member, anorthite, which is identified by an average extinction angle of o of polysynthetic twinning. These minerals have not been albitized as fluids were likely not able to penetrate these grains. Replacement of quartz by calcite is present, creating irregular nibbled contacts along the grain boundary. In all thin sections except in Sample 10 (Core 1, m), flexible deformation of platy minerals such as chlorite, biotite and muscovite was observed throughout thin sections (Fig. 3.22). Chloritized bands of sediments are present in Sample 10 (Core 1, m) as a result of mineral replacement. Specifically in this thin section, detrital chlorite grains are not present. Instead, chlorite is present as fine rims around detrital quartz grains. Finally, secondary porosity is observed in Sample 12 (Core 1, m) as a result of dissolution by pore fluids (Fig. 3.28).
 of fine- to coarse-grain calcareous siltstone under plain polarized light.")

 Figure 3.22. Sample 3(Core 1, 4693.")
60 49 Figure Thin section of Sample 3 (Core 1, m) of fine- to coarse-grain calcareous siltstone under plain polarized light. The opaque material is likely pyrite. Note that the micaceous minerals display no preferential alignment. Figure Flexible grain deformation identical to what is observed in Figure 35 as shown by Boggs (2006) Figure Sample 3(Core 1, m) under plain polarized light demonstrating early signs of early diagenesis with chlorite deformation. Framboidal pyrite also found throughout.

 under plain polarized light.")
61 50 Figure Thin section of fine-grain sandstone from Sample 12 (Core 1, m) under plain polarized light. Quartz grains and organic fragments are cemented with siderite. Although secondary porosity is observed in this thin section, none is seen in this particular area. Figure Thin section of fine-grain sandstone from Sample 9 (Core 1, m) under plain polarized light. The presence of authigenic chlorite bands and rims around quartz veins are the result of early diagenesis. Porosity is observed to be greater in these chlorite-rich bands.

62 Figure Thin section of sandstone from Sample 14 (Core 2, m) under plain polarized light. Note the stylolites are present, carbonates have been dissolved, pyrite is concentrated in these zones and quartz grains remain intact. This thin section shows moderate to poor sorting. 51
 under plain polarized light that reveals the contrast between grain-supported and matrixand cement-supported sediments.")
63 Figure Thin section of sandstone from Sample 19 (Core 3, m) under plain polarized light that reveals the contrast between grain-supported and matrixand cement-supported sediments. Framboidal pyrite is found throughout this thin section. 52

64 53 Figure Thin section of micaceous sands of lithofacies 4 from Sample 12 (Core 1, m) under crossed polarized light. The sample is quartz rich, well sorted with subrounded grains. Secondary porosity is also observed. Time Paragenesis 1 Deposition of sediments 2 Early clay mineral growth 3 Formation of authigenic pyrite in a reducing environment 4 Physical compaction of grains, alignment of platy minerals 5 Cementation by precipitation of carbonates 6 Slight dissolution by movement of pore fluids Table 3.7. Paragenesis of fine- to coarse-grained calcareous silt. After deposition of sediments, and minor physical compaction, minor early chlorite minerals were able to form followed be the formation of cements (carbonate and pyrite). Physical compaction, cementation and dissolution by pore fluids are the final stages of diagenesis observed. Physical compaction occurs as a result of diagenesis.
65 Lithofacies 4 Interpretation: Shoreface Deposits This facies is representative of a dynamic part of a shoreface. The presence of oscillatory-flow cross-stratification is evidence of a bidirectional paleocurrent during sediment deposition. Similar to facies 3, the presence of diverse burrows such as Ophiomorpha nodosa and Rosselia socialis, as well as diverse shell organisms suggest fully marine conditions during deposition. Horizontal laminaee, planar cross-beds, current and climbing ripples further suggest that these are of the lower flow regime with possible low to medium water velocity. Ripple-drift evidence could also be representative of storms or tides affecting shoreface deposits.
.")
66 55 Chapter Trace Fossils-Venture B-13 Well The trace fossils observed in Venture B-13 cores were key components in understanding biofacies and depositional environments. The Cruziana and Skolithos ichnofacies were identified in the B-13 cores, and evidence presented below will show that bioturbation affects sediments. Figure 4.1. Trace fossils and their respective ichnofacies and environments (Pemberton and MacEachern, 1995) Cruziana Ichnofacies The Cruziana ichnofacies includes Thalassinoides, Cylindrichnus, Rosselia socialis and Planolites. Although other ichnogenera also compose the Cruziana ichnofacies, these specific trace fossils are observed throughout the Venture B-13 core. They are typically representative of mid to distal continental shelf deposition below normal wave base. Wave base is the maximum water depth at which a passing wave may influence sediments (Boggs, 2006) and can be categorised as fair weather deposits
67 56 (Wach, 2013). Planolites trace fossils are made during intrastratal deposit feeding (Davis et al., 2012). These traces usually have unlined walls and burrow fills that differ in texture from adjacent rock (Pemberton et al., 1992). Planolites can be found in various environments from deep marine to freshwater (Pemberton et al., 1992). Asterosoma trace fossils were also present. In Venture B-13, a textbook example of Rosselia socialis is present (Fig. 4.3). Concentric rings of clay and siltstone surround the central shaft of the Rosselia where a ball of silt surrounds a central black shaft (Howell, 2012). These fossils are representative of shallow marine sandstones (Howell, 2012). The organisms forming Planolites, Thalassinoides, Arenicolites and Skolithos can tolerate salinity-stressed environments (Davis et al., 2012). The organism forming Planolites can tolerate oxygen-stressed environments (Davis et al., 2012).


68 57 Figure 4.2. Sands and shales from facies 3. Blue arrows indicate Planolites mortanus burrows and are concentrated in shale layers that are likely organic rich and deposited in quiet water sedimentation. Cross beds and ripple forms are present. An alternation of strong weak currents are observed, confirming that this is an active depositional environment. Minor flaser bedding is observed within shale laminaee. Figure 4.3. Enlargement of a Rosselia socialis dwelling burrow of the Cruziana inchnofacies. The diagenetic halo is a slightly different colour than the surrounding sandstone
.")
69 Skolithos Ichnofacies The Skolithos ichnofacies typically comprises Ophiomorpha, Arenicolites and Skolithos. This ichnofacies typically represents a moderate- to high-energy marine environment with a generally lowturbidity and well-oxygenated water column (Dalrymple et al., 2010). Ophimorpha burrows represent a near shore environment. Animals found in tidal settings are able to concentrate fine-grained sediments as a result of selective ingestion (Davis et al., 2012). The Ophiomorpha burrows with thick mud linings are representative of a subtidal setting and represent the dwelling burrows of suspension-feeding shrimp (Pemberton et al., 1992). Traces similar to Ophiomorpha but lacking wall lining are attributed to Thalassinoides (Bromley, 1990). Arenicolites is the dwelling burrow of an annelid generally associated with low energy shoreface or sandy tidal flats (Pemberton et al., 1992). Skolithos burrows represent suspension-feeding organisms or passive carnivores that are generally associated with marine or brackish environments (Pemberton et al., 1992). Figure 4.4. Coarse grained argillaceous sandstone of facies 4 with 3 cm Ophiomorpha nodosa burrow. Note pelloidal wall linings that support the burrowed structure. These burrows are representative of a tidal setting.
70 59 Table 4.1. Trace fossils observed in the Venture B-13 cores and their respective ethologies (Modified from Pemberton et al., 1992) Trace Fossil Ophiomorpha Cylindrichnus Planolites Arenicolites Asterosoma Skolithos Rosselia Ethology Dwelling burrow of suspension-feeding shrimp Suspension feeding dwelling burrow Feeding burrow of deposit-feeder Suspension- or filter-feeder Selective deposit-feeding Dwelling burrow of suspension-feeding organism Dwelling burrow or feeding burrow of a deposit feeder Table 4.2. Trace fossils and their associated lithofacies compared to average permeability core plug measurements. Permeability measurements will be further discussed in Chapter 5. Lithofacies Trace fossils Range of values (md) Average permeability from core plugs 1 None md 2 Planolites, Asterosoma, md Arenicolites, Thalassinoides (abundant) 3 Planolites, Skolithos, and md Ophiomorpha (abundant) 4 Ophiomorpha and Rosselia md socialis (rare)
71 60 Skolithos and Ophiomorpha are considered dwelling traces (Bromley, 1996). It has also been observed that sediments found surrounding trace fossils demonstrate disturbance as a result of biogenic activity (Bromley, 1996). This is especially applicable to larger trace fossils such as Ophiomorpha, Skolithos and Rosselia. Diagenetic haloes can be present around Ophiomorpha and Rosselia burrows representing localized zones of oxidation usually related to the presence of organic material. These features show the difference in diagenesis between the wall of the burrow and the infilling sediments (Bromley, 1996). As observed in Table 4.2, both lithofacies 2 and 3 have high bioturbation values and low permeability values. Lithofacies 1 does not have any trace fossils, but has low a permeability average because of its nature, as described in Chapter 3. Lithofacies 4 has few Ophiomorpha burrows and generally high permeability measurements. Low permeability measurements likely occur where burrowing is present. Hence, a higher bioturbation index is related to lower permeability values. 4.2 Summary of Trace fossils Analysis of trace fossils proved essential in understanding permeability variations throughout the Venture B-13 cores. Diagenetic haloes, present mainly around Ophiomorpha burrows, involve cementation in a zone around a burrow, further impacting permeability. Numerous of the discrete traces have muddy linings that affect local permeability. In clean sandstones, three-dimensional burrow connectivity increases permeability and the amount of fluid-flow pathways through rock. However, where both mud and sands are present, high bioturbation leads to sediment mixing, that significantly degrades permeability.
. In order to attain permeability measurements, the rubber nozzle is pressed against the core as the syringe knob is pulled towards the operator and air is pulled from the sample.")
72 61 Chapter Permeability in Venture B-13 Cores TinyPermII The tool used to measure permeability for Venture B-13 cores was the TinyPermII from New England Research, Inc. (2013) (Fig. 5.1; Table 5.1). In order to attain permeability measurements, the rubber nozzle is pressed against the core as the syringe knob is pulled towards the operator and air is pulled from the sample. The microcontroller which is connected to the syringe unit measures the syringe volume (the created vacuum pulse), and computes an algorithm for the specific permeability measurement (New England Research, 2013). The permeability values are then displayed on a liquid crystal screen on the microcontroller. Table 5.1. Physical size of TinyPermII parts (New England Research, 2013). TineyPerm II Part Syringe unit Microcontroller unit Interface cable Dimensions 38cm x 12.5cm x 5cm 16.5cm x 11.5cm x 5cm Variable, up to 3 meters long Figure 5.1. TinyPermII from New England Research Inc. The tool consists a syringe unit, interface cable and microcontroller which weighs 1.2kg (New England Research, 2013).
73 62 The number displayed on the screen is not given in millidarcies, but must be converted by using calibration charts and tables provided by New England Research Inc. Horizontal permeability was measured whenever a change in lithofacies was observed. Values retrieved from TinyPermII show a high variation in permeability throughout measured core sections Core Plug Permeability Forty two permeability measurements, based on core plugs sampled at regular intervals by the well operator, were sourced from analyses by Core Laboratories-Canada Limited (File reference # ). Horizontal core plugs are samples cut perpendicular to the core axis that are about 2.5 to 3.8 cm in diameter and about 5 cm long (Schlumberger, 2013). In a laboratory setting, permeability data is collected by using steady-state apparatus. A constant drop in pressure is used to precisely measure flow rate (Doyle, 2006). Equations using Darcy s Law are then used to find the permeability of sample. These measurements are taken through the full diameter of the core for horizontal permeability (K H )(Doyle, 2006) TinyPermII and Core Plug Permeability Measurement results from core plug analyses and the TinyPermII tool are considerably different (on average 2 to 3 orders of magnitude) (Tables 5.2 and 5.3). Values generated by the TinyPermII measuring tool are suspect, possibly due procedural error. Given the sensitivity of the tool, escape of air may have occurred, resulting in erroneous values even though it has been calibrated. In view of these considerations, TinyPermII values were not evaluated as part of this thesis. Since core plug measurements are industry standard attained using calibrated laboratory equipment in a controlled environment, these values will be used as an accurate representation of permeability. Data from core plugs were plotted as depth (m) vs. permeability (md) curves (Cores 1-4, Figs respectively). Average permeability measurements from both core plug data and TinyPermII measurements were assigned to the different lithofacies. Lower permeability values corresponded to shaley sections of
74 63 the core (lithofacies 2) and higher permeability values corresponded to sandy sections of the core (lithofacies 4). Where increased amounts of pore filling calcite cement were present, permeability was low. Lithofacies Core plug average Range of values Number of permeability (md) values from core measurement (md) plugs Table 5.2. Average permeability measurements of lithofacies from core plugs and range of values. The number of values is also included in the table as it is indicative of the certainty of the values. Lithofacies TinyPermII average Range of values Number of values permeability (md) from TinyPermII measurement (md) Table 5.3. Average permeability measurements of lithofacies from TinyPermII and range of values. The number of values is also included in the table as it is indicative of the certainty of the values. Range of values for each lithofacies is extremely variable.
75 Core Depth (m) 64 Core 1 Depth(m) vs. Permeability (md) Core Plug Measurements Permeability (md) Figure 5.2. Core 1 depth (m) vs. core plug permeability (md).
76 Core Depth (m) Core 2 Depth(m) vs. Permeability (md) Core Plug Measurements Permeability (md) Figure 5.3. Core 2 depth (m) vs. core plug permeability (md).
77 Core Depth (m) 66 Core 3 Depth(m) vs. Permeability (md) Core Plug Measurements Permeability (md) Figure 5.4. Core 3 depth (m) vs. core plug permeability (md).
78 Core Depth (m) 67 Core 4 Depth(m) vs. Permeability (md) Core Plug Measurements Permeability (md) Figure 5.5. Core 4 depth (m) vs. core plug permeability (md).
79 Porosity in Venture B-13 Porosity in Venture B-13 Cores was measured by Core Laboratories-Canada Limited (File reference # ) from core plugs and 42 data points were made available. In a laboratory setting, samples are cleaned and dried to remove drilling fluid. Porosity is measured by applying Boyle s Law: P 1 V 1 /T 1 =P 2 V 2 /T 2. If the temperature remains the same within a closed system, then absolute pressure and volume of confined gas are inversely proportional (Doyle, 2006). In this situation, T remains constant and can be removed from the equation: P 1 V 1 =P 2 V 2. Since a known volume of helium (V 1 ) is injected at a known pressure (P 1 ), a resulting pressure may be found and V 2 can be solved (Doyle, 2006). This V 2 value is representative of the grain volume. Once the bulk volume is measured, these two values are subtracted from one another to define pore volumes (Doyle, 2006). Porosity and depth are plotted in order to observe potential trends. A general increase in porosity is observed with depth for two cores, Core 1 and Core 2,that extend over a 6.0 and 14 m interval respectively. Although porosity loss is expected with increasing depths as a result of compaction, increased burial depth may allow for silicate minerals to dissolve and for organic material to decompose, thereby increasing empty pore space (Boggs, 2006). Each lithofacies was assigned average porosity values based on core plug measurements. Since lithofacies 4 has the highest number of measured points, it has the most reliable average porosity value. For similar reasons, lithofacies 3 has the least reliable average porosity measurement. Histogram plots of porosity values of Venture B-13 cores are presented in Chapter 2.
80 Depth (m) 69 Lithofacies Average porosity measurement from core plugs Porosity range (core plugs) Amount of values (#) Table 5.4. Average porosity measurements from core plugs for each lithofacies and the number of values that have been averaged. Note that the majority of the porosity measurements represent lithofacies 4. In contrast, there is only 1 data value for lithofacies 3. These lithofacies show different porosity values as some sections of the core have undergone increased dissolution during diagenesis. Porosity values increase from lithofacies 1 to 4. Since lithofacies 4 cross-stratified micaceous sands have the highest porosity values, these also have the best reservoir quality. Thin section analysis supports these high porosity values since high amounts of dissolution and low amounts of cementation (10-18%) features were noted. The low porosity values of lithofacies 1 are interpreted to be a result of pore spaces being filled with up to 35% calcite cement and dissolution features are observed from thin sections Cores 1 & 2 Depth(m) vs. Porosity Fraction Porosity Fraction Figure 5.6. Porosity fraction of cores 1&2 plotted against depth of well (m) showing a general increase in porosity with depth
81 Depth (m) Depth (m) 70 Core 3 Depth (m) vs. Porosity Fraction 4717 Porosity Fraction Figure 5.7. Core 3 porosity fraction plotted against depth (m). A cluster of porosity values in the 23-26% porosity range observed. Core 4 Depth (m) vs. Porosity Fraction 4949 Porosity Fraction Figure 5.8. Core 4 porosity fraction plotted against depth (m) generally with higher porosity values at increased depths.

82 Porosity Fraction Porosity vs. Permeability Porosity fractions are plotted against core plug permeability values and a graph with a relatively high R 2 value (0.8248) was created. Proximity of R 2 to a value of 1 indicates a linear trend. Lithofacies are assigned different colours on this graph. Four natural groups/clusters of samples are represented in this diagram: a) A group with about 4-7% porosity and values of about md associated with lithofacies 1; b) A group with porosity of approximately 6% and permeability of md associated with lithofacies 2; c) A group with porosity of 11-18% and permeability md associated with shallower depths of lithofacies 4; d) A group with porosity of % and permeability mD associated with increased depth of lithofacies 4. Porosity Fraction vs. Permeability (md) 0.3 R² = Permeability (md) Figure 5.9. Porosity fraction versus permeability (md) through Venture B-13. Lithofacies 1 through 4 are assigned specific colours so as to identify clusters.
83 72 Chapter Results Flow units A flow unit is a measure of permeability and porosity within a volume of rock, in comparison to strata above or below (Schlumberger, 2013). The identification of lithofacies and analysis of permeability from conventional cores demonstrate that flow units are present at various scales. Properties affecting flow units include grain size, permeability, bioturbation index, cementation, clay content, and mineralogical change. The qualitative assessment of these properties are used to differentiate and characterize the flow units within the cored reservoirs (Chapter 2). They are quantified and the results presented in the following two sets of tables. The first set of tables, Potential Differences in Flow Units (Tables ), analyses the probability of change in flow units from one depth to another. Numbers in the relative ranking of flow units column represent how likely the unit is different from overlaying and underlying strata. Since individual criteria are assigned a number out of 8 and these are all added to give a number indicative of probability of change, values in this column are out of a potential 48 points. The higher the value, the greater the likelihood of change in flow units. Where low values follow one another ( 3,4,1 ), these potentially represent a single flow unit. These are grouped and a blue box is put around them. It is important to note that this section does not quantify the ability to flow within a unit. Low numbers do not indicate a poor flow unit and high numbers do not indicate good flow units. The second set of tables, Flow Unit Strength: Influence on Preferential Flow (Tables ), compares average core plug permeability values of lithofacies to the sum of assigned values for grain size, clay content, porosity, bioturbation and cementation. A higher sum of values indicates better flow units, whereas a lower sum of values indicates poor flow units. These tables identify flow unit strength.
84 73 These values were compared to the assigned permeability to determine if methodology was valid and accurate. Tables Ranking Potential Differences in Flow Units Core m Depth (m) Lithology Grain Size Permeability Porosity Cementation Bioturbation Rel. Ranking of flow unit out of 48 Top Bottom Table 6.1. Ranking potential differences in flow units in core 1.
85 74 Core m Depth (m) Lithology Grain Size Permeability Porosity Cementation Bioturbation Rel. Ranking of flow unit out of 48 Top Bottom Table 6.2. Ranking potential differences in flow units in core 2.
86 75 Core Depth (m) Lithology Grain Size Permeability Porosity CementationBioturbation Rel. Ranking of flow unit out of 48 Top Bottom Table 6.3. Ranking potential differences in flow units in core 3.
87 76 Core Depth (m) Lithology Grain Size Permeability Porosity CementationBioturbation Rel. Ranking of flow unit out of 48 Top Bottom Table 6.4. Ranking potential differences in flow units in core 4.
88 Flow Unit Strength: Influence on Preferential Flow The strength of flow units is calculated in the following section as explained in section of this thesis. Values assigned for permeability and ability to flow within unit are highlighted in red as they are compared to one another to see if the methodology applied was accurate. High values for permeability should have high flow unit strengths. Core m Depth (m) Permeability Grain Size Clay Content Porosity BioturbationCementation Ability to flow within unit out of 20 Top Bottom Table 6.5. Flow Unit strength through Core 1
89 78 Core m Depth (m) Permeability Grain Size Clay Content Porosity BioturbationCementation Ability to flow within unit out of 20 Top Bottom Table 6.6. Flow Unit strength through Core 2
90 79 Core m Depth (m) Permeability Grain Size Clay Content Porosity BioturbationCementation Ability to flow within unit out of 20 Top Bottom Table 6.7. Flow Unit strength through Core 3
91 80 Core Depth (m) Permeability Grain Size Clay Content Porosity BioturbationCementation Ability to flow within unit out of 20 Top Bottom Table 6.8. Flow Unit strength through Core 4 Core descriptions assist in providing a visual representation of the variation of flow units strength (FUS) with depth. They also give information on bed thickness, sedimentary structures, bioturbation index, trace fossils and ichnofacies. Flow unit strengths were assigned values out of 20 (Tables 32, 33, 34, 35). Each number, from 1 to 20 was then given a specific colour and represented on the core description sheet.

92 Figure 6.1. Colors assigned to flow unit strength values. : 1=highest / best, 20=lowest / worst. 81
93 82
94 Figure 6.2. Core 1 description sheet 83
95 Figure 6.2. Core 1 description sheet 84
96 Figure 6.3. Core 2 description sheet 85
97 Figure 6.4. Core 3 description sheet 86
98 Figure 6.4. Core 3 description sheet 87
99 Figure 6.5. Core 4 description sheet 88
100 Figure 6.5. Core 4 description sheet 89
101 90 Chapter Discussion Porosity The dominant type of porosity of the Lower Missisauga Formation, as determined from representative cores, is intergranular and secondary. Interestingly, a general increase in porosity is observed with depth. The highest porosity is 26.1 % at a depth of m (Core 4) and the lowest porosity is 3.9% at depths of m (Core 1) and m (Core 1). Values as high as 26% at nearly 5km depth are remarkable, and represent an unusual situation. This is explained by an increase of diagenetic processes with depth. In particular, dissolution of carbonate cement has created a large volume of secondary porosity within the sandstones of the Venture Field. Specifically, secondary porosity at depths below 4000m is achieved mainly by ferroan sparry calcite dissolution, and minor secondary porosity is created by dissolution of framework grains or clay alteration (Jansa and Noguera, 1990). Although syndepositional fracturing within the deeper Lower Missisauga Formation might explain unusually high porosity and permeability in some samples, there was no sign in thin sections of highly fractured rock. Lastly, as observed in thin section paragenesis (Chapter 3), the enhancement of porosity is possibly the result of numerous diagenetic events that overlapped in time (Jansa and Noguera, 1990). Furthermore, it was noticed that lithofacies with authigenic chlorite have higher porosity values. Silica overgrowths on detrital quartz grains are non-existent with the presence of chlorite that precluded quartz growth and in these cases preserved the original porosity (Drummond, 1990) Horizontal Permeability Core plug permeability measurements showed no trends with increased depth; however, values did increase from facies 1 to facies 4. The oolitic limestone(1) has the lowest permeability and is a weak flow unit, followed by shales (2), heterolithic and cyclic sandstone and shale (3), and finally facies 4 cross-stratified micaceous sandstone. As such, facies 4 would be the best flow unit and possibly the
102 91 highest quality reservoir rock. Furthermore, since lithofacies 4 has the highest amount of data points, it provides the researcher with the most accurate permeability result. Lithofacies 3 only had one data point, therefore the permeability value assigned will have a great margin of error. The highest permeability value encountered in the Venture B-13 cores is 208 md (lithofacies 4, Core 4), and the lowest md (lithofacies 1, Core 1). Variations in permeability values are observed in scales from a single well core to a thin section. This serves as evidence for influence of numerous factors on flow unit strength including: grain size, porosity, cementation, bioturbation, and the amount of clay minerals. Based on this study s results, a larger grain size and higher porosity coincide with higher permeability values. Low cementation and clay minerals, and high bioturbation decrease permeability values Porosity vs. Permeability Porosity and permeability are co-dependent factors that influence flow within volumes of rock. Available data of porosity and permeability from the Venture B-13 conventional cores show a log- normal trend with an R 2 value of The plot of reservoir properties of the four lithofacies in Figure 5.9 indicates that that lithofacies 1 has the lowest permeability and porosity measurements, followed by lithofacies 2. However, two clusters of values from lithofacies 4 were observed. One group had porosity values ranging from 11 to 18% and permeability values from 0.15 to 1.4 md, and the other group had porosity values ranging from % and permeability values from 9.66 to 348mD. The lower porosity/permeability values of lithofacies 4 are associated with shallower depths and higher porosity/permeability values with increased depths due to diagenesis Flow Unit Differentiation Tables ranking potential differences in flow units were created incorporating change in grain size, lithology, permeability, cementation and bioturbation. Units were given a number out of a potential 48. Overall, 58 flow units were identified, with 45 identified as major flow units. The highest individual flow unit value was 30 out of a possible 48. Seemingly low values indicate that potential flow
103 92 unit differentiation is not located at specific intervals in the well cores. In certain cases, flow unit divisions are not clearly defined and may be found within a zone. The lowest value is 0 indicating that there is no change between overlying and underlying lithologies. Values below 15 would indicate poor flow unit differentiation. Accuracy of the applied methodology may be improved by adding additional variables such as grain shape, and pore throat size or geometry. Moreover, since cementation is variable at a microscopic scale, the margin of error for the cementation column may be greater than the rest of the criteria. The thickest of these potential flow units is 3.4 m and the thinnest of these flow units is approximately 5cm. It is important to note that although volumes of rock have been assigned fixed permeability values, these are microscopically variable. An increased amount of permeability data points would improve accuracy of this methodology Flow Unit Characterization Core plug permeability averages were assigned to lithofacies assemblages and were subsequently compared to calculated potential flow ability. Grain size, clay content, cementation, porosity and bioturbation data were used to quantify flow quality within rock units. Flow units were assigned a value out of 20. A total of 56 flow units identified in the previous section were thoroughly analysed with respect to their strength. Generally, low permeability measurements associated with low calculated flow potential values and high permeability measurements associated with high calculated flow potential values. Where this was not the case, more accurate values of permeability are needed. The highest value was an 18 out of 20 representative of a good flow unit, and the lowest was a 2 out 20 representative of a poor flow unit. Finally, lithofacies cementation and clay content averages were used in these tables, the values assigned for ability to flow column may have a large margin of error. By adding colors indicative of flow unit strength onto core description sheets, change in strength was easily observed.
104 Conclusions Core of the Lower Missisauga Formation reservoir sands from the Venture B-13 well demonstrate a wide range of permeability and porosity values throughout core. This study has explored numerous factors that affect fluctuations in permeability and porosity allowing the formulation of flow units such as clay content, cementation, bioturbation and grain size. Description of approximately 57 meters of core allowed for the identification of the following lithofacies (Table 7.1) and microlithofacies (Table 7.2): Table 7.1. Lithofacies identified in the Venture B-13 cores and interpreted depositional environments. Lithofacies Name Interpreted depositional environments 1 Oolitic limestone Shallow marine, sub-tidal zone 2 Shale Shallow marine open shelf 3 Heterolithic and cyclic sandstones and shales Tide influenced, nearshore shallow marine shelf 4 Cross-stratified calcareous and micaceous Shoreface deposits Sandstone
105 94 Table 7.2. Microlithofacies identified in the Venture B-13 cores and associated lithofacies. Microlithofacies Lithofacies Association Thin Sections Bio-oosparite m, 4693 m, m, 4698 m Oobiosparite m, m Burrowed clay m Interbedded siltstone and m and m clay Fine to medium-grained m, m calcareous sandstone with ooids and shell fragments Very fine- to mediumgrained calcareous m, m sandstone Fine- to coarse-grained calcareous silt m, m, m, m, m, m, m, m Table 7.3. Average lithofacies porosity and permeability measurements from the Venture B-13 cores. Lithofacies Average porosity measurement from core plugs Core plug average permeability measurement (md) From core plug measurements, average porosity and permeability measurements were identified for all lithofacies (Table 7.3). Data show that porosity and permeability increase from lithofacies 1 to 4. As such, cross-stratified calcareous and micaceous sandstones of lithofacies 4 are the best quality reservoir, whereas oolitic limestones (lithofacies 1) and shales (lithofacies 2) have extremely low to no porosity and act as baffles or barriers to flow. Plotting values of porosity against permeability showed a linear trend and increased flow unit potential with depth. Diagenesis is the main contributor in creation of porosity within the Lower Missisauga Formation. Data and thin section analysis show that alteration of sand body as a result of
106 95 dissolution and diagenesis has considerably increased porosity values at greater depths. Lithofacies 4 shows evidence of late diagenesis, whereas lithofacies 1 shows evidence of early diagenesis. Throughout the Venture B-13 cores, the appearance of trace fossils is correlated to low permeability intervals. The mud linings of trace fossils within clean sands of lithofacies 4 and diagenetic haloes have created zones of low permeability. Furthermore, where bioturbation is high, mud and sand are highly mixed, further lowering permeability values. Analysis of trace fossils also aided in the interpretation of paleoenvironments. Application of methodologies integrating semi-quantitative values of porosity, permeability, bioturbation, and clay and cement content permitted the identification of 56 minor flow units and 48 major flow units within the Venture B-13 cores. The majority of these flow units demonstrated medium to high preferential flow. From one flow unit to the next, values assigned to specific criteria showed variations, though in some cases the flow unit strength was the same and not affected. In such situations, finer scale variations can be resolved through other analyses. Average core plug permeability values generally correspond to calculated flow potential of unit. The accuracy of this method may be improved with an increased number of permeability data points. The flow of fluids through the Missisauga Formation is being controlled at a scale of meters or less. For current and future gas or oil production from this and other formation reservoirs must be understood and exploited effectively, the resolution of modelling and completion must be at this fine scale. 7.3 Future Work For the gas-producing Sable Subbasin, a high resolution reservoir model of the Missisauga Formation could be created using this thesis' flow unit identification methodology. If applied to the greater Sable Subbasin area, this high resolution reservoir model for the Missisauga Formation could be identified in and linked to specific signatures in petrophysical well log data to classify flow units
107 96 throughout the Missisauga Formation in the Venture B-13 well. It could also be extended to other wells in the Venture Field and integrated with reservoir production data. However, as seen on Figure 1.6, the resolution of petrophysical data is likely not high enough to identify small scale heterogeneities. Baffles and barriers in the reservoir may be identified and hydrocarbon preferential flow identified. For a more accurate definition of reservoir flow units in all Venture B-13 cores, it is recommended that more core plugs be obtained and analysed for their porosity and permeability. Finally, grain shape and angularity should also be analysed in future work as these have direct impact on porosity values.
108 97 References Boggs, S Principles of sedimentology and stratigraphy. (4 th ed.). Upper Saddle River: Pearson Prentice Hall. Bromley, R.G Trace fossils: Biology and Taphonomy. Institute of Historical Geology and Palaeontology, University of Copenhagen, Denmark. Bromley, G. R Trace fossils: Biology, taphonomy and applications. (2nd ed.). London, England: Chapman & Hall. Retrieved from =X&ei=K0wEUebmFOLB0AGyuYH4DA&ved=0CDUQ6AEwAQ. Calvo, J.P., Rodriguez-Pascua, M., Martin-Velazquez, S., Jimenez, S., & De Vicente,G Microdeformation of lacustrine laminite sequences from Late Miocene formations of SE Spain:an interpretation of loop bedding. Journal of Sedimentary Research. Vol. 45 (2), pp Retrieved from Canada Nova Scotia Offshore Petroleum Board Call for bids: Regional geology overview. Retrieved from Canada Nova Scotia Offshore Petroleum Board Offshore activity: Production data. Retrieved from Colletta, B., Monnier, G., Rabary, G., Doublet, S., & Letouzey, P Offshore Nova Scotia Play Fairway analysis: 2D basin modeling results. Offshore Technology Conference, Houston Texas, USA. Cummings, Don I; R. William C. Arnott. (2005) Growth-faulted shelf-margin deltas: a new (but old) play type, offshore Nova Scotia. Bulletin of Canadian Petroleum Geology. Vol. 53, 3, pp Dalrymple, R.W Facies Models. (4 th ed.). Geological Association of Canada. Kingston, Ontario. Davis, A. R., & Dalrymple, R. W Principles of sedimentology. New York, NY: Springer Science. Retrieved from ource=bl&ots=fr8sbasql&sig=t1bplc1batj1epsuz3yqua3njsi&hl=en&sa=x&ei=hfzvuia QLKqx0QGN8ICgAQ&ved=0CFoQ6AEwCQ. Doyle, S Permeability, porosity, and depositional environment and their effect on reservoir quality in the Cretaceous Bluesky Formation Whitecourt, Alberta. Unpublished BSc thesis, Dalhousie University Earth Sciences. Drummond, K.J., Geology of Venture, a Geopressured Gas Field, Offshore Nova Scotia. In: M.T. Halbouty (Ed.), Giant Oil and Gas Fields of the Decade American Association of Petroleum Geologists, Memoir 54, p
109 98 Geomore Porosity and permeability. Retrieved from Guild, P. W., Preliminary metallogenic map of North America: A numerical listing of deposits (858- A). U.S Geological Survey Retrieved from website: PA71&dq=missisauga formation&source=bl&ots=ghacizoadw&sig=fgcoc9oaf5asjsa0umfqjuk7ls0&hl=en&sa =X&ei=rxAdUfe5EMiP0QGlnoDIAw&ved=0CFIQ6AEwBg. Hansen,D.M., Shimeld, J.W., Williamson, M.A.,& Lykke-Andersen, H Development of a major polygonal fault system in Upper Cretaceous chalk and Cenozoic mudrocks of the Sable Subbasin, Canadian Atlantic margin. Marine and Petroleum Geology Vol.21, pp Hohn, M. E Petroleum geology and reservoir characterization of the Upper Devonian Gordon sandstone, Jacksonburg-Stringtown oil field, northwestern West Virginia (B-45). West Virginia Geological and Economical Survey. Retrieved from website: Ings, S.J., MacRae, A.R., Shimeld, J.W., & Pe-Piper, G Diagenesis and porosity reduction in the Late Cretaceous Wyandot Formation, offshore Nova Scotia: a comparison with Norwegian North Sea Chalks." Bulletin of Canadian Petroleum Geology. Vol 53, pp Jansa, L.F., & Noguera V.H. (1990). Geology and Diagenetic History of Overpressured Sandstone Reservoirs, Venture Gas Field, Offshore Nova Scotia, Canada. The American Association of Petroleum Geologists. Vol. 74, No 10, pp Jansa, L.F. and Wade, J.A., Paleogeography and sedimentation in the Mesozoic and Cenozoic, southeastern Canada. In: C.J. Yorath, E.R. Parker and D.J. Glass (Eds.), Canada s Offshore Margins and Petroleum Exploration. Canadian Society of Petroleum Geologists, Memoir 4, p Hyne, N. J., Nontechnical Guide to Petroleum Geology, Exploration, and Production, 2nd Edition. PennWell Corporation. Retrieved from G0DcTcUC&printsec=frontcover&source=gbs_ge_summary_r&cad=0#v=onepage&q&f=fal se. Kidston, G.A., Brown, D.E., Smith, B.M, & Althiem, B The Upper Jurassic Abenaki Formation offshore Nova Scotia: A seismic and geologic perspective. Canada Nova Scotia Offshore Petroleum Board, Canada. Karim, A., Pe-Piper, G., Piper, D Controls on diagenesis of Lower Cretaceous reservoir sandstones in the western Sable Subbasin, offshore Nova Scotia. Journal of Sedimentology. Department of Geology, Saint Mary s University, Halifax.
110 99 La Croix, A.D., Gingras, M.K., Dashtgard, S.E., Pemberton, S.G., Computer modeling bioturbation: the creation of porous and permeable fluid-flow pathways. American Association of Petroleum Geologists Bulletin. Vol 96, pp McIver, N. L Cenozoic and Mesozoic Stratigraphy of the Nova Scotia Shelf. Canadian Journal of Earth Sciences, Vol. 9, pp Mukhopadhyay, P.K., Brown, D.E., Kidston, D.G., Bowman, T.D., Faber, J., & Harvey,P.J Petroleum Systems of Deepwater Scotian Basin, Eastern Canada: Challenges for Finding Oil versus Gas Provinces. Offshore Technology Conference. New England Research, Inc TinypermII. Retrieved from Pearson, N.J., & Gingras, M.K An ichnological and sedimentological facies model for muddy pointbar deposits. Journal of Sedimentary Research. Vol.76, No. 5 pp Retrieved from Pemberton, S.G. & MacEachern, J.A., Frey, R.W Trace fossil facies models: Evironmental and allostratigraphic significance (Facies Models: response to sea leavl change). Edited by Walker, R.G. and James, N.P. Geological Association of Canada, St. John s, pp Ramm,M., & Bjorlykke, K Porosity/depth trends in reservoir sandstones: Assessing the quantitative effects of varying pore-pressure, temperature history and mineralogy, Norwegian shelf data. Retrieved from CM/Volume_29/ pdf. Reading, H.G Sedimentary Environments and Facies. Elsevier, New York. Sable Offshore Energy Development Plan: Geology, geophysics and petrophysics. Unpublished report submitted to and available through the Canada Nova Scotia Offshore Petroleum Board), 230p. Schlumberger Oilfield Glossary Retrieved from Shepherd, M., Production data and layering. Oil Field Production Geology: American Association of Petroleum Geologists Memoir 91, p Terry, R.D., Chilingarian, G.V., Summary of Concerning some additional aids in studying sedimentary formations by M.S. Shvestsov. Journal of Sedimentary Research., Vol. 25(3), pp Tsikouras, B., Pe-Piper, G., Piper, D. J. W., & Schaffer, M Varietal heavy mineral analysis of sediment provenance, lower cretaceous scotian basin, Eastern Canada. Sedimentary Geology, Vol 238(3-4), pp Retrieved from
111 100 Wach, G Trinidad field guide. Dahousie University Department of Earth Sciences. Wade, J. A Scotian shelf lithostratigraphy: Missisauga formation. Geological Survey of Canada, Atlantic Geosciences Center. Retrieved from website: ftp://ftp2.cits.rncan.gc.ca/pub/geott/ess_pubs/210/210642/gscecbas_ss _b_1991_nt01.pdf. Wade, J.A. and MacLean, B.C., Chapter 5 - The geology of the southeastern margin of Canada, Part 2: Aspects of the geology of the Scotian Basin from recent seismic and well data. In: M.J. Keen and G.L. Williams (Eds.), Geology of Canada No.2 - Geology of the continental margin of eastern Canada. Geological Survey of Canada, p (also Geological Society of America, The Geology of North America, Vol.I-1). Wade, J.A., MacLean, B.C. and Williams, G.L.; Mesozoic and Cenozoic stratigraphy, eastern Scotian Shelf: new interpretations. Canadian Journal of Earth Sciences, vol.32, no.9, pp
112 Appendix A: Pictures of Core Boxes 101


113 102 Mobil Texaco Pex Venture B-13: Core 1 Recovered: 17.3 m Boxes 1 to 4: m to m Boxes 5 to 8: m to m Boxes 9 to 11: m to m Boxes 12 to 13: m to m


114 103
115 104 Depth interval for numbered sections Core 1 Assigned number to core section Depth Interval (m) to to to to to to to to to to to to to to to Description of core intervals for Core 2 (more detail on core-logging sheets) 1- Interbedded shale and very fine upper sands with Ophiomorpha burrows (BI:1). 2- Massive calcareous red Mudstone with minor shale Flaser bedding. 3- Light gray calcareous sandstone interlayered with shales. Coarse lower to fine upper Skolithos and Ophiomorpha burrows creating a bioturbation index of 1.A sharp contact is evident with overlaying beds. 4- Bioturbated shale (BI: 3) with Ophiomorpha and Planolites burrows. 5- Heterolithic sandstone and shale. The bottom 20 cm are shale dominated bioturbated(bi: 3) with parallel laminations sandstone. The shallow sections of this section is a very fine uppe, calcareous sandstone with some wavy beds (BI: 2) 6- Calcareous sandstone (very fine upper) with thin and parallel shale laminae. A bioturbation index of 1 is identified and a thin (2cm) bed of heavy minerals at the bottom of this section. 7- This section is composed of dark shale highlighting an obvious change in lithology. A bioturbation index of 2 to 3 is apparent. There is no reaction with hydrochloric acid. 8- A primary composition of calcareous shale with shell fragments is observed. This section is slightly lighter in colour than section 5. Furthermore, no bioturbation is observed; however, evidence of bidirectional Flow is identified. 9- Cleaning upward highly bioturbated heterolithic to homogeneous sands (vfu-fu) with a coarsening upward sequence observed. Biotite and mica Flakes may be seen and the lithology is lighter in colour than section This is a red calcareous Fun upper (Fu) sandstone. 11- Calcareous sandstone Fu-FL that seems relatively clean when compared to rest of core.
116 Very thin laminae of shale are observed throughout. Lastly, Skolithos, Planolites and Ophiomorpha burrows are present throughout this section. 12- This section is predominantly shale with Planolites and Thalassinoides burrows filled with fine lower sandstone. 13- Interbedded oolitic limestone and non-calcareous shales. Crinoids and bivalves shell fragments were also observed. 14- Burrowed black shales with increased bioturbation towards top of section. No reaction with hydrochloric acid. 15- Oolitic limestone mixed with fine upper and fine lower sandstone. No bioturbation is observed in this section; however, some shell fossils were present. 105


117 106 Mobil Texaco Pex Venture B-13: Core 2 Recovered: 5.8m Boxes 1 to 3: m to m Boxes 4 to 5: m to m
118 107 Depth interval for numbered sections of Core 2 Assigned number to core section Depth Interval (m) to to to to to to to to to to to Description of core intervals in Core 2 (more detail on core-logging sheets) 1- Laminated shale (70%) and fine upper to medium lower sandstone (30%) are observed here. An increase of sand towards top of this section is evident. 2- Fine lower to fine upper, calcareous sandstone gritty feel with faint micaceous laminations were described for this section. There are very thin oolitic layers near top. Minimal amounts of these ooids are also present throughout section (Mu-Cl size). A sharp contact with 3 is identified. 3- Fine lower sands with parallel shale laminations. Occurrence of calcareous blebs and Skolithos and Ophiomorpha burrows (BI: 1) 4- A colour change may be seen from previous section with some small sections showing a reddish tinge. High bioturbation (BI:3) with an increased amount of Ophiomorpha and Skolithos near the top of the core. A sharp contact with 5 is identified. 5- Black oolitic limestone with medium upper to medium lower nuclei. Crinoids and shell fragments found throughout this section. 6- Fine upper sandstone with some very thin parallel micaceous laminations. A bioturbation index of 2-3 was assigned with fairly abundant Ophiomorpha burrows. There is a very sharp change from section 6 to Thin interbedded fine-lower sandstone and shale with ooids near bottom (3cm). 8- Dark oolitic limestone with medium upper to medium lower nuclei 9- Fine upper to fine lower sands with minimal shale laminae and Ophiomorpha burrows. 10- Oolitic limestone with coarse lower nuclei. This section is darker than previous oolitic section. 11- Fine upper to fine lower sand with minimal shale layers. At 15 cm, there is an 8 cm thick oolitic (CL) limestone layer.

119 108 Mobil Texaco Pex Venture B-13: Core 3 Recovered: 18.0m Boxes 1 to 3: m to m Boxes 4 to 6: m to m Boxes 7 to 9: m to m Boxes 10 to 11: m to m Boxes 12 to 13: m to m


120 109

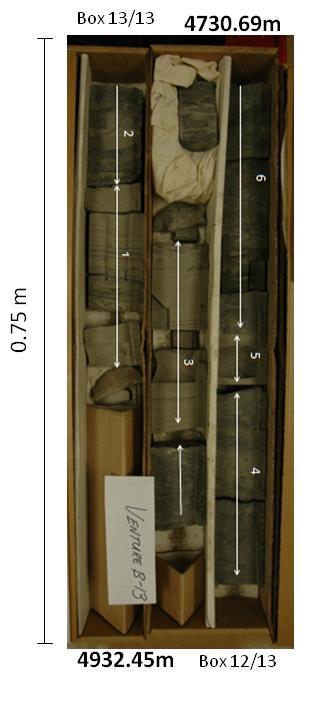
121 110
122 111 Depth interval for numbered sections Core 3 Assigned number to core section Depth Interval (m) to to to to to to to to to to to to to to to to to Description of core intervals for Core 3(more detail on core-logging sheets) 1- Fine upper, light grey sandstone interbedded with black silt laminae that are parallel towards top and borrowed towards the bottom of this section. Syndepositional slumping and loop bedding also present. Slightly argillaceous and calcareous sandstone with a red tinge in some sections as well. Possible rhythmic bedding (tidal couplets and bundles) observed. 2- A sharp change in lithology is observed from previous section. These are black shales (90%) interbedded with fine upper sandsone. Arenicolites and Planolites burrows are identified within the shale 3- Calcareous fine upper sandstone with Asterosoma and Skolithos burrows. 4- Highly bioturbated shales(bi :3) with Planolites and Ophimorpha burrows. 5- Fine upper calcareous sandstone with parallel shale laminations. A sharp change is observed with previous section. 6- Shale with a sharp scoured contact with sands from 5. A bioturbation index 2-3 is found throughout the section with increased bioturbation towards the top.
123 Fine Upper sandstone with faint fissile shale laminae and Planolites and Ophiomorpha burrows. Small garnets are found in thin <1mm shale layers 8- Consecutive sequence of interlayered/bioturbated beds of sands and shales (predominantly shales). Small garnets are found in some of the sandier layers. Thin organic bed (2mm) shiny and surrounded by yellow. 9- Fine-upper to fine-lower light grey, calcareous sandstone with minimal shell fragments. Muscovite and biotite are present throughout this section in thin laminae. Some argillaceous sections are also observed. 10- Same as 9, but slightly more pronounced dark laminae. A gradational change from fine upper to medium lower sandstone with high amounts of muscovite was present. Towards the top of the section, shale laminae begin to appear. Occurrence of garnets, as well as Ophiomorpha and Rosselia socialis burrows are characteristics of this section. 11- Coarser grained calcareous and argillaceous sandstone with good porosity. 12- Yellow to gray coarse grained micaceous sandstone. Some parallel shale laminae were evident (shale ~1mmx20). 13- Black shale with no observable bioturbation. 14- Coarsening upward sequence (medium upper to coarse upper) of sandstone. The shale laminae in this section are parallel and slightly dipping (<3 o ). 15- Coarse lower to coarse upper sandstone. No laminations and minimally argillaceous. 16- Sharp erosive change from previous section. Light grey with fine upper to medium lower grained sands and parallel micaceous laminae. 17- Shale with no observable bioturbation

124 113 Mobil Texaco Pex Venture B-13: Core 4 Recovered: 18.3m Boxes 1 to 3: m to m Boxes 4 to 6: m to m Boxes 7 to 9: m to m Boxes 10 to 11: m to m Boxes 12 to 13: m to m


125 114


126 115
Dalhousie University- Petroleum Geoscience Field Methods- Trinidad Summary Report
 Dalhousie University- Petroleum Geoscience Field Methods- Trinidad Summary Report Submitted to: Offshore Energy Research Association of Nova Scotia (OERA) To fulfill requirements of the Undergraduate Student
Application of Predictive Modeling to the Lower Cretaceous Sedimentary Sequences of the Central Scotian Basin
 Application of Predictive Modeling to the Lower Cretaceous Sedimentary Sequences of the Central Scotian Basin Christopher R. Sangster 1, Nicolas Hawie 2, Georgia Pe-Piper 1, Francky Saint-Ange 2, David
High-resolution Sequence Stratigraphy of the Glauconitic Sandstone, Upper Mannville C Pool, Cessford Field: a Record of Evolving Accommodation
 Page No. 069-1 High-resolution Sequence Stratigraphy of the Glauconitic Sandstone, Upper Mannville C Pool, Cessford Field: a Record of Evolving Accommodation Thérèse Lynch* and John Hopkins, Department
Sediment. Weathering: mechanical and chemical decomposition and disintegration of rock and minerals at the surface
 Sediment Some basic terminology Weathering: mechanical and chemical decomposition and disintegration of rock and minerals at the surface Erosion: removal of weathered rock and minerals from one place to
Sedimentary Rocks. Origin, Properties and Identification. Geology Laboratory GEOL 101 Lab Ray Rector - Instructor
 Sedimentary Rocks Origin, Properties and Identification Geology Laboratory GEOL 101 Lab Ray Rector - Instructor Sedimentary Rock Origin and Identification Lab Pre-Lab Internet Link Resources 1) http://www.rockhounds.com/rockshop/rockkey/index.html
Sedimentary Rocks. Origin, Properties and Identification. Physical Geology GEOL 100. Ray Rector - Instructor
 Sedimentary Rocks Origin, Properties and Identification Physical Geology GEOL 100 Ray Rector - Instructor Sedimentary Rock Origin and Identification Lab Pre-Lab Internet Link Resources 1) http://www.rockhounds.com/rockshop/rockkey/index.html
EPS 50 Lab 4: Sedimentary Rocks
 Name: EPS 50 Lab 4: Sedimentary Rocks Grotzinger and Jordan, Chapter 5 Introduction In this lab we will classify sedimentary rocks and investigate the relationship between environmental conditions and
Sediment and sedimentary rocks Sediment
 Sediment and sedimentary rocks Sediment From sediments to sedimentary rocks (transportation, deposition, preservation and lithification) Types of sedimentary rocks (clastic, chemical and organic) Sedimentary
Sedimentology and Stratigraphy of Lower Smackover Tight Oil Carbonates: Key to Predictive Understanding of Reservoir Quality and Distribution
 Integrated Reservoir Solutions Sedimentology and Stratigraphy of Lower Smackover Tight Oil Carbonates: Key to Predictive Understanding of Reservoir Quality and Distribution Roger J. Barnaby Presented at
Sediment and Sedimentary rock
 Sediment and Sedimentary rock Sediment: An accumulation of loose mineral grains, such as boulders, pebbles, sand, silt or mud, which are not cemented together. Mechanical and chemical weathering produces
Acid Gas Injection at Deep Panuke
 Acid Gas Injection at Deep Panuke Terrance Skrypnek, Group Lead, Deep Panuke Sub-Surface Nova Scotia Energy and Research Development Forum St. Francis Xavier University, Antigonish, Nova Scotia May 21
Lab 7: Sedimentary Structures
 Name: Lab 7: Sedimentary Structures Sedimentary rocks account for a negligibly small fraction of Earth s mass, yet they are commonly encountered because the processes that form them are ubiquitous in the
Sedimentary Rocks. Origin, Properties and Identification. Physical Geology GEOL 101 Lab Ray Rector - Instructor
 Sedimentary Rocks Origin, Properties and Identification Physical Geology GEOL 101 Lab Ray Rector - Instructor Sedimentary Rock Origin and Identification Lab Pre-Lab Internet Link Resources 1) http://www.rockhounds.com/rockshop/rockkey/index.html
GEOLOGY MEDIA SUITE Chapter 5
 UNDERSTANDING EARTH, SIXTH EDITION GROTZINGER JORDAN GEOLOGY MEDIA SUITE Chapter 5 Sedimentation Rocks Formed by Surface Processes 2010 W.H. Freeman and Company Mineralogy of sandstones Key Figure 5.12
Paleo Lab #4 - Sedimentary Environments
 Paleo Lab #4 - Sedimentary Environments page - 1. CHARACTERISTICS OF SEDIMENT Grain size and grain shape: The sizes and shapes of sedimentary particles (grains) are modified considerably during their transportation
Facies Analysis Of The Reservoir Rocks In The. Sylhet Trough, Bangladesh. Abstract
 Facies Analysis Of The Reservoir Rocks In The Sylhet Trough, Bangladesh Joyanta Dutta Petroleum Geoscience Program, Department of Geology, Faculty of Science, Chulalongkorn University, Bangkok 10330, Thailand
Scotian Basin Petroleum and Source Rocks (an explorationist s perspective)
") Scotian Basin Petroleum and Source Rocks (an explorationist s perspective) David E. Brown Senior Advisor, Geology Canada-Nova Scotia Offshore Petroleum Board 21 January 2014 1 PREVIOUS RESEARCH Since early
Scotian Basin Petroleum and Source Rocks (an explorationist s perspective) David E. Brown Senior Advisor, Geology Canada-Nova Scotia Offshore Petroleum Board 21 January 2014 1 PREVIOUS RESEARCH Since early
Understanding Earth Fifth Edition
 Understanding Earth Fifth Edition Grotzinger Jordan Press Siever Chapter 5: SEDIMENTATION: Rocks Formed by Surface Processes Lecturer: H Mohammadzadeh Assistant professors, Department of Geology, FUM Copyright
Sedimentary Environments Chapter 8
 Sedimentary Environments Chapter 8 Does not contain complete lecture notes. To be used to help organize lecture notes and home/test studies. What is a sedimentary rock? Sedimentary rocks are products of
The Nature of Sedimentary Rocks
 The Nature of Sedimentary Rocks Sedimentary rocks are composed of: Fragments of other rocks Chemical precipitates Organic matter or biochemically produced materials The Nature of Sedimentary Rocks Sedimentary
Sedimentary Rocks. Weathering. Mechanical & Chemical Weathering. Sediments. Lithification. Deposition. Transport. Erosion.
 Lithification Sedimentary Rocks Sediments Deposition Transport Erosion Weathering Weathering The sediments that make up sedimentary rocks are produced by: Mechanical & Chemical Weathering Mechanical Weathering
ROCK CLASSIFICATION AND IDENTIFICATION
 Name: Miramar College Grade: GEOL 101 - Physical Geology Laboratory SEDIMENTARY ROCK CLASSIFICATION AND IDENTIFICATION PRELAB SECTION To be completed before labs starts: I. Introduction & Purpose: The
REGIONAL GEOLOGY OF THE SCOTIAN BASIN
 REGIONAL GEOLOGY OF THE SCOTIAN BASIN David E. Brown, CNSOPB, 2008 INTRODUCTION The Scotian Basin is a classic passive, mostly non-volcanic, conjugate margin. It represents over 250 million years of continuous
The impact of volcanism on reservoir quality, Scotian Basin
 The impact of volcanism on reservoir quality, Scotian Basin Georgia Pe-Piper*, Department of Geology, Saint Mary s University, Halifax, Nova Scotia, B3H 3C3, Canada gpiper@smu.ca and David J.W. Piper*,
A Regional Diagenetic and Petrophysical Model for the Montney Formation, Western Canada Sedimentary Basin*
 A Regional Diagenetic and Petrophysical Model for the Montney Formation, Western Canada Sedimentary Basin* Noga Vaisblat 1, Nicholas B. Harris 1, Vincent Crombez 2, Tristan Euzen 3, Marta Gasparrini 2,
Fluvial-Estuarine and Deltaic Reservoirs, Shelf Margin Delta and Slope Reservoir Characteristics Philip Sedore 2015
 Fluvial-Estuarine and Deltaic Reservoirs, Shelf Margin Delta and Slope Reservoir Characteristics Philip Sedore 2015 Introduction The offshore Columbus Basin and the onshore Southern Basin of Trinidad are
Lecture Outline Wednesday - Friday February 14-16, 2018
 Lecture Outline Wednesday - Friday February 14-16, 2018 Quiz 2 scheduled for Friday Feb 23 (Interlude B, Chapters 6,7) Questions? Chapter 6 Pages of the Past: Sedimentary Rocks Key Points for today Be
What is a sedimentary rock?
 Sedimentary Rocks What is a sedimentary rock? Sedimentary rocks are products of mechanical and chemical weathering They account for only 5% of the top 10 miles of the outer crust, yet most of the earth
UNIT 4 SEDIMENTARY ROCKS
 UNIT 4 SEDIMENTARY ROCKS WHAT ARE SEDIMENTS Sediments are loose Earth materials (unconsolidated materials) such as sand which are transported by the action of water, wind, glacial ice and gravity. These
Sedimentary and Stratigraphic Analysis of the Viking Sand in the Edgerton/Wainwright Area, Central Alberta* By Russell Walz 1
 Sedimentary and Stratigraphic Analysis of the Viking Sand in the Edgerton/Wainwright Area, Central Alberta* By Russell Walz 1 Search and Discovery Article #50030 (2006) Posted June 25, 2006 *Extended abstract
Sediments and Sedimentary Rocks
 Sediments and Sedimentary Rocks (Shaping Earth s Surface, Part 2) Science 330 Summer 2005 What is a sedimentary rock? Products of mechanical and chemical weathering Account for about 5 percent of Earth
GEOL Lab 9 (Carbonate Sedimentary Rocks in Hand Sample and Thin Section)
") GEOL 333 - Lab 9 (Carbonate Sedimentary Rocks in Hand Sample and Thin Section) Sedimentary Rock Classification - As we learned last week, sedimentary rock, which forms by accumulation and lithification
GEOL 333 - Lab 9 (Carbonate Sedimentary Rocks in Hand Sample and Thin Section) Sedimentary Rock Classification - As we learned last week, sedimentary rock, which forms by accumulation and lithification
GeoCanada 2010 Working with the Earth
 Lithofacies Identification and the Implications for SAGD Well Planning in the McMurray Formation, Christina Lake Area, Alberta Travis Shackleton*, Robert Gardner, Sung Youn, Grace Eng and Lori Barth Cenovus
Geologic influence on variations in oil and gas production from the Cardium Formation, Ferrier Oilfield, west-central Alberta, Canada
 Geologic influence on variations in oil and gas production from the Cardium Formation, Ferrier Oilfield, west-central Alberta, Canada Marco Venieri and Per Kent Pedersen Department of Geoscience, University
PROCEEDINGS, INDONESIAN PETROLEUM ASSOCIATION Forty-First Annual Convention & Exhibition, May 2017
 IPA17-369-SG PROCEEDINGS, INDONESIAN PETROLEUM ASSOCIATION Forty-First Annual Convention & Exhibition, May 2017 FACIES ANALYSIS OF LATE NEOGENE DEPOSIT: MARINE TO CONTINENTAL ENVIRONMENT OF THE MERAPI
Petroleum geology framework, West Coast offshore region
 Petroleum geology framework, West Coast offshore region James W. Haggart* Geological Survey of Canada, Vancouver, BC jhaggart@nrcan.gc.ca James R. Dietrich Geological Survey of Canada, Calgary, AB and
Sedimentología Ayudantía Lectura 1 Carbonate minerals
 Carbonate minerals The most common minerals in this group are the calcium carbonates, calcite and aragonite, while dolomite (a magnesium calcium carbonate) and siderite (iron carbonate) are also frequently
The Eocene Gir Formation of the Ghani and Ed Dib Fields, Eastern Libya - an example of "Virtual Core Study"
 The Eocene Gir Formation of the Ghani and Ed Dib Fields, Eastern Libya - an example of "Virtual Core Study" Henry Williams*, Suncor Energy Inc., Calgary, AB hwilliams@suncor.com Summary The Gir Formation
MUHAMMAD S TAMANNAI, DOUGLAS WINSTONE, IAN DEIGHTON & PETER CONN, TGS Nopec Geological Products and Services, London, United Kingdom
 Geological and Geophysical Evaluation of Offshore Morondava Frontier Basin based on Satellite Gravity, Well and regional 2D Seismic Data Interpretation MUHAMMAD S TAMANNAI, DOUGLAS WINSTONE, IAN DEIGHTON
Facies Analysis of the Lower Cretaceous Wilrich Member (Lower Falher) of the Spirit River Formation.
 of the Spirit River Formation.") Facies Analysis of the Lower Cretaceous Wilrich Member (Lower Falher) of the Spirit River Formation. Kerrie L. Bann, Ichnofacies Analysis Inc. and Daniel J. K. Ross, Tourmaline Oil Corp. Historically,
Facies Analysis of the Lower Cretaceous Wilrich Member (Lower Falher) of the Spirit River Formation. Kerrie L. Bann, Ichnofacies Analysis Inc. and Daniel J. K. Ross, Tourmaline Oil Corp. Historically,
The boundary between two formations (or any distinct layers) is called a contact. Sedimentary rocks cover 75% of continents.
 is called a contact. Sedimentary rocks cover 75% of continents.") Sedimentary Rocks Sedimentary rocks form at the Earth s surface through interactions of the hydrologic system and the crust. Fortunately, many of these processes are in operation today, and geologists
Sedimentary Rocks Sedimentary rocks form at the Earth s surface through interactions of the hydrologic system and the crust. Fortunately, many of these processes are in operation today, and geologists
2003 GCSSEPM Foundation Ed Picou Fellowship Grant for Graduate Studies in the Earth Sciences Recipient
 2003 GCSSEPM Foundation Ed Picou Fellowship Grant for Graduate Studies in the Earth Sciences Recipient Tarek A. El Shayeb University of Texas at Austin Integrated reservoir characterization and 3-D diagenetic
EARTH SURFACE PROCESSES AND SEDIMENTATION!
 Sed and Strat EARTH SURFACE PROCESSES AND SEDIMENTATION! 2/27 Lecture 7- Exposure: Weathering and the Sediment Factory 3/04 Lecture 8 - Rivers and Landscapes 3/06 Lecture 9 - Waves (not Tides) 3/11 Lecture
Sedimentology & Stratigraphy. Thanks to Rob Viens for slides
 Sedimentology & Stratigraphy Thanks to Rob Viens for slides Sedimentology The study of the processes that erode, transport and deposit sediments Sedimentary Petrology The study of the characteristics and
Relationships of the Ordovician. Appalachian Basin. June 21, 2011
 Regional Stratigraphic and Facies Relationships of the Ordovician Utica/Point i t Pleasant Interval in the Appalachian Basin June 21, 2011 Ron Riley and Mark Baranoski Stratigraphic Correlation Chart Modified
Burrow-Mottled Carbonates in the Devonian Wabamun Formation, Pine Creek Gas Field, Alberta, Canada
 Page No. 142-1 Burrow-Mottled Carbonates in the Devonian Wabamun Formation, Pine Creek Gas Field, Alberta, Canada Gladys Fong Department of Earth and Atmospheric Sciences University of Alberta, Edmonton,
402: Sedimentary Petrology
 UNIVERSITY OF SOUTH ALABAMA 402: Sedimentary Petrology Lecture 14: Siliciclastic Diagenesis Instructor: Dr. Douglas W. Haywick Last Time (online) Immature siliciclastic sediment and sedimentary rocks Pictorial
The Clearwater Formation: A Facies Study for SAGD Water Source in the Athabasca Oil Sands
 The Clearwater Formation: A Facies Study for SAGD Water Source in the Athabasca Oil Sands Wallace, J. and Lavigne, J Introduction Water source has become an increasingly important issue recently with the
Chapter 6 Sedimentary and Metamorphic Rock
 Chapter 6 Sedimentary and Metamorphic Rock Weathering and Erosion Wherever rock is exposed at Earth s surface, it is continuously being broken down by weathering a set of physical and chemical processes
ESC102. Sedimentary Rocks. Our keys to the past. Monday, February 11, 13
 ESC102 Sedimentary Rocks Our keys to the past Sedimentary Rocks Sedimentary rocks are rocks that form through the accumulation of sediment and the process of lithification. Lithification occurs after deposition
Mud Sand Gravel. Clastic Textures
 Sed Rocks Self-Instruction Lab Name Geology 100 Harbor Section Please see the questions online before you begin. Sedimentary rocks are usually identified in the field by their stratification or layering,
Mud Sand Gravel. Clastic Textures
 Sed Rocks Self-Instruction Lab Name Geology 100 Harbor Section Read the sedimentary rocks chapter before you start. Sedimentary rocks are usually identified in the field by their stratification or layering,
Appraising a late-middle-aged Brent Group field
 Appraising a late-middle-aged Brent Group field Reservoir learnings after nearly 20 years of Pelican field production Jill Marriott The Pelican Field The Pelican oil field is nearly 20 years old It is
Bikashkali Jana*, Sudhir Mathur, Sudipto Datta
 10 th Biennial International Conference & Exposition P 354 Facies characterization of a low permeability Cretaceous clastic reservoir to understand reservoir spatial distribution in the Nagayalanka Field,
Sedimentary rocks. Mechanical Weathering. Weathering. Chemical weathering. Rates of weathering. Fossil Fuel Resources. Two kinds of weathering
 Sedimentary rocks Fossil Fuel Resources Exam next Tuesday February 14 Bring Scantron and Review Questions About 75% of all rock outcrops on the continents Important to reconstruct much of Earth's history
Accommodation. Tectonics (local to regional) Subsidence Uplift
 Subsidence Uplift") Accommodation Accommodation varies over time; it is the distance between a reference horizon and the sea surface (i.e. relative sea level). The space to be filled in with sediments or water What are the
Accommodation Accommodation varies over time; it is the distance between a reference horizon and the sea surface (i.e. relative sea level). The space to be filled in with sediments or water What are the
Geology 252, Historical Geology, California State University, Los Angeles - professor: Dr. Alessandro Grippo
 LAB # 1 - CLASTIC ROCKS Background: - Mechanical and Chemical Weathering - Production of Clastic Sediment - Classification of Sediment according to size: Gravel, Sand, Silt, Clay - Erosion, Transportation
OETR ova Scotia Pay Fairway Analysis - summary. Matt Luheshi Halifax 21 st January 2014
 OETR 2009-2011 ova Scotia Pay Fairway Analysis - summary Matt Luheshi Halifax 21 st January 2014 2007 Gap Analysis Technical Issues Nova Scotia Geoscience Gap Analysis Issues How good is the source rock
BALOCHISTAN FOLDBELT BASIN
 INTRODUCTION BALOCHISTAN FOLDBELT BASIN The Kharan-3 block is located in the Kharan Trough of Balochistan Basin. GEOLOGICAL SETTING The Balochistan Province is an Upper Cretaceous to Recent structurally
1/31/2013. Weathering Includes Physical, Chemical, Biological processes. Weathering Mechanisms. Wind abrasion forming Ventifacts
 Monument Valley, Utah. What weathering processes contributed to the development of these remarkable rock formations? Weathering Includes Physical, Chemical, Biological processes Weathering Mechanisms Physical
Chapter 5. The Sedimentary Archives
 Chapter 5 The Sedimentary Archives Factors affecting Sedimentary Characteristics 1. Tectonic setting 2. Physical, chemical, and biological processes in the depositional environment 3. Method of sediment
Image: G. Parker. Presenters: Henry Chan, Kayla Ireland, Mara Morgenstern, Jessica Palmer, Megan Scott
 Image: G. Parker Presenters: Henry Chan, Kayla Ireland, Mara Morgenstern, Jessica Palmer, Megan Scott Is the Ross Formation a suitable analog for sand-rich turbidite plays in passive margin basins? Play:
PETROLEUM GEOSCIENCE FIELD METHODS: TRINIDAD SUMMARY REPORT
 PETROLEUM GEOSCIENCE FIELD METHODS: TRINIDAD SUMMARY REPORT Submitted to: Offshore Energy Research Association of Nova Scotia (OERA) to fulfill the requirements of the Graduate Student Research Travel
ES120 Sedimentology/Stratigraphy
 Midterm Exam 5/05/08 NAME: 1. List or describe 3 physical processes that contribute to the weathering of rocks (3pts). exfoliation frost wedging many others. roots, thermal expansion/contraction also credit
Reservoir Rock Properties
 Reservoir Rock Properties From here on, sedimentology and petrophysics are important for a good understanding of the course material. I realize that not everybody has a solid background in these fields,
Fusselman/Devonian Study. of the Midland Basin, Texas
 Fusselman/Devonian Study of the Midland Basin, Texas Fusselman-Devonian Study of the Midland Basin, Texas Overview The Fusselman-Devonian study of the Midland Basin is designed to enhance both exploration
Calcite Cements in Middle Devonian Dunedin Formation:
 Geochemistry of the Fracture-Filling Dolomite and Calcite Cements in Middle Devonian Dunedin Formation: Implication for the Strata Dolomitization Model Sze-Shan Yip 1, Hairuo Qing 1 and Osman Salad Hersi
Your teacher will show you a sample or diagram of each, and show you a settling column. Draw these, and label your diagrams (8 pts) Ungraded:
 Ungraded:") From Sand to Stone: How do we recognize and interpret sedimentary rocks in the rock record? (Based closely on the University of Washington ESS 101 Lab 5: Sedimentary Rocks) Introduction: This lab consists
From Sand to Stone: How do we recognize and interpret sedimentary rocks in the rock record? (Based closely on the University of Washington ESS 101 Lab 5: Sedimentary Rocks) Introduction: This lab consists
SEDIMENTARY ROCKS. Processes, Environments, Structures and Rocks. Sedimentary Processes and Rocks
 SEDIMENTARY ROCKS Processes, Environments, Structures and Rocks Sedimentary Processes and Rocks Origins of Sedimentary Rocks Sediment transport and texture Sedimentary structures Lithification Classifying
The North Dakota Bakken Play - Observations. Julie A. LeFever North Dakota Geological Survey
 The North Dakota Bakken Play - Observations Julie A. LeFever North Dakota Geological Survey The Basics Bakken Formation in North Dakota Upper & Lower Black Shale World Class Source Rock TOC s as high as
David Piper and Atika Karim ABSTRACT
 David Piper and Atika Karim ABSTRACT Hyperpycnal flow deposits, or delta-front turbidites, are becoming increasingly recognised as important components of some deltaic systems. The presence of Bouma Tabce
Tim Carr - West Virginia University
 Tim Carr - West Virginia University Exploration s Ultimate Goal is to Answer Four Questions: Where to Drill? What to Expect? How Certain? How Profitable? Location & Depth HC Volumes Chance of Success
Aptian/Albian Reservoir Development in the Jeanne d Arc Basin, Offshore Eastern Canada
 Aptian/Albian Reservoir Development in the Jeanne d Arc Basin, Offshore Eastern Canada Jonathan Marshall, Statoil Canada Ltd. Calgary, Alberta, Canada. jomars@statoil.com Introduction: The Jeanne d Arc
The Eocene Gir Formation of the Ghani and Ed Dib Fields, Eastern Libya -An example of "Virtual Core Study"*
 The Eocene Gir Formation of the Ghani and Ed Dib Fields, Eastern Libya -An example of "Virtual Core Study"* Henry Williams 1 Search and Discovery Article #20288 (2014) Posted December 29, 2014 *Adapted
Meandering Miocene Deep Sea Channel Systems Offshore Congo, West Africa
 Meandering Miocene Deep Sea Channel Systems Offshore Congo, West Africa S. Baer* (PGS), J. E. Comstock (PGS), K. Vrålstad (PGS), R. Borsato (PGS), M. Martin (PGS), J.P. Saba (SNPC), B. Débi-Obambé (SNPC)
NC Earth Science Essential Standards
 NC Earth Science Essential Standards EEn. 2.1 Explain how processes and forces affect the Lithosphere. EEn. 2.1.1 Explain how the rock cycle, plate tectonics, volcanoes, and earthquakes impact the Lithosphere.
APPENDIX C GEOLOGICAL CHANCE OF SUCCESS RYDER SCOTT COMPANY PETROLEUM CONSULTANTS
 APPENDIX C GEOLOGICAL CHANCE OF SUCCESS Page 2 The Geological Chance of Success is intended to evaluate the probability that a functioning petroleum system is in place for each prospective reservoir. The
Call for Bids NS18-3 Seismic Interpretation, well summaries, source rock, and exploration leads in the Central Scotian Shelf, Sable Subbasin.
 Call for Bids NS18-3 Seismic Interpretation, well summaries, source rock, and exploration leads in the Central Scotian Shelf, Sable Subbasin. Brenton M. Smith*, Kris Kendell, David Brown, Carl Makrides,
Chapter 6 Pages of Earth s Past: Sedimentary Rocks
 Chapter 6 Pages of Earth s Past: Sedimentary Rocks Introduction! Drilling into the bottom of the North Sea, we encounter: " Soft mud and loose sand, silt, pebbles, and shells. Then: " Similar materials
Orphan Basin, Offshore Newfoundland: New seismic data and hydrocarbon plays for a dormant Frontier Basin
 Orphan Basin, Offshore Newfoundland: New seismic data and hydrocarbon plays for a dormant Frontier Basin Jerry Smee* G&G Exploration Consulting, 301 400-3rd Avenue SW, Calgary, AB, T2P 4H2 Sam Nader, Paul
Chapter 10. Chapter Rocks and the Rock Cycle. Rocks. Section 1 Rocks and the Rock Cycle
 Chapter 10 Rocks 1 Chapter 10 Section 1 Rocks and the Rock Cycle 2 10.1 Rocks and the Rock Cycle Magma is the parent material for all rocks. Once the magma cools and hardens, many changes can occur. Geology:
Clastic Textures. I. What is the sorting of sample numbers 60, 61, and 62? Answers on last page.
 Sed Rock s Sel f-instruction N ame Geology 100 Harbor Secti on Sedimentary rocks are usually identified in the field by their stratification or layering, which originates by the successive deposition of
Viking Lowstand Deposits in West Central Saskatchewan: Depositional Model for the Reservoir Units in Dodsland-Hoosier Area, Saskatchewan, Canada
 Viking Lowstand Deposits in West Central Saskatchewan: Depositional Model for the Reservoir Units in Dodsland-Hoosier Area, Saskatchewan, Canada Hasan Ferdous* PetroSed Geoconsulting Resources, Calgary,
Ministry of Oil and Minerals Petroleum Exploration & Production Authority BLOCK 6 (Iryam)
") Ministry of Oil and Minerals Petroleum Exploration & Production Authority BLOCK 6 (Iryam) The Iryam Block (6) occupies an area of 3,911 km 2 in the Sabatayn Basin in the province of Shabwah in central
Ministry of Oil and Minerals Petroleum Exploration & Production Authority BLOCK 6 (Iryam) The Iryam Block (6) occupies an area of 3,911 km 2 in the Sabatayn Basin in the province of Shabwah in central
2014 GRADUATE THESIS PROPOSAL
 2014 GRADUATE THESIS PROPOSAL EARTH SCIENCES 6300 NAME: Dickson, Carla DEGREE PROGRAMME: M.Sc. FIELD(S) OF SPECIALIZATION: Petroleum Geology & Petrophysics SUPERVISOR and COMMITTEE: Supervisor: Dr. Grant
DIAGENESIS OF THE BAR AIL SANDSTONES
 CHAPTER-VII DIAGENESIS OF THE BAR AIL SANDSTONES 7.1 INTRODUCTION Diagenesis is any chemical, physical, or biological change undergone by sediment after its initial deposition and during and after its
Igneous Rocks. Sedimentary Rocks. Metamorphic Rocks
 Name: Date: Igneous Rocks Igneous rocks form from the solidification of magma either below (intrusive igneous rocks) or above (extrusive igneous rocks) the Earth s surface. For example, the igneous rock
To get you thinking Explain how these different layers of rock formed? Why are these layers different colors? Sedimentary Rocks
 To get you thinking Explain how these different layers of rock formed? Why are these layers different colors? Sedimentary Rocks Bryce Canyon, Utah Badlands, South Dakota Weathering Whenever rock is exposed
Jordan. Target Exploration. Target Exploration
 Page1 barr Target Exploration Target Exploration barr Target Exploration Target Exploration Petroleum Potential of Wadi Sirhan Basin Jordan Petroleum Potential of Wadi Sirhan Basin, Jordan Sequence Stratigraphy,
Devonian Petroleum Systems and Exploration Potential, Southern Alberta, Part 3 Core Conference
 Devonian Petroleum Systems and Exploration Potential, Southern Alberta, Part 3 Core Conference Andy Mort (1), Leonard Stevens (2), Richard Wierzbicki (2) Abstract Part 1: Devonian Petroleum Systems Dr.
Bowen s Chemical Stability Series
 Lab 5 - Identification of Sedimentary Rocks Page - Introduction Sedimentary rocks are the second great rock group. Although they make up only a small percentage of the rocks in the earth s crust (~5%)
GEOLOGY. Subject : GEOLOGY (For under graduate student.) Paper No. : Paper 02 Introduction to Geology 02
 Paper No. : Paper 02 Introduction to Geology 02") GEOLOGY Subject : GEOLOGY (For under graduate student.) Paper No. : Paper 02 Introduction to Geology 02 Topic No. & Title : 56 Structure of Sedimentary Rocks Frequently Asked Questions FAQ s Que 01. What
GEOLOGY Subject : GEOLOGY (For under graduate student.) Paper No. : Paper 02 Introduction to Geology 02 Topic No. & Title : 56 Structure of Sedimentary Rocks Frequently Asked Questions FAQ s Que 01. What
Igneous Rocks. Sedimentary Rocks
 Earth Sciences 083F Plate Tectonics Exercises Plate tectonics is a model for the dynamic behaviour of Earth s lithosphere. Outlining stable areas of lithosphere are narrow zones (plate boundaries) in which
Relinquishment Report. for. Licence P1605, Block 220/27
 Relinquishment Report for Licence P1605, Block 220/27 November 2013 Licence P.1605 Relinquishment Report August 2012 1 of 11 CONTENT 1 Introduction 2 - Exploration Summary 2.1 Exploration Activity 2.2
Bulletin of Earth Sciences of Thailand
 Depositional Environments and Stratigraphic Development of the Grand Taman Sari Circuit Outcrop: an Analogue for Transgressive Mahakam Delta Successions Ridha Santika Riadi Petroleum Geoscience Program,
NAME: GEL 109 Final Winter 2010
 GEL 109 Final Winter 2010 1. The following stratigraphic sections represents a single event followed by the slow accumulation of background sedimentation of shale. Describe the flows that produced the
Marine Sediments. Introductory Oceanography. Ray Rector: Instructor
 Marine Sediments Introductory Oceanography Ray Rector: Instructor Ocean Basins are Vast Sinks for Huge Amounts of Sediment from Numerous Different Sources Four Major Types of Seafloor Sediments 1. Lithogenous
Lower Skinner Valley Fill Sandstones: Attractive Exploration Targets on the Northeast Oklahoma Platform*
 Lower Skinner Valley Fill Sandstones: Attractive Exploration Targets on the Northeast Oklahoma Platform* By Jim Puckette 1 Search and Discovery Article #10050 (2003) *Adapted from presentation to Tulsa
Depositional Environments. Depositional Environments
 Depositional Environments Geographic area in which sediment is deposited Characterized by a combination of geological process & environmental conditions Depositional Environments Geological processes: