An Earlier Lidar Observation of a Noctilucent Cloud above Logan, Utah (41.7º N, 111.8º W)
|
|
|
- Alfred Cooper
- 6 years ago
- Views:
Transcription
1 An Earlier Lidar Observation of a Noctilucent Cloud above Logan, Utah (41.7º N, 111.8º W) Joshua P. Herron 1 and Vincent B. Wickwar 1, Patrick J. Espy 2, and John W. Meriwether 3 1 Center for Atmospheric and Space Sciences, Utah State University, Logan, UT, USA 2 Physical Science Division, British Antarctic Survey, Cambridge, UK. 3 Department of Physics and Astronomy, Clemson University, Clemson, South Carolina Abstract. A Rayleigh-scatter lidar has been operated at the Atmospheric Lidar Observatory (ALO) on the Utah State University (USU) campus (41.7º N, 111.8º W) since August During the morning of 22 June 1995 lidar returns from a noctilucent cloud (NLC) were observed for approximately one hour, well away from the twilight periods when NLCs are visible. This detection of an NLC at this latitude shows that the first sighting in 1999 [Wickwar et al., 2002] was not a unique occurrence. This 1995 observation differs from the 1999 one in that temperatures could be deduced. Near the 83-km NLC altitude the temperatures were found to be ~20 K cooler than the 11-year June climatology for ALO. This analysis shows that these cool temperatures arose, not because the whole profile was cooler, but because of a major temperature oscillation or wave with a 24-km vertical wavelength and a ~1 km/hr downward phase speed. This NLC wave has many of the characteristics of the diurnal tide. However, the amplitude would have to be enhanced considerably. These lidar observations were supplemented by OH rotational temperature observations from approximately 87 km. These NLC observations equatorward of 50 have been suggested to be significant harbingers of global change. However, if that were the case, the mechanism is more complicated than a simple overall cooling or an
2 increase in water vapor. Accordingly, we propose enhanced generation of orographic gravity waves in the Mountain West that interact with the diurnal tide to produce the observed NLC wave. Index terms: 0305 Atmospheric Composition and Structure: Aerosols and particles (0345,4801); 0350 Atmospheric Composition and Structure: Pressure, density, and temperature; 3384 Meteorology and Atmosphere Dynamics: Waves and tides; 1640 Global Change: Remote sensing; Keywords: noctilucent clouds, summer mesosphere, mesospheric temperatures, Rayleigh lidar, global change, diurnal tide. 1. Introduction Noctilucent clouds (NLCs) typically occur during the summer months between 80 and 86 km in the polar regions or, more specifically, at latitudes greater than 50 [Gadsden and Schroder, 1989; Thomas and Olivero, 1989; Chu et al., 2003]. They most likely consist of ice particles [von Cossart et al., 1999; Hervig et al., 2001]. NLC observations are important as they may serve as tracers of global change [Thomas, 2003]. Lidar observations of NLCs provide information about their altitude, thickness, and magnitude, and about the variability of these parameters. The first reported lidar observation of an NLC below 50 was by the ALO lidar group in 1999 [Wickwar et al., 2002]. Because of the possibility that other NLCs might have been observed, but not previously identified; the entire ALO database was searched. A second event was found on 22 June 1995, four years earlier than the first reported event. The lidar and a Michelson or Fourier transform spectrometer are described in Section 2 along with their basic data reduction. The 1995 lidar observations, the special data analysis 2
3 procedures, and their results are given in Section 3. The NLC results are discussed in Section 4, and the conclusions from the observations and discussion are presented in Section Instrument Descriptions and Data Reduction The Rayleigh-scatter lidar at ALO is located in Logan, UT (41.7º N, 111.8º E) on the Utah State University (USU) campus, 1.46 km above sea level. It has been operated as much as possible since August 1993, giving rise to an extensive database of nighttime mesospheric profiles of relative densities and absolute temperatures. The lidar is a coaxial system that had a power-aperture product of 3.3 Wm 2 in The system is composed of a Spectra Physics Nd:YAG laser operating at 30 Hz generating watts at 532 nm and having a 44-cm diameter Newtonian telescope. The signals from below ~18 km are blocked by a mechanical chopper and the gain is reduced by almost 1000 by an electronic gate for altitudes below 38 km, leading to good data above 45 km. A narrow-band interference filter (1 nm) is used to remove most of the background light from stars, moon, and scattered city lights. The single, gated detector is a green-sensitive, bialkali photomultiplier tube (Electron Tubes 9954B) in a Peltier-cooled housing. A more extensive description of this system is given in Wickwar et al. [2001] and Herron [2004]. The observations were made in the zenith with an altitude resolution of 37.5 m (250-ns sampling interval) and a temporal resolution of 2 minutes (3600 laser pulses). In the usual data reduction, the data are averaged over 3 km and 1 hour prior to determining relative densities and temperatures. When the signal from the background light and thermionic emission, determined 3
4 near km, is subtracted from the observed signal and the difference is multiplied by the square of the range, the result is usually proportional to the molecular density. However, the exception, discussed in the next section, occurs when an NLC is present and added signal is generated by Mie scattering from ice crystals. Temperatures are determined from the relative densities by using hydrostatic equilibrium and the ideal gas law. The details, as applied to this lidar, are reviewed in Herron [2004] and Herron and Wickwar [2006]. However, this data reduction procedure had to be modified to find temperatures in the presence of the NLC. This special analysis is described in the next section. Temperature data were also available for June 1995 and June 1996 from a Michelson interferometer (Bomem) that was located approximately 100 m from the lidar and also observing in the zenith. Temperatures were derived at roughly 10-minute intervals from the rotational structure of the OH(3,1) Meinel band [Espy and Stegman, 2002]. They apply to approximately 87 km, the altitude of the centroid of the OH airglow emission layer [von Zahn et al., 1987; Baker and Stair, 1988; She and Lowe, 1998]. The precision of the individual temperature determinations is, on average, 3%, and a minimum of ten measurements are used to determine a nightly average. Unfortunately, because of uncertainties in the OH transition probabilities [e.g., Burns et al., 2003], the OH rotational temperatures cannot be compared directly to the kinetic temperatures from the lidar. However, temporal variations in the OH temperatures are reliable. 3. Observations and Data Analysis During the early morning hours of 22 June 1995 the lidar was operated from 6:31 UT (00:31 Mountain Daylight Time, MDT) until 10:55 UT (04:55 MDT). An enhancement in the 4
5 photocount profile above what was expected from Rayleigh scatter alone was observed between 7:54 and 8:48 UT and more weakly between 9:25 and 9:40 UT. It is presumed that these enhancements arose from Mie scatter from an NLC. These time periods with the Mie scattering correspond to solar depression angles from 21.5º to 11.2º, giving shadow heights from ~450 to 120 km. Accordingly the cloud was in the Earth s shadow and could not be observed from the ground. Nonetheless, we still take the liberty of calling it an NLC. The lidar photocount profiles typically include contributions from background light and photomultiplier-tube dark count as well as from Rayleigh backscatter, which is proportional to atmospheric density. When an NLC is present, there is an additional contribution from Mie scatter, which is seen as an enhancement in the photocount profile in Figure 1a. The signal from the peak of the NLC layer is equivalent to the Rayleigh-scatter signal at an altitude of ~70 km. The backscatter ratio R (z) is commonly used as a measure of the NLC strength. It is the ratio of the measured signal S (z) to the Rayleigh-backscattered signal S R (z) : S( z) SR ( z) + Sm( z) R( z) = = (1) S ( z) S ( z) R R where S m (z) is the Mie-backscattered signal. To reduce the variability, the photocount profiles were smoothed using a 2-D boxcar average in altitude and time. To minimize distorting the NLC parameters, the averaging was carried out over only 4 points in altitude (150 m) and 6 points in time (12 minutes). However, the profile for the Rayleigh-scattered signal S R used to 5
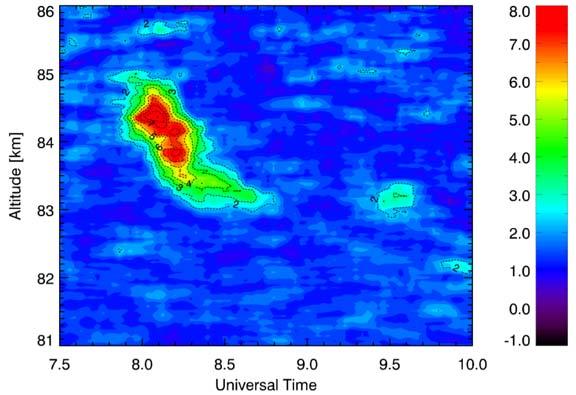
6 calculate the backscatter ratio R in Equation 1 was found by averaging all the periods without evidence of the NLC during the night of 22 June. To further minimize the possibility of contamination by Mie scatter, a smoothing function was used to approximate the Rayleighscattered signal in the region of the NLC. This function was a 3 rd order polynomial fitted to the natural log of the photocounts at 150-m intervals from 75 to 78 km and from 84 to 87 km, excluding the region of the NLC. The backscatter ratios were found every 2 minutes, but because of the 12-minute smoothing, independent points were found every 12 minutes. The maximum backscatter ratio for the NLC, 8.2, occurred at both 8:13 UT and 8:21 UT, and the first of these is shown in Figure 1b. Similar 12-minute profiles calculated every 2 minutes were used to create a contour plot of the backscatter ratio, Figure 2. The main body of the NLC occurred between 7:54 and 8:48 UT. An additional small enhancement in the backscatter ratio occurred between 9:25 and 9:40 UT at ~83 km. The peak of the NLC layer, derived from the calculations used to make Figure 2, follows a downward progression with an apparent velocity of km/hr or -27 cm/s, which is similar to other NLC observations [Wickwar et al., 2002; Collins et al., 2003]. At the height of the NLC, the diameter of the laser beam is ~40 m, which means that only a very small portion of the cloud is sampled at any instant. Furthermore, the beam is fixed in the zenith direction preventing any knowledge of the horizontal extent or structure of the cloud. Accordingly, it is not possible to distinguish between a layer descending in the beam and a slanted layer being transported horizontally across the beam. 6
7 To determine density and temperature profiles, the individual two-minute profiles are also averaged together during three periods. The first period extends from the start of observations for the night to shortly before the start of the NLC observations; the second encompasses the period when the NLC was observed; and the third spans the time from after the NLC to shortly before dawn. The first and third periods have no NLC enhancement and were used to examine fitting routines for interpolating across the NLC in the second period. Several low-order polynomials were fitted over the same region used in calculating the backscatter ratio, but with independent points every 37.5 m. A 3 rd order polynomial fitted to the log of the average photocount profile produced a reasonable fit and higher orders did not significantly improve 2 the χ values. This fit was used in the second period to interpolate across the NLC region. These curves were then smoothed in altitude with a running boxcar average over 81 points (3 km) and the results used to calculate the relative density profile. The first two relative density profiles are shown in Figures 3(a) and (b). The black curves are the observed relative density. The red curves are a combination of the observations and the fits. In Part (a) the red and black curves are almost indistinguishable, whereas in Part (b) the red curve smoothly bridges the region under the black NLC curve. The fitted profiles are then used to calculate the corresponding temperature profiles, which are shown in Figure 4. To our knowledge, this is the first time Rayleigh-scatter temperatures have been derived in the presence of an NLC. However, steps in this direction have been taken by others. Collins et al. [2003] interpolated across the NLC layer to calculate the backscatter ratio, but only calculated temperatures below the NLC layer. Lübken et al. [1996] interpolated lidar measurements across the NLC region to find the molecular signal for calculating the backscatter 7
8 ratio when additional density measurements were not available from falling spheres. Stebel et al. [2004] interpolated across a possible wintertime aerosol layer at lower altitudes to calculate Rayleigh temperatures. To derive absolute temperatures from the relative density profiles, a best guess temperature is needed at the highest altitude. The highest altitude, in this analysis, is determined to be the point where the signal has dropped to 20 times its one standard-deviation uncertainty. The best guess value was taken from the temperature climatology from the Colorado State University (CSU) sodium lidar [She et al., 2000]. While this is a climatological value, it is still the best source available for a particular night. The temperature uncertainties are from a full error propagation starting from the observed photocounts [Herron, 2004]. The temperature profiles for the three periods are shown in Figure 4 along with the 11-year, June climatological average for ALO [Herron and Wickwar, 2006]. The minimum temperatures for all three profiles are found between 82 and 87 km and are considerably colder than for the June climatological average. The second and third profiles reached a minimum value of ~150 K in this region. The first period was slightly warmer. In contrast, between 65 and 80 km, the three temperature profiles are significantly warmer than the climatological average. The differences between these temperature profiles and the June climatological average are presented in Figure 5. Between 80 and 88 km the temperatures are 10 to 20 K cooler, and between 65 and 80 km they are ~17 K warmer. The departures from the June average are clearly the result of a large vertical temperature oscillation or wave. 8
9 To provide context for the NLC observations, additional temperature measurements would be desirable. Unfortunately, the lidar was not operated on other nights close to 22 June. However, as discussed in the previous section, a Bomem Michelson interferometer was operated at USU during June 1995 and Temperatures from these observations are shown in Figure 6. It is apparent that the all-night temperatures from 19 to 24 June 1995 are particularly cool and that the temperature for 22 June 1995 is significantly cooler than for all the other nights. In addition the June 1995 nights are systematically cooler than the June 1996 nights, a difference that is within the range of interannual variation seen in the lidar temperatures. These temperature differences indicate that 22 June 1995 is an unusually cold night. Temperatures from the Bomem are also available at sub-hour intervals, as shown for 22 June 1995 in Figure 7. The temperatures dropped quickly after 05:00 UT to a minimum at 06:10 UT and then returned to a level less than the initial one. Compared to this later level, the minimum temperature was ~30 K less. This variation suggests a wave in time with high values initially, followed by low values, which would be consistent with the descent of the type wave seen in the lidar profiles. The amplitude of the negative portion of the wave is even greater than deduced for the lidar data. Ignoring holes in the data, the lowest temperatures were observed ~2 hours before the appearance of the NLC in the lidar data and at ~2 km above the altitude of the NLC. The differences between each of the three temperature profiles and the June climatology, Figure 5, show a large temperature oscillation or wave with a vertical half-wavelength of ~12 km. It gives rise to unusually low temperatures at ~85 km and elevated temperatures at ~73 km. 9
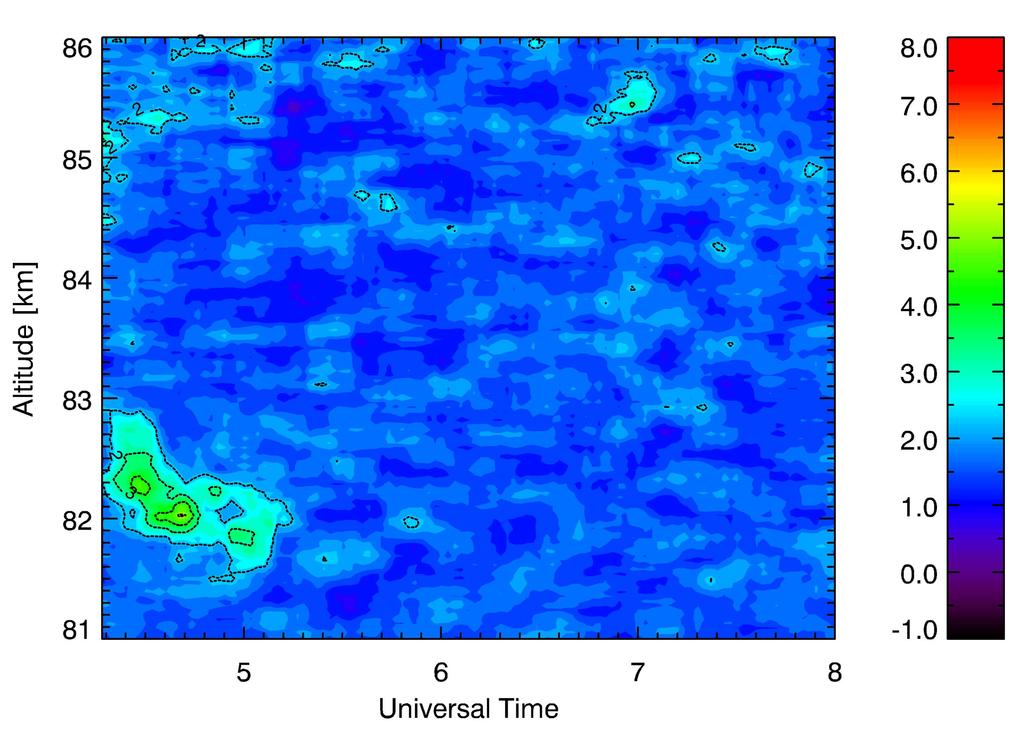
10 A large oscillation in time is also observed in the OH temperatures, but at a slightly higher altitude and with a temperature minimum ~2 hours prior to the NLC observation. If these are two manifestations of the same wave, then it descends at a rate of ~1 km/hr. Alternatively, if the altitude of the maximum backscatter ratio for each 12-minute vertical profile is fitted with a linear regression, an apparent descent rate of ~0.96 km/hr is found. Thus, if the NLC is at the backscatter maxima, it descends at approximately 1 km/hr. In addition, the downward phase velocity of the wave can also be estimated by comparing the first and third temperature profiles. The best match is obtained by lowering the altitude of the first profile by 3.0 km. The center times differ by 2.6 hours, giving a downward phase velocity of 1.15 km/hr. Thus, three different approaches all suggest a downward phase velocity for the wave of approximately 1 km/hr. 4. Discussion To better compare the two sets of NLC observations made with the ALO lidar, the results from the 1999 NLC were re-analyzed using the same temporal and spatial averaging as the 1995 NLC, Figure 8. The 1995 NLC occurs at a higher altitude (centroid height of 83.9 versus 82.1 km) and has a greater maximum backscatter ratio. It was 8.2, 60% greater than the maximum of 5.1 reached by the 1999 NLC. This does not mean that the 1995 NLC backscattered 60% more light. Part of this greater backscatter ratio occurs because the Rayleigh contribution to the backscatter ratio (the denominator in Equation 1) is smaller at the higher altitude. By using the relative density profile, the backscatter ratio of 8.2 at 83.6 km translates to 6.1 at 82.1 km, only 20% greater than that of the 1999 observation, assuming the same neutral densities at 82.1 km on both occasions. Thus the biggest difference between the two NLCs is that the one in 1995 was 1.8 km higher. The magnitudes of both these NLCs are weak compared to those observed at 10
11 higher latitudes where the backscatter ratio can be greater than 200 [e.g., Fiedler et al., 2003; Hansen et al., 1989; Langer et al., 1995; Thayer et al., 1995]. A strong linear trend in NLC altitude versus latitude has been found for NLC events [von Zahn and Berger, 2003; Chu et al., 2004]. The 1999 NLC shows a mean altitude of 82.1 km, which is in very good agreement with that linear trend. However, the mean height of the 1995 NLC was 83.9 km, 1.8 km higher, in disagreement with the linear trend. Whether this indicates different origins for the two NLCs is more than can be determined from the available data. However, what is clear is that the 1995 NLC does appear to be unusual in that it occurs at the trough of a large-amplitude temperature wave, which will be discussed extensively in this section. In addition to these results concerning the NLC altitude, several significant differences occurred between the 1995 and 1999 observations. In 1995 the background signal was well behaved, which is extremely important for deriving temperatures in general [Herron and Wickwar, 2006]. And, the laser had more power, which is essential for deriving temperatures above the NLC altitude. This ability to obtain temperatures in 1995 provides an important additional dimension to the NLC observations. Finally, the existence of Bomem temperature observations in 1995 provides extensive information about the temporal context of the NLC. In 1995 the difference between the three lidar temperature profiles and the June climatology, Figure 5, shows a large temperature oscillation or wave with an amplitude of ~15 K and an observed vertical half-wavelength of ~12 km, giving rise to an inferred vertical 11
12 wavelength of 24 km. This wave produces unusually low temperatures at ~85 km, where the NLC is observed, and elevated temperatures at ~73 km. The time series of OH temperatures from the Bomem from ~87 km shows a large oscillation in time with a temperature minimum ~2 hours prior to when the NLC is first observed. Assuming these are two manifestations of the same wave, then it descends ~2 km in 2 hours, or at ~1 km/hr. Call this the NLC wave. Previously, large waves with amplitudes of 20 K, such as the one accompanying this NLC, have been reported at high latitudes at NLC altitudes [von Zahn and Meyer, 1989], but not in conjunction with an NLC. In contrast, the occurrence of an NLC in the trough of a relatively small amplitude wave has been inferred [Collins et al., 2003]. It may be noteworthy that this second NLC found equatorward of 50 latitude was also found at ALO and not at one of the other Rayleigh-scatter or Na lidars operating at mid latitudes. This raises the question as to whether there could be a longitudinal effect associated with the Mountain West where ALO is located. Such an effect might arise from orographically generated gravity waves, non-migrating tides, or stationary planetary waves over this extremely mountainous region. This is consistent with a suggestion made to account for NLC formation at higher latitudes over the Rockies [Espy et al., 1995]. Temperatures, at high latitudes, from falling spheres from rockets, have shown that NLCs typically occur when the temperature is 150 K [Thomas, 1991; Lübken et al., 1996, 1999]. In contrast, at ALO the June temperature climatology, shown in Figure 4, at 85 km is ~170 K, which is significantly higher. Therefore the presence of an NLC at mid latitude indicates that something special is happening. While it is not clear what the temperatures were for the
13 NLC, the 1995 results show that a large temperature wave and possibly interannual variability combined to give a sufficiently low temperature for the NLC to form. More specifically, these combined effects could have caused the temperatures to drop low enough to start forming the NLC at 87 km or higher. The NLC particles would then become detectable in the lidar return after growth and sedimentation, which would account for the NLC appearance at a later time and a lower altitude. The appearance of NLCs at latitudes <50º N suggests a manifestation of global climate change [Thomas, 1996, 1997, 2003]. These predictions follow from model calculations based on large increases in greenhouse gases and methane leading, respectively, to a cooling in the upper mesosphere and an increase in water vapor concentration that would increase the temperature at which water vapor freezes spontaneously. However, NLCs were observed at 41.7º N at ALO in June 1995 and 1999, much sooner than predicted for the large increases in these gases to have occurred. And indeed, it is a period when the ALO temperature climatology shown in Figure 4 [Herron and Wickwar, 2006] does not show evidence of such significant cooling. Nor is there evidence of a strong increase in water vapor. Among the few observations of mesospheric water vapor, Chandra et al. [1997] and Nedoluha et al. [2003] show an inverse correlation with the variation of Lyman α during the solar cycle. This would give a small maximum in water vapor concentration in the summer of 1995, but not in If increased water vapor were the explanation in 1995, a different explanation would be needed for While possible, this seems unlikely. Trend information is not particularly clear, but appears to be considerably less than the solar cycle effect. As for episodic events, the closest Shuttle launch, which might have injected water vapor into the mesosphere, was long before this noctilucent cloud detection, 2 13
14 March Thus it is unlikely that either mesospheric cooling or increased water vapor could account for this NLC. Nonetheless, these two observations at ALO still suggest that NLCs are occurring at lower latitudes than previously. If their occurrence is related to global change, then the generation of the NLC wave observed in 1995 would have to be a manifestation of that change. The generation of the NLC wave would have to be from a more complicated mechanism than uniform mesospheric cooling. A possibility might be increased wind activity in the troposphere, which when combined with the topography of the Mountain West would lead to the generation of more gravity and mountain waves that, in turn, could interact with tides or planetary waves to produce enhanced temperature oscillations in the upper mesosphere. A potential seed for the observed wave might be an atmospheric tide. What is known about the diurnal and semidiurnal tide in this region can be compared to the observed NLC wave. Figure 9 shows the June 1995 NLC superimposed on contour plots of the diurnal temperature structure from the diurnal tide derived from the mid-latitude sodium lidars at CSU (41 N) and UIUC (40.2 N) [She et al., 2002; States and Gardner, 2000] and the Global Scale Wave Model for 2000, GSWM-00, calculations for 42 N latitude [Hagan et al., 1999; Hagan et al., 2001]. The NLC is coincident in altitude and time with the temperature minimum. However, as shown in Figure 10, this agreement is not as good for the semi-diurnal tide. The NLC occurs at a tidal minimum for the GSWM-00 model, but not for the two Na lidar observations. 14
15 Concentrating on the diurnal tide, vertical wavelengths can also be compared. The vertical wavelength of the observed wave at ALO was 24 km. When the deduced phase velocity of ~1 km/hr is applied for 24 hours, it also yields a vertical wavelength of ~24 km, which shows great internal consistency. The diurnal component of the CSU temperatures [She et al., 2002] gives a descent rate of ~0.95 km/hr, which corresponds to a vertical wavelength of ~23 km. The vertical wavelength from the Urbana data is 26 km and for the GSWM-00 calculations it is 34 km. Thus all the observations are in close agreement and the model calculations give a result that is 30 to 40% larger. Turning to the semi-diurnal tide, if the ALO descent rate of 1 km/hr is applied for 12 hours, it would give rise to a 12 km vertical wavelength instead of the observed 24 km. Thus, by themselves the ALO observations are not consistent with a semi-diurnal tide. Neither are the other observations and model calculation. Based on doubling the half wavelength, the vertical wavelength for the CSU observed semidiurnal tide is 7-km and for the GSWM-00 calculations is 16-km. These are very different from each other and both are considerably less than the observed 24-km wavelength. For the UIUC observations of the semi-diurnal tide, there is no identifiable vertical wavelength, implying a very long vertical wavelength, which is inconsistent with the CSU observations and the GSWM calculations, as well as with the 24-km wavelength observed here. Thus if one of these two tides is the seed for the NLC wave, then the diurnal tide is a much better candidate. While the phase, phase velocity, and vertical wavelength of the diurnal tide are similar to the characteristics of the observed NLC wave, the amplitude of the diurnal tide is far smaller 15
16 than the amplitude of the wave. The average amplitude of the two observed and one modeled diurnal tidal results is 4 K at the time of the NLC wave, which has an observed amplitude of 15 K. However, if the tidal amplitude could be enhanced or amplified, this difference could be accounted for. Several studies have examined the interaction of breaking gravity waves with the mean flow or the diurnal tidal winds. Walterscheid [1981] suggests a cooling high in the mesosphere. More recent works [Liu and Hagan, 1998; Liu, 2000; Liu et al., 2000] have specifically looked at the interaction with tides. While their purpose was to try to explain the temperature enhancements in mesospheric inversion layers, their mechanism may also be very applicable in this situation. Like Walterscheid [1981], they produced a cooling at higher altitudes. However, in addition, they produced a warming at lower altitudes. This might account for an enhanced diurnal tide or, in this case, the NLC wave. Although speculative, this second NLC observation at ALO is consistent with the idea of increased gravity-wave generation in the troposphere in the Mountain West, which leads to a large enhancement of the diurnal tide in the upper mesosphere. The negative portion of this enhanced tide or NLC wave then produces low enough temperatures to enable an NLC to develop. This could be a unique event from unusual local circumstances. Or, if these midlatitude NLCs are truly a recent recurring phenomenon, this could be a manifestation of climate change in the troposphere that is coupled to the mesosphere via gravity waves. 5. Conclusions Previously, we showed [Wickwar et al., 2002] the first NLC detected by lidar below 50º latitude. Here, we present the second NLC detected below 50º latitude. It was observed at the 16
17 same location on 22 June 1995 at 41.7º N. This detection was found during a systematic reanalysis of the ALO Rayleigh-scatter data searching for NLCs. While no visual observations could have been made, this is definitely another mid-latitude NLC: there is an enhanced backscatter ratio; it occurs near summer solstice; it occurs in the usual NLC altitude range; the enhancement is confined to a thin layer; this layer is located in an unusual temperature minimum; and the layer descends slowly with time. To date this is the second reported lidar observation of an NLC below 50º. It shows that the first observation was not an anomaly and further suggests that additional NLCs could have occurred at mid and lower latitudes, but were not detected. It is somewhat surprising that this second detection was from the same location in the Mountain West. To our knowledge, this June 1995 observation at ALO is the first time that Rayleigh lidar data have been analyzed for the coincident neutral temperatures. In an unexpected result, this NLC was found at the minimum of a temperature wave. It had an amplitude of ~15 K, a vertical wavelength of 24 km, and a deduced downward phase velocity was ~1 km/hr. This NLC wave was probably essential for producing the low temperatures necessary for formation of the NLC ice crystals. The temperature minimum in the wave was probably further lowered because of interannual variability. The phase, phase velocity, and vertical wavelength of this wave suggest that it is an enhanced diurnal tide. Modeling results in the literature, performed for other reasons, suggest that the diurnal tide could be significantly enhanced by interactions with gravity waves propagating from below. 17
18 While the first NLC detection led to speculation about global change having either lowered mesospheric temperatures or increased mesospheric water vapor and its freezing point, the temperatures and the NLC wave in this detection lead to different speculation. Except for the temperatures in the NLC wave, the temperatures on 22 June 1995 were very close to the climatological mean derived from observations between 1994 and These temperatures are not cold enough to produce NLCs. Thus, the NLC did not arise from overall mesospheric cooling. Possibly, its formation was helped by increased water vapor: we do not have information on that. It was definitely helped by the large amplitude wave. It lowered the temperatures to 150 K, which is typically found in the presence of NLCs at high latitudes. The speculation then has to turn to the origin of this NLC wave or to the origin of the gravity waves that led to the large enhancement of the diurnal tide. This might have been a unique event or it might be a very different manifestation of global change. The suggestion is that this event involved the coupling of all regions of the atmosphere from the troposphere to the mesopause. There may have been enhanced tropospheric winds that interacted with the topography of the Mountain West to generate enhanced gravity wave fluxes that interacted with the diurnal tide to produce the NLC wave. To further investigate the origin of these mid-latitude NLCs will require more systematic, simultaneous, long-term observations with Rayleigh-scatter lidars at ALO and other locations. As demonstrated in this detection, significant additional information can be obtained by having a cluster of instrumentation providing more extensive observations. The Bomem interferometer provided valuable, mesospheric, temperature observations. It would be valuable if other 18
19 instruments provided mesospheric wind measurements, and if others provided temperature or density measurements from the upper troposphere into the mesosphere. Acknowledgments This work was supported in part by Utah State University, NSF Grant ATM , and a scholarship from the Rocky Mountain NASA Space Consortium. The data were acquired in part with support from Utah State University, several CEDAR grants from the Atmospheric Science Division of the NSF, and NASA OSS grant NAG We greatly appreciate Dr. Maura Hagen making the GSWM-00 tidal results available on the web. References Baker, D.J., and A.T. Stair, Jr. (1988), Rocket measurements of the altitude distributions of the hydroxyl airglow, Phys. Scripta, 37, Burns, G.B., T.D. Kawahara, W.J.R. French, A. Nomura, and A.R. Klekociuk (2003), A comparison of hydroxyl rotational temperatures from Davis (69 S, 78 E) with sodium lidar temperatures from Syowa (69 S, 39 E), Geophys. Res. Lett., 30(1), 1025, doi: /2002gl Chandra, S., C.H. Jackman, E.L. Fleming, and J.M. Russell III (1997), The seasonal and long term changes in mesosphere water vapor, Geophys. Res. Lett., 24(6), , doi: /97gl Chu, X., C. Gardner, and R.G. Roble (2003), Lidar studies of interannual, seasonal, and diurnal variations of polar mesospheric clouds at the South Pole, J. Geophys. Res., 108(D8), 8447, doi: /2002jd
20 Chu, X., G.J. Nott, P.J. Espy, C.S. Gardner, J.C. Diettrich, M.A. Clilverd, and M.J. Jarvis (2004), Lidar observations of polar mesospheric clouds at Rothera, Antartica (67.5 o S, 68.0 o W), Geophys Res. Lett., 31, L02114, doi: /2003gl Collins, R.L., M.C. Kelley, M.J. Nicolls, C. Ramos, T. Hou, T.E. Stern, K. Mizutani, and T. Itabe (2003), Simultaneous lidar observations of a noctilucent cloud and an internal wave in the polar mesosphere, J. Geophys. Res., 108 (D8), 8435, doi: /2002jd Espy, P.J., and J. Stegman (2002), Trends and variability of mesospheric temperature at highlatitudes, Phys. Chem. Earth C, 27, Espy, P.J., R. Huppi, and A. Manson (1995), Large-scale, persistent latitude structures in the mesospheric temperature during ANLC-93, Geophys. Res. Lett., 22(20), , doi: /95gl Fiedler, J., G. Baumgarten, and G. von Cossart (2003), Noctilucent clouds above ALOMAR between 1997 and 2001: Occurrence and properties, J. Geophys. Res., 108(D8), 8453, doi: /2002jd Gadsden, M., and W. Schroder (1989), Noctilucent Clouds, 190 pp., Springer-Verlag, New York, NY. Hagan, M., R.G. Roble, and J. Hackney (2001), Migrating thermospheric tides, J. Geophys. Res., 106(A7), , doi: /2000ja Hagan, M., M.D. Burrage, J.M. Forbes, J. Hackney, W.J. Randel, and X. Zhang (1999), GSWM- 98: Results for migrating solar tides, J. Geophys. Res., 104(A4), , doi: /1998ja Hansen, G., M. Serwazi, and U. von Zahn (1989), First detection of a noctilucent cloud by lidar, Geophys. Res. Lett., 16(12),
21 Herron, J.P. (2004), Mesospheric Temperature Climatology above Utah State University, M.S. thesis, Utah State University, Logan. Herron, J.P., and V.B. Wickwar (2006), Rayleigh-scatter temperature climatology above the Atmospheric Lidar Observatory (ALO), Logan, Utah, To be submitted to Geophys. Res. Lett. Hervig, M., R.E. Thompson, M. McHugh, L.L. Gordley, J. Russell, and M.E. Summers (2001), First confirmation that water ice is the primary component of polar mesospheric clouds, Geophys Res. Lett., 28(6), , doi /2000gl Langer, M., K.P. Müller, and K.H. Fricke (1995), Rayleigh lidar detection of aerosol echos from noctilucent cloud altitudes at the Arctic circle, Geophys. Res. Lett., 22(4), , doi: /94gl Liu, H.-L. (2000), Temperature changes due to gravity wave saturation, J. Geophys. Res., 105(D10), , doi: /2000jd Liu, H.-L., and M.E. Hagan (1998), Local heating / cooling of the mesosphere due to gravity wave and tidal coupling, Geophys. Res. Lett., 25(15), , doi: /98gl Liu, H.-L., M.E. Hagan, and R.G. Roble (2000), Local mean state changes due to gravity wave breaking modulated by the diurnal tide, J. Geophys. Res., 105(D10), doi: /1999jd Lübken, F.-J., K.-H. Fricke, and M. Langer (1996), Noctilucent clouds and the thermal structure near the Arctic mesopause in summer, J. Geophys. Res., 101(D5), , doi: /96jd
22 Lübken, F.-J. (1999), Thermal structure of the Arctic summer mesosphere, J. Geophys. Res., 104(D8), , doi: /1999jd Nedoluha, G.E., R.M. Bevilacqua, R.M. Gomez, B.C. Hicks, J.M. Russell, and B.J. Conner (2003), An evaluation of trends in middle atmospheric water vapor as measured by HALOE, WVMS, and POAM, J. Geophys. Res, 108(D13), 4391, doi: /2002jd She, C.Y., S. Chen, Z. Hu, J. Sherman, J.D. Vance, V. Vasoli, M.A. White, J.R. Yu, and D.A. Krueger (2000), Eight-year climatology of nocturnal temperature and sodium density in the mesopause region (80 to 105 km) over Fort Collins, CO (41 N, 105 W), Geophys. Res. Lett., 27(20), , doi: /2000gl She, C.Y., S. Chen, B.P. Williams, Z. Hu, and D.A. Krueger (2002), Tides in the mesopause region over Fort Collins, Colorado (41 N, 105 W) based on lidar temperature observations covering full diurnal cycles, J. Geophys. Res., 107(D18), 4350, doi: /2001jd She, C.Y., and R.P. Lowe (1998), Seasonal temperature variations in the mesopause region at mid-latitude: comparison of lidar and hydroxyl rotational temperatures using WINDII/UARS OH height profiles, J. Atmos. Solar Terr. Phys., 60, States, R.J., and C.S. Gardner (2000), Thermal structure of the mesopause regioin ( km) at 40 N latitude. Part II: Diurnal Variations, J. Atmos. Sci., 57, Stebel, K., U. Blum, K.-H. Fricke, S. Kirkwood, N.J. Mitchell, and A. Osepain (2004), Joint radar/lidar observations of possible aerosol layers in the winter mesosphere, J. Atmos Terr. Phys., 66,
23 Thayer, J.P., N. Nielsen, and J. Jacobsen (1995), Noctilucent cloud observations over Greenland by a Rayleigh lidar, Geophys. Res. Lett., 22, , doi: /95gl Thomas, G.E., Mesospheric clouds and the physics of the mesopause region, Rev. Geophys., 29, , Thomas, G.E. (1996), Is the polar mesosphere the miner's canary of global change?, Adv. Space Res., 18(3), Thomas, G.E. (1997), Introduction to special section: Noctilucent cloud workshop, J. Geophys. Res., 102(D2), , doi: /96jd Thomas, G.E. (2003), Are noctilucent clouds harbringers of global change in the middle atmosphere?, Adv. Space Res., 32(9), Thomas, G.E., and J.J. Olivero (1989), Climatology of polar mesospheric clouds, 2. Further analysis of Solar Mesosphere Explorer data, J. Geophys Res., 94(D12), von Cossart, G., J. Fiedler, and U. von Zahn (1999), Size distribution of NLC particles as determined from 3-color observations of NLC by ground lidar, Geophys. Res. Lett., 26(11), , doi: /1999gl von Zahn, U. and U. Berger (2003), The altitude of noctilucent clouds: Groundbased observations and their interpretation through numerical modeling, in Proc.16th ESA symposium on European rocket and balloon programmes and related research, edited by B. Warmbein, ESA SP-530, von Zahn, U., and W. Meyer (1989), Mesopause temperature in polar summer, J. Geophys. Res., 94(D12),
24 von Zahn, U., K.H. Fricke, R. Gerndt, and T. Blix (1987), Mesospheric temperatures and the OH layer height as derived from ground-based lidar and OH* spectrometry, J. Atmos. Terr. Phys., 49, Walterscheid, R.L. (1981), Dynamical cooling induced by dissipating internal gravity waves, Geophys. Res. Lett., 8, Wickwar, V.B., M.J. Taylor, J.P. Herron, and B.A. Martineau (2002), Visual and lidar observations of noctilucent clouds above Logan, Utah, at 41.7 N, J. Geophys. Res., 107(D7), doi: /2001jd Wickwar, V.B., T.D. Wilkerson, M. Hammond, and J.P. Herron (2001), Mesospheric temperature observations at the USU / CASS Atmospheric Lidar Observatory (ALO), in Remote Sensing of the Atmosphere, Environment, and Space, edited by U.N. Singh, T. Itabe, and N. Sugimoto, pp , SPIE. 24
25 Figure 1. The NLC enhancement seen in the photocount profile (1a) and in the backscatter ratio (1b) from 12 minutes centered on 8:13 UT, 22 June 1995, at ALO. Figure 2. Backscatter ratios for the 22 June 1995 NLC. The inputs for the contour profiles were created every 2 minutes using a 2-D boxcar average with a width of 12 minutes and a height of 150 m applied to the raw data, which were measured every 2 minutes and 37.5 m. A backscatter ratio of 1 indicates that there is no Mie-scatter enhancement. Figure 3. Relative density profiles prior to (3a) and during the NLC (3b). The black curves are the measured density profiles; the red curves are the result of the 3 rd order polynomial fitted to data immediately above and below the NLC and then applied across the region in between. Both the measured density profile and the profile with the polynomial fit have a 3-km boxcar average applied. Figure 4. Temperature profiles before, during, and after the NLC on 22 June The fourth profile is the average June temperature taken from the ALO climatology [Herron and Wickwar, 2006]. Figure 5. Temperature differences between the observed values on 22 June 1995 and the climatological June average for ALO. 25
26 Figure 6. Nighttime OH rotational temperatures at ~87 km from the Bomem interferometer located at USU. The red curve denotes the values from 1995; the blue curve denotes those from The NLC night is identified. Figure 7. OH rotational temperatures at ~87 km for the night of 22 June The period when the lidar was operated is indicated in blue, and the period when the NLC was observed is in green. Figure 8. Backscatter ratios for the 1999 NLC [Wickwar et al., 2002] analyzed in the same way as the 1995 NLC in Figure 2. Figure 9. Amplitude and phase of the diurnal tide compared to the NLC. The tidal results were derived from the CSU sodium lidar measurements [She et al., 2002], Urbana sodium lidar measurements [States and Gardner, 2000], and GSWM-00 model calculations [Hagan et al., 1999; Hagan et al., 2001]. Local midnight is 6 UT. Figure 10. Amplitude and phase of the semi-diurnal tides in relation to the NLC occurrence. The tidal results are derived from the CSU sodium lidar measurements [She et al., 2002], Urbana sodium lidar measurements [States and Gardner, 2000], and GSWM-00 model calculations [Hagan et al., 1999; Hagan et al., 2001]. Local midnight is 6 UT. 26
27
28
29
30
31
32
33
34

35

36
2014 Utah NASA Space Grant Consortium Symposium 1
 2014 Utah NASA Space Grant Consortium Symposium 1 Rayleigh Scatter Lidar Observations of the Midlatitude Mesosphere's Response to Sudden Stratospheric Warmings Leda Sox 1, Vincent B. Wickwar 1, Chad Fish
EARLY RAYLEIGH-SCATTER LIDAR TEMPERATURE MEASUREMENTS FROM THE LOWER THERMOSPHERE
 EARLY RAYLEIGH-SCATTER LIDAR TEMPERATURE MEASUREMENTS FROM THE LOWER THERMOSPHERE Leda Sox and Vincent B. Wickwar Physics Department and Center for Atmospheric and Space Sciences, Utah State University,
Visual and lidar observations of noctilucent clouds above Logan, Utah, at 41.7 N
 JOURNAL OF GEOPHYSICAL RESEARCH, VOL. 107, NO. D7, 4054, 10.1029/2001JD001180, 2002 Visual and lidar observations of noctilucent clouds above Logan, Utah, at 41.7 N Vincent B. Wickwar, Michael J. Taylor,
The Mid-Latitude Mesosphere s Response to Sudden Stratospheric Warmings as Determined from Rayleigh Lidar Temperatures
 Utah State University From the SelectedWorks of Leda Sox August 26, 2013 The Mid-Latitude Mesosphere s Response to Sudden Stratospheric Warmings as Determined from Rayleigh Lidar Temperatures Leda Sox,
On atmospheric lidar performance comparison: from power aperture product to power aperture mixing ratio scattering cross-section product
 Journal of Modern Optics Vol. 52, No. 18, 15 December 2005, 2723 2729 On atmospheric lidar performance comparison: from power aperture product to power aperture mixing ratio scattering cross-section product
Characteristics of Wave Induced Oscillations in Mesospheric O2 Emission Intensity and Temperature
 Utah State University DigitalCommons@USU All Physics Faculty Publications Physics 1-2006 Characteristics of Wave Induced Oscillations in Mesospheric O2 Emission Intensity and Temperature A. Taori Michael
Lecture 32. Aerosol & Cloud Lidar (1) Overview & Polar Mesospheric Clouds
 Overview & Polar Mesospheric Clouds") Lecture 32. Aerosol & Cloud Lidar (1) Overview & Polar Mesospheric Clouds q Motivations to study aerosols and clouds q Lidar detection of aerosols and clouds q Polar mesospheric clouds (PMC) detection
Lecture 32. Aerosol & Cloud Lidar (1) Overview & Polar Mesospheric Clouds q Motivations to study aerosols and clouds q Lidar detection of aerosols and clouds q Polar mesospheric clouds (PMC) detection
Horizontal winds in the mesosphere at high latitudes
 Advances in Space Research xxx (2004) xxx xxx www.elsevier.com/locate/asr Horizontal winds in the mesosphere at high latitudes Arno Müllemann, Franz-Josef Lübken * Leibniz Institute of Atmospheric Physics,
SOFIE PMC observations during the northern summer of 2007
 1 SOFIE PMC observations during the northern summer of 2007 2 3 4 5 6 Mark Hervig a, *, Larry Gordley a, James Russell III b, and Scott Bailey c a GATS, Inc., Driggs, Idaho, 83422, USA. b Hampton University,
A Novel Joint Space-Wavenumber Analysis of an Unusual Antarctic Gravity Wave Event
 Utah State University DigitalCommons@USU All Physics Faculty Publications Physics 4-2006 A Novel Joint Space-Wavenumber Analysis of an Unusual Antarctic Gravity Wave Event R. G. Stockwell Michael J. Taylor
Mean diurnal variations of noctilucent clouds during 7 years of lidar observations at ALOMAR
 Annales Geophysicae, 23, 1175 1181, 25 SRef-ID: 1432-576/ag/25-23-1175 European Geosciences Union 25 Annales Geophysicae Mean diurnal variations of noctilucent clouds during 7 years of lidar observations
On microphysical processes of noctilucent clouds (NLC): observations and modeling of mean and width of the particle size-distribution
: observations and modeling of mean and width of the particle size-distribution") doi:10.5194/acp-10-6661-2010 Author(s) 2010. CC Attribution 3.0 License. Atmospheric Chemistry and Physics On microphysical processes of noctilucent clouds (NLC): observations and modeling of mean and
doi:10.5194/acp-10-6661-2010 Author(s) 2010. CC Attribution 3.0 License. Atmospheric Chemistry and Physics On microphysical processes of noctilucent clouds (NLC): observations and modeling of mean and
VALIDATION OF MIPAS TEMPERATURE DATA WITH THE U. BONN LIDAR AT THE ESRANGE DURING JULY AND AUGUST 2002
 VALIDATION OF MIPAS TEMPERATURE DATA WITH THE U. BONN LIDAR AT THE ESRANGE DURING JULY AND AUGUST 2002 U. Blum and K. H. Fricke Physikalisches Institut der Universität Bonn, D-53115 Bonn, Germany blum@physik.uni-bonn.de
Lidar studies of interannual, seasonal, and diurnal variations of polar mesospheric clouds at the South Pole
 JOURNAL OF GEOPHYSICAL RESEARCH, VOL. 108, NO. D8, 8447, doi:10.1029/2002jd002524, 2003 Lidar studies of interannual, seasonal, and diurnal variations of polar mesospheric clouds at the South Pole Xinzhao
VALIDATION OF GOMOS HIGH RESOLUTION TEMPERATURE DATA WITH THE U. BONN LIDAR AT THE ESRANGE DURING JANUARY AND FEBRUARY 2003
 VALIDATION OF GOMOS HIGH RESOLUTION TEMPERATURE DATA WITH THE U. BONN LIDAR AT THE ESRANGE DURING JANUARY AND FEBRUARY 03 U. Blum and K. H. Fricke Physikalisches Institut der Universität Bonn, D-53115
Mesopause structure from Thermosphere, Ionosphere, Mesosphere, Energetics, and Dynamics (TIMED)/Sounding of the Atmosphere
/Sounding of the Atmosphere") Click Here for Full Article JOURNAL OF GEOPHYSICAL RESEARCH, VOL. 112,, doi:10.1029/2006jd007711, 2007 Mesopause structure from Thermosphere, Ionosphere, Mesosphere, Energetics, and Dynamics (TIMED)/Sounding
Click Here for Full Article JOURNAL OF GEOPHYSICAL RESEARCH, VOL. 112,, doi:10.1029/2006jd007711, 2007 Mesopause structure from Thermosphere, Ionosphere, Mesosphere, Energetics, and Dynamics (TIMED)/Sounding
Observational investigations of gravity wave momentum flux with spectroscopic imaging
 JOURNAL OF GEOPHYSICAL RESEARCH, VOL. 110,, doi:10.1029/2004jd004778, 2005 Observational investigations of gravity wave momentum flux with spectroscopic imaging J. Tang, G. R. Swenson, A. Z. Liu, and F.
Noctilucent clouds getting brighter
 JOURNAL OF GEOPHYSICAL RESEARCH, VOL. 107, NO. D14, 4195, 10.1029/2001JD001345, 2002 Noctilucent clouds getting brighter J. Klostermeyer Max-Planck-Institut für Aeronomie, Katlenburg-Lindau, Germany Received
Seasonal variation of nocturnal temperature and sodium density in the mesopause region observed by a resonance scatter lidar over Uji, Japan
 JOURNAL OF GEOPHYSICAL RESEARCH, VOL. 115,, doi:10.1029/2009jd013799, 2010 Seasonal variation of nocturnal temperature and sodium density in the mesopause region observed by a resonance scatter lidar over
Observed long-term temperature change in a midlatitude mesopause region in response to external perturbations
 Earth Planets Space, 51, 809 814, 1999 Observed long-term temperature change in a midlatitude mesopause region in response to external perturbations David A. Krueger and C. Y. She Physics Department, Colorado
Tidal Coupling in the Earth s Atmosphere. Maura Hagan NCAR High Altitude Observatory
 Tidal Coupling in the Earth s Atmosphere Maura Hagan NCAR High Altitude Observatory OUTLINE Motivation - Observations Tidal Nomenclature/Characteristics/Sources Results from the Global-Scale Wave Model
Mesospheric temperature inversions over the Indian tropical region
 Annales Geophysicae (2004) 22: 3375 3382 SRef-ID: 1432-0576/ag/2004-22-3375 European Geosciences Union 2004 Annales Geophysicae Mesospheric temperature inversions over the Indian tropical region S. Fadnavis
Longitude Variations of the Solar Semidiurnal Tides in the Mesosphere and. Lower Thermosphere at Low Latitudes Observed from Ground and Space
 1 2 3 4 5 6 7 8 Accepted for publication in the Journal of Geophysical Research. Copyright (2009) American Geophysical Union. Further reproduction or electronic distribution is not permitted. Longitude
On the horizontal and temporal structure of noctilucent clouds as observed by satellite and lidar at ALOMAR (69N)
") GEOPHYSICAL RESEARCH LETTERS, VOL. 39,, doi:10.1029/2011gl049935, 2012 On the horizontal and temporal structure of noctilucent clouds as observed by satellite and lidar at ALOMAR (69N) G. Baumgarten, 1
GEOPHYSICAL RESEARCH LETTERS, VOL. 39,, doi:10.1029/2011gl049935, 2012 On the horizontal and temporal structure of noctilucent clouds as observed by satellite and lidar at ALOMAR (69N) G. Baumgarten, 1
All Physics Faculty Publications
 Utah State University DigitalCommons@USU All Physics Faculty Publications Physics 2-8-2008 Climatology of mesopause region temperature, zonal wind, and meridional wind over Fort Collins,Colorado (41 N,
A new height for the summer mesopause: Antarctica, December 2007
 GEOPHYSICAL RESEARCH LETTERS, VOL. 35, L23810, doi:10.1029/2008gl035915, 2008 A new height for the summer mesopause: Antarctica, December 2007 S. Kirkwood, 1 H. Nilsson, 1 R. J. Morris, 2 A. R. Klekociuk,
Antarctic mesospheric clouds formed from space shuttle exhaust
 GEOPHYSICAL RESEARCH LETTERS, VOL. 32, L13810, doi:10.1029/2005gl023054, 2005 Antarctic mesospheric clouds formed from space shuttle exhaust Michael H. Stevens E.O. Hulburt Center for Space Research, Naval
Simultaneous observation of noctilucent clouds, mesospheric summer echoes, and temperature at a midlatitude station (54 N)
") Click Here for Full Article JOURNAL OF GEOPHYSICAL RESEARCH, VOL. 112,, doi:10.1029/2006jd008135, 2007 Simultaneous observation of noctilucent clouds, mesospheric summer echoes, and temperature at a midlatitude
Click Here for Full Article JOURNAL OF GEOPHYSICAL RESEARCH, VOL. 112,, doi:10.1029/2006jd008135, 2007 Simultaneous observation of noctilucent clouds, mesospheric summer echoes, and temperature at a midlatitude
POLAR MESOSPHERE WINTER ECHOES DURING MaCWAVE
 , ESA-SP530, 357-362, 2003 POLAR MESOSPHERE WINTER ECHOES DURING MaCWAVE S. Kirkwood (1), E. Belova (1), P. Dalin (1), K.-H. Fricke (2), U. Blum (2), F. Schmidlin (3), R.A. Goldberg (4) (1) Swedish Institute
Lecture 3: Global Energy Cycle
 Lecture 3: Global Energy Cycle Planetary energy balance Greenhouse Effect Vertical energy balance Latitudinal energy balance Seasonal and diurnal cycles Solar Flux and Flux Density Solar Luminosity (L)
On the relationship between atomic oxygen and vertical shifts between OH Meinel bands originating from different vibrational levels
 GEOPHYSICAL RESEARCH LETTERS, VOL. 40, 5821 5825, doi:10.1002/2013gl058017, 2013 On the relationship between atomic oxygen and vertical shifts between OH Meinel bands originating from different vibrational
Mesospheric temperature observations at the USU / CASS Atmospheric Lidar Observatory (ALO)
") Mesospheric temperature observations at the USU / CASS Atmospheric Lidar Observatory (ALO) Vincent B. Wickwar, Thomas D. Wilkerson, Marc Hammond, Joshua P. Herron Center for Atmospheric and Space Sciences,
Mesospheric temperature observations at the USU / CASS Atmospheric Lidar Observatory (ALO) Vincent B. Wickwar, Thomas D. Wilkerson, Marc Hammond, Joshua P. Herron Center for Atmospheric and Space Sciences,
Lecture 2: Global Energy Cycle
 Lecture 2: Global Energy Cycle Planetary energy balance Greenhouse Effect Vertical energy balance Solar Flux and Flux Density Solar Luminosity (L) the constant flux of energy put out by the sun L = 3.9
tidal variability in the mesosphere and lower thermosphere (MLT) due to the El Niño Southern Oscillation
 due to the El Niño Southern Oscillation") GEOPHYSICAL RESEARCH LETTERS, VOL. 39,, doi:10.1029/2012gl053383, 2012 Tidal variability in the mesosphere and lower thermosphere due to the El Niño Southern Oscillation N. M. Pedatella 1 and H.-L. Liu
GEOPHYSICAL RESEARCH LETTERS, VOL. 39,, doi:10.1029/2012gl053383, 2012 Tidal variability in the mesosphere and lower thermosphere due to the El Niño Southern Oscillation N. M. Pedatella 1 and H.-L. Liu
Meteorology Practice Test
 Meteorology Practice Test 1. Transition zones between two air masses of different densities are called what? 2. A front occurs when a cold air mass replaces a warmer one. 3. A front occurs when a warm
Remote Sensing the Upper Atmosphere with Lidar from Space Background: Ground based lidar studies of the upper atmosphere
 RemoteSensingtheUpperAtmospherewithLidarfromSpace bygaryswenson ElectricalandComputerEngineering,UniversityofIllinois,Champaign,Urbana,IL Lidar(LIght Detection And Ranging) remote sensing of the atmosphere
Nocturnal temperature structure in the mesopause region over the Arecibo Observatory (18.35 N, W): Seasonal variations
: Seasonal variations") Click Here for Full Article JOURNAL OF GEOPHYSICAL RESEARCH, VOL. 112,, doi:10.1029/2006jd008220, 2007 Nocturnal temperature structure in the mesopause region over the Arecibo Observatory (18.35 N, 66.75
Click Here for Full Article JOURNAL OF GEOPHYSICAL RESEARCH, VOL. 112,, doi:10.1029/2006jd008220, 2007 Nocturnal temperature structure in the mesopause region over the Arecibo Observatory (18.35 N, 66.75
Tides in the Polar Mesosphere Derived from Two MF Radar Measurements at Poker Flat and Tromsø
 Tides in the Polar Mesosphere Derived from Two MF Radar Measurements at Poker Flat and Tromsø NOZAWA Satonori, IWAHASHI Hiroyuki, TSUDA Takuo, OHYAMA Shin-ichiro, FUJII Ryoichi, Chris M. HALL, Alan MANSON,
NLC and the background atmosphere above ALOMAR
 Atmos. Chem. Phys., 11, 71 717, 211 www.atmos-chem-phys.net/11/71/211/ doi:1.194/acp-11-71-211 Author(s) 211. CC Attribution 3. License. Atmospheric Chemistry and Physics NLC and the background atmosphere
First in-situ temperature measurements in the summer mesosphere at very high latitudes (78 ffi N)
") JOURNAL OF GEOPHYSICAL RESEARCH, VOL.???, NO., PAGES 1 18, Submitted for publication to J. Geophys. Res., April 3, 2002. Revised July 3, 2002 First in-situ temperature measurements in the summer mesosphere
JOURNAL OF GEOPHYSICAL RESEARCH, VOL.???, NO., PAGES 1 18, Submitted for publication to J. Geophys. Res., April 3, 2002. Revised July 3, 2002 First in-situ temperature measurements in the summer mesosphere
Seasonal variation of nocturnal temperatures between 1 and 105 km altitude at 54 N observed by lidar
 Atmos. Chem. Phys., 8, 7465 7482, 2008 Author(s) 2008. This work is distributed under the Creative Commons Attribution 3.0 License. Atmospheric Chemistry and Physics Seasonal variation of nocturnal temperatures
Gravity Waves Over Antarctica
 Utah State University DigitalCommons@USU Physics Capstone Project Physics Student Research 5-2018 Gravity Waves Over Antarctica Vanessa Chambers Utah State University Follow this and additional works at:
SCIENCE CHINA Technological Sciences
 SCIENCE CHINA Technological Sciences RESEARCH PAPER May 2012 Vol.55 No.5: 1258 1263 doi: 10.1007/s11431-012-4802-0 Longitudinal distribution of O 2 nightglow brightness observed by TIEMD/SABER satellite
JOURNAL OF GEOPHYSICAL RESEARCH, VOL. 114, D06106, doi: /2008jd011089, 2009
 JOURNAL OF GEOPHYSICAL RESEARCH, VOL. 114,, doi:10.1029/2008jd011089, 2009 Observation of local tidal variability and instability, along with dissipation of diurnal tidal harmonics in the mesopause region
Alan Z. Liu Embry Riddle Aeronautical University - Daytona Beach, Chester S. Gardner
 Department of Physical Sciences - Daytona Beach College of Arts & Sciences 1-29-2005 Vertical Heat and Constituent Transport in the Mesopause Region by Dissipating Gravity Waves at Maui, Hawaii (20.7ºN),
Study Participants: T.E. Sarris, E.R. Talaat, A. Papayannis, P. Dietrich, M. Daly, X. Chu, J. Penson, A. Vouldis, V. Antakis, G.
 GLEME: GLOBAL LIDAR EXPLORATION OF THE MESOSPHERE Project Technical Officer: E. Armandillo Study Participants: T.E. Sarris, E.R. Talaat, A. Papayannis, P. Dietrich, M. Daly, X. Chu, J. Penson, A. Vouldis,
The impact of space shuttle main engine exhaust on PMCs and implications to trend studies
 The impact of space shuttle main engine exhaust on PMCs and implications to trend studies Michael H. Stevens Naval Research Laboratory Washington, DC 2 nd CAWSES-II TG2 Workshop on Modeling Polar Mesospheric
CLIMATE AND CLIMATE CHANGE MIDTERM EXAM ATM S 211 FEB 9TH 2012 V1
 CLIMATE AND CLIMATE CHANGE MIDTERM EXAM ATM S 211 FEB 9TH 2012 V1 Name: Student ID: Please answer the following questions on your Scantron Multiple Choice [1 point each] (1) The gases that contribute to
Trends in the middle atmosphere from ground based sensors at mid and high latitudes
 Trends in the middle atmosphere from ground based sensors at mid and high latitudes Gunter Stober 1,2, F-J Lübken 1, U. Berger 1, P. Brown 2,, J. Fiedler 1, G. Baumgarten 1, R. Latteck 1, J.L. Chau 1 1
First detection of wave interactions in the middle atmosphere of Mars
 GEOPHYSICAL RESEARCH LETTERS, VOL. 38,, doi:10.1029/2010gl045592, 2011 First detection of wave interactions in the middle atmosphere of Mars Y. Moudden 1 and J. M. Forbes 1 Received 22 September 2010;
Longitude variations of the solar semidiurnal tides in the mesosphere and lower thermosphere at low latitudes observed from ground and space
 JOURNAL OF GEOPHYSICAL RESEARCH, VOL. 114,, doi:10.1029/2009jd011763, 2009 Longitude variations of the solar semidiurnal tides in the mesosphere and lower thermosphere at low latitudes observed from ground
All Physics Faculty Publications
 Utah State University DigitalCommons@USU All Physics Faculty Publications Physics 10-17-2008 Seasonal variations of semidiurnal tidalperturbations in mesopause region temperature and zonal and meridional
Statistical characteristics of gravity waves observed by an all-sky imager at Darwin, Australia
 JOURNAL OF GEOPHYSICAL RESEARCH, VOL. 109,, doi:10.1029/2003jd004336, 2004 Statistical characteristics of gravity waves observed by an all-sky imager at Darwin, Australia S. Suzuki, K. Shiokawa, Y. Otsuka,
The 16-day wave in the Arctic and Antarctic mesosphere and lower thermosphere
 Author(s) 2010. This work is distributed under the Creative Commons Attribution 3.0 License. Atmospheric Chemistry and Physics The 16-day wave in the Arctic and Antarctic mesosphere and lower thermosphere
The terdiurnal tide in the mesosphere and lower thermosphere over Wuhan (30 N, 114 E)
") Earth Planets Space, 57, 393 398, 2005 The terdiurnal tide in the mesosphere and lower thermosphere over Wuhan (30 N, 114 E) Guangxin Zhao 1,2,3, Libo Liu 1, Baiqi Ning 1, Weixing Wan 1, and Jiangang Xiong
Earth Planets Space, 57, 393 398, 2005 The terdiurnal tide in the mesosphere and lower thermosphere over Wuhan (30 N, 114 E) Guangxin Zhao 1,2,3, Libo Liu 1, Baiqi Ning 1, Weixing Wan 1, and Jiangang Xiong
High-Latitude Short-Period Mesospheric Gravity Wave Dynamics and Winter Climatology
 Utah State University DigitalCommons@USU Physics Student Research Physics Student Research 2013 High-Latitude Short-Period Mesospheric Gravity Wave Dynamics and Winter Climatology Michael Negale Utah State
Seasonal variations of the atmospheric temperature structure at South Pole
 JOURNAL OF GEOPHYSICAL RESEARCH, VOL. 108, NO. D18, 4564, doi:10.1029/2002jd003217, 2003 Seasonal variations of the atmospheric temperature structure at South Pole Weilin Pan 1 and Chester S. Gardner Department
A comparison of Rayleigh and sodium lidar temperature climatologies
 Ann. Geophys., 2, 27 3, 27 www.ann-geophys.net/2/27/27/ European Geosciences Union 27 Annales Geophysicae A comparison of Rayleigh and sodium lidar temperature climatologies P. S. Argall and R. J. Sica
VALIDATION OF ENVISAT PRODUCTS USING POAM III O 3, NO 2, H 2 O AND O 2 PROFILES
 VALIDATION OF ENVISAT PRODUCTS USING POAM III O 3, NO 2, H 2 O AND O 2 PROFILES A. Bazureau, F. Goutail Service d Aéronomie / CNRS, BP 3, Réduit de Verrières, 91371 Verrières-le-Buisson, France Email :
Dynamical and Thermal Effects of Gravity Waves in the Terrestrial Thermosphere-Ionosphere
 1/25 Dynamical and Thermal Effects of Gravity Waves in the Terrestrial Thermosphere-Ionosphere Erdal Yiğit 1,3, Alexander S. Medvedev 2, and Aaron J. Ridley 1 1 University of Michigan, Ann Arbor, USA 2
NICT Lidar Systems at Poker Flat Research Range
 NICT Lidar Systems at Poker Flat Research Range MIZUTANI Kohei, ITABE Toshikazu, YASUI Motoaki, AOKI Tetsuo, ISHII Shoken, MURAYAMA Yasuhiro, SASANO Masahiko, YOSHIOKA Kensuke, OHTANI Yoshiko, and Richard
TIME SERIES COMPARISONS OF MIPAS LEVEL 2 NEAR REAL TIME PRODUCTS WITH CLIMATOLOGY
 TIME SERIES COMPARISONS OF MIPAS LEVEL 2 NEAR REAL TIME PRODUCTS WITH CLIMATOLOGY Vivienne Payne, Anu Dudhia, and Chiara Piccolo Atmospheric, Oceanic and Planetary Physics, Department of Physics, University
Mesospheric wind disturbances due to gravity waves near the Antarctica Peninsula
 JOURNAL OF GEOPHYSICAL RESEARCH: ATMOSPHERES, VOL. 118, 7765 7772, doi:10.1002/jgrd.50577, 2013 Mesospheric wind disturbances due to gravity waves near the Antarctica Peninsula Qian Wu, 1 Zeyu Chen, 2
Waves and Turbulence Dynamics above the Andes
 Waves and Turbulence Dynamics above the Andes Alan Liu Embry-Riddle Aeronautical University Daytona Beach, Florida, USA F. Vargas, G. Swenson, A. Mangognia (UIUC) W. Huang, J. Smith, X. Chu (CU Boulder)
How to Use Airglow Measurements in Atmospheric Wave Activity Studies. Mike J. Taylor, Y. Zhao, P.-D. Pautet, W.Pendleton Jr. Utah State University
 How to Use Airglow Measurements in Atmospheric Wave Activity Studies Mike J. Taylor, Y. Zhao, P.-D. Pautet, W.Pendleton Jr. Utah State University Present at: 38 AM Finland, August 22-26, 2011 Introduction
Responses of mesosphere and lower thermosphere temperatures to gravity wave forcing during stratospheric sudden warming
 Click Here for Full Article GEOPHYSICAL RESEARCH LETTERS, VOL. 37,, doi:10.1029/2009gl042351, 2010 Responses of mesosphere and lower thermosphere temperatures to gravity wave forcing during stratospheric
Spatial structure of the 12-hour wave in the Antarctic as observed by radar
 Earth Planets Space, 51, 621 628, 1999 Spatial structure of the 12-hour wave in the Antarctic as observed by radar D. M. Riggin 1, D. C. Fritts 1, M. J. Jarvis 2, and G. O. L. Jones 2 1 Colorado Research
Simultaneous measurements of dynamical structure in the mesopause region with lidars and MU radar
 Earth Planets Space, 51, 731 739, 1999 Simultaneous measurements of dynamical structure in the mesopause region with lidars and MU radar K. Kobayashi 1, T. Kitahara 1, T. D. Kawahara 1, Y. Saito 1, A.
CHAPTER 5. Low latitude temperature change in the stratosphere and mesosphere. relation to Sudden Stratospheric Warming (SSW)
") CHAPTER 5 Low latitude temperature change in the stratosphere and mesosphere relation to Sudden Stratospheric Warming (SSW) 5.1 Introduction To understand middle atmosphere dynamics, the basic thermal
CHAPTER 5 Low latitude temperature change in the stratosphere and mesosphere relation to Sudden Stratospheric Warming (SSW) 5.1 Introduction To understand middle atmosphere dynamics, the basic thermal
Day-to-day variations of migrating semidiurnal tide in the mesosphere and thermosphere
 Mem. Natl Inst. Polar Res., Spec. Issue, /3, +33,*1,,**0,**0 National Institute of Polar Research Scientific paper Day-to-day variations of migrating semidiurnal tide in the mesosphere and thermosphere
ARTICLE IN PRESS. Journal of Atmospheric and Solar-Terrestrial Physics
 Journal of Atmospheric and Solar-Terrestrial Physics 71 (9) 434 445 Contents lists available at ScienceDirect Journal of Atmospheric and Solar-Terrestrial Physics journal homepage: www.elsevier.com/locate/jastp
1. The frequency of an electromagnetic wave is proportional to its wavelength. a. directly *b. inversely
 CHAPTER 3 SOLAR AND TERRESTRIAL RADIATION MULTIPLE CHOICE QUESTIONS 1. The frequency of an electromagnetic wave is proportional to its wavelength. a. directly *b. inversely 2. is the distance between successive
Laser-Induced Fluorescence:
 Laser-Induced Fluorescence: Spectroscopy in the Sky Chiao-Yao She and David A. Krueger Scientists are using laserinduced fluorescence to assess temperature and wind in a largely unstudied layer of the
Summer-time nocturnal wave characteristics in mesospheric OH and O 2 airglow emissions
 Earth Planets Space, 60, 973 979, 2008 Summer-time nocturnal wave characteristics in mesospheric OH and O 2 airglow emissions A. Guharay 1, A. Taori 2, and M. Taylor 3 1 Aryabhatta Research Institute of
Seasonal and long-term variations of PMSE from VHF radar observations at Andenes, Norway
 JOURNAL OF GEOPHYSICAL RESEARCH, VOL. 108, NO. D8, 8438, doi:10.1029/2002jd002369, 2003 Seasonal and long-term variations of PMSE from VHF radar observations at Andenes, Norway J. Bremer, P. Hoffmann,
All Physics Faculty Publications
 Utah State University DigitalCommons@USU All Physics Faculty Publications Physics 7-2010 Polar Mesospheric Cloud Structures Observed From the Cloud Imaging and Particle Size Experiment on the Aeronomy
WEATHER. Review Note Cards
 WEATHER Review Note Cards Thermometer Weather instrument that measures air temperature Units include F, C, and K ESRT 13 Sling Psychrometer Weather instrument that measures relative humidity and dewpoint
On my honor, I have neither given nor received unauthorized aid on this examination. YOUR TEST NUMBER IS THE 5-DIGIT NUMBER AT THE TOP OF EACH PAGE.
 Instructor: Prof. Seiberling PHYSICS DEPARTMENT MET 1010 Name (print, last rst): 1st Midterm Exam Signature: On my honor, I have neither given nor received unauthorized aid on this examination. YOUR TEST
Gravity wave variations during the 2009 stratospheric sudden
 GEOPHYSICAL RESEARCH LETTERS, VOL. 37,, doi:10.109/010gl045437, 010 Gravity wave variations during the 009 stratospheric sudden warming as revealed by ECMWF T799 and observations Chihoko Yamashita, 1,
Lecture 18. Temperature Lidar (7) Rayleigh Doppler Technique
 Rayleigh Doppler Technique") Lecture 18. Temperature Lidar (7) Rayleigh Doppler Technique Review of integration technique Resonance fluorescence Doppler technique vs. Rayleigh Doppler technique Rayleigh Doppler lidar High-spectral-resolution
Lecture 18. Temperature Lidar (7) Rayleigh Doppler Technique Review of integration technique Resonance fluorescence Doppler technique vs. Rayleigh Doppler technique Rayleigh Doppler lidar High-spectral-resolution
Lecture #1 Tidal Models. Charles McLandress (Banff Summer School 7-13 May 2005)
") Lecture #1 Tidal Models Charles McLandress (Banff Summer School 7-13 May 2005) 1 Outline of Lecture 1. Introduction 2. Brief description of tides 3. Observations of tides 4. Simulating tides using a general
Lecture #1 Tidal Models Charles McLandress (Banff Summer School 7-13 May 2005) 1 Outline of Lecture 1. Introduction 2. Brief description of tides 3. Observations of tides 4. Simulating tides using a general
Lecture 17. Temperature Lidar (6) Integration Technique
 Integration Technique") Lecture 17. Temperature Lidar (6) Integration Technique Doppler effects in absorption/backscatter coefficient Integration technique for temperature Searchlight integration lidar Rayleigh integration temperature
Lecture 17. Temperature Lidar (6) Integration Technique Doppler effects in absorption/backscatter coefficient Integration technique for temperature Searchlight integration lidar Rayleigh integration temperature
AT350 EXAM #1 September 23, 2003
 AT350 EXAM #1 September 23, 2003 Name and ID: Enter your name and student ID number on the answer sheet and on this exam. Record your answers to the questions by using a No. 2 pencil to completely fill
Enhanced gravity wave activity over the equatorial MLT region during counter electrojet events
 Indian Journal of Radio & Space Physics Vol 41, April 2012, pp 258-263 Enhanced gravity wave activity over the equatorial MLT region during counter electrojet events C Vineeth $,*, T K Pant & M M Hossain
Joule heating and nitric oxide in the thermosphere, 2
 JOURNAL OF GEOPHYSICAL RESEARCH, VOL. 115,, doi:10.1029/2010ja015565, 2010 Joule heating and nitric oxide in the thermosphere, 2 Charles A. Barth 1 Received 14 April 2010; revised 24 June 2010; accepted
C) wavelength C) eastern horizon B) the angle of insolation is high B) increases, only D) thermosphere D) receive low-angle insolation
 wavelength C) eastern horizon B) the angle of insolation is high B) increases, only D) thermosphere D) receive low-angle insolation") 1. What is the basic difference between ultraviolet, visible, and infrared radiation? A) half-life B) temperature C) wavelength D) wave velocity 2. In New York State, the risk of sunburn is greatest between
1. What is the basic difference between ultraviolet, visible, and infrared radiation? A) half-life B) temperature C) wavelength D) wave velocity 2. In New York State, the risk of sunburn is greatest between
Neutral Winds in the Upper Atmosphere. Qian Wu National Center for Atmospheric Research
 Neutral Winds in the Upper Atmosphere Qian Wu National Center for Atmospheric Research Outline Overview of the upper atmosphere. Ozone heating. Neutral wind tides (the strongest dynamic feature). Why do
Long-term lidar observations of gravity waves over northern Sweden
 Long-term lidar observations of gravity waves over northern Sweden Master thesis written at the Department of Meteorology, Stockholm University written by Benedikt Ehard, born Mai 5th 1990 in Roth, Germany
Tidal variations of O2 Atmospheric and OH(6-2) airglow and temperature at mid-latitudes from SATI observations
 airglow and temperature at mid-latitudes from SATI observations") Tidal variations of O2 Atmospheric and OH(6-2) airglow and temperature at mid-latitudes from SATI observations M. J. López-González, E. Rodriguez, G. G. Shepherd, S. Sargoytchev, M. G. Shepherd, V. M.
Tidal variations of O2 Atmospheric and OH(6-2) airglow and temperature at mid-latitudes from SATI observations M. J. López-González, E. Rodriguez, G. G. Shepherd, S. Sargoytchev, M. G. Shepherd, V. M.
Validation of Imaging Doppler Interferometer Winds Using Meteor Radar
 Utah State University DigitalCommons@USU All Physics Faculty Publications Physics 7-2003 Validation of Imaging Doppler Interferometer Winds Using Meteor Radar G. O.L. Jones C. S. Fish W. K. Hocking Michael
Polar mesosphere and lower thermosphere dynamics: 1. Mean wind and gravity wave climatologies
 JOURNAL OF GEOPHYSICAL RESEARCH, VOL. 112,, doi:10.1029/2006jd008126, 2007 Polar mesosphere and lower thermosphere dynamics: 1. Mean wind and gravity wave climatologies Andrew J. Dowdy, 1 Robert A. Vincent,
Lecture 2: Global Energy Cycle
 Lecture 2: Global Energy Cycle Planetary energy balance Greenhouse Effect Selective absorption Vertical energy balance Solar Flux and Flux Density Solar Luminosity (L) the constant flux of energy put out
Solar Flux and Flux Density. Lecture 2: Global Energy Cycle. Solar Energy Incident On the Earth. Solar Flux Density Reaching Earth
 Lecture 2: Global Energy Cycle Solar Flux and Flux Density Planetary energy balance Greenhouse Effect Selective absorption Vertical energy balance Solar Luminosity (L) the constant flux of energy put out
MIPAS WATER VAPOUR MIXING RATIO AND TEMPERATURE VALIDATION BY RAMAN-MIE-RAYLEIGH LIDAR
 MIPAS WATER VAPOUR MIXING RATIO AND TEMPERATURE VALIDATION BY RAMAN-MIE-RAYLEIGH LIDAR T.Colavitto (1) (2), F.Congeduti (1), C.M. Medaglia (1), F. Fierli (1), P. D Aulerio (1) (1) Istituto di Scienze dell
Lecture 20. Wind Lidar (2) Vector Wind Determination
 Vector Wind Determination") Lecture 20. Wind Lidar (2) Vector Wind Determination Vector wind determination Ideal vector wind measurement VAD and DBS technique for vector wind Coherent versus incoherent Detection Doppler wind lidar
Lecture 20. Wind Lidar (2) Vector Wind Determination Vector wind determination Ideal vector wind measurement VAD and DBS technique for vector wind Coherent versus incoherent Detection Doppler wind lidar
OH-equivalent temperatures derived from ACE-FTS and SABER temperature profiles a comparison with OH*(3-1) temperatures from Maynooth (53.2 N, 6.
 temperatures from Maynooth (53.2 N, 6.") Ann. Geophys., 26, 795 811, 8 www.ann-geophys.net/26/795/8/ European Geosciences Union 8 Annales Geophysicae OH-equivalent temperatures derived from ACE-FTS and SABER temperature profiles a comparison
Ann. Geophys., 26, 795 811, 8 www.ann-geophys.net/26/795/8/ European Geosciences Union 8 Annales Geophysicae OH-equivalent temperatures derived from ACE-FTS and SABER temperature profiles a comparison
Components of the lunar gravitational tide in the terrestrial atmosphere and geomagnetic field
 Pertsev N. 1, Dalin P. 2, Perminov V. 1 1- Obukhov Institute of Atmospheric Physics, Moscow, Russia 2- Swedish Institute of Space Physics, Kiruna, Sweden Components of the lunar gravitational tide in the
Jia Yue. Research Assistant Professor. Department of Atmospheric and Planetary Sciences Hampton University, 23 Tyler Street Hampton, VA, 23668
 Jia Yue Research assistant Professor Department of Atmospheric and Planetary Sciences Hampton University, 23 Tyler Street Hampton, VA, 23668 Phone: 757-728-6219/970-213-1235 Fax: 757-727-5090 Jia.yue@hamptonu.edu
USA. Logan, UT, USA. University, Blacksburg, VA 24061, USA. * Corresponding Author. Tel:
 Polar Mesospheric Cloud structures observed from the CIPS experiment on the AIM spacecraft: Atmospheric gravity waves as drivers for longitudinal variability in PMC occurrence A. Chandran 1, 2,*, D. W.
The Earth s thermosphere and coupling to the Sun:
 The Earth s thermosphere and coupling to the Sun: Does the stratosphere and troposphere care? Alan D Aylward, George Millward, Ingo Muller-Wodarg and Matthew Harris Atmospheric Physics Laboratory, Dept