Supporting Online Material for
|
|
|
- Felix Pitts
- 6 years ago
- Views:
Transcription

1 Supporting Online Material for Transient Simulation of Last Deglaciation with a New Mechanism for Bølling-Allerød Warming Z. Liu, * B. L. Otto-Bliesner, F. He, E. C. Brady, R. Tomas, P. U. Clark, A. E. Carlson, J. Lynch-Stieglitz, W. Curry, E. Brook, D. Erickson, R. Jacob, J. Kutzbach, J. Cheng *To whom correspondence should be addressed. zliu3@wisc.edu This PDF file includes: Materials and Methods SOM Text Figs. S1 to S7 References and Notes Published 17 July 2009, Science 325, 310 (2009) DOI: /science Other Supporting Online Material for this manuscript includes the following: (available at Movie S1
2 Materials and Method 2 1: Model Setup: The CGCM employed is the National Center for Atmospheric Research (NCAR) CCSM3 with a dynamic global vegetation module. CCSM3 is a global, coupled ocean atmosphere sea ice land surface climate model without flux adjustment (S1). All the simulations were performed in the version of T31_gx3v5 resolution (S2). The atmospheric model is the Community Atmospheric Model 3 (CAM3) with 26 hybrid coordinate levels in the vertical and ~3.75-degree resolution in the horizontal. The land model uses the same resolution as the atmosphere, and each grid box includes a hierarchy of land units, soil columns, and plant types. Glaciers, lakes, wetlands, urban areas, and vegetated regions can be specified in the land units. The ocean model is the NCAR implementation of the Parallel Ocean Program (POP) in vertical z-coordinate with 25 levels. The longitudinal resolution is 3.6-degree and the latitudinal resolution is variable, with finer resolution near the equator (~0.9 degrees). The sea ice model is the NCAR Community Sea Ice Model (CSIM). CSIM is a dynamic-thermodynamic model that includes a subgrid-scale ice thickness distribution. The resolution of CSIM is identical to that of POP. The preindustrial control simulation reproduces the major features of global climate, notably in the deep ocean (S3). The Last Glacial Maximum (LGM) CCSM3 simulation has a global cooling of 4.5 C compared to pre-industrial with amplification of this cooling at high latitudes and over the continental ice sheets (S3). The LGM control run also simulates a shoaling of North Atlantic Deep Water and farther northward penetration of Antarctic Bottom Water (S4). A 1,800-year LGM equilibrium simulation was branched off from an earlier LGM simulation in order to incorporate the dynamic global vegetation model and to reduce the
3 3 SOM, BA_Science, Liu et al., revision2, 05/07/2009 model drift in the deep ocean. The transient simulation was then started at the end of the 1,800-year LGM/DGVM equilibrium run with the transient orbital parameter starting at 22 ka. The transient concentrations of the greenhouse gases (CO 2, CH 4 and N 2 O) were adopted from ref S5. The continental ice sheets were modified approximately once per thousand year according to the ICE-5G reconstruction (S6). The coastlines at LGM were also taken from the ICE-5G reconstruction and were not modified during the simulations in this study. 2: Meltwater Scheme: Since the meltwater flux (MWF) from the retreat of the ice sheets is not well constrained during the last deglaciation, we adopted simple schemes of MWF (Fig.1c) and considered only two regions to impose MWF: one in the North Atlantic region between 50 o N and 70 o N, and the other in the Gulf of Mexico. From 19 ka to 18.4 ka, the first pulse of MWF was imposed at the rate of 3 m/kyr (1m/kyr = Sv; 1 m/kyr refers to 1 meter of equivalent global sea level rise per thousand year) over the North Atlantic. From 18.4 ka to 17.5 ka, the MWF was linearly increased from 0 to 5 m/kyr in the Gulf of Mexico and from 3 to 5 m/kyr in the North Atlantic. From 17.5 ka to 17.0 ka, the MWF remained at 5 m/kyr in the Gulf of Mexico and linearly increased from 5 to 15 m/kyr in the North Atlantic. Starting from 17 ka, two schemes of MWF were employed to test the sensitivity of the climate system to the rate of the MWF termination. In scheme DGL-B (Fig.1c, blue), the MWF linearly decreased from 20 to 0 m/kyr from 17 ka to 14.2 ka. In scheme DGL-A (Fig.1c, red), the MWF in the Gulf of Mexico was shut off immediately after 17.0 ka, while the MWF in the North Atlantic remained at 15 m/kyr until ka when it was abruptly shut off.
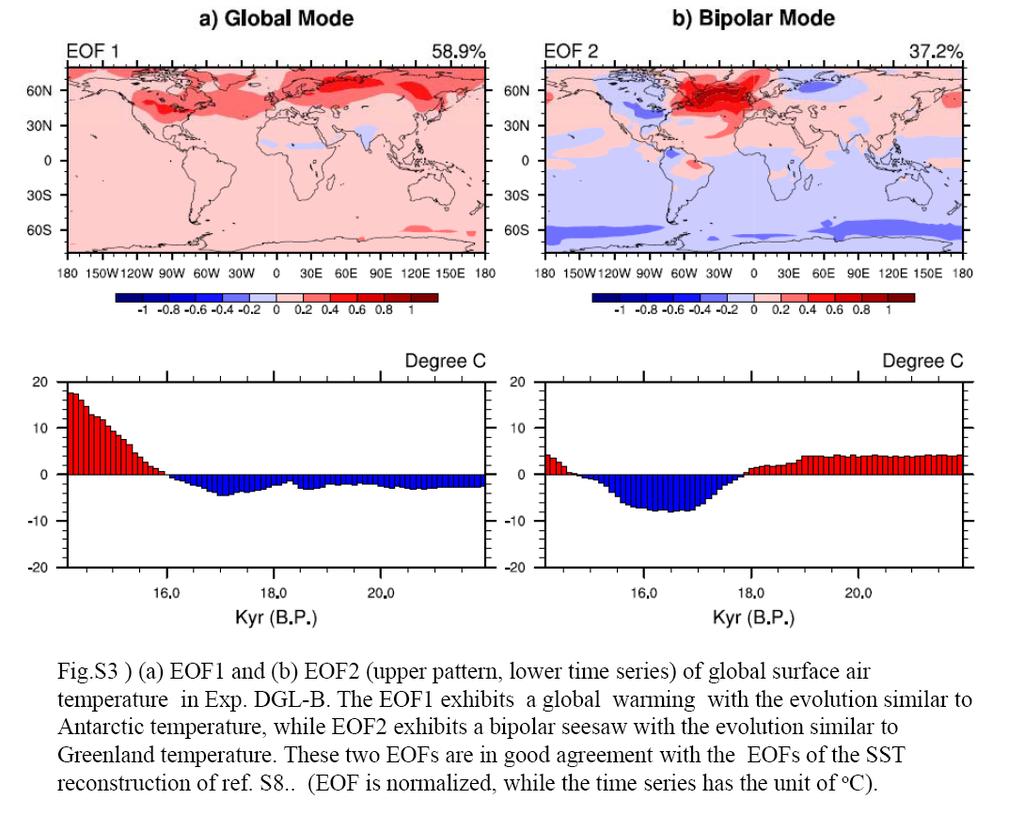
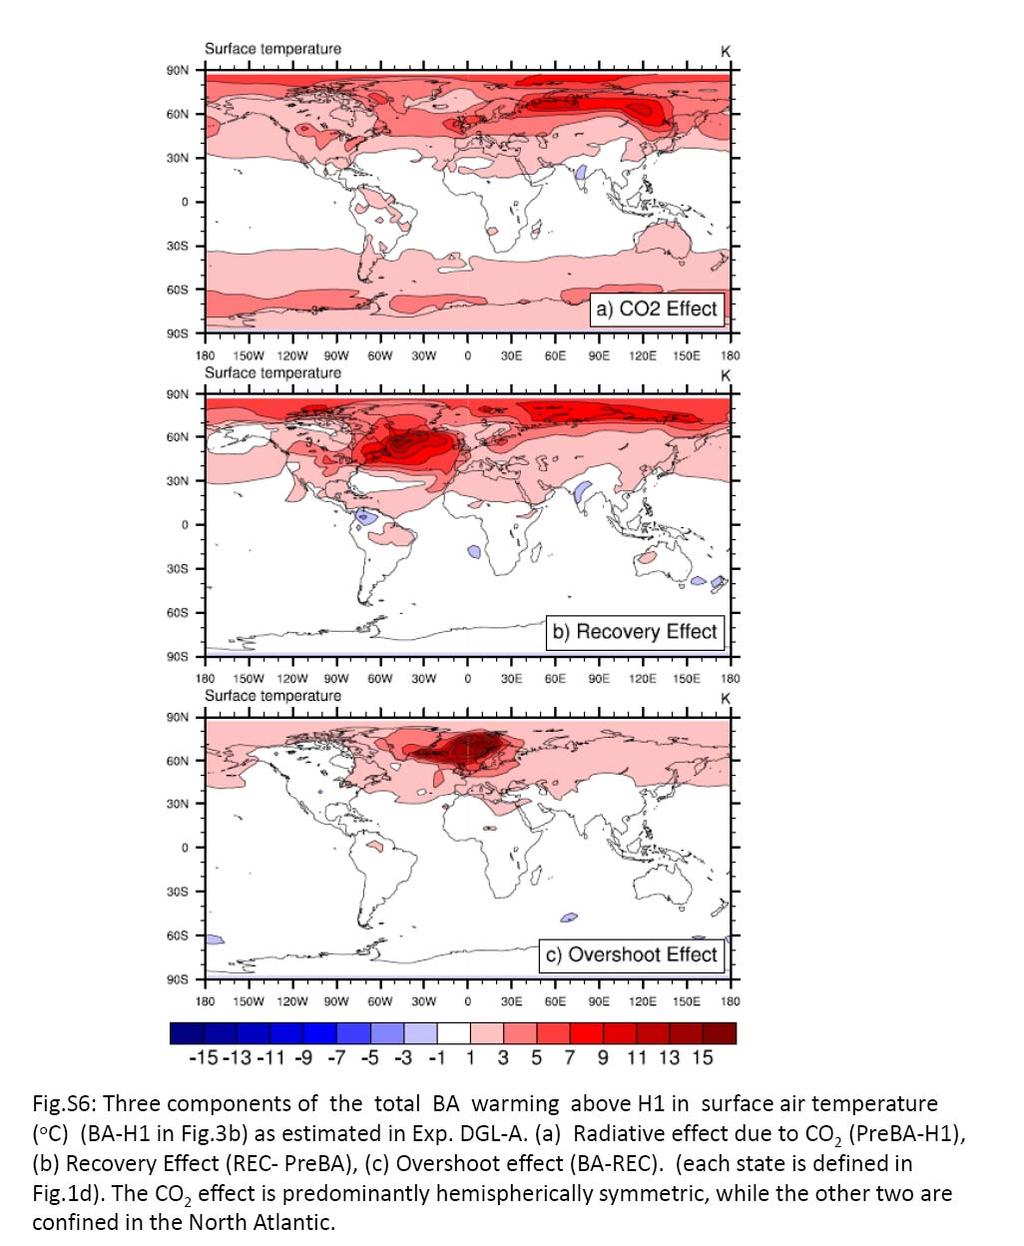
4 4 Supporting online text 1: Global Temperature Response during Deglaciation: The MWF in the North Atlantic forces significant remote climate responses throughout the globe via climatic teleconnections (S7). Overall, Northern Hemisphere surface temperature evolves similarly to Greenland (Figs.1g-i), but Southern Hemisphere temperature increases monotonically as over the Antarctic. The overall global surface temperature evolution can be seen clearly in the two leading EOFs during the deglaciation (Fig.S3), which are in excellent agreement with the corresponding EOFs derived from surface temperature proxy records from the last deglaciation (S8). The first EOF mode exhibits an overall global warming that tends to increase monotonically as in the Antarctica (Fig.S3a); this mode is caused predominantly by the rising CO 2 and orbital forcing (Fig.1a). In contrast, the second EOF mode exhibits a bipolar seesaw response that evolves similarly to the Greenland temperature (Fig.S3b); this mode is associated with the North Atlantic MWF (Fig.1c) through climate teleconnections. 2. GHG vs Orbital Forcing on BA Warming: To assess the contributions of CO 2 and orbital forcing to BA warming, we performed two sensitivity experiments from H1 to BA that are forced the same as Exp. DGL-A (but with the AMOC effect excluded) except with the transient GHG forcing (CO 2 experiment) and orbital forcing (orbital experiment) imposed separately, keeping all remaining factors at the H1 (17 ka) value. Fig.S4 shows the temperature evolution over Greenland and Antarctic for Exp. DGL-A (black), CO 2 experiment (green solid) and orbital experiment (green dash) from H1 to BA. It is seen
5 5 SOM, BA_Science, Liu et al., revision2, 05/07/2009 that the warming in DGL-A is largely contributed by the CO 2 experiment. A further calculation shows that the zonal mean surface warming at high latitudes (>60 o ) is 3 times greater in the CO 2 experiment than in the orbital experiment (~3 o C vs ~1 o C). The CO 2. forcing is even more dominant in the tropics (<30 o latitude), with a surface warming of ~1 o C in the CO 2 experiment, but almost zero or slight cooling in the orbital experiment, the slight cooling in the latter being induced by the reduction of annual insolation associated with the increase of obliquity. For the global average, the surface warming is 6 times larger in the CO 2 experiment than in the orbital experiment (1.51 o C vs 0.25 o C). From these experiments, we conclude that the warming in Exp. DGL-A from H1 to pre- BA is dominated by the CO 2 forcing. 3. AMOC Hysteresis in CCSM3: The lack of a significant hysteresis in CCSM3 is seen more clearly in the hysteresis diagram, in which the model AMOC transport is plotted against the MWF (Fig.S5). As the MWF increases, the AMOC diminishes almost linearly, in contrast to many theoretical and intermediate climate models (S9-S11). In addition, as the MWF decreases, the model AMOC largely follows a trajectory of gradual recovery, instead of staying in the off-mode. Furthermore, we have performed dozens of hosing sensitivity experiments similar to those in other models, with the MWF over various regions and of various lengths, in both glacial state and Holocene state (not shown). Our experiments, and similar hosing experiments that have been carried out previously in CCSM3 (e.g. S12), all show a recovery of the AMOC as soon as the MWF stops. We have found no evidence of a significant hysteresis and multiple equilibria in CCSM3.
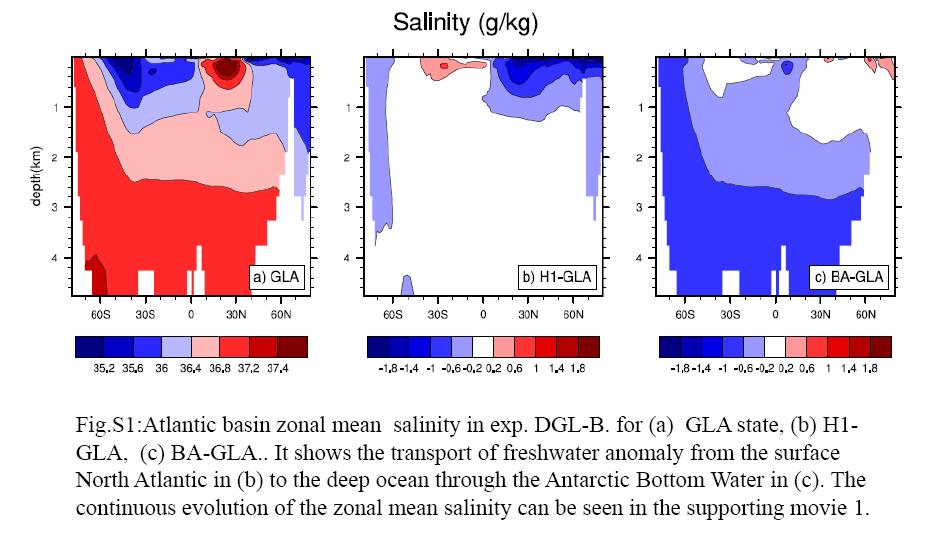
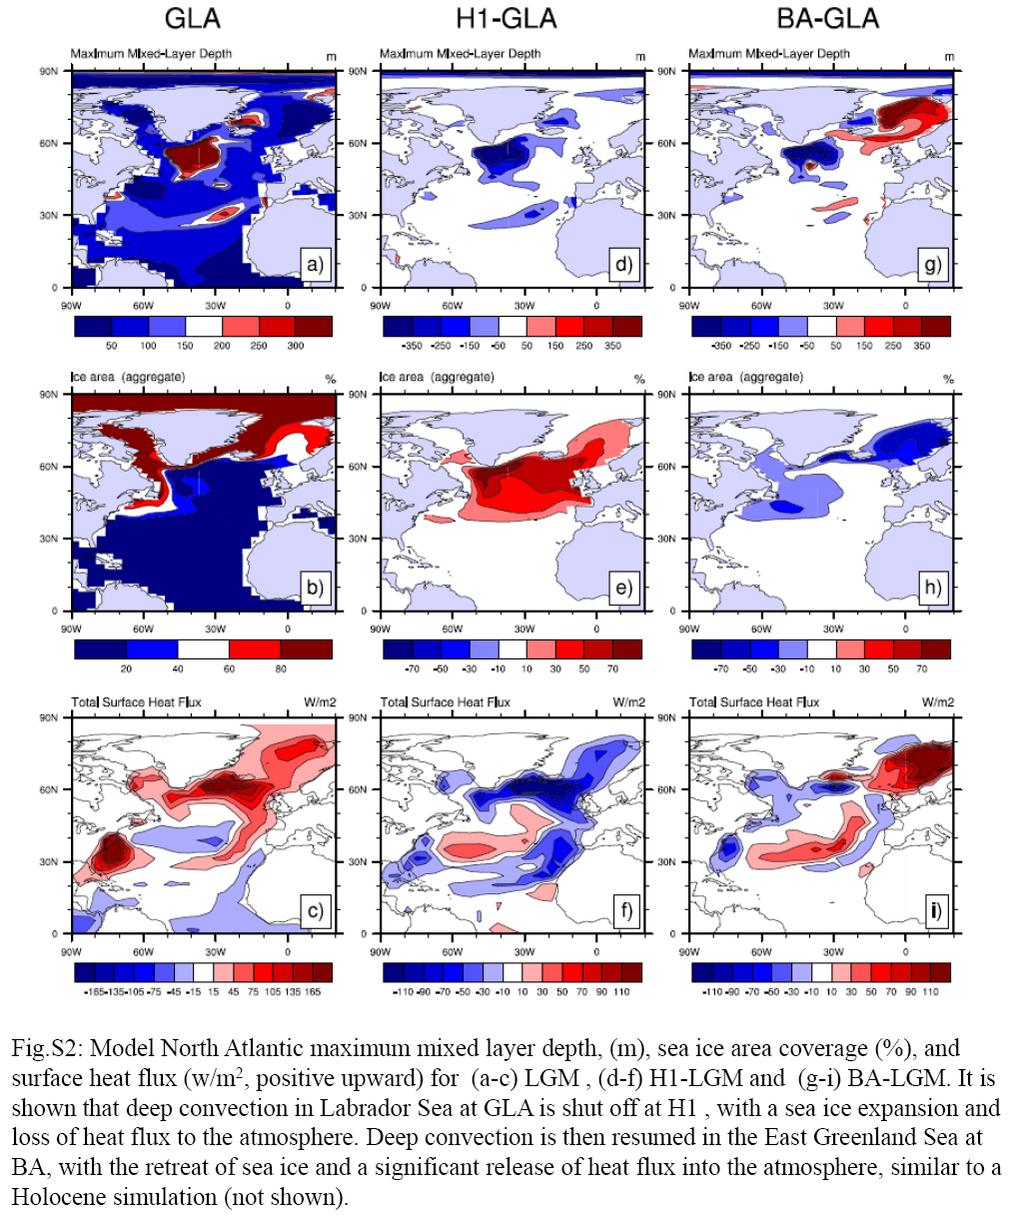
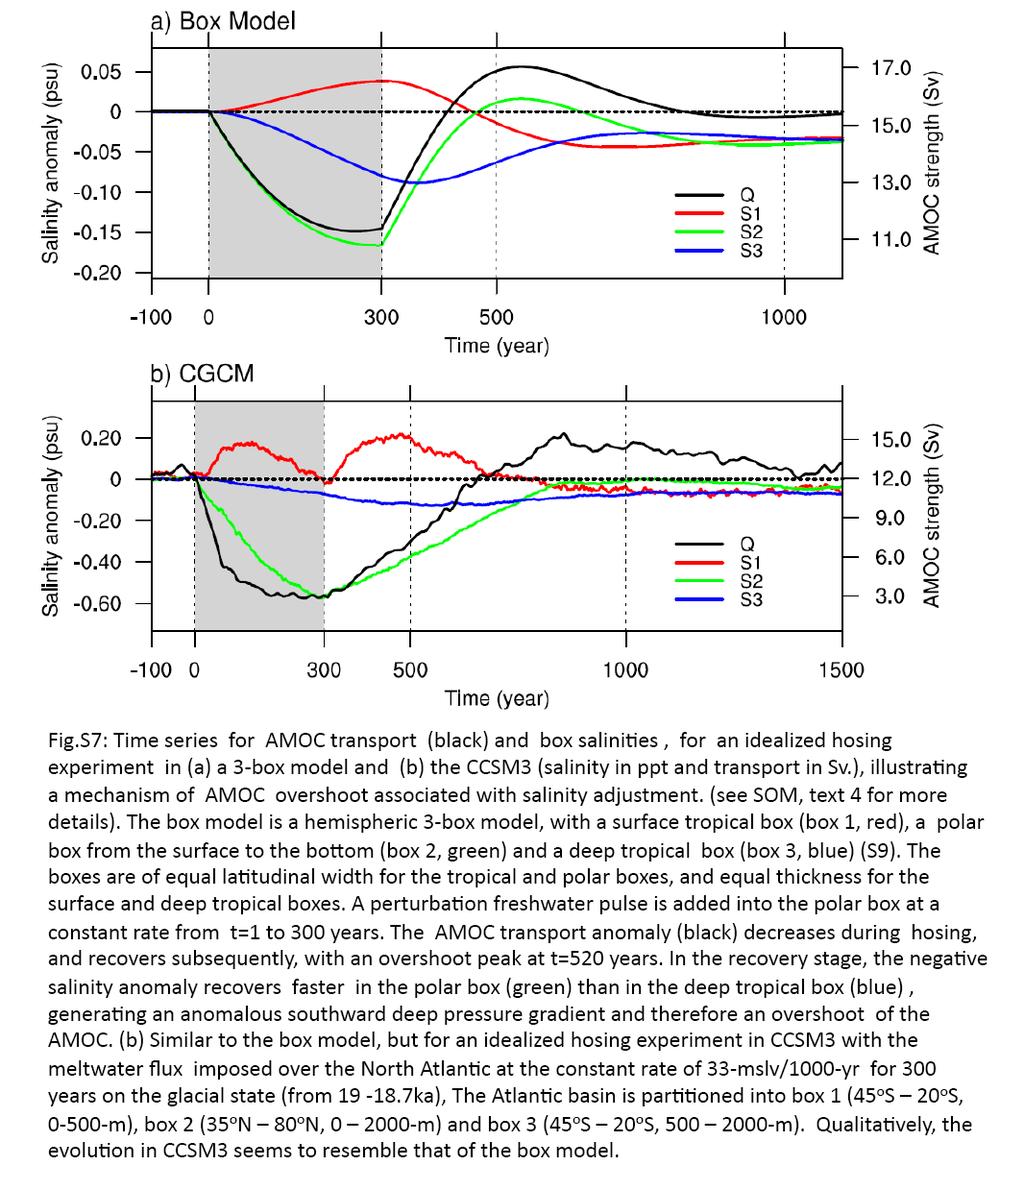
6 6 4: Mechanisms for the AMOC Overshoot: At the end of a freshwater pulse, the model AMOC tends to exhibit an overshoot beyond its pre-hosing level, inducing strong warming in the high latitude North Atlantic that lasts a few centuries after the freshwater termination. For the BA warming, this overshoot is associated partly with the strong subsurface warming in response to the long MWF during H1 (Fig.2f), which when the MWF is terminated, destabilizes the convection in the Nordic Sea (S13) and heats the atmosphere through an increased upward surface heat flux. The strong CO 2 warming is also important for the melting of sea ice in the Nordic Sea, and in turn the sudden onset of deep convection in this region. Another possible mechanism for the overshoot is a basin-wide salinity adjustment. This can be demonstrated in a 3-box model that consists of a single polar box that combines the surface and deep polar boxes together for representing the region of deep convection (S14) (Fig.S7a) (or a 4-box model with the surface and deep polar boxes separated (S15)). In its simplest form, the temperatures are fixed in each box while the salinity is forced by a freshwater flux forcing. This type of box model fundamentally differs from the classical Stommel box model (S16) in the inclusion of a deep polar water box that is separated from a deep tropical water box. Damped oscillatory eigenmodes are generated, which lead to a slow overshoot of the AMOC in response to a meltwater pulse as shown in the example in Fig.S7a. In response to a MWF between years 1-300, salinity and the attendant density decrease rapidly in the polar box, reducing the southward pressure gradient at depth and, therefore, the AMOC transport. With the termination of the meltwater flux at year 300, the salinity increases rapidly in the polar box because of
7 7 SOM, BA_Science, Liu et al., revision2, 05/07/2009 the fast recovery in the deep convection region. The recovery of the deep tropical salinity, however, lags behind the polar box. As a result, the polar box becomes saltier than the deep tropical box at year 360, generating an equatorward pressure gradient anomaly (relative to pre-hosing) in the deep ocean, which eventually leads to an overshoot of the AMOC beyond its pre-hosing level at year 430, with the peak at year 530. In the mean time, the surface tropical box becomes fresher because of the increased freshwater transport from below. This also contributes to an anomalous equatorward pressure gradient at depth, enhancing the overshoot. The key factor for this overshoot is the slower response time of the deep tropical ocean than the polar region, which creates a delay of the deep tropical salinity, and in turn an anomalous deep pressure gradient that is needed for the AMOC overshoot. This slow tropical deep ocean recovery for the overshoot appears to be operating in CCSM3 at glacial times, as illustrated in an idealized hosing experiment. For CCSM3, the three ocean boxes are averaged as: surface tropical box (box 1, 45 o S 20 o S, m), polar box (box 2, 35 o N 80 o N, m) and deep tropical box (box 3, 45 o S 20 o S, m). The evolution of the AMOC transport and the salinities of the three boxes are plotted for CCSM3 (Fig.S7b) similarly as for the box model (Fig.S7a). The CCSM3 shares a key feature of the overshoot with the box model: the earlier recovery of the polar ocean salinity than the deep tropical salinity. This AMOC overshoot is accompanied by a modest overshoot warming in the Nordic Sea region (3 o C over Greenland), but little signal to the south (not shown). In the transient simulations with complete forcing in DGL-A and B, the overshoot is likely to be contributed by both the convection mechanism and the salinity adjustment mechanism.
8 8 SOM, BA_Science, Liu et al., revision2, 05/07/2009 It remains unclear if the short (centennial) AMOC overshoot in CCSM3 existed in observation. The proxy for AMOC export (Pa/Th ratio in at Bermuda, Fig.1d, S17) does not exhibit an overshoot signal. This lack of overshoot signal, however, could be due to the poor temporal resolution or the long mixing time scale of the proxy itself. In addition, this lack of overshoot may be due to the location of this proxy. Dynamically, the short overshoot event is likely to be recorded more clearly along the deep western boundary current than in the interior ocean, because the deep western boundary current is affected by the upstream perturbation rapidly through the boundary current advection and boundary waves, while the interior ocean is affected by slow adjustment of interior advection and radiating Rossby waves from the eastern boundary. The proxy for AMOC export is located in the interior ocean on the Bermuda Rise (S17) and therefore may not be able to record the overshoot signal. In contrast, a recent high resolution proxy for deep western boundary current speed from the Eirik Drift shows a clear short overshoot at Bølling warming (S18). This location dependence of the overshoot signal is indeed consistent with our model, which shows no overshoot signal in the bottom water near Bermuda, but shows a clear overshoot signal at the Eirik Drift (not shown). Therefore, more high resolution data along the western boundary are needed to assess the existence of an overshoot signal. 5: Is CCSM3 Consistent with Observations for the Abrupt BA Warming? To our knowledge, CCSM3 is consistent with the observed abrupt BA warming within the observational uncertainty, largely because the precise history of MWF prior to BA remains highly uncertain. Indeed, MWF is the derivative of, and therefore much more
9 9 SOM, BA_Science, Liu et al., revision2, 05/07/2009 uncertain than, the sea level history. Furthermore, the global sea level change, which accounts for the accumulated MWF of all the sources, has a significant uncertainty in both the timing and magnitude (S19-S21). The CCSM3 scenarios for MWF are consistent with some reconstructions, considering the uncertainties. For example, the meltwater during H1 has been suggested to have occurred, in certain regions, in two pulses, H1A and H1B (S22). The later pulse H1A occurred between 16 ka and just before BA and may represent the last meltwater pulse whose termination could cause the abrupt BA. In addition, Clark et al. (S23) suggest that H1 MWF was bracketed by two major rerouting events into the Hudson River (R8 and R7). The later event (R7) is ~1000 kyr in duration and terminated just before BA. They argued that the combination of R8, H1, and R7 was responsible for the cold period prior to the Bølling, and the final rerouting that terminated R7 was a trigger for the BA warming. Alternatively, the abrupt BA may be caused by a slow stochastic meltwater forcing, via the so called stable collapse in a mono-stable system, as occurred in some climate-ecosystem models (S24). Finally, MWP-1A (S25, S26) can also be accommodated in CCSM3. Weaver et al. (S27) proposed that the BA was triggered by MWP-1A as a MWF from the Antarctic Ice Sheet, switching the AMOC equilibrium from the off-mode to the on-mode. In CCSM3, however, an Antarctic MWF the same as in ref. S27 fails to generate a BA warming (not shown). Instead, the MWF weakens the AMOC slightly through the upper ocean transport of freshwater into the North Atlantic, as in other GCMs (S28). Nevertheless, MWP-1A can be accommodated as a meltwater discharge from the Antarctic Ice Sheet (S29) contemporaneous with (S30, S31), instead of preceeding (S18), the BA, which is possible within dating uncertainties. As such, a large amount of
10 10 SOM, BA_Science, Liu et al., revision2, 05/07/2009 meltwater of MWP-1A is hidden in the Southern Ocean without a significant global impact. The other possibility is that a significant outflow of MWP-1A entered the Gulf of Mexico as hyperpycnal flow (S32). However, in current model simulations the hyperpycnal flow still is transported eventually into the North Atlantic, where it weakens the AMOC (S33), and recent analyses of runoff records suggests that <13% of the total MWP-1A volume entered the Gulf of Mexico as either a hyperpycnal or hypopycnal flow (S34).
11 11
12 12
13 13
14 14
15 15
16 16
17 17
18 18 References for SOM S1: W. D. Collins et al. J. Climate, 19, 2122 (2006) S2: S. G. Yeager, C. A. Shields, W. Large, J. Hack, J. Climate, 19, 2545 (2003) S3: B. L. Otto-Bliesner et al., J. Clim., 19, 2526 (2006) S4: B. L. Otto-Bliesner et al., Geophys. Res. Lett., 34, L12707, doi: /2007gl (2007). S5: F. Joos, R. Spahni, Proc Nat Aca Sci, 105, 1425, doi: /pnas (2008). S6: W. R. Peltier, Annu. Rev. Earth Planet. Sci., 32, 111 (2004) S7: Z. Liu, M. Alexander, Rev. Geophys., 45, RG2005, doi: /2005rg (2007). S8: P. U. Clark, N.G. Pisias, T.F. Stocker, A.J. Weaver, Nature, 415, 863 (2002) S9. H. Dijkstra, Tellus, 59A, (2007) S10. S. Rahmstorf, Nature, 378, 145 (1995). S11. S. Rahmstorf, et al., Geophys. Res. Lett., L23605, doi: /2005gl (2005)). S12: A. Hu, B. L. Otto-Bliesner, G. A. Meehl and W. Han, J. Climate, 21, (2008) S13: J. Mignot, A. Ganopolski, A. Levermann, J. Clim., 20, 4884 (2007) S14: E. Tzipermann, P. Ioannou, J. Phys. Oceanogr., 32, 3427 (2002) S15: E. Tzipermann, J. Toggweiler, Y. Feilks, K. Bryan, J. Phys. Oceanogr., 24, 217 (1994)
19 S16: H. Stommel, Tellus, 13, 224 (1961) 19 S17. J. F. McManus, R. Francois, J-M., Gherardi L. Keigwin, S. Brown-Leger, Nature, 428, 834 (2004) S18. J. Stanford et al., Paleoceanography, 21, PA4103, doi: /2006pa (2006) S19: Y. Yokoyama, K. Lambeck, P. Deckker, P. Johnston, L. Keith Fifield, Nature, 406,713 (2000) S20: P. U. Clark, A.C. Mix, Quat. Sci. Rev., 21, 1 (2002) S21: W. Peltier, R. Fairbanks, Quat. Sci. Rev., 25, 3322 (2006) S22: E. Bard, F. Rostek, J-L Turon, S. Gandreau, Science, 289, 1321 (2000) S23: P. U. Clark et al., Science, 293, 283 (2001) S24: Z. Liu, Y. Wang, R. Gallimore, M. Notaro, I. C. Prentice, Geophys. Res. Lett., 33, L22709, doi: /2006gl (2006). S25: R. Fairbanks, Nature, 342, 637 (1989) S26: T. Henebuth, K. Stattegger, P. Grootes, Science, 298, 1033 (2000) S27: A. J. Weaver,, O. A. Saenko, P. U. Clark, J. X. Mitrovica, Science, 299, 1709 (2002) S28: R. Stouffer, D. Dsidov, B. Haupt, J. Climate, 20, 436 (2007) S29: P. U. Clark et al., Paleoceanography, 11, 563 (1996) S30: T. Hanebuth, K. Stattegger, P.M. Grootes, Science, 288, 1033 (2000) S31: K.B. Cutler et al., Earth Planet. Sci. Lett., 206, 253 (2003) S32: W. Peltier, G. Vettoretti, M. Stastna, Geophys. Res. Lett., 33 doi: /2005gl (2006)
20 20 SOM, BA_Science, Liu et al., revision2, 05/07/2009 S33: D. Roche, H. Renssen, S. Weber, H. Goosse, Geophys. Res. Lett., 34, doi: /2007gl (2007) S34: A.E. Carlson, Quat. Sci. Rev., 28, in press (2009)
Rapid Climate Change: Heinrich/Bolling- Allerod Events and the Thermohaline Circulation. By: Andy Lesage April 13, 2010 Atmos.
 Rapid Climate Change: Heinrich/Bolling- Allerod Events and the Thermohaline Circulation By: Andy Lesage April 13, 2010 Atmos. 6030 Outline Background Heinrich Event I/Bolling-Allerod Transition (Liu et
The stability of an evolving Atlantic meridional overturning circulation
 GEOPHYSICAL RESEARCH LETTERS, VOL. 40, 1562 1568, doi:10.1002/grl.50365, 2013 The stability of an evolving Atlantic meridional overturning circulation Wei Liu, 1,2 Zhengyu Liu, 3,2 and Aixue Hu 4 Received
Response of Thermohaline Circulation to Freshwater. Forcing under Present Day and LGM Conditions
 Response of Thermohaline Circulation to Freshwater Forcing under Present Day and LGM Conditions Aixue Hu 1, Bette L. Otto-Bliesner 1, Gerald A. Meehl 1, Weiqing Han 2, Carrie Morrill 3, Esther C. Brady
Sensitivity of the Younger Dryas climate to changes in freshwater, orbital, and greenhouse gas forcing in CESM1.
 OCE-1536630 EAR-0903071 Sensitivity of the Younger Dryas climate to changes in freshwater, orbital, and greenhouse gas forcing in CESM1. The 21 st Annual CESM Workshop Paleoclimate Working Group Taylor
Simulating Transient Climate Evolution of the Last deglaciation with CCSM3. Feng He DOCTOR OF SCIENCES. (Atmospheric and Oceanic Sciences)
") Simulating Transient Climate Evolution of the Last deglaciation with CCSM3 by Feng He A thesis submitted in partial fulfillment of the requirements for the degree of DOCTOR OF SCIENCES (Atmospheric and
Simulating Transient Climate Evolution of the Last deglaciation with CCSM3 by Feng He A thesis submitted in partial fulfillment of the requirements for the degree of DOCTOR OF SCIENCES (Atmospheric and
The role of meltwater-induced subsurface ocean warming in regulating the Atlantic meridional overturning in glacial climate simulations
 Clim Dyn DOI 10.1007/s00382-010-0925-9 The role of meltwater-induced subsurface ocean warming in regulating the Atlantic meridional overturning in glacial climate simulations Esther C. Brady Bette L. Otto-Bliesner
Simulated Two-Stage Recovery of Atlantic Meridional Overturning Circulation During the Last Deglaciation
 Simulated Two-Stage Recovery of Atlantic Meridional Overturning Circulation During the Last Deglaciation Jun Cheng, 1 Zhengyu Liu, 2,3 Feng He, 2 Bette L. Otto-Bliesner, 4 Esther C. Brady, 4 and Mark Wehrenberg
Response of Thermohaline Circulation to Freshwater Forcing under Present-Day and LGM Conditions
 15 MAY 2008 H U E T A L. 2239 Response of Thermohaline Circulation to Freshwater Forcing under Present-Day and LGM Conditions AIXUE HU, BETTE L. OTTO-BLIESNER, AND GERALD A. MEEHL Climate and Global Dynamics
Transient response of the MOC and climate to potential melting of the Greenland Ice Sheet in the 21st century
 Click Here for Full Article GEOPHYSICAL RESEARCH LETTERS, VOL. 36, L10707, doi:10.1029/2009gl037998, 2009 Transient response of the MOC and climate to potential melting of the Greenland Ice Sheet in the
AMOC Response to Climate Change: Questions after TRACE21
 AMOC Response to Climate Change: Questions after TRACE21 Zhengyu Liu University of Wisconsin-Madison TRACE21 collaborators Jiang Zhu, UW-Madison Wei Liu, Yale Univ. Esther Brady, NCAR Bette Otto-Bliesner,
Bering Strait, AMOC hysteresis, and abrupt climate change
 DOE/UCAR Cooperative Agreement Regional and Global Climate Modeling Program Bering Strait, AMOC hysteresis, and abrupt climate change Aixue Hu Gerald A. Meehl, Weiqing Han, Axel Timmerman, Bette Otto-Bliester,
1. Methods: Description of the climate model LOVECLIM
 SWINGEDOUW ET AL.: SUPPLEMENTARY INFORMATIONS X - 1 1. Methods: Description of the climate model LOVECLIM LOVECLIM consists of five components representing the atmosphere (ECBilt), the ocean and sea ice
Modes of Global Climate Variability during Marine Isotope Stage 3 (60 26 ka)
") 15 MARCH 2010 P I S I A S E T A L. 1581 Modes of Global Climate Variability during Marine Isotope Stage 3 (60 26 ka) NICKLAS G. PISIAS College of Oceanic and Atmospheric Sciences, Oregon State University,
15 MARCH 2010 P I S I A S E T A L. 1581 Modes of Global Climate Variability during Marine Isotope Stage 3 (60 26 ka) NICKLAS G. PISIAS College of Oceanic and Atmospheric Sciences, Oregon State University,
Continental Hydrology, Rapid Climate Change, and the Intensity of the Atlantic MOC: Insights from Paleoclimatology
 Continental Hydrology, Rapid Climate Change, and the Intensity of the Atlantic MOC: Insights from Paleoclimatology W.R. Peltier Department of Physics University of Toronto WOCE derived N-S salinity section
When Did the Anthropocene Begin? Observations and Climate Model Simulations
 When Did the Anthropocene Begin? Observations and Climate Model Simulations by John Kutzbach University of Wisconsin-Madison March 31, 2011 Colleagues: W. Ruddiman, S. Vavrus, G. Philippon-Berrthier Main
Welcome to ATMS 111 Global Warming.
 Welcome to ATMS 111 Global Warming http://www.atmos.washington.edu/2010q1/111 Isotopic Evidence 16 O isotopes "light 18 O isotopes "heavy" Evaporation favors light Rain favors heavy Cloud above ice is
ATOC OUR CHANGING ENVIRONMENT Class 19 (Chp 6) Objectives of Today s Class: The Cryosphere [1] Components, time scales; [2] Seasonal snow
![ATOC OUR CHANGING ENVIRONMENT Class 19 (Chp 6) Objectives of Today s Class: The Cryosphere [1] Components, time scales; [2] Seasonal snow](/thumbs/95/126309683.jpg "ATOC OUR CHANGING ENVIRONMENT Class 19 (Chp 6) Objectives of Today s Class: The Cryosphere [1] Components, time scales; [2] Seasonal snow") ATOC 1060-002 OUR CHANGING ENVIRONMENT Class 19 (Chp 6) Objectives of Today s Class: The Cryosphere [1] Components, time scales; [2] Seasonal snow cover, permafrost, river and lake ice, ; [3]Glaciers and
ATOC 1060-002 OUR CHANGING ENVIRONMENT Class 19 (Chp 6) Objectives of Today s Class: The Cryosphere [1] Components, time scales; [2] Seasonal snow cover, permafrost, river and lake ice, ; [3]Glaciers and
This article appeared in a journal published by Elsevier. The attached copy is furnished to the author for internal non-commercial research and
 This article appeared in a journal published by Elsevier. The attached copy is furnished to the author for internal non-commercial research and education use, including for instruction at the authors institution
ATOC OUR CHANGING ENVIRONMENT
 ATOC 1060-002 OUR CHANGING ENVIRONMENT Class 22 (Chp 15, Chp 14 Pages 288-290) Objectives of Today s Class Chp 15 Global Warming, Part 1: Recent and Future Climate: Recent climate: The Holocene Climate
RAPID TRANSITIONS OF THE THERMOHALINE OCEAN CIRCULATION
 Chapter 9 RAPID TRANSITIONS OF THE THERMOHALINE OCEAN CIRCULATION A Modelling Perspective Stefan Rahmstorf Potsdam Institute for Climate Impact Research PO Box 60 12 03, D-14412 Potsdam, Germany www.pik-potsdam.de/~stefan
Speleothems and Climate Models
 Earth and Life Institute Georges Lemaître Centre for Earth and Climate Research Université catholique de Louvain, Belgium Speleothems and Climate Models Qiuzhen YIN Summer School on Speleothem Science,
LETTERS. Influence of the Thermohaline Circulation on Projected Sea Level Rise
 VOLUME 13 JOURNAL OF CLIMATE 15 JUNE 2000 LETTERS Influence of the Thermohaline Circulation on Projected Sea Level Rise RETO KNUTTI AND THOMAS F. STOCKER Climate and Environmental Physics, Physics Institute,
An integrated speleothem proxy and climate modeling study of the last deglacial climate in the Pacific Northwest
 An integrated speleothem proxy and climate modeling study of the last deglacial climate in the Pacific Northwest Jerry Potter UC Davis, University of Michigan, NASA GSFC Isabel Montanez, University of
Final Technical Report
 1 Final Technical Report: 2008-2012 DOE Award No: DE-FG02-08ER64593, MSN116474/144-PRJ17GQ, Name of Institution: University of Wisconsin-Madison Project Title: A Collaborative Proposal: Simulating and
SUPPLEMENTARY INFORMATION
 SUPPLEMENTARY INFORMATION DOI: 10.1038/NGEO1189 Different magnitudes of projected subsurface ocean warming around Greenland and Antarctica Jianjun Yin 1*, Jonathan T. Overpeck 1, Stephen M. Griffies 2,
Rain driven by receding ice sheets as a cause of past climate change
 PALEOCEANOGRAPHY, VOL. 24,, doi:10.1029/2009pa001778, 2009 Rain driven by receding ice sheets as a cause of past climate change Ian Eisenman, 1,2 Cecilia M. Bitz, 2 and Eli Tziperman 3,4 Received 6 April
Climate Roles of Land Surface
 Lecture 5: Land Surface and Cryosphere (Outline) Climate Roles Surface Energy Balance Surface Water Balance Sea Ice Land Ice (from Our Changing Planet) Surface Albedo Climate Roles of Land Surface greenhouse
Chapter 15 Millennial Oscillations in Climate
 Chapter 15 Millennial Oscillations in Climate This chapter includes millennial oscillations during glaciations, millennial oscillations during the last 8000 years, causes of millennial-scale oscillations,
Land Surface Sea Ice Land Ice. (from Our Changing Planet)
") Lecture 5: Land Surface and Cryosphere (Outline) Land Surface Sea Ice Land Ice (from Our Changing Planet) Earth s s Climate System Solar forcing Atmosphere Ocean Land Solid Earth Energy, Water, and Biochemistry
Lecture 5: Land Surface and Cryosphere (Outline) Land Surface Sea Ice Land Ice (from Our Changing Planet) Earth s s Climate System Solar forcing Atmosphere Ocean Land Solid Earth Energy, Water, and Biochemistry
Earth s Climate System. Surface Albedo. Climate Roles of Land Surface. Lecture 5: Land Surface and Cryosphere (Outline) Land Surface Sea Ice Land Ice
 Land Surface Sea Ice Land Ice") Lecture 5: Land Surface and Cryosphere (Outline) Earth s Climate System Solar forcing Land Surface Sea Ice Land Ice Atmosphere Ocean Land Solid Earth Energy, Water, and Biochemistry Cycles (from Our Changing
Lecture 5: Land Surface and Cryosphere (Outline) Earth s Climate System Solar forcing Land Surface Sea Ice Land Ice Atmosphere Ocean Land Solid Earth Energy, Water, and Biochemistry Cycles (from Our Changing
6. What has been the most effective erosive agent in the climate system? a. Water b. Ice c. Wind
 Multiple Choice. 1. Heinrich Events a. Show increased abundance of warm-water species of planktic foraminifera b. Show greater intensity since the last deglaciation c. Show increased accumulation of ice-rafted
Ruddiman CHAPTER 13. Earth during the LGM ca. 20 ka BP
 Ruddiman CHAPTER 13 Earth during the LGM ca. 20 ka BP The Last Glacial Maximum When? How much more ice than today? How much colder was it than today (global average)? How much lower were snowlines? Did
Supplementary Figure 1. New downcore data from this study. Triangles represent the depth of radiocarbon dates. Error bars represent 2 standard error
 Supplementary Figure 1. New downcore data from this study. Triangles represent the depth of radiocarbon dates. Error bars represent 2 standard error of measurement (s.e.m.). 1 Supplementary Figure 2. Particle
Ice on Earth: An overview and examples on physical properties
 Ice on Earth: An overview and examples on physical properties - Ice on Earth during the Pleistocene - Present-day polar and temperate ice masses - Transformation of snow to ice - Mass balance, ice deformation,
How is abrupt (paleo) climate change transmitted to the mid latitude Southern Hemisphere? Connecting the tropics to polar regions
 climate change transmitted to the mid latitude Southern Hemisphere? Connecting the tropics to polar regions") How is abrupt (paleo) climate change transmitted to the mid latitude Southern Hemisphere? -or - In defense of the wind hypothesis Connecting the tropics to polar regions LDEO, 2-3 June 2014 Bob Anderson
How is abrupt (paleo) climate change transmitted to the mid latitude Southern Hemisphere? -or - In defense of the wind hypothesis Connecting the tropics to polar regions LDEO, 2-3 June 2014 Bob Anderson
Last Glacial Maximum ocean thermohaline circulation: PMIP2 model intercomparisons and data constraints
 Click Here for Full Article GEOPHYSICAL RESEARCH LETTERS, VOL. 34, L12706, doi:10.1029/2007gl029475, 2007 Last Glacial Maximum ocean thermohaline circulation: PMIP2 model intercomparisons and data constraints
Jacob Schewe Potsdam Institute for Climate Impact Research. Ocean circulation under climate change: Examples of qualitative changes
 Jacob Schewe Potsdam Institute for Climate Impact Research Ocean circulation under climate change: Examples of qualitative changes Acknowledgments Anders Levermann Potsdam Institute for Climate Impact
Centennial-scale Climate Change from Decadally-paced Explosive Volcanism
 Centennial-scale Climate Change from Decadally-paced Explosive Volcanism Yafang Zhong and Gifford Miller INSTAAR, University of Colorado at Boulder, USA Bette Otto-Bliesner, Caspar Ammann, Marika Holland,
Modelling carbon cycle feedbacks during abrupt climate change
 ARTICLE IN PRESS Quaternary Science Reviews 23 (24) 431 448 Modelling carbon cycle feedbacks during abrupt climate change Tracy L. Ewen a, *, Andrew J. Weaver a, Andreas Schmittner b a Department of Earth
Chapter 5. Sensitivity of the North Atlantic climate to Greenland Ice Sheet melting during the Last Interglacial
 Chapter 5 Sensitivity of the North Atlantic climate to Greenland Ice Sheet melting during the Last Interglacial Abstract During the Last Interglacial (LIG; 130,000yrs before present), part of the Greenland
Ocean & climate: an introduction and paleoceanographic perspective
 Ocean & climate: an introduction and paleoceanographic perspective Edouard BARD Chaire de l évolution du climat et de l'océan du Collège de France CEREGE, UMR CNRS, AMU, IRD, CdF Aix-en-Provence The ocean
SIO 210 Final Exam December 10, :30 2:30 NTV 330 No books, no notes. Calculators can be used.
 SIO 210 Final Exam December 10, 2003 11:30 2:30 NTV 330 No books, no notes. Calculators can be used. There are three sections to the exam: multiple choice, short answer, and long problems. Points are given
Fast and Slow Response of Sea ice and the Southern Ocean to Ozone Depletion
 Fast and Slow Response of Sea ice and the Southern Ocean to Ozone Depletion Annual Minimum Sea ice extent 1979-2013 10 6 km 2 Arctic September Antarctic February Data from in passive microwave satellite
Future risk of tipping points
 Future risk of tipping points Tim Lenton (t.m.lenton@exeter.ac.uk) Thanks to Chris Boulton, Valerie Livina, Vasilis Dakos, Marten Scheffer, John Schellnhuber Outline Tipping points Early warning Taster
Our Climate without Antarctica
 Our Climate without Antarctica Cecilia Bitz, Hansi Singh, Dargan Frierson University of Washington Andrew Pauling, Inga Smith, & Pat Langhorne University of Otago Photo by John Weller Ice Shelf Cavity
Early warning of climate tipping points Tim Lenton
 Early warning of climate tipping points Tim Lenton With thanks to John Schellnhuber, Valerie Livina, Vasilis Dakos, Marten Scheffer Outline Tipping elements Early warning methods Tests and application
Rapid climate change in ice cores
 Rapid climate change in ice cores Liz Thomas British Antarctic Survey Overview Introduction to ice cores Evidence of rapid climate change in the Greenland ice cores DO events Younger Dryas 8.2 kyr cold
The role of North Atlantic Ocean dynamics in simulating glacial inception: a study with CCSM4
 The role of North Atlantic Ocean dynamics in simulating glacial inception: a study with CCSM4 Feng He, Steve J. Vavrus, John E. Kutzbach Center for Climatic Research, University of Wisconsin-Madison William
Climate sensitivity of coupled models with differing ocean components
 Climate sensitivity of coupled models with differing ocean components Alex Megann, Adam Blaker and Adrian New National Oceanography Centre, Southampton, UK LOM Workshop, Miami, February 2011 Overview Introduction
We re living in the Ice Age!
 Chapter 18. Coping with the Weather: Causes and Consequences of Naturally Induce Climate Change 지구시스템의이해 We re living in the Ice Age! 1 Phanerozoic Climate 서늘해지고 더웠고 따뜻했고 3 Climate Rollercoaster 4 2 Time
A GCM Reconstruction of the Last Glacial Inception
 A GCM Reconstruction of the Last Glacial Inception Megan Essig 1, Francis Otieno 2, Robert Oglesby 1, David Bromwich 2 1 Department of Geosciences, University of Nebraska, Lincoln 2 Polar Meteorology Group,
SUPPLEMENTARY INFORMATION
 1. Simulation of Glacial Background Climate Globally averaged surface air is 3 K cooler than in the pre-industrial simulation. This is less than the 4-7 K cooling estimated for the Last Glacial Maximum
Lecture 1. Amplitude of the seasonal cycle in temperature
 Lecture 6 Lecture 1 Ocean circulation Forcing and large-scale features Amplitude of the seasonal cycle in temperature 1 Atmosphere and ocean heat transport Trenberth and Caron (2001) False-colour satellite
Deep Ocean Circulation & implications for Earth s climate
 Deep Ocean Circulation & implications for Earth s climate I. Ocean Layers and circulation types 1) Ocean Layers Ocean is strongly Stratified Consists of distinct LAYERS controlled by density takes huge
Hysteresis Behavior of the Atlantic Ocean Circulation Identified in Observational Data
 15 JANUARY 2011 D I M A A N D L O H M A N N 397 Hysteresis Behavior of the Atlantic Ocean Circulation Identified in Observational Data MIHAI DIMA Alfred Wegener Institute for Polar and Marine Research,
Equilibrium Climate Sensitivity: is it accurate to use a slab ocean model? Gokhan Danabasoglu and Peter R. Gent
 Equilibrium Climate Sensitivity: is it accurate to use a slab ocean model? by Gokhan Danabasoglu and Peter R. Gent National Center for Atmospheric Research Boulder, Colorado 80307 Abstract The equilibrium
Last Glacial Maximum ice sheet impacts on North Atlantic climate variability: The importance of the sea ice lid
 GEOPHYSICAL RESEARCH LETTERS, VOL. 40, 6378 6383, doi:10.1002/2013gl058486, 2013 Last Glacial Maximum ice sheet impacts on North Atlantic climate variability: The importance of the sea ice lid Guido Vettoretti
2/18/2013 Estimating Climate Sensitivity From Past Climates Outline
 Estimating Climate Sensitivity From Past Climates Outline Zero-dimensional model of climate system Climate sensitivity Climate feedbacks Forcings vs. feedbacks Paleocalibration vs. paleoclimate modeling
MERIDIONAL OVERTURNING CIRCULATION: SOME BASICS AND ITS MULTI-DECADAL VARIABILITY
 MERIDIONAL OVERTURNING CIRCULATION: SOME BASICS AND ITS MULTI-DECADAL VARIABILITY Gokhan Danabasoglu National Center for Atmospheric Research OUTLINE: - Describe thermohaline and meridional overturning
The Influence of Obliquity on Quaternary Climate
 The Influence of Obliquity on Quaternary Climate Michael P. Erb 1, C. S. Jackson 1, and A. J. Broccoli 2 1 Institute for Geophysics, University of Texas at Austin, Austin, TX 2 Department of Environmental
Stability and variability of the thermohaline circulation in the past and future: a study with a coupled model of intermediate complexity
 Stability and variability of the thermohaline circulation in the past and future: a study with a coupled model of intermediate complexity Andrey Ganopolski, Stefan Rahmstorf Potsdam Institute for Climate
The Climate Sensitivity of the Community Climate System Model: CCSM3. Jeffrey T. Kiehl*, Christine A. Shields, James J. Hack and William D.
 For JCLI CCSM Special Issue The Climate Sensitivity of the Community Climate System Model: CCSM3 Jeffrey T. Kiehl*, Christine A. Shields, James J. Hack and William D. Collins National Center for Atmospheric
Components of the Climate System. Lecture 2: Earth s Climate System. Pop Quiz. Sub-components Global cycles What comes in What goes out
 Lecture 2: Earth s Climate System Components of the Climate System terrestrial radiation Atmosphere Ocean solar radiation Land Energy, Water, and Biogeochemistry Cycles Sub-components Global cycles What
Natural Climate Variability: Longer Term
 Natural Climate Variability: Longer Term Natural Climate Change Today: Natural Climate Change-2: Ice Ages, and Deep Time Geologic Time Scale background: Need a system for talking about unimaginable lengths
Lecture 2: Earth s Climate System
 Lecture 2: Earth s Climate System terrestrial radiation solar radiation Atmosphere Ocean Solid Earth Land Energy, Water, and Biogeochemistry Cycles Sub-components Global cycles What comes in What goes
How Will Melting Ice Sheets Affect Us?
 PASSAGE 4 How Will Melting Ice Sheets Affect Us? Variation is normal. During the last ice age, for example, ice sheets also covered much of North America and Scandinavia. Why is what s happening now different
Adjustment of the global climate to an abrupt slowdown of the Atlantic meridional overturning circulation
 Adjustment of the global climate to an abrupt slowdown of the Atlantic meridional overturning circulation Wei Cheng 1, Cecilia M. Bitz 2, John C.H. Chiang 3 1 Joint Institute for the Study of the Atmosphere
Wind effect on the Atlantic meridional overturning circulation via sea ice and vertical diffusion
 Clim Dyn (2016) 46:3387 3403 DOI 10.1007/s00382-015-2774-z Wind effect on the Atlantic meridional overturning circulation via sea ice and vertical diffusion Haijun Yang 1 Kun Wang 1 Haijin Dai 1 Yuxing
Supporting Online Material for
 www.sciencemag.org/cgi/content/full/1167625/dc1 Supporting Online Material for Greatly Expanded Tropical Warm Pool and Weakened Hadley Circulation in the Early Pliocene Chris M. Brierley, Alexey V. Fedorov,*
SUPPLEMENTARY INFORMATION
 SUPPLEMENTARY INFORMATION doi: 10.108/ngeo75 This section includes additional information for the model parameters as well as the results of a set of sensitivity experiments to illustrate the dependence
IMPACTS OF A WARMING ARCTIC
 The Earth s Greenhouse Effect Most of the heat energy emitted from the surface is absorbed by greenhouse gases which radiate heat back down to warm the lower atmosphere and the surface. Increasing the
Evolution and forcing mechanisms of El Niño over the past 21,000 years. MWF in NH (m kyr 1 ) AMOC (Sv) 1.4. N S SST diff. (ºC)
 AMOC (Sv) 1.4. N S SST diff. (ºC)") doi:10.1038/nature13963 Evolution and forcing mechanisms of El Niño over the past 21,000 years Zhengyu Liu 1,2, Zhengyao Lu 2, Xinyu Wen 2, B. L. Otto-Bliesner 3, A. Timmermann 4 & K. M. Cobb 5 The El
doi:10.1038/nature13963 Evolution and forcing mechanisms of El Niño over the past 21,000 years Zhengyu Liu 1,2, Zhengyao Lu 2, Xinyu Wen 2, B. L. Otto-Bliesner 3, A. Timmermann 4 & K. M. Cobb 5 The El
An Indicator of the Multiple Equilibria Regime of the Atlantic Meridional Overturning Circulation
 MARCH 2010 H U I S M A N E T A L. 551 An Indicator of the Multiple Equilibria Regime of the Atlantic Meridional Overturning Circulation SELMA E. HUISMAN, MATTHIJS DEN TOOM, AND HENK A. DIJKSTRA Institute
Paleoclimatic constraints on climate sensivity learning from paleoclimate modelling: last glacial maximum mid-holocene
 Reducing the uncertainty in the prediction of global warming Jerusalem, 12-16 January 2009 Paleoclimatic constraints on climate sensivity learning from paleoclimate modelling: last glacial maximum mid-holocene
Abrupt intensification of ENSO forced by deglacial ice-sheet retreat in CCSM3. Zhengyao Lu, Zhengyu Liu & Jiang Zhu
 Abrupt intensification of ENSO forced by deglacial ice-sheet retreat in CCSM3 Zhengyao Lu, Zhengyu Liu & Jiang Zhu Climate Dynamics Observational, Theoretical and Computational Research on the Climate
Evolution and forcing mechanisms of ENSO over the last 300,000 years in CCSM3
 Clim. Past Discuss., doi:.194/cp-16-128, 17 Evolution and forcing mechanisms of ENSO over the last 3, years in CCSM3 Zhengyao Lu 1, Zhengyu Liu 2,1, Guangshan Chen 2, Jian Guan 1 1 Lab. Climate, Ocean
LETTERS. Tropical Stabilization of the Thermohaline Circulation in a Greenhouse Warming Simulation
 VOLUME 13 JOURNAL OF CLIMATE 1JUNE 2000 LETTERS Tropical Stabilization of the Thermohaline Circulation in a Greenhouse Warming Simulation M. LATIF, E.ROECKNER, U.MIKOLAJEWICZ, AND R. VOSS Max-Planck-Institut
Response to Reviewers. Reviewer #1 (Jenny Brandefelt) Major concerns:
 Major concerns:") Response to Reviewers We wish to thank the reviewers for their insightful comments which we feel have substantially improved our manuscript. We believe we have addressed all of the major and minor comments
Response to Reviewers We wish to thank the reviewers for their insightful comments which we feel have substantially improved our manuscript. We believe we have addressed all of the major and minor comments
1. Introduction 2. Ocean circulation a) Temperature, salinity, density b) Thermohaline circulation c) Wind-driven surface currents d) Circulation and
 Temperature, salinity, density b) Thermohaline circulation c) Wind-driven surface currents d) Circulation and") 1. Introduction 2. Ocean circulation a) Temperature, salinity, density b) Thermohaline circulation c) Wind-driven surface currents d) Circulation and climate change e) Oceanic water residence times 3.
1. Introduction 2. Ocean circulation a) Temperature, salinity, density b) Thermohaline circulation c) Wind-driven surface currents d) Circulation and climate change e) Oceanic water residence times 3.
Supplementary Figure 1 Trends of annual mean maximum ocean mixed layer depth. Trends from uninitialized simulations (a) and assimilation simulation
 and assimilation simulation") Supplementary Figure 1 Trends of annual mean maximum ocean mixed layer depth. Trends from uninitialized simulations (a) and assimilation simulation (b) from 1970-1995 (units: m yr -1 ). The dots show grids
Supplementary Figure 1 Trends of annual mean maximum ocean mixed layer depth. Trends from uninitialized simulations (a) and assimilation simulation (b) from 1970-1995 (units: m yr -1 ). The dots show grids
Global ocean response to orbital forcing in the Holocene
 PALEOCEANOGRAPHY, VOL. 18, NO. 2, 1041, doi:10.1029/2002pa000819, 2003 Global ocean response to orbital forcing in the Holocene Z. Liu Center for Climatic Research, University of Wisconsin, Madison, Wisconsin,
Tropical Pacific responses to Neogene Andean uplift and highlatitude. Ran Feng and Chris Poulsen University of Michigan
 Tropical Pacific responses to Neogene Andean uplift and highlatitude sea ice expansion Ran Feng and Chris Poulsen University of Michigan Reconstructions of Neogene equatorial Pacific SSTs SST difference
Paleoclimatology ATMS/ESS/OCEAN 589. Abrupt Climate Change During the Last Glacial Period
 Paleoclimatology ATMS/ESS/OCEAN 589 Ice Age Cycles Are they fundamentaly about ice, about CO2, or both? Abrupt Climate Change During the Last Glacial Period Lessons for the future? The Holocene Early Holocene
Torben Königk Rossby Centre/ SMHI
 Fundamentals of Climate Modelling Torben Königk Rossby Centre/ SMHI Outline Introduction Why do we need models? Basic processes Radiation Atmospheric/Oceanic circulation Model basics Resolution Parameterizations
MAR 110 LECTURE #10 The Oceanic Conveyor Belt Oceanic Thermohaline Circulation
 1 MAR 110 LECTURE #10 The Oceanic Conveyor Belt Oceanic Thermohaline Circulation Ocean Climate Temperature Zones The pattern of approximately parallel oceanic surface isotherms (lines of constant temperature)
Orbital-Scale Interactions in the Climate System. Speaker:
 Orbital-Scale Interactions in the Climate System Speaker: Introduction First, many orbital-scale response are examined.then return to the problem of interactions between atmospheric CO 2 and the ice sheets
An Introduction to Coupled Models of the Atmosphere Ocean System
 An Introduction to Coupled Models of the Atmosphere Ocean System Jonathon S. Wright jswright@tsinghua.edu.cn Atmosphere Ocean Coupling 1. Important to climate on a wide range of time scales Diurnal to
Sensitivity of the Present-Day Climate to Freshwater Forcing Associated with Antarctic Sea Ice Loss
 3936 J O U R N A L O F C L I M A T E VOLUME 21 Sensitivity of the Present-Day Climate to Freshwater Forcing Associated with Antarctic Sea Ice Loss CHRISTOPHER M. AIKEN Climate Change Research Centre, Faculty
SUPPLEMENTARY INFORMATION
 This section includes additional information for the model parameters as well as the results of a set of sensitivity experiments to illustrate the dependence of the model behavior on different parameter
Oceans and Climate. Caroline Katsman. KNMI Global Climate Division
 Oceans and Climate Caroline Katsman KNMI Global Climate Division Aimée Slangen, Roderik van de Wal (IMAU, Utrecht University) Sybren Drijfhout, Wilco Hazeleger (KNMI, Global Climate) Bert Vermeersen (NIOZ/Delft
Supporting Information for Glacial Atlantic overturning increased by wind stress in climate models
 GEOPHYSICAL RESEARCH LETTERS Supporting Information for Glacial Atlantic overturning increased by wind stress in climate models Juan Muglia 1 and Andreas Schmittner 1 Contents of this file 1. Figures S1
Chapter outline. Reference 12/13/2016
 Chapter 2. observation CC EST 5103 Climate Change Science Rezaul Karim Environmental Science & Technology Jessore University of science & Technology Chapter outline Temperature in the instrumental record
Effect of Ocean Warming on West Antarctic Ice Streams and Ice Shelves. Bryan Riel December 4, 2008
 Effect of Ocean Warming on West Antarctic Ice Streams and Ice Shelves Bryan Riel December 4, 2008 Ice Sheet Mass Balance/WAIS Dynamics -Mass Balance = (Ice/Snow Accumulation) (Surface melting, ice outflux,
Separation of atmosphere-ocean-vegetation feedbacks and synergies for mid-holocene climate
 GEOPHYSICAL RESEARCH LETTERS, VOL. 36, L09701, doi:10.1029/2009gl037482, 2009 Separation of atmosphere-ocean-vegetation feedbacks and synergies for mid-holocene climate J. Otto, 1,2 T. Raddatz, 1 M. Claussen,
Ocean Mixing and Climate Change
 Ocean Mixing and Climate Change Factors inducing seawater mixing Different densities Wind stirring Internal waves breaking Tidal Bottom topography Biogenic Mixing (??) In general, any motion favoring turbulent
Glacial abrupt climate changes and Dansgaard-Oeschger oscillations in a coupled climate model
 PALEOCEANOGRAPHY, VOL. 21,, doi:10.1029/2005pa001238, 2006 Glacial abrupt climate changes and Dansgaard-Oeschger oscillations in a coupled climate model Zhaomin Wang 1,2 and Lawrence A. Mysak 1 Received
NW Atlantic warming under climate change: new simulations with high-resolution CESM
 NW Atlantic warming under climate change: new simulations with high-resolution CESM Justin Small John Truesdale, Susan Bates, Gary Strand, Jerry Meehl, Don Wuebbles Acknowledging: Mike Alexander, Andrew
lecture 12 Paleoclimate
 lecture 12 Paleoclimate OVERVIEW OF EARTH S CLIMATIC HISTORY Geologic time scales http://www.snowballearth.org/index.html Features of the climate during the Cretaceous period the land-sea distribution
Lecture 8. The Holocene and Recent Climate Change
 Lecture 8 The Holocene and Recent Climate Change Recovery from the last ice age About 15,000 years ago, the earth began to warm and the huge ice sheets covering much of North America and Eurasia began
What is the IPCC? Intergovernmental Panel on Climate Change
 IPCC WG1 FAQ What is the IPCC? Intergovernmental Panel on Climate Change The IPCC is a scientific intergovernmental body set up by the World Meteorological Organization (WMO) and by the United Nations