Adjustment of the global climate to an abrupt slowdown of the Atlantic meridional overturning circulation
|
|
|
- Matthew Allen
- 5 years ago
- Views:
Transcription
1 Adjustment of the global climate to an abrupt slowdown of the Atlantic meridional overturning circulation Wei Cheng 1, Cecilia M. Bitz 2, John C.H. Chiang 3 1 Joint Institute for the Study of the Atmosphere and Ocean, University of Washington 2 Dept. of Atmospheric Sciences, University of Washington 3 Dept. of Geography and Center for Atmospheric Sciences, University of California, Berkeley submit to AGU monograph Past and Future Changes of the Ocean s Meridional Overturning Circulation: Mechanisms and Impacts March 15, 2007 Corresponding author address: Wei Cheng, U. of Washington, campus box , Seattle, WA wcheng@ocean.washington.edu
2 2 1 Abstract We explore the adjustment of the global climate to an abrupt slowdown of the Atlantic Meridional Circulation (AMOC), with a particular focus on the energetics. The slowdown is induced by a sudden freshwater perturbation in the North Atlantic. Reduction in the AMOC decreases northward ocean heat transport (OHT) and leads to cooling in the northern high latitudes. This cooling results in a local reduction to the top of atmosphere (TOA) radiative heat loss and an increase in northward atmospheric heat transport (AHT). The energy for the increased northward AHT comes from a combination of increased downward radiative flux at the TOA in the southern tropics and anomalous heating from the ocean in the northern tropics, both of which are consequences of the southward shift in the Intertropical Convergence Zone. Hence, viewed in the energetics framework, the atmospheric response to a AMOC slowdown extends throughout the Northern Hemisphere and into the tropics, and suggests an intimate coupling between the two regions. The mechanisms for the high-latitude tropical coupling are examined. When comparing freshwater perturbation experiments in modern and Last Glacial Maximum (LGM) background states, we found that the changes to the northward OHT, and the mechanisms of global adjustment to the AMOC slowdown were qualitatively similar in both instances. The one major difference is that freshening in the LGM climate induces a significantly stronger sea ice feedback than in a modern climate, allowing greater local cooling of the North Atlantic, and causing a commensurately larger global climate adjustment.
3 Introduction A slowdown of the Atlantic meridional overturning circulation (AMOC) yields a decrease in the northward oceanic heat transport (OHT), which motivates a careful examination of the climate impacts in terms of global heat exchange. The significance of an AMOC induced OHT anomaly to climate is not entirely obvious, given that the ocean contribution (wind and thermohaline driven) of the total meridional heat transport is relatively small compared to the atmospheric contribution poleward of 45 N (Trenberth and Caron, 2001). In this vein, a recent and influential paper (Seager et al., 2002) argued that the cause of a warm Europe is not primarily because of Gulf Stream heat transports, but a consequence of atmospheric stationary waves and passive seasonal ocean heat storage. Moreover, there is the so-called Bjerknes compensation idea that the atmosphere can (and does) easily compensate for any changes to the OHT in climate change scenarios (e.g., Bjerknes, 1964; Manabe et al., 1975; Stone, 1978). Shaffrey and Sutton (2006) show in their analysis of a long-term simulation of the Hadley Center coupled model HadCM3 that Bjerknes compensation does in fact occur in the northern extratropics on decadal timescales, with the degree of compensation increasing with increasing timescales. These, and other arguments (see Seager and Battisti, 2007, for example), contributed to the sense that a change to the AMOC cannot, by itself, explain the global extent of the climate changes that occurred during abrupt climate change events in the last glacial (e.g., Voelker, 2002). This argument formed part of the basis for invoking a change in the tropics as a necessary piece of abrupt climate changes
4 (Broecker, 2003). However, we now know from coupled general circulation model (CGCM) simulations that the climate impacts of AMOC slowdowns may be tremendous and far-reaching (e.g., Vellinga and Wood, 2002; Zhang and Delworth, 2005). Despite the relatively small decrease to the total northward heat transport, the impact can be dramatically amplified by sea ice expansion, which reduces surface absorbed shortwave radiation and decreases oceanic heat loss to the atmosphere. Li et al. (2005) proposed that the pronounced temperature swings recorded by Greenland ice core records during abrupt change events arise from changes to the North Atlantic sea ice cover. Chiang and Bitz (2005) explored the potential impacts of increased Northern Hemisphere sea ice cover on the global climate in an atmospheric general circulation model (AGCM) coupled to a thermodynamic slab ocean, and found (amongst other things) a remarkable similarity to climate impacts seen in CGCM AMOC slowdown experiments. The similarities included a pronounced cooling of the Northern Hemisphere and a southward displacement of the Intertropical Convergence Zone (ITCZ) with commensurate changes to the Hadley circulation. A study by Broccoli et al. (2006) shows similar impacts to the ITCZ from hemispheric asymmetric heating/cooling in the extratropics. These results suggest that much of the global climate impacts of an AMOC slowdown could in fact be explained in terms of cooling in the North Atlantic broadcast to the globe through atmospheric teleconnections. Another intriguing result found by Chiang and Bitz (2005) was that the bulk of the increase to the net outgoing radiation at the top of the atmosphere (TOA) in the
5 northern high latitudes was compensated by increased net incoming radiation at the TOA in the faraway southern tropics. The southward shift of the ITCZ altered the TOA cloud radiative forcing and the shift in the Hadley circulation in turn allowed the circulation to transport this heat northwards, toward the colder Northern Hemisphere. This energetic response involved large tropical climate changes and virtually no changes in the southern extratropics. Chiang and Bitz (2005) argue that a wind-evaporation-sea surface temperature (WES) feedback can effectively communicate high latitude cooling to the ITCZ latitudes, but no further, thereby suggesting a limit to the sphere of influence of Northern Hemisphere cooling via atmosphere and surface ocean interactions. In this study we examine the global adjustment of a fully coupled model to abrupt cooling in the North Atlantic induced by a slowdown of the AMOC and focus on understanding global energetic adjustments. In order to assess the extent to which the mean state matters to the problem, we perform two sets of freshwater perturbation experiments using two nearly equilibrated background climate cases of the Community Climate System Model 3.0 (CCSM3), a CGCM: A 1,000 yr integration with 1990s (or modern ) conditions (Collins et al., 2006) and a 440 yr Last Glacial Maximum (LGM, approximately 21,000 yrs ago) integration (Otto-Bliesner et al., 2006). We initiate cooling by freshening the North Atlantic and allow the ocean, atmosphere, and sea ice to respond and feedback on the sea ice and salinity anomalies. Our current study relates to the earlier Chiang and Bitz (2005) study in that both studies are driven by North Atlantic cooling, but they differ with respect to how the cooling is initiated (imposed sea ice vs. AMOC slowdown) and in the coupled climate response to the
6 forcing (AGCM-slab ocean model vs. CGCM). We can thus assess the extent to which the coupled model climate response can be interpreted from an atmosphere-slab ocean only viewpoint. Using energetics as a means to examine the global climate usually requires that the system is in an equilibrium state. Since we are looking at transient simulations, exact energy balance may not be expected. However, we find that the imbalance (represented by globally averaged TOA and sea surface net heat fluxes) is small (on the order of a few tenths of Wm 2 ) only a few years after the onset of the freshwater perturbation. We will show that the Northern Hemisphere sea ice and tropical responses appear to be crucial for determining the character of global energetics changes. We will also show that much of the qualitative changes in global energetics in the fully coupled model resemble the simpler AGCM-slab ocean response, although its tropical response signal is weaker. We will argue that, viewed in the energetics framework, the tropical climate changes are a fundamental part of the adjustments that the climate system must make in the AMOC slowdown scenario. As a result, we argue that a full understanding of abrupt climate changes requires the combined understanding of both Northern Hemisphere and tropical processes. The rest of the paper is organized as follows. In section 2 we describe the CGCM used in this study and the freshwater perturbation experiments. In addition we give a brief description of global climate impacts of North Atlantic freshening seen in our model. This is followed by an examination of the northern North Atlantic responses (section 3), with special emphasis on the sea ice and subsurface changes. In section 4
7 we analyze heat transport adjustments in the ocean and atmosphere to North Atlantic freshening and their controlling mechanisms. Related tropical responses and the high-to-low latitude communication mechanisms are examined in section 5. We finish the paper with a discussion and conclusions in section Description of model and freshwater perturbation simulations The CCSM3 configuration which we use has an atmosphere component with approximately 2.8 horizontal resolution (T42 spectral truncation) and 26 vertical levels. The ocean and sea ice have a zonal resolution of and a meridional resolution of 0.54, except in the subtropics and tropics where the meridional resolution is finer. The LGM simulation has ice sheet topography, ocean bathymetry, orbital configuration, and greenhouse gases appropriate for 21ka (Otto-Bliesner et al., 2006). Ozone and aerosol forcing are set to pre-industrial estimates for the LGM and to 1990 estimates for the modern simulation. We refer to these two background climate simulations as controls for their respective perturbed cases. We branched freshwater pulse experiments from each control by instantaneously freshening the upper 970m of the North Atlantic and Arctic Oceans from Nand 90 W-20 E by an average of 2 psu (higher at the top and tapering with depth). This is equivalent to adding 16 Sv yr of freshwater. Our method is similar to Vellinga and Wood (2002) and contrasts with that used in the intercomparison study described by Stouffer
8 et al. (2006), where a 0.1 or 1.0 Sv surface freshwater flux was added over 100 yr. We used instantaneous freshening because it requires less computing time, even though it may be at the expense of some realism. We conducted six freshened runs for a minimum of 20 yr each (three for each background state). One member from each background state is longer (77 yr for modern and 135 yr for LGM) to capture the decade to century time-scale recovery. Individual ensemble members were branched from different times in the controls to sample a range of initial conditions. It is worth mentioning that the AMOC has natural variability in both the modern and LGM control simulations, the amplitude of which (measured by standard deviation) is roughly 6% of the control means (Fig. 1). The initial conditions for our ensemble runs were selected randomly from the control simulations, whereas in a meltwater pulse study by LeGrande et al. (2006), the initial conditions were differentiated between strong versus weak overturning circulations. As a result, a modest sensitivity was found in LeGrande et al. (2006). In our case, the sensitivity to the initial conditions is small compared to the sensitivity to the background climate states (Fig. 1). To filter out inter-member noise, results for the first 20 year are averaged over the three ensemble members. Freshening in the North Atlantic causes the AMOC to immediately collapse with a cessation of North Atlantic Deep Water (NADW) formation in all six runs as shown in Fig. 1. In no case is the collapse permanent, but the recovery rates are strikingly different depending on the background climate state. Bitz et al. (2007) focused on the recovery mechanisms of these same experiments, while here we focus instead on
9 the structure of global energetic adjustment and their controlling mechanisms. Of course, the ultimate cause of all adjustments is the freshening in the northern North Atlantic. The spatial structures of the AMOC in the controls and the anomalies in the second decade after freshening are depicted in Fig. 2. The LGM control AMOC is shallower and weaker than the modern control, in accordance with its more stable ocean stratification at depth (not shown, see Bitz et al. (2007)) as well as proxy records. Otto-Bliesner et al. (2006) gives more information about the differences between these controls. This behavior of the CCSM3 is different from the Hadley Centre Coupled Model version 3 (HadCM3) in which the AMOC is not shallower at the LGM compared to modern times (Hewitt et al., 2006), which was attributed to the too shallow deep water formation in the modern climate. Despite these cross-model differences in the control simulations, when freshwater perturbations are added to the North Atlantic, both CCSM3 and HadCM3 show weakening of the AMOC with roughly the same magnitude, and a quantitatively similar decrease in the meridional OHT. In CCSM3, the anomalous AMOC in the LGM freshened case is also shallower than the modern freshened case. In terms of a percentage change relative to the control mean state, the LGM freshened case is more anomalous than the modern freshened case. However, in either case the AMOC decreases by roughly the same absolute amount. A cursory comparison of the climate changes in our CCSM freshwater perturbation simulations shows that the large-scale responses resemble those in other coupled models. A recent intercomparison of coupled models with freshwater perturbations added to
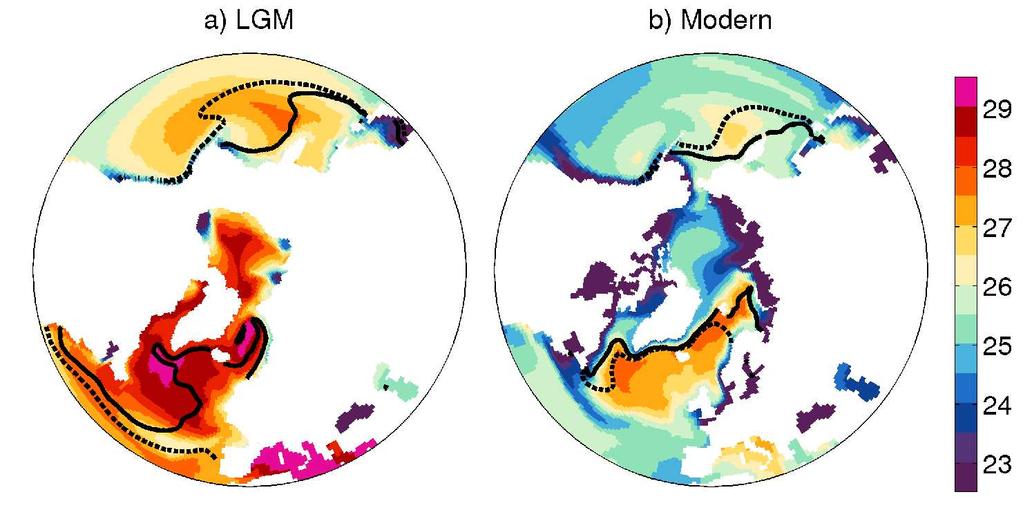
10 a modern background state (Stouffer et al., 2006) suggest that the following climate responses are robust in models with AGCMs: i) an increase in sea ice cover with strong surface cooling of the northern North Atlantic extending into western Europe; ii) a weak (generally less than 1K) cooling over most of the rest of the Northern Hemisphere; iii) a pronounced response in the tropical Atlantic, specifically the formation of a meridional gradient in SST anomalies across the equator, with cooler SSTs in the north, and an associated southward shift in the ITCZ; iv) a more symmetric hemispheric annual mean Hadley circulation, with the southern meridional cell strengthening and the northern one weakening; and v) a slight warming in the southern Atlantic and parts of the Southern Ocean, but otherwise relatively little response compared to the Northern Hemisphere. Our simulations are in qualitative accordance with all of these responses, and thus are representative of freshwater perturbation impacts. Fig. 3 (top panels) shows surface temperature, surface wind, and precipitation anomalies averaged over years for both the LGM (left panels) and modern (right panels) climates, showing all of the characteristics mentioned above. A few additional points can be made from this figure: First, despite experiencing the same freshwater forcing, the LGM temperature response is significantly greater than that for the modern climate simulation, and in particular the strongest temperature changes are located farther south in the North Atlantic. This, as we shall see in section 3, is tied to the strength and location of the sea ice feedback. Second, despite the different strengths of the LGM and modern response in the North Atlantic, the global response is qualitatively similar and suggests that the mechanisms determining the global adjustments are similar. Third, the response is
11 established rapidly examination of the anomalies at years for the LGM (Fig. 3 bottom panels) does not show any qualitative differences from the anomalies at years The lack of anomalies in years in the modern simulation is in accordance with the almost full AMOC recovery by that time. These results imply that the bulk of the adjustment determining the global climate impacts is driven by relatively fast atmospheric and oceanic processes. This result is in agreement with previous AMOC slowdown studies (e.g. Vellinga and Wood, 2002; Timmermann et al., 2005) High latitude North Atlantic response Weakening the AMOC, and the attendant weakening of the northward OHT after freshening, causes the surface to cool in the northern North Atlantic as demonstrated in CCSM3 (Fig. 3a and b). In this model, as is typical among CGCMs that are forced with freshwater perturbations (Stouffer et al., 2006), the greatest surface cooling overlies regions of expanded sea ice (Fig. 4). The surface cooling associated with AMOC weakening also spreads downward into the water column and equatorward (Fig. 5). The downward spreading of the cooling in the North Atlantic is deeper in the modern climate than in LGM, in accordance with its stronger and deeper AMOC in the control state (Fig. 2). There has been much discussion about the amount of surface cooling that would occur over Europe if the AMOC is weakened (e.g., Seager et al., 2002). Our results demonstrate that the answer is radically different depending on the background climate state. In the second decade after freshening, the average annual temperature anomaly
12 over France and Germany is about -6 C in the LGM case, but it is less than -2 C in the modern case (Fig. 3a and b). Five decades after freshening the anomaly remains over -5 C in the LGM case, but the anomaly almost disappears in the modern case (Fig. 3c and d). Greater expansion of sea ice (Fig. 4) is responsible for the greater cooling in the LGM climate after freshening in CCSM3. Wind anomalies shown in Fig. 3 cannot explain why the ice edge advances so much more in the LGM freshened run compared to the modern. Changes in the atmospheric and oceanic heat transport are competing factors in causing the sea ice to expand in CCSM3. As will be shown in the next section, the AHT increases almost to the extent that the OHT decreases in the CCSM3 freshened states. Sea ice expands nonetheless because it is far more sensitive to changes in the OHT (Thorndike, 1992). This is because a sizable fraction of anomalies in the AHT convergent upon the high latitudes can be lost to increased outgoing net radiation at the TOA. At the top surface of the sea ice, the surface temperature is free to adjust, which dampens anomalies in the atmosphere-ice flux during winter (similar to damping of anomalous atmosphere-ocean fluxes in ice-free regions). Ice albedo feedback may amplify the effect of AHT anomalies on summer sea ice melting, but a correlation of anomalous AHT and TOA net radiation in the LGM control run (not shown) indicates that winter damping of AHT anomalies dominates. Because ice-albedo feedback is stronger at lower latitudes due to stronger insolation, sea ice expands more in the LGM climate when the ice edge in the control simulation is located further to the south.
13 In the next section we will also show that the OHT decreases slightly more at 45 N after freshening in the LGM case than in the modern case in CCSM3. Even more importantly, the spatial structure of the changes in the OHT causes a greater decrease in the convergence of heat in the LGM case over latitudes in the Atlantic where sea ice is present (Fig. 4). The OHT convergence into the Nordic seas decreases in both cases after freshening, but the decrease is much greater in magnitude and more widespread in the LGM case. The location of the sea ice edge with respect to the North Atlantic deep water (NADW) formation regions also plays a role in expanding the sea ice cover. Stocker et al. (2001) proposed a positive feedback which could arise if weakening the AMOC enhanced sea ice formation to the north and advection brought greater quantities of sea ice southward, where it then inhibited NADW formation by melting. Fig. 4 shows that even before freshening sea ice is present (though with only 30-80% concentration) in the vicinity of the heaviest density outcroppings, where NADW forms, but only in the LGM climate. This suggests a larger potential for haline influence on convection during the glacial climate compared to the modern climate. Bitz et al. (2007) computed the impact from freshening on watermass formation via surface buoyancy flux anomalies in the northern North Atlantic for these same experiments. They found that the haline influence from sea ice in the LGM case inhibited NADW formation after freshening a sign change from the sea ice influence before freshening. In contrast, sea ice had little influence on NADW formation in the modern case before or after freshening. In addition, the surface heat loss over the densest water outcroppings is suppressed by sea
14 ice expansion in the LGM freshened case, but negligibly so in the modern freshened case. Thus sea ice has a substantial positive feedback on the AMOC only for the LGM climate, and we are likely to see a much more expansive sea ice cover, a much weaker AMOC, and greater surface cooling, as well as a longer lasting climate change after freshening in an LGM climate. The net result of sea ice growth in the North Atlantic on the atmospheric energetics is to reduce the atmospheric heating. For the modern (LGM) freshened climate, the area integral of net surface heat flux drop over the globe north of 40 N is 0.37 (0.43) PW in the first decade after hosing, of which 41% (62%) is due to albedo and the rest due to insulating the ocean from the atmosphere. This is compared to the 0.39 (0.20) PW heat loss across 40 N in the ocean directly due to the reduction in the OHT by the AMOC slowdown. Freshening the upper ocean also stabilizes the water column and inhibits the vertical mixing by deep convection, causing an oceanic subsurface warming at high latitudes (Fig. 5). Knutti et al. (2004) found a subsurface warming with similar magnitude in the North Atlantic north of 60 N in a coupled climate model. This subsurface warming is absent from the multi-model ensemble mean presented in Stouffer et al. (2006), where the applied freshwater perturbation is much weaker. More heat is retained at depth around 500 meters in the LGM than modern freshened case, a consequence of its greater relative AMOC weakening and slower AMOC recovery. This subsurface warming, combined with the dissipation of surface water freshwater loading, will eventually destabilize the water column and
15 contribute to the AMOC resumption. Based on the result that the AMOC is mostly recovered by the 5th decade in the modern climate but stays low 284 over the entire 100-year integration in the LGM climate (Fig. 1), the destabilization time scale is on the order of a few decades in the modern climate, but much longer in the LGM climate. This result, combined with the difference in the subsurface warming between LGM and modern climate, suggests that the LGM ocean may be more likely to experience an abrupt AMOC strengthening and surface warming, as in Winton and Sarachik (1993) Heat transport response While we now have good estimates of global mean poleward heat transport and its partitioning between the ocean and atmosphere (Trenberth and Caron, 2001), relatively little is known about how and why heat transport is modified as a result of climate change. For the purpose of this study, the question of interest is: How do the meridional heat transports adjust to perturbations initiated by the AMOC slowdown and the resulting sea ice amplification? Given that the average poleward OHT in the subpolar latitudes is small compared to AHT in the same latitudes, should we expect any significant global energy flux redistribution from freshening in the North Atlantic? First we discuss the temporal and zonal mean poleward heat transport in the ocean and the atmosphere, and their decompositions, for the modern control simulation (Fig. 6). Results for the LGM control simulation are similar (not shown). Here the AHT is calculated by integrating the divergence of annual-mean surface and TOA fluxes.
16 This indirect method is valid for studying the quasi-equilibrium states of control and freshened mean climates. With this method, we separate total AHT into dry static energy (DSE, including sensible heat and potential energies) and latent energy (LE) components, ignoring the kinetic energy transport. The OHT is calculated directly using ocean velocity and temperature. In terms of the mean amplitude and meridional structure, the CCSM3 simulation is in qualitative agreement with observations (Trenberth and Caron, 2001): The OHT exceeds the AHT only in the tropics where the net surface heat flux is into the ocean (Fig. 6a). The AHT exceeds the OHT poleward of the subtropics where the ocean loses heat to the atmosphere. The mean AHT in the extratropics is 50% each from DSE and LE components, respectively (Fig. 6b); in the tropics, dry and moist components oppose one another in the Hadley circulation. As expected, the global OHT north of 40 S is dominated by the Atlantic OHT (Fig. 6c). Although the OHT in the subpolar latitudes is small compared to the AHT, it is important to remember that the OHT converges into a small ocean section. Figure 7 shows changes in the OHT when the AMOC is weakened by freshening the North Atlantic. Hereafter in this section, anomaly is used to mean the departure of the freshened state averaged over years after the freshening onset from the control mean climate. Based on the temporal evolution of the AMOC (Fig. 1), these years avoid the initial shock period but still possess significant perturbations from the control states. The global OHT anomalies result primarily from anomalies in the Atlantic Ocean, which are sizable throughout the entire basin. The anomalous OHT in modern and LGM
17 freshened simulations are qualitatively similar, with noticeable quantitative differences occurring in the midlatitudes where the local minimum OHT anomaly around 40 N is smaller in the LGM than in the modern climate. This we suspect is related to the more persistent and further southward expansion of sea ice in the LGM freshened simulation as described in section 3. Brine rejection under the anomalous ice cover in winter can trigger convection and the related circulation may locally inhibit the OHT reduction in those latitudes. In terms of global climate impacts however, it is important to note that the modern and LGM simulations have similar OHT changes, implying that differences in the relative strength of the global climate impacts are largely due to differences in the sea ice responses influenced by mean state. Responding to the OHT anomaly, the global AHT increases and the resulting anomaly largely compensates that in the ocean (Fig. 8). The degree of compensation is roughly the same across all latitudes north of 40 S. Our results differ from Seager et al. (2002), which showed no evidence for Bjerknes compensation outside of the tropics in a number of climate models using a slab ocean. Using a multi-century simulation from a climate model with a dynamical ocean, Shaffrey and Sutton (2006) noticed that the compensation is time-scale dependent with noticeable compensation at decadal and longer time scales; furthermore, they suggest that it is not a good model for the tropics because large TOA anomalies in the tropics can be induced by convection. Shaffrey and Sutton (2006) performed no lead/lag analysis, which might determine the causality between the atmospheric and oceanic heat transport changes. Our freshwater pulse experiments give evidence that in CCSM3 the AHT responds to changes initiated in the
18 Atlantic Ocean. Unlike the OHT anomaly, which is mostly limited to the Atlantic Ocean, the entire Northern Hemisphere atmosphere is involved in the atmospheric Bjerknes compensation. The changes to the poleward AHT give the (mistaken) impression that the loss of atmospheric heating in the North Atlantic is compensated through poleward AHT anomalies. On the contrary, much of the compensation occurs in the northern high latitudes outside the Atlantic. Cooler atmospheric temperatures allow less outgoing longwave radiation this occurs throughout the northern high latitudes, especially over the Arctic and northern Eurasia (Fig. 9). The atmosphere is also heated anomalously at the surface in the North Pacific. Hence, the atmospheric heat divergence over the North Atlantic is far greater than what is implied in the zonal mean poleward heat transport changes. For both background states, the increase in the zonal mean northward AHT in the mid- to high latitudes is dominated by DSE, with additional but smaller contributions from LE (Fig. 10). In the CCSM3 AMOC slowdown experiments there is no obvious compensation between DSE and LE horizontal transport anomalies in the extratropics. This differs from the equilibrium climate response to doubling of CO 2, in which the increase in the extratropical horizontal moisture and latent heat transports is compensated by a decrease in the sensible heat transport (Held and Soden, 2006). In the CCSM3 AMOC slowdown simulations, as in CO 2 doubling experiments (Held and Soden, 2006), AHT anomalies in the tropics are associated with adjustments to the Hadley circulation, as indicated by the strong compensation between the DSE and
19 LE components there (Fig. 10). In terms of global anomaly patterns, most of the atmospheric heat convergence that allows for the increased poleward AHT occurs in the tropics, and both through changes in the TOA and surface fluxes, particularly over the tropical oceans (Fig. 9). As we will discuss in the next section, these surface and TOA flux changes are attributable to tropical climate changes associated with a southward shift of the ITCZ. We note also that over a large part of the globe, the TOA flux anomalies are in comparable magnitude to typical surface flux anomalies, except in the northern North Atlantic where anomalous surface cooling is most extreme (Fig. 9). This is in contrast to the results of Chiang and Bitz (2005) where with a slab-ocean model, the AHT changes resulted, by necessity, from TOA heat flux changes. To understand the mechanisms driving the increased northward AHT, we compute AHT from model in situ data and break the AHT anomaly into contributions from mean meridional circulation (MMC), stationary eddies, and transient eddies (Fig. 11). We only show results for the sensible heat flux (CpT) because DSE is the dominant term in the extratropical AHT anomaly. The sensible heat transport anomaly is large in the tropics, but it is offset by a potential energy transport anomaly of the opposite sign (not shown) from the shift in the Hadley circulation, leading to a much smaller total AHT anomaly in the tropics (Fig. 8). The increase in the sensible heat transport in the midlatitude is accomplished primarily by transient eddies (note that however the MMC and transient eddies are not independent of each other in the midlatitudes). Such a response in the transient eddy activity is consistent with the increased pole-to-equator temperature gradient (Fig. 3). An increased pole-to-equator temperature gradient also
20 accounts for the increased total northward energy flux by the atmosphere in an idealized model (Broccoli et al., 2006). The AHT anomaly by stationary eddies is negligible in the modern case, but its amplitude increases in the LGM freshened case. The prominence of the stationary eddy heat transport anomaly is one of the few instances where the response in the LGM background state is qualitatively different from the response in the modern background state. In both cases, however, the poleward heat transport by transient eddies increases to deal with the anomalous atmospheric cooling in the northern high latitudes. A reduced AMOC climate is, therefore, a stormier climate Tropical responses Energetics of the tropical response As mentioned earlier, the CCSM response to AMOC slowdown is qualitatively similar to the robust response to freshwater perturbation reported by Stouffer et al. (2006), with a pronounced cooling over the North Atlantic and a southward shifted ITCZ as indicated by the cross-equatorial flow and precipitation anomalies. Our tropical response is relatively weak and somewhat ill-defined in precipitation compared to some other published results (e.g. Stouffer et al., 2006). Nonetheless, zonally averaged quantities show robust changes in the tropics: Averaged during years 10-19, the MMC exhibits increased uplift over the southern tropics and subsidence to the north, occurring over both the DJF and JJA seasons; in the annual mean, the change in the southward mass flux in the lower troposphere due to the altered MMC is around kgs 1
21 for the modern as well as LGM simulations. The change is large enough that the hemispheric asymmetry in the annual mean Hadley circulation seen in the modern climate is flipped: The freshened simulation shows a slightly stronger northern annual mean Hadley cell compared to the southern cell, as opposed to the unperturbed case where a stronger southern cell exists. How is the tropical response related to the altered energetics? The response is qualitatively similar in both the modern and LGM cases, so we discuss the LGM case, averaged over years after perturbation onset, same as the heat transport analysis in section 4. The climate changes in the tropics lead to an increase (by 1-2 Wm 2 ) in the net incoming radiation at TOA from 10 N to 30 S, and a decrease (by up to 1 Wm 2 ) in the net incoming radiation at TOA from 30 N to 10 N (Fig. 9, top left panel). On the other hand, surface fluxes show dipole-like behavior with increased fluxes out of the surface in the northern tropics by up to 4 Wm 2, and decreased fluxes in the southern tropics by up to 1.5 Wm 2 ; the northern lobe is however more pronounced (Fig. 9, middle left panel). The increased surface fluxes in the northern tropics more than compensate for the reduced TOA incoming net radiative flux (Fig. 9, bottom left panel). Consequently the net effect is to increase the energy supply to the atmosphere throughout the entire tropics, which must in turn be approximately balanced by meridional heat transport out of the tropics. The changes to the net TOA and surface fluxes are generally consistent with the southward ITCZ shift and changes to the Hadley circulation. High cloud cover increases by 1-2% in the area between 10 N and 20 S because of the increased convection there,
22 whereas low cloud cover decreases by roughly 1%, resulting in increased net TOA fluxes into the southern tropics primarily through reduced outgoing longwave radiation (OLR). On the other hand, the dipole in the surface heat flux is primarily a consequence of a changed latent heat flux due to increased trades in the northern tropics and reduced trades in the southern tropics, again a result of the altered Hadley circulation. The zonal mean picture, however, belies a far more complex tropical response that is illustrated in the spatial maps of TOA and surface net fluxes shown in Fig. 9 (right panels). The surface fluxes in particular tend to be spatially complex. Furthermore, the same figures shown for the subsequent decade possess a different spatial character from the previous decade for regions outside the tropical Atlantic. This should not be a surprise because of strong interannual variability in the tropics. The only consistent response in time appears to be in the tropical Atlantic, where there are generally reduced surface fluxes into the ocean, and increased net incoming TOA fluxes that result in a net energy supply to the atmosphere there. The results we obtain appear to suggest these points: i) The robust tropical Atlantic responses in the TOA and surface fluxes demonstrate a strong linkage between the North Atlantic and tropical Atlantic climates in the freshened scenario. This is consistent with previous model results and paleoevidence (Chiang and Koutavas, 2004); and ii) DESPITE the strong interannual variability that makes the spatial patterns of net TOA and surface fluxes complex and variable, the zonal mean response appears to be robust; the southward ITCZ displacement allows for an increased flux of energy into the tropical atmosphere that is then transported northwards. Viewed from the energetics
23 perspective, therefore, the tropical climate changes to North Atlantic freshening are a robust and necessary response to compensate for the loss of atmospheric heat flux convergence in the northern high latitudes High-to-low latitude communication mechanisms An outstanding question is how the communication between the northern high latitudes and tropics arises, in particular to bring about the southward ITCZ displacement. Here we pursue the teleconnection to the tropical Atlantic, as it is the most robust tropical teleconnection to AMOC change. Oceanic and atmospheric pathways for North Atlantic communication to the tropical Atlantic have been proposed. The framework for baroclinic ocean adjustment was first proposed by Kawase (1987) who showed that thickness variations to an abrupt change in the high latitude mass source in a 1.5 level beta-plane model traveled equatorwards via the western boundary as a coastal Kelvin wave until it hit the equator. The wave then traveled eastward as an equatorial Kelvin wave until reaching the eastern boundary, where the wave becomes a coastal Kelvin wave propagating north and south along the eastern boundary. These in turn become sources for westward-travelling Rossby waves that then take the adjustment into the ocean interior. Several variants of this oceanic bridge have been subsequently proposed for various contexts: Yang (1999) proposed a decadal Labrador sea influence on the tropical Atlantic; Johnson et al. (2002) proposed decadal variability in the tropical Atlantic; Huang et al. (2000) proposed a global communication. In contrast, Dong and Sutton (2002) argued for a prominent
24 role of atmospheric teleconnections based on analysis of transients in their coupled model freshwater perturbation simulation; however, they did not explicitly discuss the mechanism(s) for bringing the North Atlantic influence to the tropical Atlantic. Chiang and Bitz (2005) proposed an atmospheric-thermodynamic surface ocean mechanism for bringing a high latitude cooling influence (e.g. by sea ice expansion in the North Atlantic) to the tropics: A wind-evaporation-sst (WES) feedback that increased the easterlies equatorwards of a cold SST front. Under an easterly trade wind basic state, the anomalous easterlies promoted evaporative cooling and thus advanced the cold SST further south. Once the tropical North Atlantic is cooled, the Atlantic ITCZ shifts southwards because of the known sensitivity of the marine ITCZ to meridional SST gradients (e.g. Chiang et al., 2002). Thus, Chiang and Bitz s explanation for a southward shift in the ITCZ rests on the ability of the WES mechanism to bring cold SST from the Northern midlatitudes equatorwards, to generate an anomalous meridional SST gradient at the ITCZ latitudes. This mechanism is a variant of the WES feedback originally proposed by Xie (1999) in the context of explaining decadal SST variations in the tropical Atlantic. In this subsection we are concerned with how the cooling in the North Atlantic upon slowdown of the AMOC is propagated to the rest of the 494 world. Different freshwater perturbation scenerios, in particular, cases where the freshwater perturbation is distributed over time (e.g., Stouffer et al. (2006)) versus over depth (e.g., Vellinga and Wood (2002), and this study), are expected to most significantly affect timescale and processes involved
25 during the slowdown phase. Once the slowdown is achieved, the upper ocean stratification anomaly in the North Atlantic is somewhat robust across different forcing scenarios. Therefore, we interpret events in this model as representative of how the global climate adjusts to an AMOC slowdown, bearing in mind the caveat associated with model sensitivity. After freshening in CCSM3, despite the consistent basinwide SST cooling in the North Atlantic (Fig. 3), the pattern of annual mean net surface heat flux anomalies in the LGM case (the modern case is similar) is quite complicated, with interdispersed regions of anomalous oceanic heating and cooling (Fig. 12, right panel). We interpret regions with downward surface heat flux anomalies as driven by ocean heat transport and regions with upward surface heat flux anomalies as driven by the atmosphere. Our analysis of the transient adjustment of SST, surface heat flux, and surface wind anomalies (not shown) shows that the surface heat flux response between 20 N and 40 N is primarily due to changes in temperature advection by the gyre circulation. The midlatitude westerlies weaken whereas the subtropical northeasterlies strengthen (Fig. 12, right panel), resulting in a weakening of the upward Ekman pumping in the midlatitudes and a strengthening and southward shift of the downward pumping in the subtropics (Fig. 12, left panel); the gyre changes are consistent with these changes in the wind forcing. Both the ocean baroclinic adjustment and the atmospheric WES feedback appear to play a role in establishing the Atlantic climate conditions to AMOC slowdown. The cooling response evolves from north to south. The ocean baroclinic adjustment in the western North Atlantic and equatorial Atlantic develops rapidly (within the first year,
26 consistent with Dong and Sutton (2002)) and results in an anomalously southward current in the upper layers all along the western boundary in the North Atlantic (not shown but see Ottera et al. (2003), for example). This causes a slight southward shift in the subpolar gyre, and a pronounced surface ocean cooling appears off the east coast of North America around N within year 2. This cooling develops and extends rapidly eastward along the N latitude by year 5. Anomalous atmospheric northeasterlies occur to the south of this ocean cooling, driven by the WES response. The strengthened trades cool the SST south of the subtropical/subpolar front, and result in a southward progression of the strengthened trades and cooler subtropical and tropical SST, consistent with the mechanism of Chiang and Bitz (2005). The strengthened trades intensify the subtropical gyre and shift it slightly southward, thus creating ocean heat transport changes and the pattern of net surface flux anomalous seen from N. South of 20 N, the SST is cooled primarily by latent heat fluxes induced by the increased trades. Previous WES studies on tropical Atlantic variability (Seager et al., 2000) suggest that such surface cooling in the tropics is damped by the associated anomalous Ekman transports. We find that the addition of ocean dynamics may provide more damping mechanisms on the tropical surface cooling. One is related to the ocean baroclinic adjustment. Weakened deep western boundary currents during the AMOC slowdown cause isopycnal slopes, which normally tilt upward toward the coast, to relax. When the ensuing thermocline depression reaches the tropical Atlantic via the baroclinic adjustment, it causes a subsurface warming (Fig. 5), which damps the near surface
27 cooling driven by WES. The baroclinic adjustment-induced subsurface warming resides on either side of the equator, consistent with its dynamics. Although this subsurface warming need not be strictly equatorially symmetric in amplitude, the much stronger northern lobe suggests that it is augmented by other mechanism(s). The downward Ekman pumping is strengthened in the northern subtropics (Fig. 12, left panel). These wind forcing anomalies can drive a thermocline depression locally, therefore contributing to the much greater subsurface warming in the northern tropics, as well as providing an additional damping effect on the WES-driven surface cooling. Despite these damping effects, by around year 8, the strengthened trades and cooler tropical North Atlantic SSTs are well established, and the cross-equatorial SST gradient that formed drives a cross-equatorial flow and southward ITCZ displacement. A more detailed analysis will be presented in an upcoming paper, but the picture we thus suggest for establishing the climate response to AMOC slowdown in the tropical Atlantic is one in which both the baroclinic adjustment and WES play a role, with the baroclinic adjustment being instrumental in the early cooling at the Gulf stream separation location, and with WES establishing the climate conditions south of the subtropical/subpolar gyre boundary. Wind-driven ocean dynamical changes play an important part in the overall response Conclusions and discussion In this study we investigate the global climate adjustment to a sudden slowdown in the AMOC, focusing on energetics. The AMOC slowdown decreases northward
28 OHT in the Northern Hemisphere (specifically the Atlantic), but was compensated for largely by increased AHT occurring both within and outside the Atlantic. The increased AHT in the midlatitudes results mainly from increases in transient eddy transport, and additionally from stationary eddy transport in the LGM case. An altered Hadley circulation (with more anomalous uplift in the southern tropics) allows for increases in the northward cross-equatorial AHT. The important changes to TOA and surface heat fluxes that allow for the changed AHT occur in the northern high latitudes and the tropics. North Atlantic sea ice expansion initiated by the decrease in OHT dramatically amplifies surface cooling by insulating the ocean from the overlying air and reflecting more short wave radiation at the surface. The loss of net atmospheric heating from the surface and TOA in the North Atlantic is compensated for by increased net incoming TOA radiation in the northern high latitudes outside the Atlantic, and by increased fluxes into the atmosphere from TOA and surface in the tropics. The tropical adjustments can thus be viewed as necessary in order to maintain energy balance within the atmosphere. Viewed in this energetics framework, the northern high latitude and tropical responses to North Atlantic freshening are intimately coupled, and are linked by the requirement that increased northward AHT compensates to a large extent for the reduction in northward OHT by the AMOC slowdown. As a result, we argue that a full understanding of abrupt climate changes requires the combined understanding of both the Northern Hemisphere and tropical climate responses. We also found that the magnitude of impacts of AMOC slowdown depends
29 dramatically on the background climate state, and primarily through sea-ice feedback. When modern and LGM climates are subjected to the same freshwater perturbation in the North Atlantic, the reduction to the OHT is similar in both instances, but the sea ice response is significantly more pronounced in the LGM case. Consequently, cooling over mid- to high northern latitudes is much greater in the LGM case, and the global climate response is much longer lived. Sea ice expansion is more persistent and extends farther southward in the LGM than in modern freshened climate. Sea ice expansion prolongs the weakening of AMOC in the LGM climate, which in turn favors expansion of the sea ice. Other factors related to the basic state difference establish the impacts of AMOC slowdown. In particular, we found that in CCSM3 the ocean stratification in the North Atlantic is more stable at depth in the LGM than modern control climate. As a result, the LGM control AMOC is shallower and weaker than its modern counterpart. Challenges in understanding the transient and equilibrium response of the AMOC are related to the fact that the forcing mechanisms for the AMOC often depend on the circulation itself. Thus attained feedback interactions between the circulation and its driving/damping mechanisms lead to a rich and possibly non-linear behavior of the AMOC. This also cautions against extrapolating inferences made from one background state to another without further examination. The freshwater perturbation simulations raise interesting questions on the nature of climate processes that govern global impacts to high latitude climate changes. We ve argued that the northern high latitude and tropical climates are intimately linked
30 in the response to AMOC slowdown. Our examination of the transient evolution of climate system adjustment to the North Atlantic freshening suggests that both baroclinic ocean adjustment and an atmospheric WES mechanism are involved in the high-to-low latitude communication; however, their respective roles are time scale and region dependent. The baroclinic adjustment is instrumental in the early cooling at the Gulf Stream separation location, and the WES establishes the climate conditions south of the subtropical/subpolar gyre boundary. Wind-driven ocean dynamical changes play an important part in the overall response. What leads to the southward ITCZ displacement, though, is the WES feedback that brings the cold conditions to the ITCZ latitudes. Ocean baroclinic adjustment and dynamical response to the changed winds can damp the WES influence. We found that in CCSM3 simulations, considerable compensation of anomalous 619 AHT and OHT occurs over a large range of latitudes. The fact that Bjerknes compensation occurs in CCSM3 despite changes in the TOA net radiation fluxes raises the question of how robust it is in other models and what the underlying physics is. Previously, it was thought largely to be a result of fixed TOA flux and ocean differential heat storage (Bjerknes, 1964; Stone, 1978; Shaffrey and Sutton, 2006). Neither of these conditions is likely satisfied in the CCSM3 simulations. These results suggest that the ocean and atmosphere can engage in dynamical interactions that control the horizontal heat transport in both media. Since the midlatitude AHT is driven primarily by transient eddies and eddy-induced MMC, and transient eddies depend on atmospheric baroclinicity, it is possible that OHT can exert an influence on AHT
31 through its control on the pole-to-equator temperature gradient. Taking this view, any OHT anomalies, however small, may have implications for global energy transport and deserve our attention. More targeted experiment design such as one-way and regional coupling should help to sort out atmospheric and oceanic processes involved in global teleconnections of the AMOC changes Acknowledgments. This work is supported by the Comer Foundation and National Science Foundation grant number ATM The authors would like to thank Dr. David Battisti for many stimulating discussions. We are grateful to Dr. Tony Broccoli and an anonymous reviewer for their careful readings and valuable comments. This publication is partially funded by the Joint Institute for the Study of the Atmosphere and Ocean (JISAO) under NOAA Cooperative Agreement No. NA17RJ1232, Contribution 1395, Pacific Marine Environmental Laboratory (PMEL) contribution 3052.
32 References Bitz, C. M., J. C. H. Chiang, W. Cheng, and J. J. Barsugli, Rates of thermohaline recovery from freshwater pulses in modern, last glacial maximum and future climates, submitted to Geophys. Res. Lett., p. available at bitz/yyy.pdf, Bjerknes, J., Atlantic air-sea interaction, in Advances in Geophysics, edited by H. E. Landsberg, and J. V. Mieghem, vol. 10, pp Academic Press, Broccoli, A. J., K. A. Dahl, and R. Stouffer, Response of the itcz to northern hemisphere cooling, Geophys. Res. Lett., 33, doi: /2005gl024546, Broecker, W. S., Does the trigger for abrupt climate change reside in the ocean or in the atmosphere? Science, 300, , Chiang, J. C. H., and C. M. Bitz, The influence of high latitude ice on the position of the marine intertropical convergence zone, Climate Dynamics, pp. doi: /s , Chiang, J. C. H., and A. Koutavas, Climate change - tropical flip-flop connections, Nature, 432, , Chiang, J. C. H., Y. Kushnir, and A. Giannini, Deconstructing Atlantic itcz variability: Influence of the local cross-equatorial sst gradient, and remote forcing from the eastern equatorial pacific, J. Geophys. Res., 107, /2000JD000307, Collins, W. D., et al., The Community Climate System Model, Version 3, J. Climate, 19, , Dong, B.-W., and R. T. Sutton, Adjustment of the coupled ocean-atmosphere system to a sudden change in the thermohaline circulation, Geophys. Res. Lett., 29, Gent, P. R., Will the North Atlantic Ocean thermohaline circulation weaken during the 21st century? Geophys. Res. Lett., 28, , Held, I. M., and B. J. Soden, Robust responses of the hydrological cycle to global warming, J. Climate, 19, , Hewitt, C. D., A. J. Broccoli, M. Crucifix, J. M. Gregory, J. F. B. Mitchell, and R. J. Stouffer, The effect of a large freshwater perturbation on the glacial north Atlantic ocean using a coupled general circulation model in modern, last glacial maximum and future climates, J. Climate, 19, , Huang, R. X., M. A. Cane, N. Naik, and P. Goodman, Global adjustment of the thermocline in response to deepwater formation, Geophys. Res. Lett., 27, , Johnson, H. L.,, and D. P. Marshall, Localization of abrupt change in the north Atlantic thermohaline circulation, Geophys. Res. Lett., 29, doi: /2001gl014140, Kawase, M., Establishment of deep ocean circulation driven by deep-water production, J. Phys. Oceanogr., 17, , Knutti, R., J. Fluckiger, T. F. Stocker, and A. Timmermann, Strong hemispheric coupling of glacial climate through freshwater discharge and ocean circulation, Nature, 430, , 2004.
33 LeGrande, A. N., et al., Consistent simulations of multiple proxy responses to an abrupt climate change event, Proc. Natl. Acad. Sci. USA, 103, , Li, C., D. S. Battisti, D. P. Schrag, and E. Tziperman, Abrupt climate shifts in Greenland due to displacements of the sea ice edge, Geophys. Res. Lett., 32, doi: /2005gl023492, Manabe, S., K. Bryan, and M. J. Spelman, A global ocean-atmosphere climate model. part i: the atmospheric circulation, J. Phys. Oceanogr., 5, 3 29, Ottera et al., O. H., The sensitivity of the present-day Atlantic meridional overturning circulation to freshwater forcing, Geophys. Res. Lett., 30, doi: /2003gl017578, Otto-Bliesner, B. L., E. C. Brady, G. Clauzet, R. Tomas, S. Levis, and Z. Kothavala, Last glacial maximum and Holocene climate in CCSM3, J. Climate, 19, , Seager, R., and D. S. Battisti, hallenges to our understanding of the general circulation: abrupt climate change, in In The Global Circulation of the Atmosphere: Phenomena, Theory, Challenges, edited by T. Schneider, and A. H. Sobel, p. to appear in Princeton University Press, Seager, R., D. S. Battisti, M. Gordon, N. Naik, A. C. Clement, and M. A. Cane, Is the gulf stream responsible for Europe s mild winters? Q. J. R. Meteorol. Soc., 128, , Seager et al., R., Causes of Atlantic ocean climate variability between 1958 and 1998, J. Climate, 13, , Shaffrey, L., and R. Sutton, Bjerknes compensation and the decadel variability of the energy transports in a coupled climate model, J. Climate, 19, , Stocker, T. F., R. Knutti, and G.-K. Plattner, The future of the thermohaline circulation a perspective, in The Ocean and Rapid Climate Changes: Past, Present, and Future, edited by D. Seidov, M. Maslin, and B. Haupt, pp Geophys. Monograph 126, American Geophysical Union, Stone, P. H., Constraints on dynamical transports of energy on a spherical planet, Dyn. of Atmospheres and Oceans, 2, , Stouffer, R. J., et al., Investigating the causes of the response of the thermohaline circulation to past and future climate changes, J. Climate, 19, , Thorndike, A. S., A toy model linking atmospheric thermal radiation and sea ice growth, J. Geophys. Res., 97, , Timmermann, A., U. Krebs, F. Justino, H. Goosse, and T. Ivanochko, Mechanisms for millennial-scale global synchronization during the last glacial period, Paleoceanography, 20, doi: /2004pa001090, Trenberth, K. E., and J. M. Caron, Estimates of meridional atmosphere and ocean heat transports, J. Climate, 14, , Vellinga, M., and R. Wood, Global climatic impacts of a collapse of the Atlantic thermohaline circulation, Clim. Dyn., 54, 2002.
34 Voelker, A. H. L., Global distribution of centennial-scale records for marine isotope stage (mis) 3: a database, Quaternary Science Reviews, 21, , Winton, M., and E. Sarachik, Thermohaline oscillations induced by strong steady salinity forcing of ocean general circulation models, J. Phys. Oceanogr., 23, , Xie, S. P., A dynamic ocean-atmosphere model of the tropical Atlantic decadal variability, J. Climate, 12, 64 70, Yang, J. Y., A linkage between decadal climate variations in the Labrador Sea and the tropical Atlantic ocean, Geophys. Res. Lett., 26, , Zhang, R., and T. L. Delworth, Simulated tropical response to a substantial weakening of the Atlantic thermohaline circulation, J. Climate, 18, , 2005.
35 Figure Captions Fig. 1. Annual mean thermohaline circulation index in Sv (1 Sv = 10 6 m 3 s 1) for freshened runs (solid line = modern, dashed = LGM). The light gray lines show the mean index for the corresponding control runs with error bars indicating plus/minus one standard deviation. The index is the sinking rate across 1022 m depth from N in the North Atlantic and subpolar seas, which emphasizes changes in NADW formation rate, as suggested by Gent (2001). Positive (negative) values indicate sinking (upwelling). Fig. 2. Climatological mean meridional overturning streamfunction in the controls (a and c) and the anomaly averaged for the second decade after the onset of freshwater pulse (b and d). Units are in Sv (1 Sv = 10 6 m 3 s 1) and solid (dashed) contours represent clockwise (counter-clockwise) circulations. Fig. 3. Anomalous surface temperature (in deg C), wind stress, and precipitation for years (a and b) and years (c and d) in the freshened experiments. Precipitation contour interval is 5 mm/day, negative contours are dashed, and the zero contour is suppressed. Temperature and wind anomalies below the 95% confidence interval are suppressed. Fig. 4. Annual mean surface density in the controls in g cm 3 (a and b) and total (vertically summed) ocean heat uptake in the first 20 years after freshening in W m 2 (c and d). All panels include the annual mean 15% sea ice concentration contour in the controls (solid lines) and years after freshening (dashed lines). The expansion after freshening is mostly isolated to winter months. Fig. 5. Upper ocean temperature anomalies in the Atlantic for the modern and LGM freshened states. The anomalies are calculated by subtracting the control mean from freshened mean averaged over years 4-9 after onset of freshening. By that time, upper ocean adjustments in the Atlantic were well established. The units are C. Fig. 6. Meridional heat transport for the modern control climate (units: PW). a) Global mean transport by the atmosphere and ocean. b) AHT in a) broken into its dry static energy (DSE) and latent energy (LE) components. c) OHT in a) broken into contributions from each basin. Line legend is provided on each panel. Glb, Atl, Ind, Pac represent global, Atlantic, Indian, and Pacific Ocean, respectively. Fig. 7. OHT anomaly averaged over years after onset of the freshwater perturbation and its contributions from each basin (units: PW). a) for modern background climate state; b) for LGM background climate state. Line legend is provided at the top of the figure. Glb, Atl, Ind, Pac represent global, Atlantic, Indian, and Pacific Ocean, respectively. Fig. 8. Anomalous heat transport by the atmosphere (dash-dotted line), ocean (solid line), and combined ocean and atmosphere (dashed line) averaged over years in the freshened climate relative to the control mean. The thicker (thinner) lines represent results from modern (LGM) background states. The units are PW. Fig. 9. Flux anomalies averaged over years of the LGM perturbation experiment. Top panels: TOA net radiative flux anomaly; middle panels: surface net flux anomaly; bottom panels: atmospheric net flux anomaly, computed as the difference between the TOA and surface net flux. In the TOA and surface flux anomalies, positive values are directed downwards, and for the atmospheric flux, positive values are into the atmosphere. The left panels are the zonal averages of
36 the corresponding right panels, computed from 40 S to 40 N to emphasize the tropical changes. The units are Wm 2. Fig. 10. Global zonal mean anomalous AHT and its DSE and LE components (units: PW). Line legend is provided at the top of the figure. The upper panel corresponds to the modern simulation, and the lower panel corresponds to the LGM simulation. Fig. 11. Global atmospheric sensible heat transport anomaly by the mean meridional circulation (MMC), stationary, and transient eddies, for the modern (left panel) and LGM (right panel) basic state. Line legend is provided at the top of the plot. The anomaly is averaged over years in the freshened climate. The units are PW. Fig. 12. Changes to the LGM North Atlantic for years after perturbation onset. Left panel: Ekman pumping velocity (x10 6 m/s) zonally averaged over the Atlantic basin. Black line is for the control LGM simulation, and green is averaged for years after perturbation onset. Positive values represent upward motion. Right panel: Surface temperature anomalies averaged over years (shaded; units are K), net surface flux (contours interval is 15 Wm 2, solid lines are into the ocean; the zero line is not plotted), and surface wind stress anomalies (reference vector is 0.05 Nm 2 ).
37 37 Sinking Rate Sv Year Since Freshening Figure 1.
38 Figure 2.
39 39 a) LGM b) Modern Years c) LGM d) Modern Years cm/s 803 Figure 3.

40 Figure 4.
The Planetary Circulation System
 12 The Planetary Circulation System Learning Goals After studying this chapter, students should be able to: 1. describe and account for the global patterns of pressure, wind patterns and ocean currents
Interhemispheric climate connections: What can the atmosphere do?
 Interhemispheric climate connections: What can the atmosphere do? Raymond T. Pierrehumbert The University of Chicago 1 Uncertain feedbacks plague estimates of climate sensitivity 2 Water Vapor Models agree
An Introduction to Coupled Models of the Atmosphere Ocean System
 An Introduction to Coupled Models of the Atmosphere Ocean System Jonathon S. Wright jswright@tsinghua.edu.cn Atmosphere Ocean Coupling 1. Important to climate on a wide range of time scales Diurnal to
Winds and Global Circulation
 Winds and Global Circulation Atmospheric Pressure Winds Global Wind and Pressure Patterns Oceans and Ocean Currents El Nino How is Energy Transported to its escape zones? Both atmospheric and ocean transport
Lecture 1. Amplitude of the seasonal cycle in temperature
 Lecture 6 Lecture 1 Ocean circulation Forcing and large-scale features Amplitude of the seasonal cycle in temperature 1 Atmosphere and ocean heat transport Trenberth and Caron (2001) False-colour satellite
TROPICAL-EXTRATROPICAL INTERACTIONS
 Notes of the tutorial lectures for the Natural Sciences part by Alice Grimm Fourth lecture TROPICAL-EXTRATROPICAL INTERACTIONS Anomalous tropical SST Anomalous convection Anomalous latent heat source Anomalous
Ocean Mixing and Climate Change
 Ocean Mixing and Climate Change Factors inducing seawater mixing Different densities Wind stirring Internal waves breaking Tidal Bottom topography Biogenic Mixing (??) In general, any motion favoring turbulent
2. Meridional atmospheric structure; heat and water transport. Recall that the most primitive equilibrium climate model can be written
 2. Meridional atmospheric structure; heat and water transport The equator-to-pole temperature difference DT was stronger during the last glacial maximum, with polar temperatures down by at least twice
Fast and Slow Response of Sea ice and the Southern Ocean to Ozone Depletion
 Fast and Slow Response of Sea ice and the Southern Ocean to Ozone Depletion Annual Minimum Sea ice extent 1979-2013 10 6 km 2 Arctic September Antarctic February Data from in passive microwave satellite
MERIDIONAL OVERTURNING CIRCULATION: SOME BASICS AND ITS MULTI-DECADAL VARIABILITY
 MERIDIONAL OVERTURNING CIRCULATION: SOME BASICS AND ITS MULTI-DECADAL VARIABILITY Gokhan Danabasoglu National Center for Atmospheric Research OUTLINE: - Describe thermohaline and meridional overturning
Tropical Pacific responses to Neogene Andean uplift and highlatitude. Ran Feng and Chris Poulsen University of Michigan
 Tropical Pacific responses to Neogene Andean uplift and highlatitude sea ice expansion Ran Feng and Chris Poulsen University of Michigan Reconstructions of Neogene equatorial Pacific SSTs SST difference
The North Atlantic Oscillation: Climatic Significance and Environmental Impact
 1 The North Atlantic Oscillation: Climatic Significance and Environmental Impact James W. Hurrell National Center for Atmospheric Research Climate and Global Dynamics Division, Climate Analysis Section
Variability of the Atlantic Meridional Overturning Circulation (AMOC)
") Variability of the Atlantic Meridional Overturning Circulation (AMOC) Rowan Sutton Director of Climate Research UK National Centre for Atmospheric Science (NCAS) Department of Meteorology University of
Variability of the Atlantic Meridional Overturning Circulation (AMOC) Rowan Sutton Director of Climate Research UK National Centre for Atmospheric Science (NCAS) Department of Meteorology University of
Eurasian Snow Cover Variability and Links with Stratosphere-Troposphere Coupling and Their Potential Use in Seasonal to Decadal Climate Predictions
 US National Oceanic and Atmospheric Administration Climate Test Bed Joint Seminar Series NCEP, Camp Springs, Maryland, 22 June 2011 Eurasian Snow Cover Variability and Links with Stratosphere-Troposphere
Wind: Global Systems Chapter 10
 Wind: Global Systems Chapter 10 General Circulation of the Atmosphere General circulation of the atmosphere describes average wind patterns and is useful for understanding climate Over the earth, incoming
Dynamics and Kinematics
 Geophysics Fluid Dynamics () Syllabus Course Time Lectures: Tu, Th 09:30-10:50 Discussion: 3315 Croul Hall Text Book J. R. Holton, "An introduction to Dynamic Meteorology", Academic Press (Ch. 1, 2, 3,
Geophysics Fluid Dynamics (ESS228)
") Geophysics Fluid Dynamics (ESS228) Course Time Lectures: Tu, Th 09:30-10:50 Discussion: 3315 Croul Hall Text Book J. R. Holton, "An introduction to Dynamic Meteorology", Academic Press (Ch. 1, 2, 3, 4,
Geophysics Fluid Dynamics (ESS228) Course Time Lectures: Tu, Th 09:30-10:50 Discussion: 3315 Croul Hall Text Book J. R. Holton, "An introduction to Dynamic Meteorology", Academic Press (Ch. 1, 2, 3, 4,
AMOC Impacts on Climate
 AMOC Impacts on Climate Rong Zhang GFDL/NOAA, Princeton, NJ, USA Paleo-AMOC Workshop, Boulder, CO, USA May 24, 2016 Atlantic Meridional Overturning Circulation (AMOC) Kuklbrodt et al. 2007 McManus et al.,
CHAPTER 2 - ATMOSPHERIC CIRCULATION & AIR/SEA INTERACTION
 Chapter 2 - pg. 1 CHAPTER 2 - ATMOSPHERIC CIRCULATION & AIR/SEA INTERACTION The atmosphere is driven by the variations of solar heating with latitude. The heat is transferred to the air by direct absorption
The Arctic Energy Budget
 The Arctic Energy Budget The global heat engine [courtesy Kevin Trenberth, NCAR]. Differential solar heating between low and high latitudes gives rise to a circulation of the atmosphere and ocean that
Climate Dynamics (PCC 587): Hydrologic Cycle and Global Warming
: Hydrologic Cycle and Global Warming") Climate Dynamics (PCC 587): Hydrologic Cycle and Global Warming D A R G A N M. W. F R I E R S O N U N I V E R S I T Y O F W A S H I N G T O N, D E P A R T M E N T O F A T M O S P H E R I C S C I E N C
Climate Dynamics (PCC 587): Hydrologic Cycle and Global Warming D A R G A N M. W. F R I E R S O N U N I V E R S I T Y O F W A S H I N G T O N, D E P A R T M E N T O F A T M O S P H E R I C S C I E N C
Sensitivity of Intertropical Convergence Zone Movement to the Latitudinal Position of Thermal Forcing
 15 APRIL 2014 S E O E T A L. 3035 Sensitivity of Intertropical Convergence Zone Movement to the Latitudinal Position of Thermal Forcing JEONGBIN SEO AND SARAH M. KANG School of Urban and Environmental
GEO1010 tirsdag
 GEO1010 tirsdag 31.08.2010 Jørn Kristiansen; jornk@met.no I dag: Først litt repetisjon Stråling (kap. 4) Atmosfærens sirkulasjon (kap. 6) Latitudinal Geographic Zones Figure 1.12 jkl TØRR ATMOSFÆRE Temperature
the 2 past three decades
 SUPPLEMENTARY INFORMATION DOI: 10.1038/NCLIMATE2840 Atlantic-induced 1 pan-tropical climate change over the 2 past three decades 3 4 5 6 7 8 9 10 POP simulation forced by the Atlantic-induced atmospheric
Lecture 5: Atmospheric General Circulation and Climate
 Lecture 5: Atmospheric General Circulation and Climate Geostrophic balance Zonal-mean circulation Transients and eddies Meridional energy transport Moist static energy Angular momentum balance Atmosphere
General Circulation. Nili Harnik DEES, Lamont-Doherty Earth Observatory
 General Circulation Nili Harnik DEES, Lamont-Doherty Earth Observatory nili@ldeo.columbia.edu Latitudinal Radiation Imbalance The annual mean, averaged around latitude circles, of the balance between the
Patterns and impacts of ocean warming and heat uptake
 Patterns and impacts of ocean warming and heat uptake Shang-Ping Xie Scripps Inst of Oceanography, UCSD Ocean warming & circulation change Ocean heat uptake & meridional overturning circulation Global
Simulated variability in the mean atmospheric meridional circulation over the 20th century
 GEOPHYSICAL RESEARCH LETTERS, VOL. 36, L06704, doi:10.1029/2008gl036741, 2009 Simulated variability in the mean atmospheric meridional circulation over the 20th century Damianos F. Mantsis 1 and Amy C.
The effect of ocean mixed layer depth on climate in slab ocean aquaplanet experiments
 The effect of ocean mixed layer depth on climate in slab ocean aquaplanet experiments The MIT Faculty has made this article openly available. Please share how this access benefits you. Your story matters.
CHAPTER 9 ATMOSPHERE S PLANETARY CIRCULATION MULTIPLE CHOICE QUESTIONS
 CHAPTER 9 ATMOSPHERE S PLANETARY CIRCULATION MULTIPLE CHOICE QUESTIONS 1. Viewed from above in the Northern Hemisphere, surface winds about a subtropical high blow a. clockwise and inward. b. counterclockwise.
An Interconnected Planet
 An Interconnected Planet How Clouds, Aerosols, and the Ocean Cause Distant Rainfall Anomalies Dargan M. W. Frierson University of Washington CESM Workshop, 6-15-15 New Connections Recent research has uncovered
isopycnal outcrop w < 0 (downwelling), v < 0 L.I. V. P.
, v < 0 L.I. V. P.") Ocean 423 Vertical circulation 1 When we are thinking about how the density, temperature and salinity structure is set in the ocean, there are different processes at work depending on where in the water
Ocean 423 Vertical circulation 1 When we are thinking about how the density, temperature and salinity structure is set in the ocean, there are different processes at work depending on where in the water
ATMO 436a. The General Circulation. Redacted version from my NATS lectures because Wallace and Hobbs virtually ignores it
 ATMO 436a The General Circulation Redacted version from my NATS lectures because Wallace and Hobbs virtually ignores it Scales of Atmospheric Motion vs. Lifespan The general circulation Atmospheric oscillations
The linear additivity of the forcings' responses in the energy and water cycles. Nathalie Schaller, Jan Cermak, Reto Knutti and Martin Wild
 The linear additivity of the forcings' responses in the energy and water cycles Nathalie Schaller, Jan Cermak, Reto Knutti and Martin Wild WCRP OSP, Denver, 27th October 2011 1 Motivation How will precipitation
Rapid Climate Change: Heinrich/Bolling- Allerod Events and the Thermohaline Circulation. By: Andy Lesage April 13, 2010 Atmos.
 Rapid Climate Change: Heinrich/Bolling- Allerod Events and the Thermohaline Circulation By: Andy Lesage April 13, 2010 Atmos. 6030 Outline Background Heinrich Event I/Bolling-Allerod Transition (Liu et
What We ve Learned from the AMOC Modeling Efforts about AMOC Processes and its Role in Weather and Climate
 What We ve Learned from the AMOC Modeling Efforts about AMOC Processes and its Role in Weather and Climate Rong Zhang GFDL/NOAA POS/PSMI Joint Breakout Session 2017 US CLIVAR Summit Baltimore, August 9,
Examination of Isentropic Circulation Response to a Doubling of Carbon Dioxide Using Statistical Transformed Eulerian Mean*
 JUNE 2013 W U A N D P A U L U I S 1649 Examination of Isentropic Circulation Response to a Doubling of Carbon Dioxide Using Statistical Transformed Eulerian Mean* YUTIAN WU AND OLIVIER PAULUIS Courant
7 The General Circulation
 7 The General Circulation 7.1 The axisymmetric state At the beginning of the class, we discussed the nonlinear, inviscid, axisymmetric theory of the meridional structure of the atmosphere. The important
Climate sensitivity of coupled models with differing ocean components
 Climate sensitivity of coupled models with differing ocean components Alex Megann, Adam Blaker and Adrian New National Oceanography Centre, Southampton, UK LOM Workshop, Miami, February 2011 Overview Introduction
CHAPTER 8 NUMERICAL SIMULATIONS OF THE ITCZ OVER THE INDIAN OCEAN AND INDONESIA DURING A NORMAL YEAR AND DURING AN ENSO YEAR
 CHAPTER 8 NUMERICAL SIMULATIONS OF THE ITCZ OVER THE INDIAN OCEAN AND INDONESIA DURING A NORMAL YEAR AND DURING AN ENSO YEAR In this chapter, comparisons between the model-produced and analyzed streamlines,
2/15/2012. Earth System Science II EES 717 Spring 2012
 Earth System Science II EES 717 Spring 2012 1. The Earth Interior Mantle Convection & Plate Tectonics 2. The Atmosphere - Climate Models, Climate Change and Feedback Processes 3. The Oceans Circulation;
North Pacific Climate Overview N. Bond (UW/JISAO), J. Overland (NOAA/PMEL) Contact: Last updated: September 2008
, J. Overland (NOAA/PMEL) Contact: Last updated: September 2008") North Pacific Climate Overview N. Bond (UW/JISAO), J. Overland (NOAA/PMEL) Contact: Nicholas.Bond@noaa.gov Last updated: September 2008 Summary. The North Pacific atmosphere-ocean system from fall 2007
North Pacific Climate Overview N. Bond (UW/JISAO), J. Overland (NOAA/PMEL) Contact: Nicholas.Bond@noaa.gov Last updated: September 2008 Summary. The North Pacific atmosphere-ocean system from fall 2007
SIO 210 Final examination Answer Key for all questions except Daisyworld. Wednesday, December 10, PM Name:
 SIO 210 Final examination Answer Key for all questions except Daisyworld. Wednesday, December 10, 2008 3-6 PM Name: This is a closed book exam. You may use a calculator. There are two parts: Talley (weighted
Presentation A simple model of multiple climate regimes
 A simple model of multiple climate regimes Kerry Emanuel March 21, 2012 Overview 1. Introduction 2. Essential Climate Feedback Processes Ocean s Thermohaline Circulation, Large-Scale Circulation of the
3. Midlatitude Storm Tracks and the North Atlantic Oscillation
 3. Midlatitude Storm Tracks and the North Atlantic Oscillation Copyright 2006 Emily Shuckburgh, University of Cambridge. Not to be quoted or reproduced without permission. EFS 3/1 Review of key results
TROPICAL METEOROLOGY Ocean-Atmosphere Interaction and Tropical Climate Shang-Ping Xie OCEAN-ATMOSPHERE INTERACTION AND TROPICAL CLIMATE
 OCEAN-ATMOSPHERE INTERACTION AND TROPICAL CLIMATE Shang-Ping Xie International Pacific Research Center and Department of Meteorology University of Hawaii, Honolulu, HI 96822, USA Keywords: ocean-atmospheric
Our Climate without Antarctica
 Our Climate without Antarctica Cecilia Bitz, Hansi Singh, Dargan Frierson University of Washington Andrew Pauling, Inga Smith, & Pat Langhorne University of Otago Photo by John Weller Ice Shelf Cavity
( ) = 1005 J kg 1 K 1 ;
 = 1005 J kg 1 K 1 ;") Problem Set 3 1. A parcel of water is added to the ocean surface that is denser (heavier) than any of the waters in the ocean. Suppose the parcel sinks to the ocean bottom; estimate the change in temperature
Problem Set 3 1. A parcel of water is added to the ocean surface that is denser (heavier) than any of the waters in the ocean. Suppose the parcel sinks to the ocean bottom; estimate the change in temperature
CHAPTER 4. THE HADLEY CIRCULATION 59 smaller than that in midlatitudes. This is illustrated in Fig. 4.2 which shows the departures from zonal symmetry
 Chapter 4 THE HADLEY CIRCULATION The early work on the mean meridional circulation of the tropics was motivated by observations of the trade winds. Halley (1686) and Hadley (1735) concluded that the trade
SIO 210 Final examination Wednesday, December 12, :30-2:30 Eckart 227 Name:
 SIO 210 Final examination Wednesday, December 12, 2018 11:30-2:30 Eckart 227 Name: Please put your initials or name on each page, especially if you pull pages apart. Turn off all phones, ipods, etc. and
Upper Ocean Circulation
 Upper Ocean Circulation C. Chen General Physical Oceanography MAR 555 School for Marine Sciences and Technology Umass-Dartmouth 1 MAR555 Lecture 4: The Upper Oceanic Circulation The Oceanic Circulation
Chapter 7: Thermodynamics
 Chapter 7: Thermodynamics 7.1 Sea surface heat budget In Chapter 5, we have introduced the oceanic planetary boundary layer-the Ekman layer. The observed T and S in this layer are almost uniform vertically,
ATMS 321: Sci. of Climate Final Examination Study Guide Page 1 of 4
 ATMS 321: Sci. of Climate Final Examination Study Guide Page 1 of 4 Atmospheric Sciences 321: Final Examination Study Guide The final examination will consist of similar questions Science of Climate Multiple
Weather & Ocean Currents
 Weather & Ocean Currents Earth is heated unevenly Causes: Earth is round Earth is tilted on an axis Earth s orbit is eliptical Effects: Convection = vertical circular currents caused by temperature differences
no eddies eddies Figure 3. Simulated surface winds. Surface winds no eddies u, v m/s φ0 =12 φ0 =0
 References Held, Isaac M., and Hou, A. Y., 1980: Nonlinear axially symmetric circulations in a nearly inviscid atmosphere. J. Atmos. Sci. 37, 515-533. Held, Isaac M., and Suarez, M. J., 1994: A proposal
Arctic Climate Change. Glen Lesins Department of Physics and Atmospheric Science Dalhousie University Create Summer School, Alliston, July 2013
 Arctic Climate Change Glen Lesins Department of Physics and Atmospheric Science Dalhousie University Create Summer School, Alliston, July 2013 When was this published? Observational Evidence for Arctic
The feature of atmospheric circulation in the extremely warm winter 2006/2007
 The feature of atmospheric circulation in the extremely warm winter 2006/2007 Hiroshi Hasegawa 1, Yayoi Harada 1, Hiroshi Nakamigawa 1, Atsushi Goto 1 1 Climate Prediction Division, Japan Meteorological
Why the Atlantic was surprisingly quiet in 2013
 1 Why the Atlantic was surprisingly quiet in 2013 by William Gray and Phil Klotzbach Preliminary Draft - March 2014 (Final draft by early June) ABSTRACT This paper discusses the causes of the unusual dearth
Tropical Meridional Circulations: The Hadley Cell
 Tropical Meridional Circulations: The Hadley Cell Introduction Throughout much of the previous sections, we have alluded to but not fully described the mean meridional overturning circulation of the tropics
SUPPLEMENTARY INFORMATION
 SUPPLEMENTARY INFORMATION DOI: 10.1038/NCLIMATE1857 Figure S1a shows significant inter-annual variability in seasonal SPA data with multi-decadal periods exhibiting positive and negative SPAs. A similar
Coupling between Arctic feedbacks and changes in poleward energy transport
 GEOPHYSICAL RESEARCH LETTERS, VOL. 38,, doi:10.1029/2011gl048546, 2011 Coupling between Arctic feedbacks and changes in poleward energy transport Yen Ting Hwang, 1 Dargan M. W. Frierson, 1 and Jennifer
Observation: predictable patterns of ecosystem distribution across Earth. Observation: predictable patterns of ecosystem distribution across Earth 1.
 Climate Chap. 2 Introduction I. Forces that drive climate and their global patterns A. Solar Input Earth s energy budget B. Seasonal cycles C. Atmospheric circulation D. Oceanic circulation E. Landform
SIO 210 Final Exam December 10, :30 2:30 NTV 330 No books, no notes. Calculators can be used.
 SIO 210 Final Exam December 10, 2003 11:30 2:30 NTV 330 No books, no notes. Calculators can be used. There are three sections to the exam: multiple choice, short answer, and long problems. Points are given
Roles of energy conservation and climate feedback in Bjerknes compensation: a coupled modeling study
 Clim Dyn (2017) 49:1513 1529 DOI 10.1007/s00382-016-3386-y Roles of energy conservation and climate feedback in Bjerknes compensation: a coupled modeling study Haijin Dai 1,2 Haijun Yang 1 Jie Yin 1 Received:
Introduction to Climate ~ Part I ~
 2015/11/16 TCC Seminar JMA Introduction to Climate ~ Part I ~ Shuhei MAEDA (MRI/JMA) Climate Research Department Meteorological Research Institute (MRI/JMA) 1 Outline of the lecture 1. Climate System (
F = ma. ATS 150 Global Climate Change Winds and Weather. Scott Denning CSU CMMAP 1. Please read Chapter 6 from Archer Textbook
 Winds and Weather Please read Chapter 6 from Archer Textbook Circulation of the atmosphere and oceans are driven by energy imbalances Energy Imbalances What Makes the Wind Blow? Three real forces (gravity,
Dynamics of the Extratropical Response to Tropical Heating
 Regional and Local Climate Modeling and Analysis Research Group R e L o C l i m Dynamics of the Extratropical Response to Tropical Heating (1) Wegener Center for Climate and Global Change (WegCenter) and
Deep Ocean Circulation & implications for Earth s climate
 Deep Ocean Circulation & implications for Earth s climate I. Ocean Layers and circulation types 1) Ocean Layers Ocean is strongly Stratified Consists of distinct LAYERS controlled by density takes huge
Today s Lecture (Lecture 5): General circulation of the atmosphere
: General circulation of the atmosphere") Climate Dynamics (Summer Semester 2017) J. Mülmenstädt Today s Lecture (Lecture 5): General circulation of the atmosphere Reference Hartmann, Global Physical Climatology (1994), Ch. 2, 3, 6 Peixoto and
Climate Dynamics (Summer Semester 2017) J. Mülmenstädt Today s Lecture (Lecture 5): General circulation of the atmosphere Reference Hartmann, Global Physical Climatology (1994), Ch. 2, 3, 6 Peixoto and
Variability of Atlantic Ocean heat transport and its effects on the atmosphere
 ANNALS OF GEOPHYSICS, VOL. 46, N., February 3 Variability of Atlantic Ocean heat transport and its effects on the atmosphere Buwen Dong and Rowan T. Sutton Centre for Global Atmospheric Modelling, Department
Topic # 12 How Climate Works
 Topic # 12 How Climate Works A Primer on How the Energy Balance Drives Atmospheric & Oceanic Circulation, Natural Climatic Processes pp 63-68 in Class Notes How do we get energy from this........ to drive
Winds and Currents in the Oceans
 Winds and Currents in the Oceans Atmospheric Processes Density of air is controlled by temperature, pressure, and moisture content. 1. Warm air is less dense than cold air and moist air is less dense than
Chapter 4. Understanding the Weather. Weather is short-term and caused by various air and ocean circulations
 Video: Meteorologist Paul Douglas April 2013 Understanding the Weather Weather is short-term and caused by various air and ocean circulations There are natural climate cycle that cause large climate changes
ATOC 5051 INTRODUCTION TO PHYSICAL OCEANOGRAPHY. Lecture 19. Learning objectives: develop a physical understanding of ocean thermodynamic processes
 ATOC 5051 INTRODUCTION TO PHYSICAL OCEANOGRAPHY Lecture 19 Learning objectives: develop a physical understanding of ocean thermodynamic processes 1. Ocean surface heat fluxes; 2. Mixed layer temperature
Lecture 7: The Monash Simple Climate
 Climate of the Ocean Lecture 7: The Monash Simple Climate Model Dr. Claudia Frauen Leibniz Institute for Baltic Sea Research Warnemünde (IOW) claudia.frauen@io-warnemuende.de Outline: Motivation The GREB
climate system and its subcomponents: the atmosphere, ocean, land surface, Prof. Jin-Yi Yu ESS200A A general description of the Earth
 Earth System Climate () Course Time Lectures: Tu, Th 9:30-10:20 Discussion: 3315 Croul Hall Text Book The Earth System, Kump, Kasting, and Crane, Prentice-Hall Global Physical Climatology, Hartmann; Academic
Response of the North Atlantic atmospheric circulation to increasing LGM ice-sheet elevation
 Response of the North Atlantic atmospheric circulation to increasing LGM ice-sheet elevation Marcus Löfverström NCAR Rodrigo Caballero Johan Nilsson Gabriele Messori Stockholm University The Northern Hemisphere
ENSO: Recent Evolution, Current Status and Predictions. Update prepared by: Climate Prediction Center / NCEP 30 October 2017
 ENSO: Recent Evolution, Current Status and Predictions Update prepared by: Climate Prediction Center / NCEP 30 October 2017 Outline Summary Recent Evolution and Current Conditions Oceanic Niño Index (ONI)
The effects of North Atlantic SST and sea-ice anomalies. on the winter circulation in CCM3. Part II: Direct and indirect components of the response
 The effects of North Atlantic SST and sea-ice anomalies on the winter circulation in CCM3. Part II: Direct and indirect components of the response Clara Deser 1, Gudrun Magnusdottir 2, R. Saravanan 1 and
Atmospheric Sciences 321. Science of Climate. Lecture 20: More Ocean: Chapter 7
 Atmospheric Sciences 321 Science of Climate Lecture 20: More Ocean: Chapter 7 Community Business Quiz discussion Next Topic will be Chapter 8, Natural Climate variability in the instrumental record. Homework
THE RELATION AMONG SEA ICE, SURFACE TEMPERATURE, AND ATMOSPHERIC CIRCULATION IN SIMULATIONS OF FUTURE CLIMATE
 THE RELATION AMONG SEA ICE, SURFACE TEMPERATURE, AND ATMOSPHERIC CIRCULATION IN SIMULATIONS OF FUTURE CLIMATE Bitz, C. M., Polar Science Center, University of Washington, U.S.A. Introduction Observations
Centennial-scale Climate Change from Decadally-paced Explosive Volcanism
 Centennial-scale Climate Change from Decadally-paced Explosive Volcanism Yafang Zhong and Gifford Miller INSTAAR, University of Colorado at Boulder, USA Bette Otto-Bliesner, Caspar Ammann, Marika Holland,
Where is all the water?
 Where is all the water? The distribution of water at the Earth's surface % of total Oceans 97.25 Ice caps and glaciers 2.05 Groundwater 0.68 Lakes 0.01 Soils 0.005 Atmosphere (as vapour) 0.001 Rivers 0.0001
Project Retrograde imagine Earth rotated in the opposite direction
 Project Retrograde imagine Earth rotated in the opposite direction The rotation of Earth shapes our climate system in various ways: It controls the major wind directions, lets the weather systems swirl,
Topic # 11 HOW CLIMATE WORKS continued (Part II) pp in Class Notes
 pp in Class Notes") Topic # 11 HOW CLIMATE WORKS continued (Part II) pp 61-67 in Class Notes To drive the circulation, the initial source of energy is from the Sun: Not to scale! EARTH- SUN Relationships 4 Things to Know
Topic # 11 HOW CLIMATE WORKS continued (Part II) pp 61-67 in Class Notes To drive the circulation, the initial source of energy is from the Sun: Not to scale! EARTH- SUN Relationships 4 Things to Know
Lecture 8. Lecture 1. Wind-driven gyres. Ekman transport and Ekman pumping in a typical ocean basin. VEk
 Lecture 8 Lecture 1 Wind-driven gyres Ekman transport and Ekman pumping in a typical ocean basin. VEk wek > 0 VEk wek < 0 VEk 1 8.1 Vorticity and circulation The vorticity of a parcel is a measure of its
Climate and the Atmosphere
 Climate and Biomes Climate Objectives: Understand how weather is affected by: 1. Variations in the amount of incoming solar radiation 2. The earth s annual path around the sun 3. The earth s daily rotation
ESS 111 Climate & Global Change. Week 1 Weather vs Climate Structure of the Atmosphere Global Wind Belts
 ESS 111 Climate & Global Change Week 1 Weather vs Climate Structure of the Atmosphere Global Wind Belts Weather is the state of the atmosphere at a given place and time. For example, right now, the temperature
MAR 110 LECTURE #10 The Oceanic Conveyor Belt Oceanic Thermohaline Circulation
 1 MAR 110 LECTURE #10 The Oceanic Conveyor Belt Oceanic Thermohaline Circulation Ocean Climate Temperature Zones The pattern of approximately parallel oceanic surface isotherms (lines of constant temperature)
Atmospheric Circulation
 Atmospheric Circulation Introductory Oceanography Instructor: Ray Rector Atmospheric Circulation Key Topics Composition and Structure Solar Heating and Convection The Coriolis Effect Global Wind Patterns
Climate Change 2007: The Physical Science Basis
 Climate Change 2007: The Physical Science Basis Working Group I Contribution to the IPCC Fourth Assessment Report Presented by R.K. Pachauri, IPCC Chair and Bubu Jallow, WG 1 Vice Chair Nairobi, 6 February
NOTES AND CORRESPONDENCE. On the Seasonality of the Hadley Cell
 1522 JOURNAL OF THE ATMOSPHERIC SCIENCES VOLUME 60 NOTES AND CORRESPONDENCE On the Seasonality of the Hadley Cell IOANA M. DIMA AND JOHN M. WALLACE Department of Atmospheric Sciences, University of Washington,
Transient and Eddy. Transient/Eddy Flux. Flux Components. Lecture 3: Weather/Disturbance. Transient: deviations from time mean Time Mean
 Lecture 3: Weather/Disturbance Transients and Eddies Climate Roles Mid-Latitude Cyclones Tropical Hurricanes Mid-Ocean Eddies Transient and Eddy Transient: deviations from time mean Time Mean Eddy: deviations
General Atmospheric Circulation
 General Atmospheric Circulation Take away Concepts and Ideas Global circulation: The mean meridional (N-S) circulation Trade winds and westerlies The Jet Stream Earth s climate zones Monsoonal climate
warmest (coldest) temperatures at summer heat dispersed upward by vertical motion Prof. Jin-Yi Yu ESS200A heated by solar radiation at the base
 temperatures at summer heat dispersed upward by vertical motion Prof. Jin-Yi Yu ESS200A heated by solar radiation at the base") Pole Eq Lecture 3: ATMOSPHERE (Outline) JS JP Hadley Cell Ferrel Cell Polar Cell (driven by eddies) L H L H Basic Structures and Dynamics General Circulation in the Troposphere General Circulation in the
Pole Eq Lecture 3: ATMOSPHERE (Outline) JS JP Hadley Cell Ferrel Cell Polar Cell (driven by eddies) L H L H Basic Structures and Dynamics General Circulation in the Troposphere General Circulation in the
LETTERS. Tropical Stabilization of the Thermohaline Circulation in a Greenhouse Warming Simulation
 VOLUME 13 JOURNAL OF CLIMATE 1JUNE 2000 LETTERS Tropical Stabilization of the Thermohaline Circulation in a Greenhouse Warming Simulation M. LATIF, E.ROECKNER, U.MIKOLAJEWICZ, AND R. VOSS Max-Planck-Institut
Extratropical and Polar Cloud Systems
 Extratropical and Polar Cloud Systems Gunilla Svensson Department of Meteorology & Bolin Centre for Climate Research George Tselioudis Extratropical and Polar Cloud Systems Lecture 1 Extratropical cyclones
The effect of ocean mixed layer depth on climate in slab ocean aquaplanet experiments
 Clim Dyn DOI 1.17/s382-13-1843-4 The effect of ocean mixed layer depth on climate in slab ocean aquaplanet experiments Aaron Donohoe Dargan M. W. Frierson David S. Battisti Received: 21 April 13 / Accepted:
SUPPLEMENTARY INFORMATION
 SUPPLEMENTARY INFORMATION DOI: 10.1038/NGEO1854 Anthropogenic aerosol forcing of Atlantic tropical storms N. J. Dunstone 1, D. S. Smith 1, B. B. B. Booth 1, L. Hermanson 1, R. Eade 1 Supplementary information
Recent warming and changes of circulation in the North Atlantic - simulated with eddy-permitting & eddy-resolving models
 Recent warming and changes of circulation in the North Atlantic - simulated with eddy-permitting & eddy-resolving models Robert Marsh, Beverly de Cuevas, Andrew Coward & Simon Josey (+ contributions by