NW Atlantic warming under climate change: new simulations with high-resolution CESM
|
|
|
- August Patterson
- 5 years ago
- Views:
Transcription


1 NW Atlantic warming under climate change: new simulations with high-resolution CESM Justin Small John Truesdale, Susan Bates, Gary Strand, Jerry Meehl, Don Wuebbles Acknowledging: Mike Alexander, Andrew Thomas, Frank Bryan, Laurent Terray, Ian Grooms, Adam Phillips
.")

2 NW Atlantic SST: sensitivity to ocean resolution LOW-RES OCEAN SST BIAS SST bias, CESM with 0.25deg atmosphere, 1deg ocean. Relative to Reynolds (2007). Annual mean Similar improvement in North-west Pacific/Kuroshio and in Southern Ocean/ACC CHANGE DUE TO HIGH-RES OCEAN OCEAN SST difference, CESM with 0.25deg atmosphere: 1deg. Ocean minus 0.1deg ocean. Sign convention matching colors (top and bottom) implies improvement with resolution..

3 NW Atlantic SST: sensitivity of climate change to ocean resolution From Enhanced warming of the Northwest Atlantic Ocean under climate change Vincent S. Saba 1,*, Stephen M. Griffies 2, Whit G. Anderson 2, Michael Winton 2, Michael A. Alexander 3, Thomas L. Delworth 2, Jonathan A. Hare 4, Matthew J. Harrison 2, Anthony Rosati 2, Gabriel A. Vecchi 2 androng Zhang , JGR SST difference (averaged over years 60-80) between 1% per year CO 2 increase run and preindustrial control. Bottom right is high-resolution model CM2.6. Model resolutions are labelled. Note enhanced warming in NW Atlantic in CM26.
4 NW Atlantic SST: observations of warming Observed warming off US East coast in recent decades Burrows et al 2011, Pershing et al 2015 link to Gulf Stream and PDO Thomas et al 2017 (submitted), Gulf of Maine lengthening of warm season, partly related to Gulf Stream index (more northern) Warming of western boundary currents Wu et al WBCs warm, shift Effect on fisheries E.g. Cod stock reduction (Pershing et al 2015
 Daily (blue, 15-day smoothed) and annual (black dots) SST anomalies from 1982 to 2013, showing the long-term trend (black dashed line) and trend over the decade 2004 2013 (red solid line).")
5 Pershing et al. 2015, Science. Sea surface temperature trends from the Gulf of Maine and the global ocean.(a) Daily (blue, 15-day smoothed) and annual (black dots) SST anomalies from 1982 to 2013, showing the long-term trend (black dashed line) and trend over the decade (red solid line). (B) Global SST trends, The Gulf of Maine is outlined in black. (C) Histogram of global SST trends, with the trend from the Gulf of Maine indicated at the right extreme of the distribution.
6 Aims To determine whether enhanced US East coast warming is seen in high resolution CESM Mini high-res MIP Compare with an ensemble of standard resolution models CESM-LE Investigate the relationship to AMOC proposed by Saba et al Role of Labrador Current
7 Climate change scenario with Highresolution CESM NSF allocation: High Resolution Earth System Modeling for International Climate Assessment Using Blue Waters Capabilities PI: Don Wuebbles (University of Illinois) The primary NCAR collaborators and co-pis: Drs. Warren Washington, Jerry Meehl, Justin Small, and Joseph Tribbia High-resolution CESM CAM5.2 SE, 0.25deg POP2, 0.1deg CESM1.0.4, Small et al 2014, JAMES Branching off from year 50 of the previous high resolution control run (year 2000 conditions), ran with historical conditions for years , then with the RCP8.5 scenario for Run on Blue Waters supercomputer (University of Illinois) Accompanying simulations include 0.25deg atmosphere, 1deg ocean


8 SST change, in first half of 21 st C CESM1-high resolution RCP8.5 Compare with CM2.6: 1%CO to CM2.6 is 0.5deg atmosphere, 0.1deg ocean. Qualitative agreement comparing the RCP8.5 to the 1%per/yr simulations. North-east USA coast is a hotspot of warming.


9 Focus on US East coast: surface CESM1: SST change CESM1: Surface salinity change CESM1: SSH change to psu cm CM2.6: CM2.6:


10 Focus on US East coast: at depth CESM1: CESM1: Note: CESM show values at 155m, CM shows values at ocean bottom. psu


11 What about climate model drift? CESM1 RCP8.5: SST change CESM1 Control: SST change Control run does have slightly enhanced warming off US East coast but much weaker

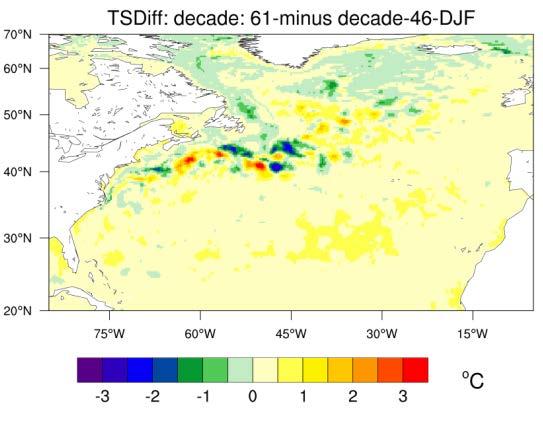
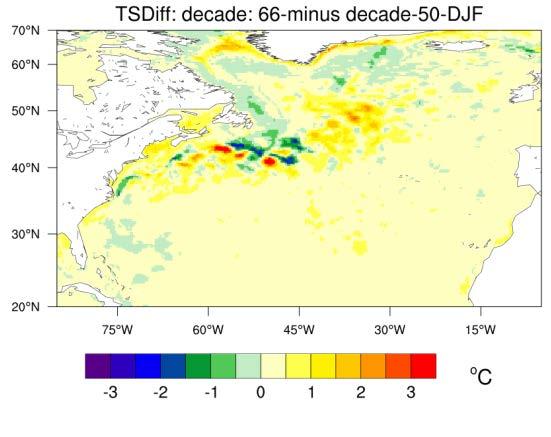
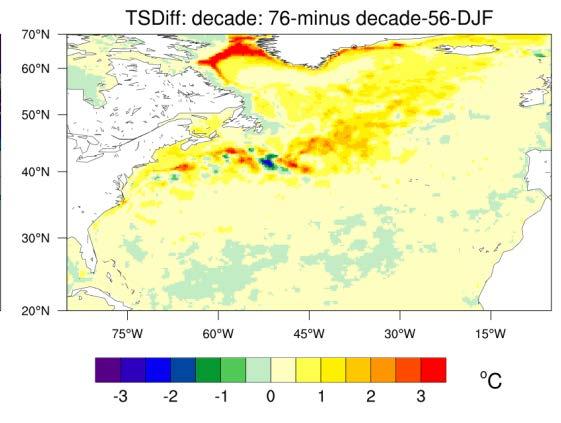

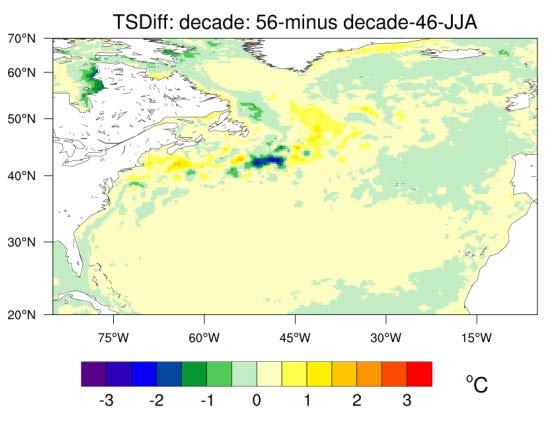

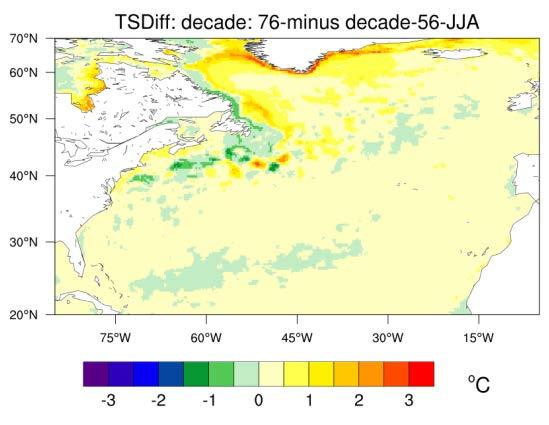
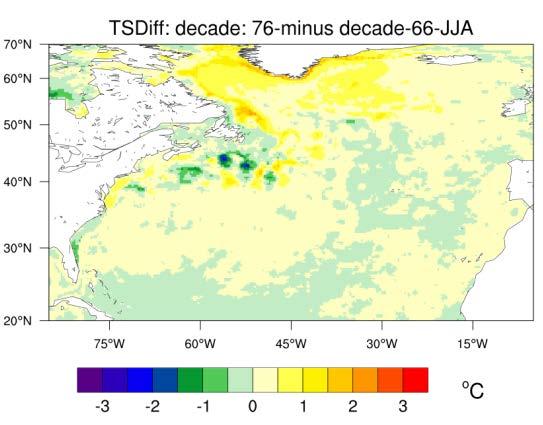
12 and natural variability Some randomly selected differences of decades in control run
13 Changes to Labrador Current, Gulf Stream From Saba et al CONTROL CO2 doubling Labrador current has less intrusion into East coast waters Saba et al. hypothesise that weakening of AMOC (later slides) leads to retreat of Labrador current, northward shift of Gulf Stream, replacement of cold Labrador slope water by warm Atlantic slope waters (Saba et al. 2016)


14 Changes to Labrador Current, Gulf Stream From Saba et al CONTROL CO2 doubling Labrador current has less intrusion into East coast waters CESM1: DIFFERENCE minus in 155m currents cm/s CESM1: As left but DIFFERENCE minus in 155m ZONAL VELOCITY
15 Relationship to AMOC Relationship of NW Atlantic coastal salinity (left) and temperature (right) (red curves) with AMOC (black curves). Top panels are from preindustrial control, bottom are from double CO2 run. All Results from Enhanced warming of the Northwest Atlantic Ocean under climate change Vincent S. Saba 1,*, Stephen M. Griffies 2, Whit G. Anderson 2, Michael Winton 2, Michael A. Alexander 3, Thomas L. Delworth 2, Jonathan A. Hare 4, Matthew J. Harrison 2, Anthony Rosati 2, Gabriel A. Vecchi 2 androng Zhang , JGR
16 AMOC, HI-RES CESM Right: From Small et al 2014 AMOC in high-res CESM control (solid) and standard CESM (thin), year 2000 conditions. AMOC defined as maximum overturning streamfunction in Northern Hemisphere below 500 m depth Left AMOC in high-res RCP8.5 in CESM. The run is initialized from year 50 of the high-res control (solid line above) and the two figures are lined up by equivalent year. In the RCP8.5, an initial increase in AMOC to year ~ 2012 is followed by a decrease. In contrast, in the control the AMOC keeps rising. The temperature differences in previous slides ( minus years ) show low AMOC minus high AMOC periods, as in Saba et al
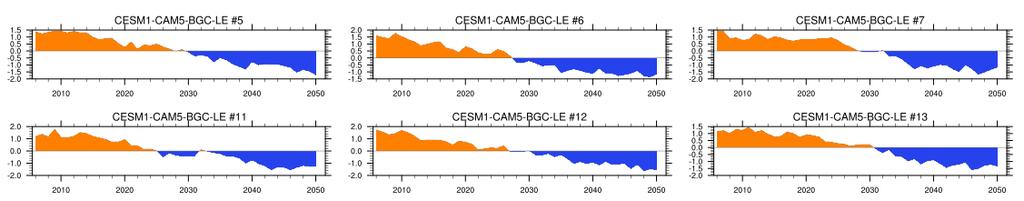
17 CESM-Large Ensemble (LE) Kay et al., Deser et al. Comparison with CESM-LE Linear trend Regression SST on AMOC (see later)
18 High-resolution CESM trend C/44 years /50years


19 High-resolution CESM trend C/45 years /50years
20

21 High-resolution CESM trend /50years
22 Aims Conclusions To determine whether enhanced US East coast warming is seen in high resolution CESM Yes Compare with an ensemble of standard resolution models Ensemble mean of CESM-LE does not show enhanced warming But a hint that some members have enhancement Investigate the relationship to AMOC proposed by Saba et al Labrador Current, Gulf Stream changes consistent with Saba et al. AMOC US East coast SST regressions consistent with Saba et al.
23 Discussion points Does high-res CESM have warmer temps due to strong AMOC decline (as opposed to resolution per-se)? Are the mean values of AMOC, and AMOC decline, in highres CESM realistic? How do changes in SST affect extremes of wind, precipitation? What drives the enhanced warming atmosphere factors vs oceanic advection Can we use natural variability of high-res control to estimate variability of 50 year trends (Thompson et al. 2015)?
24 AMOC-SST-regressions


 but SST")
25 SST regressed on AMOC, no trends removed. Two example CESM-LE members. AMOC decline is similar (bottom plots) but SST trends off US East coast differ deg. C/Sv


26 High-resolution CESM SST-AMOC regression High-resolution CESM SST-AMOC regression, trends removed /Sv /Sv
27

 Sea surface height")
28 Results from High-res CESM RCP8.5 SST difference between years and years of new high-res RCP8.5 scenario with CESM. Note enhanced warming in NW Atlantic (see also next slide) Sea surface height difference between years and years of new high-res RCP8.5 scenario with CESM. Note enhanced SSH rise in NW Atlantic.


29 Surface temperature change Net surface heat flux change. Positive values warm ocean

30 Changes to mixed layer depth MLD defined on 0.03kg/m3 criterion. Difference minus

31 How is AMOC defined
32 Future work Look at seasonal differences Look at duration of summer (Andy Thomas ask for lecture slides) Close up on SST, and current change in N. Atlantic Extremes in sea level and SST, winds
A new century-long high-resolution global climate run using the Community Earth System Model.
 Office of Science (BER) and NERSC and DOE/UCAR Co-operative Agreement US Department of Energy NCAR-Wyoming Supercomputer Center National Science Foundation A new century-long high-resolution global climate
What governs the location of the Southern Ocean deep winter mixing in CESM
 NSF NCAR WYOMING SUPERCOMPUTER CENTER DOE SCIDAC FUNDED PROJECT What governs the location of the Southern Ocean deep winter mixing in CESM Justin Small Dan Whitt Alice DuVivier Matt Long Acknowledging:
MERIDIONAL OVERTURNING CIRCULATION: SOME BASICS AND ITS MULTI-DECADAL VARIABILITY
 MERIDIONAL OVERTURNING CIRCULATION: SOME BASICS AND ITS MULTI-DECADAL VARIABILITY Gokhan Danabasoglu National Center for Atmospheric Research OUTLINE: - Describe thermohaline and meridional overturning
Can Arctic sea ice decline drive a slow-down of the Atlantic Meridional Overturning Circulation (AMOC)?
?") Can Arctic sea ice decline drive a slow-down of the Atlantic Meridional Overturning Circulation (AMOC)? September 2012 NASA Alexey Fedorov Yale University with Florian Sevellec (NOC, Southampton) and Wei
Can Arctic sea ice decline drive a slow-down of the Atlantic Meridional Overturning Circulation (AMOC)? September 2012 NASA Alexey Fedorov Yale University with Florian Sevellec (NOC, Southampton) and Wei
How de-coupling cloud radiative feedbacks strengthens the AMOC
 How de-coupling cloud radiative feedbacks strengthens the AMOC Elizabeth Maroon1, Eleanor Middlemas2, Jennifer Kay1, Brian Medeiros3 1CIRES, University of Colorado Boulder, 2University of Miami, 3National
Patterns and impacts of ocean warming and heat uptake
 Patterns and impacts of ocean warming and heat uptake Shang-Ping Xie Scripps Inst of Oceanography, UCSD Ocean warming & circulation change Ocean heat uptake & meridional overturning circulation Global
Susan Bates Ocean Model Working Group Science Liaison
 Susan Bates Ocean Model Working Group Science Liaison Climate Simulation Laboratory (CSL) Accelerated Scientific Discovery (ASD) NCAR Strategic Capability (NSC) Climate Process Teams (CPTs) NSF Earth System
Recent Results with the GFDL High- Resolution Coupled Modeling Systems
 Recent Results with the GFDL High- Resolution Coupled Modeling Systems Presented by Gabriel Vecchi GFDL/NOAA Princeton, NJ USA Reference: Delworth, T.L., A. Rosati, W. Anderson, A. Adcroft, V. Balaji,
AMOC Impacts on Climate
 AMOC Impacts on Climate Rong Zhang GFDL/NOAA, Princeton, NJ, USA Paleo-AMOC Workshop, Boulder, CO, USA May 24, 2016 Atlantic Meridional Overturning Circulation (AMOC) Kuklbrodt et al. 2007 McManus et al.,
LET NOT THAT ICE MELT IN SVALBARD S. RAJAN, INCOIS NEELU SINGH, NCAOR
 LET NOT THAT ICE MELT IN SVALBARD S. RAJAN, INCOIS NEELU SINGH, NCAOR 1. Arctic (surface air) temperatures are rising twice as fast as the temperatures in the rest of the world (Amplification). The Arctic
What We ve Learned from the AMOC Modeling Efforts about AMOC Processes and its Role in Weather and Climate
 What We ve Learned from the AMOC Modeling Efforts about AMOC Processes and its Role in Weather and Climate Rong Zhang GFDL/NOAA POS/PSMI Joint Breakout Session 2017 US CLIVAR Summit Baltimore, August 9,
(c) (a) (d) (b) JJA DJF. V850 Hulu Cave. V850 Hulu Cave V1000 V1000. Dongge Cave. Dongge Cave. Lake Huguang Maar.
 (a) (d) (b) JJA DJF. V850 Hulu Cave. V850 Hulu Cave V1000 V1000. Dongge Cave. Dongge Cave. Lake Huguang Maar.") NCEP-DOE (1981-2010) TraCE21ka (a) (c) JJA Dongge Cave V850 Hulu Cave Dongge Cave V850 Hulu Cave (b) (d) DJF Lake Huguang Maar V1000 Lake Huguang Maar V1000 Supplementary Figure 1 Climatology of EASM and
NCEP-DOE (1981-2010) TraCE21ka (a) (c) JJA Dongge Cave V850 Hulu Cave Dongge Cave V850 Hulu Cave (b) (d) DJF Lake Huguang Maar V1000 Lake Huguang Maar V1000 Supplementary Figure 1 Climatology of EASM and
An analysis of the Atlantic Meridional Overturning Circulation (MOC) in an Atmosphere-Ocean General Circulation Model
 in an Atmosphere-Ocean General Circulation Model") An analysis of the Atlantic Meridional Overturning Circulation (MOC) in an Atmosphere-Ocean General Circulation Model Virginie Guemas, David Salas-Mélia Centre National de Recherches Météorologiques (CNRM)
An analysis of the Atlantic Meridional Overturning Circulation (MOC) in an Atmosphere-Ocean General Circulation Model Virginie Guemas, David Salas-Mélia Centre National de Recherches Météorologiques (CNRM)
Bavarian Riots, 1819
 Bavarian Riots, 1819 A Future Year Without A Summer J. Fasullo, NCAR B. Otto-Bliesner, E. Brady, S. Stevenson, R. Tomas, and E. Wahl (NOAA) Outline / Science Questions The 1815 Eruption of Mt Tambora What
Understanding Oceans Sustaining Future. Shaoqing Zhang
 Understanding Oceans Sustaining Future Shaoqing Zhang OUTLINE 1. Background: Problem in AMOC reconstruction of GFDL ECDA 2. Hypothesis Importance of tropical high-frequency information to maintain the
SUPPLEMENTARY INFORMATION
 SUPPLEMENTARY INFORMATION (d) (e) Figure S1 Timeseries of the sea ice and overturning circulation response to a cessation of CO 2 emissions. Northern Hemisphere March sea ice cover (km 2 ), Northern Hemisphere
Our Climate without Antarctica
 Our Climate without Antarctica Cecilia Bitz, Hansi Singh, Dargan Frierson University of Washington Andrew Pauling, Inga Smith, & Pat Langhorne University of Otago Photo by John Weller Ice Shelf Cavity
Supplementary Figure 1 Trends of annual mean maximum ocean mixed layer depth. Trends from uninitialized simulations (a) and assimilation simulation
 and assimilation simulation") Supplementary Figure 1 Trends of annual mean maximum ocean mixed layer depth. Trends from uninitialized simulations (a) and assimilation simulation (b) from 1970-1995 (units: m yr -1 ). The dots show grids
Supplementary Figure 1 Trends of annual mean maximum ocean mixed layer depth. Trends from uninitialized simulations (a) and assimilation simulation (b) from 1970-1995 (units: m yr -1 ). The dots show grids
the 2 past three decades
 SUPPLEMENTARY INFORMATION DOI: 10.1038/NCLIMATE2840 Atlantic-induced 1 pan-tropical climate change over the 2 past three decades 3 4 5 6 7 8 9 10 POP simulation forced by the Atlantic-induced atmospheric
The North Atlantic Oscillation as a driver of rapid climate change in the Northern Hemisphere
 SUPPLEMENTARY INFORMATION DOI: 10.1038/NGEO2738 The North Atlantic Oscillation as a driver of rapid climate change in the Northern Hemisphere Thomas L. Delworth, Fanrong Zeng, Gabriel A. Vecchi, Xiaosong
Simulating and Visualizing Hurricane-Ocean Interactions using High-Resolution CESM
 Simulating and Visualizing Hurricane-Ocean Interactions using High-Resolution CESM Ryan Sriver, Dept. of Atmospheric Sciences, University of Illinois Hui Li, Dept. of Atmospheric Sciences, University of
SUPPLEMENTAL MATERIALS FOR:
 SUPPLEMENTAL MATERIALS FOR: Simulated reduction in Atlantic hurricane frequency under 21 st century warming conditions Thomas R. Knutson, Joseph J. Sirutis, Stephen T. Garner, Gabriel A. Vecchi, and Isaac
Bering Strait, AMOC hysteresis, and abrupt climate change
 DOE/UCAR Cooperative Agreement Regional and Global Climate Modeling Program Bering Strait, AMOC hysteresis, and abrupt climate change Aixue Hu Gerald A. Meehl, Weiqing Han, Axel Timmerman, Bette Otto-Bliester,
TROPICAL-EXTRATROPICAL INTERACTIONS
 Notes of the tutorial lectures for the Natural Sciences part by Alice Grimm Fourth lecture TROPICAL-EXTRATROPICAL INTERACTIONS Anomalous tropical SST Anomalous convection Anomalous latent heat source Anomalous
Fast and Slow Response of Sea ice and the Southern Ocean to Ozone Depletion
 Fast and Slow Response of Sea ice and the Southern Ocean to Ozone Depletion Annual Minimum Sea ice extent 1979-2013 10 6 km 2 Arctic September Antarctic February Data from in passive microwave satellite
How can high-resolution representation of the regional seas and aerosols modify regional climate change?
 How can high-resolution representation of the regional seas and aerosols modify regional climate change? A fully-coupled regional climate system approach to question current experimental protocol Samuel
SUPPLEMENTARY INFORMATION
 SUPPLEMENTARY INFORMATION DOI: 10.1038/NGEO1189 Different magnitudes of projected subsurface ocean warming around Greenland and Antarctica Jianjun Yin 1*, Jonathan T. Overpeck 1, Stephen M. Griffies 2,
!"#$%&'()#*+,-./0123 = = = = = ====1970!"#$%& '()* 1980!"#$%&'()*+,-./01"2 !"#$% ADVANCES IN CLIMATE CHANGE RESEARCH
#*+,-./0123 = = = = = ====1970!#$%& '()* 1980!#$%&'()*+,-./012 !#$% ADVANCES IN CLIMATE CHANGE RESEARCH") www.climatechange.cn = = = = = 7 = 6!"#$% 211 11 ADVANCES IN CLIMATE CHANGE RESEARCH Vol. 7 No. 6 November 211!"1673-1719 (211) 6-385-8!"#$%&'()#*+,-./123 N O N=!"# $%&=NMMMUNO=!"#$!%&'()*+=NMMNMN = 1979
www.climatechange.cn = = = = = 7 = 6!"#$% 211 11 ADVANCES IN CLIMATE CHANGE RESEARCH Vol. 7 No. 6 November 211!"1673-1719 (211) 6-385-8!"#$%&'()#*+,-./123 N O N=!"# $%&=NMMMUNO=!"#$!%&'()*+=NMMNMN = 1979
Human influence on terrestrial precipitation trends revealed by dynamical
 1 2 3 Supplemental Information for Human influence on terrestrial precipitation trends revealed by dynamical adjustment 4 Ruixia Guo 1,2, Clara Deser 1,*, Laurent Terray 3 and Flavio Lehner 1 5 6 7 1 Climate
(1) Arctic Sea Ice Predictability,
 Arctic Sea Ice Predictability,") (1) Arctic Sea Ice Predictability, (2) It s Long-term Loss and Implications for Ocean Conditions Marika Holland, NCAR With contributions from: David Bailey, Alex Jahn, Jennifer Kay, Laura Landrum, Steve
(1) Arctic Sea Ice Predictability, (2) It s Long-term Loss and Implications for Ocean Conditions Marika Holland, NCAR With contributions from: David Bailey, Alex Jahn, Jennifer Kay, Laura Landrum, Steve
The role of the midlatitude ocean in sub-seasonal prediction
 The role of the midlatitude ocean in sub-seasonal prediction R. Saravanan Xiaohui Ma, Xue Liu, J. Steinweg-Woods J. Kurian, R. Montuoro, P. Chang, I. Szunyogh Yinglai Jia, Ocean University of China J.
Moving from Global to Regional Projections of Climate Change
 Moving from Global to Regional Projections of Climate Change Mat Collins College of Engineering, Mathematics and Physical Sciences, University of Exeter, UK Yann Arthus-Bertrand / Altitude Joint Met Office
Potential Impact of climate change and variability on the Intra-Americas Sea (IAS)
") Potential Impact of climate change and variability on the Intra-Americas Sea (IAS) Sang-Ki Lee 1, Yanyun Liu 1 and Barbara Muhling 2 1 CIMAS-University of Miami and AOML-NOAA 2 Princeton University and
Potential Impact of climate change and variability on the Intra-Americas Sea (IAS) Sang-Ki Lee 1, Yanyun Liu 1 and Barbara Muhling 2 1 CIMAS-University of Miami and AOML-NOAA 2 Princeton University and
Decadal Prediction at NCAR. Joe Tribbia AND G. Danabasoglu, P. Gent, J. Hurrell J. Meehl, B. Large, F. Bryan, G. Branstator and
 Decadal Prediction at NCAR Joe Tribbia AND G. Danabasoglu, P. Gent, J. Hurrell J. Meehl, B. Large, F. Bryan, G. Branstator and NCAR Conclusions Abundant Decadal Variability in Ocean and Atmosphere and
Transformational Climate Science. The future of climate change research following the IPCC Fifth Assessment Report
 Transformational Climate Science The future of climate change research following the IPCC Fifth Assessment Report www.exeter.ac.uk/climate2014 Working Group I The challenge of climate change #climate2014
Rapid Climate Change: Heinrich/Bolling- Allerod Events and the Thermohaline Circulation. By: Andy Lesage April 13, 2010 Atmos.
 Rapid Climate Change: Heinrich/Bolling- Allerod Events and the Thermohaline Circulation By: Andy Lesage April 13, 2010 Atmos. 6030 Outline Background Heinrich Event I/Bolling-Allerod Transition (Liu et
Clara Deser*, James W. Hurrell and Adam S. Phillips. Climate and Global Dynamics Division. National Center for Atmospheric Research
 1 2 Supplemental Material 3 4 5 The Role of the North Atlantic Oscillation in European Climate Projections 6 7 Clara Deser*, James W. Hurrell and Adam S. Phillips 8 9 10 11 Climate and Global Dynamics
Regional Ocean Climate Model Projections for the British Columbia Continental Shelf
 Regional Ocean Climate Model Projections for the British Columbia Continental Shelf Mike Foreman, Wendy Callendar, John Morrison, Diane Masson, Isaac Fine Institute of Ocean Sciences Fisheries and Oceans
CMIP3/CMIP5 differences: Scenario (SRESA1B vs RCP4.5) Ensemble mean Tas responses: CMIP3 = 2.8 K CMIP5 = 1.9 K CMIP5 higher average resolution
 Ensemble mean Tas responses: CMIP3 = 2.8 K CMIP5 = 1.9 K CMIP5 higher average resolution") CMIP3/CMIP5 differences: Scenario (SRESA1B vs RCP4.5) Ensemble mean Tas responses: CMIP3 = 2.8 K CMIP5 = 1.9 K CMIP5 higher average resolution Several `high-top models in CMIP5 Key question What are
CMIP3/CMIP5 differences: Scenario (SRESA1B vs RCP4.5) Ensemble mean Tas responses: CMIP3 = 2.8 K CMIP5 = 1.9 K CMIP5 higher average resolution Several `high-top models in CMIP5 Key question What are
Applying Basin-Scale HyCOM Hindcasts in Providing Open Boundary Conditions for Nested High-Resolution Coastal Circulation Modeling
 Applying Basin-Scale HyCOM Hindcasts in Providing Open Boundary Conditions for Nested High-Resolution Coastal Circulation Modeling Ruoying He Woods Hole Oceanographic Institution December 7, 2005 Cape
SUPPLEMENTARY INFORMATION
 SUPPLEMENTARY INFORMATION DOI: 10.1038/NCLIMATE1857 Figure S1a shows significant inter-annual variability in seasonal SPA data with multi-decadal periods exhibiting positive and negative SPAs. A similar
THE PACIFIC DECADAL OSCILLATION (PDO)
") THE PACIFIC DECADAL OSCILLATION (PDO) The Pacific Decadal Oscillation (PDO) refers to cyclical variations in sea surface temperatures in the Pacific Ocean. A detailed summary of the PDO is given in D Aleo
THE PACIFIC DECADAL OSCILLATION (PDO) The Pacific Decadal Oscillation (PDO) refers to cyclical variations in sea surface temperatures in the Pacific Ocean. A detailed summary of the PDO is given in D Aleo
Recent Variability in Western Boundary Currents on the Atlantic Slope from Moored Measurements and Altimetry
 Fisheries and Oceans Canada Pêches et Océans Canada Canada Recent Variability in Western Boundary Currents on the Atlantic Slope from Moored Measurements and Altimetry John Loder 1, Yuri Geshelin 1, Igor
High-Resolution MPAS Simulations for Analysis of Climate Change Effects on Weather Extremes
 High-Resolution MPAS Simulations for Analysis of Climate Change Effects on Weather Extremes ALLISON MICHAELIS, GARY LACKMANN, & WALT ROBINSON Department of Marine, Earth, and Atmospheric Sciences, North
Some Recent Applications of the Observed Extra-Tropical AMOC Fingerprint. Rong Zhang NOAA/GFDL
 Some Recent Applications of the Observed Extra-Tropical AMOC Fingerprint Rong Zhang NOAA/GFDL 2018 International AMOC Science Meeting Coconut Grove, Florida, July 25, 2018 Introduction Extra-tropical AMOC
Climate sensitivity of coupled models with differing ocean components
 Climate sensitivity of coupled models with differing ocean components Alex Megann, Adam Blaker and Adrian New National Oceanography Centre, Southampton, UK LOM Workshop, Miami, February 2011 Overview Introduction
Link between Hurricanes and Climate Change: SST
 Link between Hurricanes and Climate Change: SST FRIDAY: PROJECT 2 Proposals due! Bring laptops on weds (at least one per group)! Discuss assessment on Weds. Roger Francois will talk on Friday about the
Impacts of Long-term Climate Cycles on Alberta. A Summary. by Suzan Lapp and Stefan Kienzle
 Impacts of Long-term Climate Cycles on Alberta A Summary by Suzan Lapp and Stefan Kienzle Large Scale Climate Drivers The Pacific Decadal Oscillation (PDO) [Mantua et al., 1997] is the dominant mode of
Antarctic sea-ice expansion between 2000 and 2014 driven by tropical Pacific decadal climate variability
 Antarctic sea-ice expansion between 2000 and 2014 driven by tropical Pacific decadal climate variability Gerald A. Meehl 1, Julie M. Arblaster 1,2, Cecilia M. Bitz 3, Christine T.Y. Chung 4, and Haiyan
The Texas drought. Kingtse Mo Climate Prediction Center NWS/NCEP/NOAA
 The 2011-2012 Texas drought Kingtse Mo Climate Prediction Center NWS/NCEP/NOAA 1 outline Evolution of the 2011-2012 Texas drought Climatology and historical perspective The 2011 drought Onset Feedback
SIO 210 Final Exam December 10, :30 2:30 NTV 330 No books, no notes. Calculators can be used.
 SIO 210 Final Exam December 10, 2003 11:30 2:30 NTV 330 No books, no notes. Calculators can be used. There are three sections to the exam: multiple choice, short answer, and long problems. Points are given
Jennifer Francis Institute of Marine and Coastal Sciences Rutgers University In collaboration with Steve Vavrus, U. of Wisconsin
 Jennifer Francis Institute of Marine and Coastal Sciences Rutgers University In collaboration with Steve Vavrus, U. of Wisconsin Arctic Linkages Workshop National Academies of Sciences 12-13 September
Multi-decadal simulation of Atlantic Ocean climate variability driven by realistic high-frequency atmospheric reanalysis
 Multi-decadal simulation of Atlantic Ocean climate variability driven by realistic high-frequency atmospheric reanalysis Z. Garraffo, G.Halliwell, L. Smith, G. Peng, E. Chassignet Discussions with B. Molinari,
1. The figure shows sea surface height (SSH) anomaly at 24 S (southern hemisphere), from a satellite altimeter.
 anomaly at 24 S (southern hemisphere), from a satellite altimeter.") SIO 210 Problem Set 3 November 16, 2015 1. The figure shows sea surface height (SSH) anomaly at 24 S (southern hemisphere), from a satellite altimeter. (a) What is the name of this type of data display?_hovmöller
SIO 210 Problem Set 3 November 16, 2015 1. The figure shows sea surface height (SSH) anomaly at 24 S (southern hemisphere), from a satellite altimeter. (a) What is the name of this type of data display?_hovmöller
Ocean mesoscale, surface heat fluxes and surface convergence
 NSF/NCAR DOE BER SCIDAC NASA Vector winds NASA Physical Oceanography Ocean mesoscale, surface heat fluxes and surface convergence Justin Small Frank Bryan, Stu Bishop, Bob Tomas Larry O Neill Thanks to
1.Decadal prediction ( ) 2. Longer term (to 2100 and beyond)
 2. Longer term (to 2100 and beyond)") Coordinated climate change experiments (formulated by WGCM and AIMES) to be run for assessment in IPCC AR5 Two classes of models to address two time frames and two sets of science questions: 1.Decadal
Coordinated climate change experiments (formulated by WGCM and AIMES) to be run for assessment in IPCC AR5 Two classes of models to address two time frames and two sets of science questions: 1.Decadal
11/24/09 OCN/ATM/ESS The Pacific Decadal Oscillation. What is the PDO? Causes of PDO Skepticism Other variability associated with PDO
 11/24/09 OCN/ATM/ESS 587.. The Pacific Decadal Oscillation What is the PDO? Causes of PDO Skepticism Other variability associated with PDO The Pacific Decadal Oscillation (PDO). (+) ( ) EOF 1 of SST (+)
SUPPLEMENTARY INFORMATION
 SUPPLEMENTARY INFORMATION doi:10.1038/nature11784 Methods The ECHO-G model and simulations The ECHO-G model 29 consists of the 19-level ECHAM4 atmospheric model and 20-level HOPE-G ocean circulation model.
A Synthesis of Results from the Norwegian ESSAS (N-ESSAS) Project
 Project") A Synthesis of Results from the Norwegian ESSAS (N-ESSAS) Project Ken Drinkwater Institute of Marine Research Bergen, Norway ken.drinkwater@imr.no ESSAS has several formally recognized national research
A Synthesis of Results from the Norwegian ESSAS (N-ESSAS) Project Ken Drinkwater Institute of Marine Research Bergen, Norway ken.drinkwater@imr.no ESSAS has several formally recognized national research
Lecture 1. Amplitude of the seasonal cycle in temperature
 Lecture 6 Lecture 1 Ocean circulation Forcing and large-scale features Amplitude of the seasonal cycle in temperature 1 Atmosphere and ocean heat transport Trenberth and Caron (2001) False-colour satellite
Different impacts of Northern, Tropical and Southern volcanic eruptions on the tropical Pacific SST in the last millennium
 Different impacts of Northern, Tropical and Southern volcanic eruptions on the tropical Pacific SST in the last millennium Meng Zuo, Wenmin Man, Tianjun Zhou Email: zuomeng@lasg.iap.ac.cn Sixth WMO International
Tropical Pacific responses to Neogene Andean uplift and highlatitude. Ran Feng and Chris Poulsen University of Michigan
 Tropical Pacific responses to Neogene Andean uplift and highlatitude sea ice expansion Ran Feng and Chris Poulsen University of Michigan Reconstructions of Neogene equatorial Pacific SSTs SST difference
Sensitivity Analysis of Sea Level Rise Simulation To the Ocean Open Boundary Specification Using the 2017 CH3D-ICM
 Sensitivity Analysis of Sea Level Rise Simulation To the Ocean Open Boundary Specification Using the 2017 CH3D-ICM STAC WQSTM Peer Review July 7, 2017 Lew Linker, Ping Wang, Richard Tian, and the CBPO
Assessing how North Atlantic ocean overturning has varied over the last 50 years
 Assessing how North Atlantic ocean overturning has varied over the last 50 years Vassil Roussenov 1, Ric Williams 1, M. Susan Lozier 2 and Doug Smith 3 1. School of Environmental Sciences, University of
Atmospheric linkages between the Arctic and mid-latitudes
 Atmospheric linkages between the Arctic and mid-latitudes Timo Vihma Finnish Meteorological Institute The University Centre in Svalbard Thanks to James Overland, Jennifer Francis, Klaus Dethloff, James
Climate. Annual Temperature (Last 30 Years) January Temperature. July Temperature. Average Precipitation (Last 30 Years)
 January Temperature. July Temperature. Average Precipitation (Last 30 Years)") Climate Annual Temperature (Last 30 Years) Average Annual High Temp. (F)70, (C)21 Average Annual Low Temp. (F)43, (C)6 January Temperature Average January High Temp. (F)48, (C)9 Average January Low Temp.
Climate Annual Temperature (Last 30 Years) Average Annual High Temp. (F)70, (C)21 Average Annual Low Temp. (F)43, (C)6 January Temperature Average January High Temp. (F)48, (C)9 Average January Low Temp.
Ocean cycles and climate ENSO, PDO, AMO, AO
 Ocean cycles and climate ENSO, PDO, AMO, AO 3 2.5 2 enso-index 1.5 1 0.5 0-0.5-1 enso 3.4 -index - 1996 to 1999-1.5 1996 1997 1998 1999 Bob Tisdale Bob Tisdale Bob Tisdale ENSO mechanisms animation http://esminfo.prenhall.com/science/geoanimations/animations/26_ninonina.html
lecture 11 El Niño/Southern Oscillation (ENSO) Part II
 Part II") lecture 11 El Niño/Southern Oscillation (ENSO) Part II SYSTEM MEMORY: OCEANIC WAVE PROPAGATION ASYMMETRY BETWEEN THE ATMOSPHERE AND OCEAN The atmosphere and ocean are not symmetrical in their responses
lecture 11 El Niño/Southern Oscillation (ENSO) Part II SYSTEM MEMORY: OCEANIC WAVE PROPAGATION ASYMMETRY BETWEEN THE ATMOSPHERE AND OCEAN The atmosphere and ocean are not symmetrical in their responses
Danish Meteorological Institute Scientific Report 15-05
 Danish Meteorological Institute Figure 6.2: Monthly temperature fields used to drive the spinup run. temperature data [Bindschadler et al., 2013] to drive PISM. This spinup run through the past glacial
MODELING EAST ASIAN SUMMER MONSOON IN 1998 WITH A COUPLED REGIONAL AIR-SEA MODEL. Xuejuan Ren
 INYS 2008 MODELING EAST ASIAN SUMMER MONSOON IN 1998 WITH A COUPLED REGIONAL AIR-SEA MODEL Xuejuan Ren Yaocun Zhang, Yongfu Qian, Huijuan Lin Department of Atmospheric Sciences, Nanjing University, Nanjing,
Ocean Currents and Climate
 Ocean Currents and Climate Ocean water contains streamlike movements of water called ocean currents. Currents are influenced by a number of factors, including weather, the Earth's rotation, and the position
WP 4 Testing Arctic sea ice predictability in NorESM
 WP 4 Testing Arctic sea ice predictability in NorESM Jens Boldingh Debernard SSPARSE Kick-off meeting 08.11.2016 Norwegian Meteorological Institute Background Inherent coupled problem Time-frame relevant
Causes of Changes in Arctic Sea Ice
 Causes of Changes in Arctic Sea Ice Wieslaw Maslowski Naval Postgraduate School Outline 1. Rationale 2. Observational background 3. Modeling insights on Arctic change Pacific / Atlantic Water inflow 4.
Challenges for Climate Science in the Arctic. Ralf Döscher Rossby Centre, SMHI, Sweden
 Challenges for Climate Science in the Arctic Ralf Döscher Rossby Centre, SMHI, Sweden The Arctic is changing 1) Why is Arctic sea ice disappearing so rapidly? 2) What are the local and remote consequences?
ENSO Outlook by JMA. Hiroyuki Sugimoto. El Niño Monitoring and Prediction Group Climate Prediction Division Japan Meteorological Agency
 ENSO Outlook by JMA Hiroyuki Sugimoto El Niño Monitoring and Prediction Group Climate Prediction Division Outline 1. ENSO impacts on the climate 2. Current Conditions 3. Prediction by JMA/MRI-CGCM 4. Summary
Weather & Ocean Currents
 Weather & Ocean Currents Earth is heated unevenly Causes: Earth is round Earth is tilted on an axis Earth s orbit is eliptical Effects: Convection = vertical circular currents caused by temperature differences
Temperature extremes in the United States: Quantifying the response to aerosols and greenhouse gases with implications for the warming hole
 Temperature extremes in the United States: Quantifying the response to aerosols and greenhouse gases with implications for the warming hole Nora Mascioli, Arlene Fiore, Michael Previdi, Gustavo Correa
NATIONAL OCEANOGRAPHY CENTRE, SOUTHAMPTON. RESEARCH & CONSULTANCY REPORT No. 1
 NATIONAL OCEANOGRAPHY CENTRE, SOUTHAMPTON RESEARCH & CONSULTANCY REPORT No. The impact of surface flux anomalies on the mid-high latitude Atlantic Ocean circulation in HadCM3 J P Grist, S A Josey & B Sinha
Ocean carbon cycle feedbacks in the tropics from CMIP5 models
 WWW.BJERKNES.UIB.NO Ocean carbon cycle feedbacks in the tropics from CMIP5 models Jerry Tjiputra 1, K. Lindsay 2, J. Orr 3, J. Segschneider 4, I. Totterdell 5, and C. Heinze 1 1 Bjerknes Centre for Climate
The Two Types of ENSO in CMIP5 Models
 1 2 3 The Two Types of ENSO in CMIP5 Models 4 5 6 7 8 9 10 11 12 13 14 15 16 17 18 19 20 21 22 23 24 25 26 27 28 29 30 31 32 33 34 35 36 37 38 39 40 Seon Tae Kim and Jin-Yi Yu * Department of Earth System
C
 C 0.8 0.4 0.2 0.0-0.2-0.6 Fig. 1. SST-wind relation in the North Pacific and Atlantic Oceans. Left panel: COADS SST (color shade), surface wind vectors, and SLP regressed upon the Pacific Decadal Oscillation
! An Update on CAM-CLUBB Coupled Simulations
 ! An Update on CAM- Coupled Simulations! Peter Bogenschutz, Andrew Gettelman, Vincent Larson, Cheryl Craig, Hugh Morrison, Jack Chen, Katherine Thayer- Calder, Sean Santos, David Schannen, and Rachel Storer
THE RELATION AMONG SEA ICE, SURFACE TEMPERATURE, AND ATMOSPHERIC CIRCULATION IN SIMULATIONS OF FUTURE CLIMATE
 THE RELATION AMONG SEA ICE, SURFACE TEMPERATURE, AND ATMOSPHERIC CIRCULATION IN SIMULATIONS OF FUTURE CLIMATE Bitz, C. M., Polar Science Center, University of Washington, U.S.A. Introduction Observations
A Decadal Prediction Case Study: Late 20 th century N. Atlantic Ocean heat content
 A Decadal Prediction Case Study: Late 20 th century N. Atlantic Ocean heat content Steve Yeager, Alicia Karspeck, Gokhan Danabasoglu, Joe Tribbia, Haiyan Teng NCAR, Boulder, CO Yeager et al., 2012, J.
Climate model simulations of the observed early-2000s hiatus of global warming
 Climate model simulations of the observed early-2000s hiatus of global warming Gerald A. Meehl 1, Haiyan Teng 1, and Julie M. Arblaster 1,2 1. National Center for Atmospheric Research, Boulder, CO 2. CAWCR,
Increasing frequency of extremely severe cyclonic storms over the Arabian Sea
 SUPPLEMENTARY INFORMATION Letters https://doi.org/10.1038/s41558-017-0008-6 In the format provided by the authors and unedited. Increasing frequency of extremely severe cyclonic storms over the Arabian
M. Ballarotta 1, L. Brodeau 1, J. Brandefelt 2, P. Lundberg 1, and K. Döös 1. This supplementary part includes the Figures S1 to S16 and Table S1.
 Supplementary Information: Last Glacial Maximum World-Ocean simulations at eddy-permitting and coarse resolutions: Do eddies contribute to a better consistency between models and paleo-proxies? M. Ballarotta
Upper Ocean Circulation
 Upper Ocean Circulation C. Chen General Physical Oceanography MAR 555 School for Marine Sciences and Technology Umass-Dartmouth 1 MAR555 Lecture 4: The Upper Oceanic Circulation The Oceanic Circulation
Evolution of the global coupled climate response to Arctic sea ice loss. during and its contribution to climate change
 1 2 Evolution of the global coupled climate response to Arctic sea ice loss during 1990-2090 and its contribution to climate change 3 4 5 6 7 8 9 10 11 Lantao Sun* Cooperative Institute for Research in
North Pacific Climate Overview N. Bond (UW/JISAO), J. Overland (NOAA/PMEL) Contact: Last updated: September 2008
, J. Overland (NOAA/PMEL) Contact: Last updated: September 2008") North Pacific Climate Overview N. Bond (UW/JISAO), J. Overland (NOAA/PMEL) Contact: Nicholas.Bond@noaa.gov Last updated: September 2008 Summary. The North Pacific atmosphere-ocean system from fall 2007
North Pacific Climate Overview N. Bond (UW/JISAO), J. Overland (NOAA/PMEL) Contact: Nicholas.Bond@noaa.gov Last updated: September 2008 Summary. The North Pacific atmosphere-ocean system from fall 2007
North Pacific Climate Overview N. Bond (UW/JISAO), J. Overland (NOAA/PMEL) Contact: Last updated: August 2009
, J. Overland (NOAA/PMEL) Contact: Last updated: August 2009") North Pacific Climate Overview N. Bond (UW/JISAO), J. Overland (NOAA/PMEL) Contact: Nicholas.Bond@noaa.gov Last updated: August 2009 Summary. The North Pacific atmosphere-ocean system from fall 2008 through
North Pacific Climate Overview N. Bond (UW/JISAO), J. Overland (NOAA/PMEL) Contact: Nicholas.Bond@noaa.gov Last updated: August 2009 Summary. The North Pacific atmosphere-ocean system from fall 2008 through
ENSO Cycle: Recent Evolution, Current Status and Predictions. Update prepared by Climate Prediction Center / NCEP 25 February 2013
 ENSO Cycle: Recent Evolution, Current Status and Predictions Update prepared by Climate Prediction Center / NCEP 25 February 2013 Outline Overview Recent Evolution and Current Conditions Oceanic Niño Index
Advancements and Limitations in Understanding and Predicting Arctic Climate Change
 Advancements and Limitations in Understanding and Predicting Arctic Climate Change Wieslaw Maslowski Naval Postgraduate School Collaborators: Jaclyn Clement Kinney, Rose Tseng, Timothy McGeehan - NPS Jaromir
The Oceanic Component of CFSR
 1 The Oceanic Component of CFSR Yan Xue 1, David Behringer 2, Boyin Huang 1,Caihong Wen 1,Arun Kumar 1 1 Climate Prediction Center, NCEP/NOAA, 2 Environmental Modeling Center, NCEP/NOAA, The 34 th Annual
L.O Students will learn about factors that influences the environment
 Name L.O Students will learn about factors that influences the environment Date 1. At the present time, glaciers occur mostly in areas of A) high latitude or high altitude B) low latitude or low altitude
Global Atmospheric Circulation
 Global Atmospheric Circulation Polar Climatology & Climate Variability Lecture 11 Nov. 22, 2010 Global Atmospheric Circulation Global Atmospheric Circulation Global Atmospheric Circulation The Polar Vortex
SIO 210 Final examination Wednesday, December 12, :30-2:30 Eckart 227 Name:
 SIO 210 Final examination Wednesday, December 12, 2018 11:30-2:30 Eckart 227 Name: Please put your initials or name on each page, especially if you pull pages apart. Turn off all phones, ipods, etc. and
Recent warming and changes of circulation in the North Atlantic - simulated with eddy-permitting & eddy-resolving models
 Recent warming and changes of circulation in the North Atlantic - simulated with eddy-permitting & eddy-resolving models Robert Marsh, Beverly de Cuevas, Andrew Coward & Simon Josey (+ contributions by
Hydrography and biological resources in the western Bering Sea. Gennady V. Khen, Eugeny O. Basyuk. Pacific Research Fisheries Centre (TINRO-Centre)
") Hydrography and biological resources in the western Bering Sea Gennady V. Khen, Eugeny O. Basyuk Pacific Research Fisheries Centre (TINRO-Centre) Bering Sea: deep-sea basin, shelf, and US-Russia convention
Hydrography and biological resources in the western Bering Sea Gennady V. Khen, Eugeny O. Basyuk Pacific Research Fisheries Centre (TINRO-Centre) Bering Sea: deep-sea basin, shelf, and US-Russia convention
SPECIAL PROJECT PROGRESS REPORT
 SPECIAL PROJECT PROGRESS REPORT Progress Reports should be 2 to 10 pages in length, depending on importance of the project. All the following mandatory information needs to be provided. Reporting year