doi: /j.jenvrad
|
|
|
- Ambrose Weaver
- 6 years ago
- Views:
Transcription
1 This Accepted Author Manuscript (AAM) is copyrighted and published by Elsevier. It is posted here by agreement between Elsevier and the University of Turin. Changes resulting from the publishing process - such as editing, corrections, structural formatting, and other quality control mechanisms - may not be reflected in this version of the text. The definitive version of the text was subsequently published as Laiolo M., Cigolini C., Coppola D., Piscopo D. (2012). Developments in real-time radon monitoring at Stromboli volcano. JOURNAL OF ENVIRONMENTAL RADIOACTIVITY, vol. 105, p , ISSN: X You may download, copy and otherwise use the AAM for non-commercial purposes provided that your license is limited by the following restrictions: (1) You may use this AAM for non-commercial purposes only under the terms of the CC-BY-NC-ND license. (2) The integrity of the work and identification of the author, copyright owner, and publisher must be preserved in any copy. (3) You must attribute this AAM in the following format: Creative Commons BY-NC-ND license ( [+ Digital Object Identifier published journal article on Elsevier s ScienceDirect platform] doi: /j.jenvrad
2 Developments in real-time radon monitoring at Stromboli volcano Laiolo M. 1, Cigolini C. 1,2, Coppola D. 1 & Piscopo D. 1 1 Dipartimento di Scienze Mineralogiche e Petrologiche, Università di Torino, Via Valperga Caluso 35, Torino 2 - Centro Interdipartimentale sui Rischi Naturali ( NatRisk ) ABSTRACT We present the results of one year of continuous radon monitoring at Stromboli volcano collected at two automated real-time stations. These were deployed on the NE flank (at 520 m a.s.l.) and within the summit area (900 m a.s.l.). Higher daily emissions at the lower station approached 4,200 Bq/m 3, with bulk averages around 1,800 (±980) Bq/m 3 ; whereas the summit station reached peak values of 23,000 Bq/m 3 and bulk averages of 12,500 Bq/m 3 ( ±4,000). Negative correlations are observed between radon emissions, soil temperature and, to a lesser extent, atmospheric pressure. In contrast, an increases in radon concentrations were observed during periods of higher rainfall conditions. Therefore, trends in radon concentrations may be decoupled from those of other geochemical parameters (CO 2 fluxes and CO 2 /SO 2 plume ratios) during periods of heavy to moderate rainfalls. Multiple Linear Regression statistics (including the effects of soil temperature, atmospheric pressure and tidal forces) led us to compute the residuals given by the difference of measured and calculated 222 Rn concentrations. The cross-check between the daily measured radon activities and the absolute variations in radon residuals, for the data collected at the summit station, give us the opportunity to suggest a methodological approach that can be used in the attempt of predicting some major changes in volcanic activity. Introduction It is generally accepted that decoding anomalous radon emissions, together with those of other geochemical and geophysical parameters, may better assess volcanic alert procedures and eruption and earthquake forecasting. Radon is an alpha emitting radioactive gas produced from the decay of 1
3 uranium and thorium bearing rocks, soils and magmas. It plays a crucial role in the outgassing process of the earth and its spatial and temporal variations have been regarded as precursors of earthquakes and volcanic eruptions. Earth scientists use the isotope 222 Rn (with a half life of 3.82 days) as a geochemical tracer, since its anomalies have been observed before, during and after the onset of regional seismic events (e.g., Scholtz et al., 1973; Fleischer and Mogro-Campero, 1985; Igarashi et al., 1995; Planicić et al., 2004; Pulinets et al., 2009; Cigolini, 2010). These issues have been challenged by Wyss (1991; 1997) and Wakita (1996) who discuss the limits identifying earthquake precursors solely based on radon monitoring. Moreover, variations in radon emissions have been associated with changes in volcanic activity and volcanically-related earthquakes (Cox, 1980; Thomas et al., 1986). At Somma-Vesuvius (Italy), Cigolini et al. (2001) used a network for radon monitoring to discriminate radon anomalies related to regional earthquakes from those associated to local volcanic seismicity. In addition, Burton et al. (2004) inferred, on the basis of radon measurements, the geometry of a hidden fault during the seismic crises of October, 2002 at Mount Etna. More recently, Cigolini et al. (2007) were able to detect earthquake-volcano interactions at Stromboli in terms of a time-delay of radon anomalies in respect to the onset of major seismic events within the southern Tyrrhenian region. High radon emissions across active faults have the capability of generating ionization of the nearground layer of the atmosphere since its decay products may become clusters for water condensation and local temperature anomalies (due to the release of the latent heat from evaporation), eventually leading to thermal anomalies that may precede earthquakes (Ouzounov and Freund, 2004; Pulinets et al., 2009). However, radon anomalies have also been regarded as precursors to volcanic eruptions (e.g., Chirkov, 1975; Connors et al., 1996; Alparone et al., 2005; Cigolini et al., 2005; Neri et al., 2006; Giammanco et. Al., 2007). Su and Huh (2002) recorded increased contents of 210 Po (a daughter product of 222 Rn) deposited by the plume of Mayon volcano prior to its last eruption. 2
4 Diffuse and concentrated degassing in volcanic areas may release high amount of gas and its monitoring can be helpful in volcano surveillance (e.g., Allard et al., 1991; Viveiros et al., 2008). In recent years this approach has been undertaken at several volcanoes (Varley et al., 2001; Carapezza et al., 2004; Williams-Jones et al., 2000; Hernandez et al., 2004; Neri et al., 2006). Radon transport towards the surface occurs preferentially along faults or cracks of the substrate, and it is controlled by the physical properties of the underlying rocks (e.g. porosity and permeability). Radon can migrate throughout soil pores not only by gas-phase diffusion but also by convection and advection. According to Gauthier et al. (1999), in volcanic areas, the radon gas is essentially carried by water and carbon dioxide. Environmental parameters are critical in modulating radon emissions (e.g., Mogro-Campero and Fleischer, 1977; Pinault and Baurbon, 1996; Pérez et al., 2007; among others). In particular, Zimmer and Erzinger (2003) found a positive correlation between radon concentrations, atmospheric pressure and water contents during their monitoring of high temperature fumaroles at Merapi Volcano. Moreover, the effects of environmental parameters on volcano degassing led Viveiros et al. (2008) and Carapezza et al. (2009) to analyze CO 2 fluxes by taking into account the effects of environmental parameters on the CO 2 signals. However, radon concentrations can be diluted by major fluxes of CO 2 and vapor water (e.g., Giammanco et al., 2007; 2009; Siniscalchi et al., 2010). The use of automatic alpha particles detectors allow us to better decode the interplay among seismic signals and others geochemical parameters that may precede the onset of volcanic eruptions (Ripepe et al., 2005; Allard et al., 2008). Real-time radon measurements strategically increase the potential role of radon in volcano monitoring since the data are automatically transferred and previously elaborated, filtering the effects of environmental parameters on radon degassing (Cigolini et al., 2009). Thus, systematic time series analysis and signal processing give us the opportunity to better track degassing at active volcanoes and substantially contribute to refine surveillance strategies and alert procedures. 3
5 However, the applications of these methods could also be easily applied in monitoring the relationships between radon and seismicity in tectonically active areas. In this framework, we analyze the radon signals by means of Multiple Linear Regression analysis, in the light of environmental parameters (soil temperature and atmospheric pressure) and tidal forces, that may be used to identify a correlation between radon emissions and other key geochemical parameters. We finally discuss how our methodological approach and our results may contribute to improve geochemical monitoring and, consequently, volcano surveillance. Stromboli Volcano Stromboli is an active stratovolcano located in the southern Tyrrhenian region, the north-eastern island of the Aeolian arc (Fig. 1). The volcano rises 924 m above sea level but the base of the cone reaches a depth of about 2,000 m below sea level. The volcanic edifice has grown on a NE strikeslip fault known as the Stromboli-Panarea alignment. This structure is connected to the NNW trending Tindari-Letojanni faulting system: a major structure that propagates though Eastern Sicily to the Ionian sea (e.g., De Astis et al., 2003; Acocella et al., 2009). Stromboli volcano shows a rather unique and persistent open-system activity with moderate eruptions of ash, lapilli, scoriae and bombs from summit vents (e.g., Rosi et al., 2000). This mild and persistent activity may be associated with major explosions with ejection of blocks and bombs that affect the summit area and the surrounding sectors. The onset of a major eruptive period occurs with lava effusions eventually leading to high risk paroxysmal explosions. These are characterized by the projection of ash, pumices, bombs and blocks of several tonnes that may reach the villages of Stromboli and Ginostra (e.g., Barberi et al., 1993). The onset and the evolution of the major eruptive period of further attracted the scientific interest on this volcano. Lava effusion from the summit vents started on December 28, 2002 and was followed, on December 30, 2002, by a composite slump down the Sciara del Fuoco (a horse-shoe shaped scarp open northeast inherited from a multiple flank collapse, see Tibaldi et al. 4
6 (2009) and references therein), triggering a tsunamis that damaged parts of the Stromboli village and reached the coasts of Sicily and Calabria. In the following days the lava effusion continued, summit vents were dismissed and the typical strombolian activity temporarily ceased until the end of July Lava outflow was accompanied, on April 5, 2003, by the onset of a paroxysmal explosion with the ejection ash, abundant pumices bombs and lithic blocks (Bonaccorso et al., 2003; Ripepe et al., 2005; Calvari et al., 2005). The geochemical anomalies that preceded these two eruptive events were discussed by Carapezza et al. (2004) and Cigolini et al (2005). The relationships among geophysical signals (VLP events basically related to the Stromboli explosive activity), thermal anomalies and SO 2 plume degassing were discussed by Ripepe et al. (2005). The most recent effusive event, that replaced the mild strombolian activity, started on February 27, 2007 and persisted until April 2, A new and violent paroxysmal explosion occurred on March 15, with the ejection of ash, pumices bombs and projectiles that damaged two houses in the village of Ginostra. The explosion was preceded by a marked increase in volcanic seismicity accompanied and followed by a progressive vertical collapse of the crater area (Barberi et al., 2008; Neri and Lanzafame, 2008). A transitional phase, characterized by moderate seismic and infrasonic activity (and absence of explosions at the summit vents) persisted until the end of June-beginning of July, 2007 when the mild strombolian activity finally resumed. Geochemical data on precursory signals for this eruption were provided by Rizzo et al. (2009) and Aiuppa et al. (2009). Currently activity is typically strombolian but major explosions (intermediate between paroxysmal explosions and the typical mild explosive activity) have been more frequent when compared to the earlier and recent eruptive history. Current scientific goals are thus focused in decoding the precursory signals associated with onset of these explosive events that may threaten the life of hikers and scientists occasionally exposed in the summit area. During our monitoring (May May 2009), Stromboli was essentially characterized by its typical Strombolian activity, and a total of 3 major explosions explosions stronger then the ordinary activity with an overpressure at the vents > 2 bar (measured according to the methods of Ripepe et 5
7 al., 2007). A minor lava overflow from the summit crater occurred on March 29, The mild strombolian activity substantially increased during March-May 2009, with a marked increase in the explosive rate at the summit vents. Radon measurements and techniques Earlier radon measurements, starting May 2002, were performed by track-etch detectors (LR115, finely calibrated according to Bonetti et al. (1991) and E-PERM electretes (Kotrappa et al., 1993) at 25 selected sites located on the major structural features of the volcano. Detectors were placed in pipe-like samplers (1.20 m long with a diameter of 12 cm) inserted into soil at an approximate depth of about 60 cm. Repeated periodic surveys in the following years allowed us to identify the sites of more efficient degassing. Two of these sites were chosen to install real-time radon stations. The first one, named Liscione (LSC in Fig. 1a, a locality in northeastern sector at 520 m a.s.l.), is located between the N40 E and N60 E fracture zones (the main structural alignments of the island). The station lays on top of a m deposit consisting of fine to coarse ash that covers the Cannestrà lava flow (Fig. 1a) that was erupted from a N40 E fracture 13-6 ky before present (Gillot & Keller, 1993; Keller et al., 1993; Finizola et al., 2002; Tibaldi, 2001; Tibaldi et al., 2009). The second station, named Pizzo (PZZ in Fig. 1 at 900 m of altitude a.s.l.) is located in the summit area above the N40 E fracture zone parallel to craters alignment, at a distance of about 150 m from the active fumaroles (Fig. 1b). In addition, several automated stations were periodically deployed at selected sites where data could be seasonally downloaded by means of a portable PC. The assemblage and set ups for real time stations were presented in an earlier paper (Cigolini et al., 2009); here we will briefly recall the main features and then focus our attention on spectral signatures and real-time measurements. A single station for real-time measurements consisted of an electronic radon detector (DOSEman made by Sarad GmbH, Dresden, Germany) integrated by an electronic board that transfered the 6
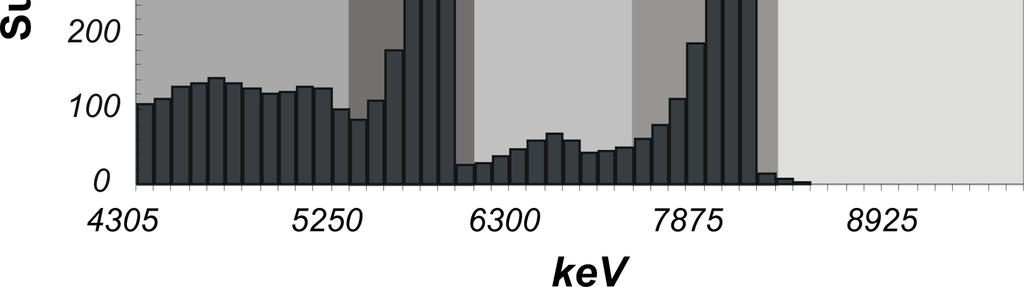
8 output signal to a radio modem. These units were assembled and stored in a in a polycarbonate case (permeable to radon) positioned within a PVC box (open downward). This box was inserted into the soil down to a depth of ~1 m. The space inside the box was occupied by free soil air and the gas flux into the atmosphere was promoted by a tube positioned at the top of the box. The tube was interconnected with a cylindrical expansion reservoir that attenuated the effects of atmospheric perturbations. Collected data were sent, through a directional antenna, to a receiving station at the volcano observatory. The sampling time for radon measurements and acquisition of environmental parameters (site soil temperature and atmospheric pressure) was set at 15 minutes. Data were systematically trasferred, processed and visualized as a time series that could be easily checked via web. Streil et al. (2002) and Gründel and Postendörfer (2003) reported the technical features of the electronic radon dosimeter. In DOSEman, radon diffuses passively through a leather membrane into a measurement chamber (cylindrical in shape and 12 cm 3 in volume) where the charged particles concentrate onto a Si-doped semiconductor detector and are counted by means of an automated alpha spectrometer. Detected particles decays are stored and processed by means of a multichannel analyzer that splits the counts into energetic domains or Regions of Interest (ROIs), and generates the spectrum of the radon gas. The sensitivity of the instrument is between 10 Bq/m 3 to 4 millions of Bq/m 3. The DOSEman detects alpha-particle decays within an energy window between 4500 and kev that includes the peaks of 222 Rn itself plus the peaks of the daughter products ( 218 Po and 214 Po; at 6200 and 8000 kev, respectively) as well as the energy interval represented by 220 Rn (thoron, due to the decay of the 232 Th chain) and 212 Po. The total decays measured for each radionuclides are automatically processed by an internal multichannel analyzer and the counts are arranged in five adjusted ROIs (regions of interest) (Gründel and Postendörfer;2003). According to Gründel and Postendörfer (2003; p. 290) the counts for 214 Po need to be corrected, since the higher side of the 220 Rn spectrum overlaps the 214 Po peak. Their calibrations suggest that 7.5 % of the 7
9 counts are ascribed to thoron. Radon concentration is expressed in Bq/m 3 and is computed from the total counts of specific ROIs, acquired during a given sample-time, by introducing an instrumental calibration factor ( C ) related to the volume of the measurement chamber (Gründel and Postendörfer, 2003): f i C [Bq/m i 3 ] = (C /Cts *(1/t ))*1000 (1) fi s where Cts are the counts, t s is the sample time (in minutes) and 1000 is the conversion factor from kbq/m 3 to Bq/m 3. Radon can be computed in fast mode taking into account the counts for 222 Rn and 218 Po (sum of the ROI1 and ROI2 counts), and in slow mode if we include the counts of 214 Po (sum of the ROI1, ROI2 and ROI4 counts) as well. A summary of calibration factors is reported by Gründel and Postendörfer (2003). In our analysis we preferred to use the fast mode option because 214 Po tends to cluster with aerosol particles. In addition, we did not have to take into account thoron interferences on the 214 Po peaks. In Table 1, we present the count values for each ROI as well as the calibration factors used for fast and slow mode at both stations. The average error at radon concentration of 1000 Bq/m 3 was observed to be ± 25%, drastically decreasing at higher emissions (Streil et al., 2002). In Fig. 2 we report the spectral distribution of the different isotopes of the radon progeny detected at the two real-time stations during a year long monitoring, together with the daily counts for each isotope (subdivided into Region of Interest, ROIs) cumulated for the whole year. In general, it can be observed that the counts at the PZZ station were substantially higher, likely due to the fact it was located near the summit fracture within a sector of concentrated degassing. In addition, the overall shape of the left side of both spectra (namely ROI 1) was quite similar in shape, whereas the peaks of 218 Po and 214 Po were definitely sharper at the PZZ station. This may reflect minor differences in the experimental calibration of single detectors. However, it was possible that differences in gas 8
10 ascent rates, as well variations in porosities and permeabilities of the underlying rock-soil units may have affected spectral shapes. However, the uncorrected counts of 220 Rn (obtained by detecting the peak of the daughter isotope 216 Po) were considerably lower than those of the other short-lived isotopes. One year of real-time radon monitoring The time series for daily averages in radon concentrations at the LSC and PZZ stations from May 1, 2008 to May 31, 2009 are reported in Fig. 3 and Fig. 4, together with those of soil temperatures and atmospheric pressure. The time series for the data collected at the LSC station (Fig. 3) showed that higher daily emissions approached 4200 Bq/m 3, whereas the average, calculated on the entire dataset, was 1800 Bq/m 3 (±980) (see Table 2). It can be observed that the relative maximum in the activity of radon was reached in the second half of November Although there was an overall similarity with the LSC trend, daily average concentrations recorded at PZZ were considerably higher and reached Bq/m 3 during the end of November 2008 (Fig. 4). In this case, the average concentration was Bq/m 3 ( ±4000). The time series for soil temperatures at the LSC station basically reflected seasonal variations, these also affected the yearly trend at the PZZ station but this time series was also affected by the higher local temperature gradient since the detector was placed at about 150 m from the active fumaroles of the summit. Therefore fluctuations in this parameter at PZZ were more evident with a more discontinuous trendthe trend was more discontinuous. However, a cross-correlation between temperature and radon emissions showed a negative correlation for both measurement sites, and the PZZ station exhibited a higher correlation (Fig. 5 and Table 2). In general, the trend for radon activity showed that radon was higher during the fall and winter and it substantially decreased during late spring and summer (with relative minima recorded during June-August 2008). This is consistent with the observations of Mogro- Campero and Fleischer (1977) who first ascribed this phenomenon to be the result of the summer time heating of the earth's surface that would cause a seasonal inversion in the near surface 9
11 temperature gradient. This would create a barrier to the upward migration of radon since the efficiency of hydrothermal convection at the surface will be drastically reduced (Cigolini et al., 2001; 2009). The relationship with atmospheric pressure was rather cryptic. In few cases there seemed to be a delay time in the response of radon to variations in atmospheric pressure (increasing and/or decreasing trends, particularly during those months that follow seasonal changes). However, if signals were analyzed strictly in terms of correlation coefficient, we obviously come to the conclusion that there was only a minor negative correlation between the in-soil radon signal and atmospheric pressure (Fig. 3 and 4, Tab. 2). In order to have a more reliable radon signal and following Viveiros et al. (2008), Pérez et al. (2007), Carapezza et al. (2008), a Multiple Linear Regression Analysis was performed on the raw data in order to minimized the effects of environmental parameters (soil temperature and air pressure) and tidal forces. Multiple linear regression analysis was carried out to predict the values of a dependent variable (Y) given a set or predictor variables (x 1, x 2,., x n ). We used the relationship between the dependent variable (Y calc ) and the explanatory variables according to: Y calc = Y 0 + b 1 X 1 + b 2 X b n X n (2) the Y 0 is the intercept, X n the acquired variables and b n the regression coefficients (e.g., Hernandez et al., 2004). Thus, we used the above analysis to find and then remove (to calculate residuals) the contribution of the given environmental parameters that may affect radon concentrations (at both real time stations). In a recent paper (Cigolini et al., 2009), we showed that tidal forces actively modulate radon degassing at Stromboli volcano, supporting the earlier findings of Barnet et al. (1997). Therefore, in analyzing our data we considered the normalized sinusoidal signal constructed from the values of Ephemerids at Stromboli (composed by declination, distance and moon phases). Following this procedure, residuals were obtained by the difference between measured and calculated 222 Rn concentrations (Figs. 6 and 7, respectively). The results give light on the role played by 10
12 environmental parameters in modulating 222 Rn soil concentrations and, consequently, can be used in filtering the radon signal. Radon and other geochemical parameters In order to have a more comprehensive overview for the behavior of radon during Strombolian activity, we compared the radon signal recorded at the summit station with other geochemical and geophysical data. We must recall that during the period of analysis, (May 2008-May 2009) Stromboli was more active in fall/winter, with the ordinary activity punctuated by a summit lava flow (March 29, 2009; indicating the conduit was completely filled with magma) and 3 stronger explosions (December 6 and 17, 2008, and May 3, 2009) with the first explosion being the strongest event recorded since the onset of the last 2 paroxysms (April 5, 2003 and March 15, 2007). The recorded time series were compared with the weekly data for radon concentrations and the cumulative curve for daily rain-falls. This analysis is focussed on the summit stations where all the measured parameters are available (Fig. 8). An increasing trend in gaseous emissions, for radon and CO 2 and to a lesser extent CO 2 /SO 2 ratios, was recorded from early August to September Since then, the cited parameters fluctuated and were partly decoupled until they returned to an increasing trend from the end of November to the end of In particular, anomalous peaks preceded the sequence of the major explosion of December , with vent overpressure of 9 bar. While the trends in CO 2 and CO 2 /SO 2 fluctuate and decreased during the following months, radon is growing until March 2009 and then decreases with other parameters as well. This anomalous radon increase during late winter-early spring seemed to be related to the marked increase in rain waters (see the cumulative curve reported in Fig. 8). This is consistent with the observations of Perrier et al. (2009) who recorded a positive response of radon concentrations (somehow delayed in time) to rainfalls. Moreover, it is well known that higher water contents in soils are capable of increasing the radon emanation factor; at the same time, increase in soil humidity drastically enhances its mobility through the soil pores (Nazaroff et., 1992). However, radon migration may be reduced in moist soil 11
13 because radon is soluble in the pore water, but this will contribute to increase its background concentration at the measurement site. At Stromboli, this process was associated with general decrease in soil temperatures accompanied by a marked increase in radon emissions. In addition, meteoric waters percolating though the fracture network will dilute the carbon-dioxide concentrations, thus momentarily reducing CO2 fluxes through the hydrothermal system of the summit (Finizola et al., 2003). Finally, we attempted to correlate the variations in radon concentrations with two major explosions that occurred during our monitoring. These occurred on December 6, 2008 (with a vent overpressure P ov = 9 bar measured by Laboratorio di Geofisica Sperimentale of the University of Florence, cfr. Ripepe et al., 2007), and May 3, 2009 (P ov = 5.2 bar). The first was the stronger major explosion recorded at Stromboli since the end of Only paroxysmal explosions develop higher overpressures (e.g., Harris and Ripepe, 2007). During our recent monitoring, a minor lava overflow occurred on March 29, 2009, from the NE crater. During mild Strombolian activity, explosions are essentially below 1-2 bar, and only occasionally may reach higher overpressures. We thus emphasize that major explosions are characterized by higher vent overpressure. Therefore, we expect that the most violent major explosions (with P ov >>5 bar) could eventually provide some precursory signals. In all other cases, it would be impossible to detect anomalies since most of major explosions are only somehow higher those occurring during the typical mild activity. In Fig. 9 we report the absolute variations of the daily residuals obtained by Multiple Linear Regression statistics compared with the raw data of radon daily emissions (at the Pizzo station, PZZ) and the onset times for the above events. It must be emphasized that our previous measurements (Cigolini et al., 2005) indicated that prior to the onset of lava effusion (on December 28, 2002) and the paroxysmal explosion of April 5, 2003, some of the summit stations reached values above 20,000 Bq/m 3, respectively 12 and 14 days the above events. Therefore, we have indicated this value as a reference in Fig
14 It can be seen that peak values in daily absolute residuals (drastically higher than 3σ values) were obtained 14 days before the onset of the major explosion of December 6, 2008 (which is the most energetic) and one day before the lava overflow of March 29, In the first case radon concentrations reached peak values of 25,000 Bq/m 3 on November 22, 2008, whereas radon values dropped down to values of ~ 6,000 Bq/m 3 on March 28, 2009, i.e., one day before the lava overflow. We must stress that we are analyzing two distinct volcanic processes (that, in turn, occurred under similar and moderate rainfall conditions, Fig. 8): in the first case radon showed a definite increasing trend due to higher secondary degassing along the fracture zone of the summit area, in the second case the most plausible explanation is that gas release was essentially concentrated within the conduit during the ascent of the degassing magma column; this would explain the drop in radon concentration just before lava effusion (this view is consistent with the relative increase in CO 2 /SO 2 ratios within the plume one week before the overflow, Fig. 8). In terms of absolute residuals, both cases were characterized by marked peak values, suggesting that under critical conditions drastic variations in radon emissions were indicative of changes in the eruption style of the volcano. However, these changes should be carefully evaluated by taking into account other geochemical and geophysical parameters, as well as remote observations by means of optical and thermal cameras on the state of the volcano. Vent overpressure for the major explosion of May 3, 2009 was drastically lower and a precursory radon signal cannot be identified. We also emphasize that peaks in absolute residuals, recorded from January to late February 2009, were accompanied by the extreme variability in soil temperatures, atmospheric pressure and rainfall conditions. Therefore the application of this methodology should be restricted to periods characterized by a moderate variability of environmental parameters. 13
15 Conclusions We have analyzed the radon signals recorded at Stromboli from May 2008 to May 2009 at two real-time stations deployed in sectors of diffuse and concentrated degassing (located onto the NE flank and summit of the volcano, respectively). Radon data together with environmental parameters (soil temperature and atmospheric pressure) were automatically transferred and plotted as time series. We found a general agreement among the trends of radon data and those of other geochemical parameters (CO 2 fluxes and the CO 2 /SO 2 plume ratio) during periods of minor to moderate rainfalls. In addition, we investigated the radon signals together with those associated with the variations of environmental parameters, and found a negative correlation between radon emissions, soil temperature and atmospheric pressure. Multiple Linear Regression analysis (including the effects of tidal forces, e.g., Cigolini et al., 2009) gave us the opportunity to calculate the residuals obtained by the difference between measured and calculated radon concentrations. By considering the time series of absolute variations of the daily radon residuals for the summit station, we suggest a methodological approach that can be used in predicting a violent, a major explosion and/or an overflow during periods characterized by a moderate variability of environmental parameters. In summary, high radon values coupled with high radon daily residuals are indicative of significant changes in Stromboli eruptive style. The application of these methods could be regarded as a reference point in further analyzing the radon signal. Acknowledgments. This research has benefited from funding provided by the Italian Presidenza del Consiglio dei Ministri - Dipartimento della Protezione Civile (DPC). Scientific papers funded by DPC do not represent its official opinion and policies. We thank A. Aiuppa and A. Rizzo for providing additional geochemical data. Thank to P. Poggi and C. Ciamberlini (INOA Firenze) for their technical support on the development of the real-time stations. Thank to G. Ulivieri and D. Delledonne (University of Florence) for help in the processing data. V. Oeser of Sarad Gmbh provided technical advice. M. Neri and two anonymous referees provided helpuful comments to an earlier draft of the paper. 14
16 References Acocella, V., Neri, M., Walter, T.H., Structural features of Panarea volcano in the frame of the Aeolian Arc (Italy): Implications for the unrest. Journal of Geodynamics, 47, Aiuppa, A., Federico, C., Giudice, G., Giuffrida, G., Guida, R., Gurrieri, S., Liuzzo, M., Moretti, R., Papale, P., The 2007 eruption of Stromboli volcano: Insights from real-time measurement of the volcanic gas plume CO2/SO2 ratio. J. Volcanol. Geotherm. Res. 182(3-4): Allard P., Carbonelle J.M., Faivre-Peirret R., Martin D., Sabroux J.C., Zettwoog, P., Eruptive and diffusive emissions of CO2 from Mt. Etna. Nature 351: Allard, P., Aiuppa, A., Burton, M., Caltabiano, T., Federico, C., Salerno, G., La Spina, A., Crater gas emissions and the magma feeding system of Stromboli volcano. In: The Stromboli volcano: an integrated study of the eruption (eds. Calvari S. et al.). AGU Geophysical Monograph Series, 182, Alparone, S., Behncke, B., Giammanco, S., Neri, M., Privitera, E., Paroxysmal summit activity at Mt. Etna (Italy) monitored through continuous soil radon measurement. Geoph. Res. Lett. 2: L16307, doi: /2005gl Barberi, F., Rosi, M., Sodi, A., Volcanic hazard assessment at Stromboli based on review of historical data. Acta Vulcanol. 3:
17 Barberi, F., Civetta, L., Rosi, M., Scandone, R., Chronology of the 2007 eruption of Stromboli and the activity of the Scientific Synthesis Group. J. Volcanol. Geotherm. Res. 182(3-4): Barnet, I., Prochazka, J., Skalsky, L., Do the earth tides have an influence on short-term variations in radon concentration? Rad. Prot. Dosimetry 69: Bonaccorso, A., Calvari, S., Garfi, G., Lodato, L., Patanè, D., Dynamics of the December 2002 flank failure and tsunami at Stromboli volcano inferred by volcanological and geophysical observations. Geoph. Res. Lett. 30 (23): 2214, doi: /2003gl Bonetti, R., Capra, L., Chiesa, C., Guglielmetti, A., Migliorini, C., Energy response of LR115 cellulose nitrate to α-particle beams. Nucl. Rad. Measur. 18: Burton, M., Neri, M., Condarelli, D., High spatial resolution radon measurements reveal hidden active faults on Mt. Etna. Geoph. Res. Lett. 31: L Calvari, S., Spampinato, L., Lodato., S., Harris, A.J., Patrick, M.R., Dehn, J., Burton, M., Andronico, D., Chronology and complex volcanic processes during the flank eruption at Stromboli volcano (Italy) reconstructed from direct observations and surveys with a handheld thermal camera. J. Geophys. Res. 110: B02201, doi: /2004jb Carapezza, M.L., Inguaggiato, S., Brusca, L., Longo, M., Geochemical precursors of Stromboli eruptive events. Geophys. Res. Lett doi: /2004gl
18 Carapezza, M.L., Ricci, T., Ranaldi, M., Tarchini, L Active degassing structures of Stromboli and variations in diffuse CO 2 output related to the volcanic activity. J. Volcanol. Geotherm. Res. 182 (3-4): Chirkov, A.M Radon as a possible criterion for predicting eruptions as observed at Karymsky volcano. Bull. Volcanol. 39: Cigolini, C., Laiolo, M., Coppola, D., Earthquake-volcano interactions detected from radon degassing at Stromboli (Italy). Earth Planet. Sci. Lett. 257: Cigolini, C., Salierno, G., Gervino, G., Bergese, P., Marino, C., Russo, M., Prati, P., Ariola, V., Bonetti, R., Begnini, S., High-resolution Radon Monitoring and Hydrodynamics at Mount Vesuvius. Geoph. Res. Lett. 28 (21): Cigolini, C., Gervino, G., Bonetti, R., Conte, F., Laiolo, M., Coppola, D., Manzoni, A., Tracking precursors and degassing by radon monitoring during major eruptions at Stromboli Volcano (Aeolian Islands, Italy), Geophys. Res. Lett. 32: L12308, doi: /2005gl Cigolini, C., Poggi, P., Ripepe, M., Laiolo, M., Ciamberlini, C., Delle Donne, D., Ulivieri, G., Coppola, D., Lacanna, G., Marchetti, E., Piscopo, D., Genco, R., Radon surveys and real-time monitoring at Stromboli volcano: influence of soil temperature, atmospheric pressure and tidal forces on 222 Rn degassing. J. Volcanol. Geotherm. Res. 184(3-4): Cigolini, C., The dynamics of a double-cell hydrothermal system in triggering seismicity at Somma-Vesuvius: results from a high-resolution radon survey (revisited). Bull. Volcanol. 72:
19 Connors, C., Hill, B., La Femina, P., Navarro, M., Conway, M., Soil Rn-222 pulse during the initial phase of the June August 1995 eruption of Cerro Negro, Nicaragua. J. Volcanol. Geothermal Res. 73: Cox, M.E., Ground Radon Survey of a Geothermal area in Hawaii. Geoph. Res. Lett. 7: De Astis, G., Ventura, G., Vilardo, G., Geodynamic significance of the Aeolian volcanism (Southern Tyrrhenian Sea, Italy) in light of structural, seismological, and geochemical data, Tectonics. 22/4, art. n. 1040/14. Finizola, A., Sortino, F., Lenat, J.F., Valenza, M., Fluid circulation at Stromboli volcano (Aeolian Islands, Italy) from self-potential and CO2 surveys. J. Volcanol. Geoth. Res. 116: Finizola, A., Sortino F., Lénat, J.F., Aubert, M., Ripepe M., Valenza, M., The summit hydrothermal system of Stromboli. New insights from self-potential, temperature, CO2 and fumarolic fluid measurements, with structural and monitoring implications. Bull. Volcanol. 65: , doi: /s z. Fleischer, R. L., Mogro-Campero, A., Association with subsurface radon changes in Alaska and the Northeastern United States with earthquakes. Geochim. Cosmochim. Acta, 49: Gauthier, P.J., Condomines, C Pb- 226 Ra radioactive disequilibria in recent lavas and radon deggassing : inferences on the magma chamber dynamics at Stromboli and Merapi volcanoes. Earth Planet. Sci. Lett. 172:
20 Giammanco, S., Sims, K. W. W., Neri, M., Measurements of 220Rn and 222Rn and CO2 emissions in soil and fumarole gases on Mt. Etna volcano (Italy): Implications for gas transport and shallow ground fracture. Geochem. Geophys. Geosyst. 8: Q10001, doi: /2007gc Giammanco, S., Immè, G., Mangano, G., Morelli, D., Neri, M., Comparison between different methodologies for detecting Radon in soil along an active fault: the case of the Pernicana fault system, Mt. Etna. Applied Radiation and Isotopes 67(1): , doi: /j.apradiso Gillot, P.Y., Keller, J., Radiochronological dating of Stromboli. Acta Vulcanol. 3: Hornig-Kjarsgaard, I., Keller, J., Koberski, U., Stadbauer, E., Francalanci, L., Lenhart, R., Geology, stratigraphy and volcanological evolution of the island of Stromboli, Aeolian arc, Italy. Acta Vulcanol. 3: Gründel, M., Postendörfer. J., Characterization of an electronic Radon gas personal Dosimeter. Radiation Protection Dosimetry 107 No. 4: Harris, A.J.L., Ripepe, M., Temperature and Dynamics of Degassing at Stromboli. J. Geophys. Res. 112: doi:1029/2006jb Hernandez, P., Perez, N., Salazar, J., Reimer, M., Notsu, K., Wakita, H Radon and helium in soil gases at Cañadas caldera, Tenerife, Canary Islands, Spain. J. Volcanol. Geotherm. Res. 131:
21 Igarashi, G., Saeki, S., Takahata, N., Sumikawa, K., Tasaka, S., Sasaki, Y., Takahashi, M., Sano, Y., Ground-water Radon Anomaly before the Kobe Earthquake in Japan. Science 269: Kotrappa, P., Dempsey, J.C., Stieff, L.R., Recent advances in electret ion chamber technology. Rad. Prot. Dosim. 47: Mogro-Campero, A., Fleischer, R. L., Subterrestrial fluid convection: a hypothesis for long distance migration of radon within the earth. Earth Planet. Sci. Lett. 34: Nazaroff, W.W., Radon transport from soil to air. Reviews of Geophysics 30: , doi: 92RG Neri, M., Behncke, B., Burton, M., Giammanco, S., Pecora, E., Privitera, E., Reitano, D., 2006a. Continuous soil radon monitoring during the July 2006 Etna eruption. Geophys. Res. Lett. 33: L24316, doi: /2006gl Neri, M., Lanzafame, G., Structural features of the 2007 Stromboli eruption. J. Volcanol. Geoth. Res. 182(3-4): Ouzounov, D., Freund, F.T., Mid-infrared emission prior to strong earthquakes analyzed by remote sensing data. Advanc. Space Res. 33: Pérez, N.M., Hernández, P.A., Padrón, E., Melián, G., Marrero, R., Padilla, G., Barrancos, J., Nolasco, D., Precursory subsurface 222 Rn and 220 Rn degassing signatures of the 2004 seismic crisis at Tenerife, Canary Islands. Pure Appl. Geophys. 164: 2431-:
22 Perrier, F., Richon, P., Sabroux, J., Temporal variations of radon concentration in the saturated soil of Alpine grassland: the role of groundwater flow. Sci. Tot. Environm. 407: Planicić, J., Radolić, V., Vuković, B., Radon as an earthquake precursor. Nucl. Instr. Meth. in Phys. Res. S. A 530: Pulinets, S A; Ouzounov, D P; Giuliani, G G, Ciraolo, L., Taylor, P.T., Atmosphere and radon activities observed prior to Abruzzo M6.3 earthquake of April 6, Eos Trans. AGU 90(52): Abstract AN: U14A-07. Ripepe, M., Marchetti, E., Ulivieri, G., Harris, A.J., Dehn, J., Burton, M., Caltabiano, T., Salerno, G., Effusive to explosive transition during the 2003 eruption of Stromboli volcano. Geology 33/5: Ripepe, M., Marchetti, E.; Ulivieri, G., Infrasonic monitoring at Stromboli volcano during the 2003 effusive eruption: Insights on the explosive and degassing process of an open conduit system. J. Geophys. Res., 112, B09207: 13 pp., doi: /2006jb Rizzo, A., Grassa, F., Inguaggiato, S., Liotta, M., Longo, M., Madonia, P., Brusca, L., Capasso, G., Moricia, S., Rouwet, D., Vita, F., Geochemical evaluation of observed changes in volcanic activity during the 2007 eruption at Stromboli (Italy). J. Volcanol. Geotherm. Res. 182 (3-4): Rosi, M., Bertagnini, A., Landi, P., Onset of persisting activity at Stromboli Volcano (Italy). Bull. Volcanol. 62:
23 Scholtz, C.H., Sykes, L.R., Aggarval, Y.P., Earthquake prediction: a physical basis. Science 181: Siniscalchi, A., Tripaldi, S., Neri, M., Giammanco, S., Piscitelli, S., Balasco, M., Behncke, B., Magrì, C., Naudet, V., Rizzo, E., Insights into fluid circulation across the Pernicana Fault (Mt. Etna, Italy) and implications for flank instability. J. Volcanol. Geotherm. Res. 193: , doi: /j.jvolgeores Streil, T., Oeser, V., Feige, S., An electronic radon dosimeter as a multipurpose device-a bridge between dosimetry and monitoring. Geofisica Internacional 41: Su, C.C., Huh, C.A., Atmospheric Po-210 anomaly as a precursor of volcano eruptions. Geophys. Res. Lett. 29(5): doi 2001GL Thomas, D.M., Cox, M.E., Cuff, K.E., The association between ground gas radon variations and geologic activity in Hawaii. J. Geophys. Res. 91: Tibaldi, A., Multiple sector collapses at Stromboli volcano, Italy: how they work. Bull. Volcanol. 63: , doi: /s Tibaldi, A., Corazzato, C., Marani, M., Gamberi, F., Subaerial-submarine evidence of structures feeding magma to Stromboli Volcano, Italy, and relations with edifice flank failure and creep. Tectonophysics 469: Varley, N.R., Armienta, M.A., The absence of diffuse degassing at Popocatepetl volcano, Mexico. Chem. Geol. 177:
24 Viveiros, F., Ferreira, T., Cabral Vieira, J., Silva, C., Gaspar, J.L., Environmental influences on soil CO 2 degassing at Furnas and Fogo volcanoes (São Miguel Island, Azores archipelago). J. Volcanol. Geotherm. Res. 177(4): Wakita, H., Geochemical challenge to earthquake prediction. Proc. Natl. Acad. Sci. USA 93: Williams-Jones, G., Stix, J., Heiligmann, M., Charland, A., Sherwood Lollar, B., Arner, N., Garzón, G.V., Barquero, J., Fernandez, E., A model of diffuse degassing at three subduction-related volcanoes. Bull. Volcanol. 62: Wyss, M., Evaluation of Proposed Earthquake Precursors (ed. M. Wyss). AGU, Washington, DC 1991: 94 pp. Wyss, M., Second round of evaluations of earthquake precursors. Pure Appl. Geophys., 149: Zimmer, M., Erzinger, J., Continuous H2O, CO2, 222Rn and temperature measurements on Merapi Volcano,Indonesia, J. Volcanol. Geoth. Res. 125: Figure Captions Figure 1. a) Simplified geological map of Stromboli with major collapses and faults (modified after Tibaldi et al., 2009) and location of the two real-time stations (LSC and PZZ); inset shows the 23
25 structural setting of the southern Tyrrhenian region; b) topographic DEM image of the summit area with the locations of active fumaroles (modified after Finizola et al., 2002). Figure 2. Total daily decays count computed by the two DOSEMan alpha-spectrometers (SARAD Gmbh) of the 222 Rn monitoring stations; see text for details. Spectral distribution of the different isotopes of the radon progeny detected by DOSEman (subdivided into Region of Interest, ROIs) for both the real-time stations operative at Stromboli. Figure 3. Time series of 222 Rn concentration at the Liscione station (LSC) displayed with soil temperature and atmospheric pressure. The black curve refers to average daily concentrations, grey circles represent 4 hour average values. Figure 4. Time series of 222 Rn concentration at the Pizzo station (PZZ) displayed with soil temperature and atmospheric pressure. The black curve refers to average daily concentrations, grey circles represent 4 hour average values. Figure 5. Cross-correlation for soil temperature versus 222 Rn concentrations (daily average values) for the data collected at LSC and PZZ real-time stations, respectively. Figure 6. Summary of the observed 222 Rn time series measured at LSC station compared with calculated radon values (black curve) obtained by Multiple Linear Regression. Residuals are shown separately. Figure 7. Summary of the observed 222 Rn time series measured at summit PZZ station compared with calculated radon values (black curve) obtained by Multiple Linear Regression. Residuals are shown separately. 24
26 Figure 8. Time-series of the observed 222 Rn concentrations, reported as weekly average concentrations compared with weekly average soil CO 2 flux and plume CO 2 /SO 2 ratios. The latter data are from the weekly reports provided by INGV (cf., The cumulate curve for regional rainfalls (in mm) has been obtained from the data of the Messina station (Servizio Metereologico dell Aeronautica). Black bars are the major explosions and dotted bar represent the lava overflow. From May 2008 to mid-january 2009 the Rn-CO 2 correlation coefficient is 0.52, since then it becomes slightly anti-correlated. Similar results are also found for Rn-CO 2 /SO 2 data. Figure 9. Raw data of daily radon concentrations and relationships between absolute daily variations (gradient) computed for the residuals of the PZZ station, and the onset of significative volcanic events during our year-long monitoring at Stromboli volcano. (see text for details). 25
27 Figure 1 26


28 Figure 2 27
29 Figure 3 28
30 Figure 4 29
31 Figure 5 30


32 Figure 6 Figure 7 31
33 Figure 8 32
34 Figure 9 33
35 34
Geochemical evaluation of observed changes in volcanic activity during the 2007 eruption at Stromboli (Italy)
") Geochemical evaluation of observed changes in volcanic activity during the 2007 eruption at Stromboli (Italy) A. Rizzo, F. Grassa, S. Inguaggiato, M. Liotta, M. Longo, P. Madonia, L. Brusca, G. Capasso,
Geochemical evaluation of observed changes in volcanic activity during the 2007 eruption at Stromboli (Italy) A. Rizzo, F. Grassa, S. Inguaggiato, M. Liotta, M. Longo, P. Madonia, L. Brusca, G. Capasso,
Introduction. The output temperature of Fumarole fluids is strongly related to the upward
 Heat flux monitoring of steam heated grounds on two active volcanoes I.S. Diliberto, E. Gagliano Candela, M. Longo Istituto Nazionale di Geofisica e Vulcanologia, Sezione di Palermo, Italy Introduction.
Thermal anomalies at Stromboli volcano from MODIS data
 Mem. S.A.It. Suppl. Vol. 12, 60 c SAIt 2008 Memorie della Supplementi Thermal anomalies at Stromboli volcano from MODIS data D. Piscopo 1, D. Coppola 1, D. Delle Donne 2, C. Cigolini 1, and M. Di Martino
in natural waters: development of an automated monitoring system and first application to Stromboli volcano (Italy)
") ANNALS OF GEOPHYSICS, 54, 2, 2011; doi: 10.4401/ag-5180 Dissolved CO 2 in natural waters: development of an automated monitoring system and first application to Stromboli volcano (Italy) Salvatore Inguaggiato
ANNALS OF GEOPHYSICS, 54, 2, 2011; doi: 10.4401/ag-5180 Dissolved CO 2 in natural waters: development of an automated monitoring system and first application to Stromboli volcano (Italy) Salvatore Inguaggiato
Volcanic and seismic activity at Stromboli preceding the
 Volcanic and seismic activity at Stromboli preceding the 0-0 eruption Burton M., Calvari S., Spampinato L., Lodato L., Pino N.A., Marchetti E., Murè F. Abstract Regular surveys with a PM FLIR thermal imaging
Linked frequency and intensity of persistent volcanic activity at Stromboli (Italy)
") GEOPHYSICAL RESEARCH LETTERS, VOL. 40, 3384 3388, doi:10.1002/grl.50652, 2013 Linked frequency and intensity of persistent volcanic activity at Stromboli (Italy) J. Taddeucci, 1 D. M. Palladino, 2 G. Sottili,
GEOPHYSICAL RESEARCH LETTERS, VOL. 40, 3384 3388, doi:10.1002/grl.50652, 2013 Linked frequency and intensity of persistent volcanic activity at Stromboli (Italy) J. Taddeucci, 1 D. M. Palladino, 2 G. Sottili,
Degassing processes and recent activity at Volcán de Colima. Universidad de Colima, Mexico Corresponding author
 Degassing processes and recent activity at Volcán de Colima Nick Varley * & Gabriel Reyes Dávila Universidad de Colima, Mexico Corresponding author email: nick@ucol.mx Volcán de Colima is currently in
Journal of Volcanology and Geothermal Research
 Journal of Volcanology and Geothermal Research 196 (2010) 111 119 Contents lists available at ScienceDirect Journal of Volcanology and Geothermal Research journal homepage: www.elsevier.com/locate/jvolgeores
Monitoring active volcanoes: The geochemical approach
 ANNALS OF GEOPHYSICS, 54, 2, 2011; doi: 10.4401/ag-5187 Monitoring active volcanoes: The geochemical approach Salvatore Inguaggiato 1,*, Agnes Mazot 2, Takeshi Ohba 3 1 Istituto Nazionale di Geofisica
Evidence of a recent input of magmatic gases into the quiescent volcanic edifice of Panarea, Aeolian Islands, Italy
 GEOPHYSICAL RESEARCH LETTERS, VOL. 31, L07619, doi:10.1029/2003gl019359, 2004 Evidence of a recent input of magmatic gases into the quiescent volcanic edifice of Panarea, Aeolian Islands, Italy S. Caliro,
Soil gas radon emissions and volcanic activity at El Hierro (Canary Islands): The submarine eruption
: The submarine eruption") Article Volume 14, Number 2 28 February 2013 doi:10.1029/2012gc004375 ISSN: 1525-2027 Soil gas radon emissions and volcanic activity at El Hierro (Canary Islands): The 2011-2012 submarine eruption Germán
Article Volume 14, Number 2 28 February 2013 doi:10.1029/2012gc004375 ISSN: 1525-2027 Soil gas radon emissions and volcanic activity at El Hierro (Canary Islands): The 2011-2012 submarine eruption Germán
G 3. AN ELECTRONIC JOURNAL OF THE EARTH SCIENCES Published by AGU and the Geochemical Society
 Geosystems G 3 AN ELECTRONIC JOURNAL OF THE EARTH SCIENCES Published by AGU and the Geochemical Society Article Volume 8, Number 10 4 October 2007 Q10001, doi:10.1029/2007gc001644 ISSN: 1525-2027 Click
A - Piton de la Fournaise activity
 OVPF-IPGP August 2018 Page 1/7 Monthly bulletin of the Piton de la Fournaise Volcanological Observatory ISSN ISSN 2610-5101 A - Piton de la Fournaise activity PITON DE LA FOURNAISE (VNUM #233020) Latitude:
Introduction to Volcanic Seismology
 Introduction to Volcanic Seismology Second edition Vyacheslav M. Zobin Observatorio Vulcanolo'gico, Universidad de Colima, Colima, Col., Mexico ELSEVIER AMSTERDAM BOSTON HEIDELBERG LONDON * NEW YORK OXFORD
Major effusive eruptions and recent lava fountains: Balance between expected and erupted magma volumes at Etna volcano
 GEOPHYSICAL RESEARCH LETTERS, VOL. 40, 6069 6073, doi:10.1002/2013gl058291, 2013 Major effusive eruptions and recent lava fountains: Balance between expected and erupted magma volumes at Etna volcano A.
EAS 116 Earthquakes and Volcanoes
 EAS 116 Earthquakes and Volcanoes J. Haase Forecasting Volcanic Eruptions Assessment of Volcanic Hazard Is that volcano active? Mount Lassen: 12000 BP and 1915 Santorini, IT: 180,000 BP, 70,000 BP, 21000
Analysis of gross alpha, gross beta activities and beryllium-7 concentrations in surface air: their variation and statistical prediction model
 Iran. J. Radiat. Res., 2006; 4 (3): 155-159 Analysis of gross alpha, gross beta activities and beryllium-7 concentrations in surface air: their variation and statistical prediction model F.Arkian 1*, M.
The 2007 Stromboli eruption: event chronology and effusion rates using thermal infrared data
 1 2 3 4 5 6 7 8 9 10 11 12 13 14 15 16 17 18 19 20 21 22 23 24 25 26 27 28 29 30 31 32 33 34 35 36 37 38 39 40 41 42 The 2007 Stromboli eruption: event chronology and effusion rates using thermal infrared
volcanic tremor and Low frequency earthquakes at mt. vesuvius M. La Rocca 1, D. Galluzzo 2 1
 volcanic tremor and Low frequency earthquakes at mt. vesuvius M. La Rocca 1, D. Galluzzo 2 1 Università della Calabria, Cosenza, Italy 2 Istituto Nazionale di Geofisica e Vulcanologia Osservatorio Vesuviano,
Monthly Volcanic Activity Report (July, 2012)
") Monthly Volcanic Activity Report (July, 2012) Tokachidake [Alert Level: 1] Volcanic glows have been observed in the Taisho crater with a high-sensitivity camera at night from the night of June 30th to
Monthly Volcanic Activity Report (July, 2012) Tokachidake [Alert Level: 1] Volcanic glows have been observed in the Taisho crater with a high-sensitivity camera at night from the night of June 30th to
Diverse deformation patterns of Aleutian volcanoes from InSAR
 Diverse deformation patterns of Aleutian volcanoes from InSAR Zhong Lu 1, Dan Dzurisin 1, Chuck Wicks 2, and John Power 3 U.S. Geological Survey 1 Cascades Volcano Observatory, Vancouver, Washington 2
Living in the shadow of Italy's volcanoes
 Living in the shadow of Italy's volcanoes Where are the Aeolian Islands? The Aeolian Islands are a group of eight volcanic islands that lie off the northern coast of Sicily (Figure 1). Whilst they are
Supporting the response to the 2018 lower East Rift Zone and summit collapse at Kīlauea Volcano, Hawaiʻi
 Hawaiʻi Supersite success story Supporting the response to the 2018 lower East Rift Zone and summit collapse at Kīlauea Volcano, Hawaiʻi Since 1983, Kīlauea Volcano, on the Island of Hawaiʻi, has actively
Nick Varley Universidad de Colima, Mexico
 Nick Varley Universidad de Colima, Mexico nick@ucol.mx Remote sensing often is the first signal of a new eruption for remote volcanoes Fumarole direct temperature measurements Spring water temperatures
Long-term variations of fumarole temperatures on Vulcano Island (Italy)
") ANNALS OF GEOPHYSICS, 54, 2, 2011; doi: 10.4401/ag-5183 Long-term variations of fumarole temperatures on Vulcano Island (Italy) Iole Serena Diliberto Istituto Nazionale di Geofisica e Vulcanologia, sezione
ANNALS OF GEOPHYSICS, 54, 2, 2011; doi: 10.4401/ag-5183 Long-term variations of fumarole temperatures on Vulcano Island (Italy) Iole Serena Diliberto Istituto Nazionale di Geofisica e Vulcanologia, sezione
Recent activity. Current episode 12 years Transition between styles 4 periods of dome growth Since 2003, Vulcanian explosions (4 25 per day)
") Recent activity Current episode 12 years Transition between styles 4 periods of dome growth Since 2003, Vulcanian explosions (4 25 per day) 02 December 09 Explosions originating from dome e.g. 10 Jan 2010
Recent activity Current episode 12 years Transition between styles 4 periods of dome growth Since 2003, Vulcanian explosions (4 25 per day) 02 December 09 Explosions originating from dome e.g. 10 Jan 2010
Radon measurements along active faults in the Langadas Basin, northern Greece
 Natural Hazards and Earth System Sciences (2001) 1: 159 164 c European Geophysical Society 2001 Natural Hazards and Earth System Sciences Radon measurements along active faults in the Langadas Basin, northern
Report on field deployment of a permanent volcanic gas network at Nea Kameni Volcano, Santorini (Greece)
") Report on field deployment of a permanent volcanic gas network at Nea Kameni Volcano, Santorini (Greece) Prepared on September 2012 for the DCO, Reservoir and Fluxes Directorate Research carried out within
Report on field deployment of a permanent volcanic gas network at Nea Kameni Volcano, Santorini (Greece) Prepared on September 2012 for the DCO, Reservoir and Fluxes Directorate Research carried out within
M 7.2 Earthquake along Iraq Iran border Sunday, November 12, Close to boundary of the Arabian and Eurasian Plates
 M 7.2 Earthquake along Iraq Iran border Sunday, November 12, 2017 Close to boundary of the Arabian and Eurasian Plates Length of Lava Flows Since the path of a lava flow is controlled by topography it
LECTURE #11: Volcanoes: Monitoring & Mitigation
 GEOL 0820 Ramsey Natural Disasters Spring, 2018 LECTURE #11: Volcanoes: Monitoring & Mitigation Date: 15 February 2018 I. What is volcanic monitoring? the continuous collection of one or more data sources
Monitoring techniques developed at CO2 natural laboratories to improve risks assessment and safety strategy
 Monitoring techniques developed at CO2 natural laboratories to improve risks assessment and safety strategy Sabina Bigi Dipartimento di Scienze della Terra Sapienza Università di Roma 3 rd International
( ) USGS (United States Geological Survey) Watch Green. Normal. alert level 1 Normal
 USGS (United States Geological Survey) Watch Green. Normal. alert level 1 Normal") (200610.1) USGS (United States Geological Survey) 1014 alert level 1 Normal Watch Green Normal USGS WARNING WATCH ADVISORY NORMAL SUMMARY OF VOLCANIC-ALERT LEVELS Highly hazardous eruption underway or
(200610.1) USGS (United States Geological Survey) 1014 alert level 1 Normal Watch Green Normal USGS WARNING WATCH ADVISORY NORMAL SUMMARY OF VOLCANIC-ALERT LEVELS Highly hazardous eruption underway or
Dipartimento di Scienze Geologiche, Palazzo delle Scienze, Corso Italia 55, I Catania, Italy
 Small scale rifting during paroxysmal eruptive episodes at the South East Crater of Mount Etna (Sicily) Marco Fulle & Boris Behncke Osservatorio Astronomico, Via Tiepolo 11, I 34131 Trieste, Italy Dipartimento
Geophysical Classification of Strombolian Explosive eruption
 Geophysical Classification of Strombolian Explosive eruption Ripepe M. and E. Marchetti Department of Earth Sciences, University of Firenze, Firenze - Italy Monitoring Centre for Civil Protection - Italian
Monthly Volcanic Activity Report (November 2015)
") Monthly Volcanic Activity Report (November 2015) Japan Meteorological Agency Meakandake (Alert Level: 1) Alert level downgrade from 2 to 1 on 13 November A field survey conducted from 2 to 5 November showed
Monthly Volcanic Activity Report (November 2015) Japan Meteorological Agency Meakandake (Alert Level: 1) Alert level downgrade from 2 to 1 on 13 November A field survey conducted from 2 to 5 November showed
0911 Andò, B., M. Coltelli and M. Sambataro, A measurement tool for investigating cooling lava properties, IEEE T INSTRUM MEAS 53, 2,
 Pubblicazioni 2004 0909 Aiuppa, A., M. Burton, F. Mure and S. Inguaggiato, 2004. Intercomparison of volcanic gas monitoring methodologies performed on Vulcano Island, Italy, Geophys. Res. Lett., 31, 2,
Mount Spurr geothermal workshop August 27 28, 2007
 Mount Spurr geothermal workshop August 27 28, 2007 Geologic Overview & Review of Geothermal Exploration Christopher Nye geologist / volcanologist DNR/GGS & AVO Alaska Division of Geological and Geophysical
HEAT AND MASS TRANSFER PROCESSES AFTER 1995 PHREATIC ERUPTION OF KUJU VOLCANO, CENTRAL KYUSHU, JAPAN
 HEAT AND MASS TRANSFER PROCESSES AFTER 1995 PHREATIC ERUPTION OF KUJU VOLCANO, CENTRAL KYUSHU, JAPAN Sachio Ehara 1,Yasuhiro Fujimitsu 1, Jun Nishijima 1,Akira Ono 1 and Yuichi Nakano 1 1 Laboratory of
Mt St Helens was know to have entered into active periods that lasted from years once every years over the last 500 years, (Figure 5).
.") Lecture #8 notes; Geology 3950, Spring 2006; CR Stern May 1980 eruption of Mt St Helens volcano (text pages 183-192 in the 4 th edition and 206-222 in the 5 th edition) Mt St Helens in southwest Washington
Lecture #8 notes; Geology 3950, Spring 2006; CR Stern May 1980 eruption of Mt St Helens volcano (text pages 183-192 in the 4 th edition and 206-222 in the 5 th edition) Mt St Helens in southwest Washington
Radon, water chemistry and pollution check by volatile organic compounds in springs around Popocatepetl volcano, Mexico
 ANNALS OF GEOPHYSICS, VOL. 48, N. 1, February 2005 Radon, water chemistry and pollution check by volatile organic compounds in springs around Popocatepetl volcano, Mexico Nuria Segovia ( 1 ), Pablo Peña
Experimental research into emission of ultra fine dusts as harbingers of volcanic seismic events
 Experimental research into emission of ultra fine dusts as harbingers of volcanic seismic events F. Patania, A. Gagliano, F. Nocera & V. Lauretta Energy and Environment Division of D.I.I.M., Engineering
68. Izu-Torishima. Summary. Latitude: 30 29'02" N, Longitude: '11" E, Elevation: 394 m (Ioyama) (Elevation Point) (68.
 (Elevation Point) (68.") 68. Izu-Torishima Latitude: 30 29'02" N, Longitude: 140 18'11" E, Elevation: 394 m (Ioyama) (Elevation Point) Izu-Torishima taken from southeast side on August 12, 2002. Courtesy of the Maritime Safety
68. Izu-Torishima Latitude: 30 29'02" N, Longitude: 140 18'11" E, Elevation: 394 m (Ioyama) (Elevation Point) Izu-Torishima taken from southeast side on August 12, 2002. Courtesy of the Maritime Safety
Research Article Possible Micrometeorological Anomalies Induced by Volcanic Activity Recorded at Stromboli Island (Aeolian Archipelago, Italy)
") Advances in Meteorology Volume 2015, Article ID 434090, 7 pages http://dx.doi.org/10.1155/2015/434090 Research Article Possible Micrometeorological Anomalies Induced by Volcanic Activity Recorded at Stromboli
Advances in Meteorology Volume 2015, Article ID 434090, 7 pages http://dx.doi.org/10.1155/2015/434090 Research Article Possible Micrometeorological Anomalies Induced by Volcanic Activity Recorded at Stromboli
Images from: Boston.com
 Images from: Boston.com Ireland in the shadow of a volcano: Understanding the 2010 eruption at Eyjafjallajökull, Iceland. Chris Bean, School of Geological Sciences, UCD. World Quakes and Volcanoes 1960-2010
Monthly Volcanic Activity Report (March 2013)
") Monthly Volcanic Activity Report (March 2013) Hakoneyama (Alert Level: 1) Shallow earthquake activity from the area near Mt. Komagatake to Sengokuhara has largely remained at low levels since the middle
Monthly Volcanic Activity Report (March 2013) Hakoneyama (Alert Level: 1) Shallow earthquake activity from the area near Mt. Komagatake to Sengokuhara has largely remained at low levels since the middle
Soil gas and gas flux baselines
 Soil gas and gas flux baselines Regional and site-scale baseline surveys of near- surface gas geochemistry parameters Understanding natural variability as a framework for monitoring programs and public
Figure 8-21 Distribution of Lava Flow for the Model
 Figure 8-21 Distribution of Lava Flow for the Model 2) Pyroclastic Flow The energy cone model was used for the simulation. a. The angle of inclination of Energy Line, φ, from the summit was 5.3 degrees
Physical Geography. Tectonics, Earthquakes, and Volcanism. Chapter 12 GEOGRAPHY Earthquakes and Volcanoes. What are Earthquakes?
 Physical Geography GEOGRAPHY 1710 DAVID R. SALLEE Tectonics, Earthquakes, and Chapter 12 Earthquakes and Volcanoes Earthquakes? The shaking or trembling caused by the sudden release of energy Usually associated
Visualizing Earth Science. Chapter Overview. Volcanoes and Eruption Types. By Z. Merali and B. F. Skinner. Chapter 9 Volcanism and Other
 Visualizing Earth Science By Z. Merali and B. F. Skinner Chapter 9 Volcanism and Other Igneous Processes Volcanoes types and effects of eruption Chapter Overview Melting and cooling of rocks Geological
Remotely induced seismicity and the effects of regional earthquakes on open-vent systems
 Remotely induced seismicity and the effects of regional earthquakes on open-vent systems AB Clarke, A Magee, MJ Fouch, JF Smekens, L Vanderkluysen, H Hartnett Outline Background and examples of remotely
Monthly Volcanic Activity Report (February 2016)
") Monthly Volcanic Activity Report (February 2016) Japan Meteorological Agency Azumayama (Alert Level: 2) Fumarolic activity at the Oana crater has remained at relatively high levels. Aerial observation
Monthly Volcanic Activity Report (February 2016) Japan Meteorological Agency Azumayama (Alert Level: 2) Fumarolic activity at the Oana crater has remained at relatively high levels. Aerial observation
Multi-scale evaluations of submarine groundwater discharge
 doi:10.5194/piahs-365-66-2015 66 Complex Interfaces Under Change: Sea River Groundwater Lake Proceedings of HP2/HP3, IAHS-IAPSO-IASPEI Assembly, Gothenburg, Sweden, July 2013 (IAHS Publ. 365, 2014). Multi-scale
and H 2 S soil diffuse degassing surveys with the accumulation chamber and soil concentration measurements of CO 2 , N 2
 Feasibility of high-frequency micro-gaschromatography soil gas monitoring revealed at la Solfatara (Campi Flegrei, Italy) S. Sicola 1, M.L. Carapezza 2, M. Ranaldi 1, F. Sortino 3, L. Tarchini 1 1 Dipartimento
Coupled use of COSPEC and satellite measurements to define the volumetric balance during effusive eruptions at Etna, Italy
 Accepted Manuscript Coupled use of COSPEC and satellite measurements to define the volumetric balance during effusive eruptions at Etna, Italy Andrea M. Steffke, Andrew J.L. Harris, Mike Burton, Tommaso
2) re-positioning of the SSS data, 3) individuation of geomorphological features and morphometrical parameters correlated to instability phenomena.
 re-positioning of the SSS data, 3) individuation of geomorphological features and morphometrical parameters correlated to instability phenomena.") HIGH-RESOLUTION SIDE SCAN SONAR AND MULTIBEAM DATA PROCESSING AND MERGING TO STUDY SUBMARINE INSTABILITY PHENOMENA ON VOLCANIC ISLANDS (PONTINE, CAMPANIAN AND AEOLIAN ARCHIPELAGOS) A. BOSMAN Extended abstract:
HIGH-RESOLUTION SIDE SCAN SONAR AND MULTIBEAM DATA PROCESSING AND MERGING TO STUDY SUBMARINE INSTABILITY PHENOMENA ON VOLCANIC ISLANDS (PONTINE, CAMPANIAN AND AEOLIAN ARCHIPELAGOS) A. BOSMAN Extended abstract:
Chapter 5 9/10/2011. Introduction. Volcanoes and Volcanism. Volcanism. Introduction. Introduction. Introduction
 Introduction Chapter 5 Volcanism is the eruption of magma, and associated gases at the surface. Some magma erupts explosively as pyroclastic (fire-broken) rock and other erupts as lava flows. Volcanoes
Living in the shadow of Italy's volcanoes
 Living in the shadow of Italy's volcanoes Where is Mount Etna? Mount Etna is located on the east coast of Sicily roughly midway between Messina and Catania (Figure 1). It is the largest and tallest volcano
From Punchbowl to Panum: Long Valley Volcanism and the Mono-Inyo Crater Chain
 From Punchbowl to Panum: Leslie Schaffer E105 2002 Final Paper Long Valley Volcanism and the Mono-Inyo Crater Chain Figure 1. After a sequence of earthquakes during the late 1970 s to the early 1980 s
A - Piton de la Fournaise activity
 OVPF-IPGP November 2018 Page 1/7 Monthly bulletin of the Piton de la Fournaise Volcanological Observatory ISSN ISSN 2610-5101 A - Piton de la Fournaise activity PITON DE LA FOURNAISE (VNUM #233020) Latitude:
Near real-time monitoring of the April-May 2010 Eyjafjöll s ash cloud
 Near real-time monitoring of the April-May 2010 Eyjafjöll s ash cloud Labazuy P. and the HotVolc Team Observatoire de Physique du Globe de Clermont-Ferrand, CNRS, Université Blaise Pascal 13th International
The usefulness of the Radon signal for geophysical purposes highlighted through analytical procedures
 14 th INTERNATIONAL WORKSHOP GARRM (on the GEOLOGICAL ASPECTS OF RADON RISK MAPPING) September 18 th 20 th, 2018 Prague, Czech Republic The usefulness of the Radon signal for geophysical purposes highlighted
Lava effusion - A slow fuse for paroxysms at Stromboli volcano?
 Lava effusion - A slow fuse for paroxysms at Stromboli volcano? S. Calvari, L. Spampinato, A. Bonaccorso, Clive Oppenheimer, E. Rivalta, E. Boschi To cite this version: S. Calvari, L. Spampinato, A. Bonaccorso,
INVERSE MODELING IN GEOPHYSICAL APPLICATIONS
 1 INVERSE MODELING IN GEOPHYSICAL APPLICATIONS G. CURRENTI,R. NAPOLI, D. CARBONE, C. DEL NEGRO, G. GANCI Istituto Nazionale di Geofisica e Vulcanologia, Sezione di Catania, Catania, Italy E-mail: currenti@ct.ingv.it
Inverse Modeling in Geophysical Applications
 Communications to SIMAI Congress, ISSN 1827-9015, Vol. 1 (2006) DOI: 10.1685/CSC06036 Inverse Modeling in Geophysical Applications Daniele Carbone, Gilda Currenti, Ciro Del Negro, Gaetana Ganci, Rosalba
Physical Geology, 15/e
 Lecture Outlines Physical Geology, 15/e Plummer, Carlson & Hammersley Copyright McGraw-Hill Education, Inc. Permission required for reproduction or display. Volcanism and Extrusive Rocks Physical Geology
Ch12&13 Test. 3. Where does the first motion of an earthquake occur? a. fault c. epicenter b. focus d. locus
 Ch12&13 Test Multiple Choice Identify the choice that best completes the statement or answers the question. 1. What is the epicenter of an earthquake? a. the location along a fault where the first motion
Monthly Volcanic Activity Report (April 2015)
") Monthly Volcanic Activity Report (April 2015) Japan Meteorological Agency Meakandake (Alert Level: 1) The number of small shallow earthquakes occurring near the Ponmachineshiri crater increased from 15
Monthly Volcanic Activity Report (April 2015) Japan Meteorological Agency Meakandake (Alert Level: 1) The number of small shallow earthquakes occurring near the Ponmachineshiri crater increased from 15
GEODETIC EVIDENCE FOR SLOW INFLATION OF THE SANTORINI CALDERA
 Proceedings, 11 th FIG Symposium on Deformation Measurements, Santorini, Greece, 2003. GEODETIC EVIDENCE FOR SLOW INFLATION OF THE SANTORINI CALDERA Stathis Stiros 1, Aris Chasapis 2 and Villy Kontogianni
GEOL1 Physical Geology Laboratory Manual College of the Redwoods Lesson Five: Volcanoes Background Reading: Volcanoes Volcanic Terms: Silca:
 Name: Date: GEOL1 Physical Geology Laboratory Manual College of the Redwoods Lesson Five: Volcanoes Background Reading: Volcanoes Volcanic Terms: Silca: SiO 2 silicon dioxide. This is quartz when it crystallizes.
Topic 1: Modeling SFU: (JVGR 1992)
") Topic 1: Modeling SFU: (JVGR 1992) 1. Were different chamber top shapes used other than flat, i.e. convex, concave, convoluted / ridged? What is the sensitivity of your models to this? Also, was there
Topic 1: Modeling SFU: (JVGR 1992) 1. Were different chamber top shapes used other than flat, i.e. convex, concave, convoluted / ridged? What is the sensitivity of your models to this? Also, was there
UGRC 144 Science and Technology in Our Lives/Geohazards
 UGRC 144 Science and Technology in Our Lives/Geohazards Session 5 Magma and Volcanism Lecturer: Dr. Patrick Asamoah Sakyi Department of Earth Science, UG Contact Information: pasakyi@ug.edu.gh College
NATIONAL SPORTS SCHOOL ST BENEDICT COLLEGE
 NATIONAL SPORTS SCHOOL ST BENEDICT COLLEGE Mark HALF-YEARLY EXAMINATION 2013/14 FORM 2 GEOGRAPHY (Levels 8 7 6 5) TIME: 1h 30 min Name: Class: Answer ALL the questions. 1. TRUE or FALSE? Put a in the correct
Relation between single very long period pulses and volcanic gas emissions at Mt. Asama, Japan
 GEOPHYSICAL RESEARCH LETTERS, VOL. 38,, doi:10.1029/2011gl047555, 2011 Relation between single very long period pulses and volcanic gas emissions at Mt. Asama, Japan Ryunosuke Kazahaya, 1 Toshiya Mori,
Motivations for muon radiography of active volcanoes
 Earth Planets Space, 62, 139 143, 2010 Motivations for muon radiography of active volcanoes G. Macedonio and M. Martini Istituto Nazionale di Geofisica e Vulcanologia, Osservatorio Vesuviano, Napoli, Italy
About Some Features of a Magma Flow Structure at Explosive Volcano Eruptions
 About Some Features of a Magma Flow Structure at Explosive Volcano Eruptions V. Kedrinskiy 1 Introduction The cyclic character of magma ejections is one of the basic aspects in the research field of the
RELATIONSHIP BETWEEN GEOTHERMAL ACTIVITY AND GRAVITY ANOMALIES ON VULCANO ISLAND, ITALY
 Proceedings NZ Geothermal Workshop 2002 RLATIONSHIP BTWN GOTHRMAL ACTIVITY AND GRAVITY ANOMALIS ON VULCANO ISLAND, ITALY M. S.OKUMA', S.NAKANO', R. FURUKAWA', M. KOMAZAWA' & R. SUPPR 2 'Geological Survey
Patterns in the recent activity of Mount Etna volcano investigated by integrated geophysical and geochemical observations
 Article Volume 11, Number 9 23 September 2010 Q09008, doi:10.1029/2010gc003168 ISSN: 1525 2027 Patterns in the recent 2007 2008 activity of Mount Etna volcano investigated by integrated geophysical and
Monthly Volcanic Activity Report (August 2015)
") Monthly Volcanic Activity Report (August 2015) Japan Meteorological Agency Meakandake (Alert Level: 2) Volcanic seismicity in shallow parts under the area around the Ponmachineshiri crater began to fluctuate
Monthly Volcanic Activity Report (August 2015) Japan Meteorological Agency Meakandake (Alert Level: 2) Volcanic seismicity in shallow parts under the area around the Ponmachineshiri crater began to fluctuate
A - Piton de la Fournaise activity
 OVPF-IPGP September 2018 Page 1/10 Monthly bulletin of the Piton de la Fournaise Volcanological Observatory ISSN ISSN 2610-5101 A - Piton de la Fournaise activity PITON DE LA FOURNAISE (VNUM #233020) Latitude:
Volcanoes. 11/25/2013. Geology 15 Lecture 27 VOLCANO!
 Hazard Update Surprise POP Review Tsunami Activity 10 B Today s Material Volcanoes Volcanic Hazards Geology 15 Lecture 27 VOLCANO! http://motherboard.vice.com/blog/watch an erupting volcano create a newisland
and their risks A look at volcano risk for young students. Produced by the MED-SUV project.
 and their risks A look at volcano risk for young students. Produced by the MED-SUV project. Volcano Shapes: A volcano is a place (on Earth and OTHER PLANETS) where magma comes to the surface. This event
Volcanic Eruptions and Hydrovolcanism
 Find the Face Volcanic Eruptions and Hydrovolcanism Ocean Ridges Continental Rifts Subduction Zones: Continental Oceanic Back Arc Basins Hot Spots Plumes Cinder Cones Composite Volcanoes Shield VolcanoesCinder
Quantifying probabilities of eruption at a well-monitored. active volcano: an application to Mount Etna (Sicily, Italy).
.") Quantifying probabilities of eruption at a well-monitored active volcano: an application to Mount Etna (Sicily, Italy). A. Brancato 1*, S. Gresta 1, L. Sandri 2, J. Selva 2, W. Marzocchi 3, S. Alparone
Quantifying probabilities of eruption at a well-monitored active volcano: an application to Mount Etna (Sicily, Italy). A. Brancato 1*, S. Gresta 1, L. Sandri 2, J. Selva 2, W. Marzocchi 3, S. Alparone
Introduction to volcanoes. Volcano: an opening in the earth s surface through which lava, hot gases, and rock fragments erupt
 Introduction to volcanoes Volcano: an opening in the earth s surface through which lava, hot gases, and rock fragments erupt Origin of Volcanoes 1. Magma 50-100 miles below the earth s surface slowly begins
GEOTHERMAL ENERGY POTENTIAL FOR LONGONOT PROSPECT, KENYA. By Mariita N. O. Kenya Electricity Generating Company
 GEOTHERMAL ENERGY POTENTIAL FOR LONGONOT PROSPECT, KENYA By Mariita N. O. Kenya Electricity Generating Company PRESENTATION OUTLINE INTRODUCTION REGIONAL SETTING GEOLOGY GEOTHERMAL MANIFESTATIONS HYDROGEOLOGY
THE SEISMICITY OF THE CAMPANIAN PLAIN: PRELIMINARY RESULTS
 THE SEISMICITY OF THE CAMPANIAN PLAIN: PRELIMINARY RESULTS Girolamo Milano Osservatorio Vesuviano, Via Diocleziano 328, 80124 Napoli milano@osve.unina.it INTRODUCTION In areas affected by active volcanism,
DYNAMICS OF OUTDOOR RADON AND THORON PROGENY CONCENTRATIONS IN SOME GEOGRAPHICAL AREAS OF ROMANIA *
 DYNAMICS OF OUTDOOR RADON AND THORON PROGENY CONCENTRATIONS IN SOME GEOGRAPHICAL AREAS OF ROMANIA * E. SIMION 1,2, I. MIHALCEA 2, V. CUCULEANU 3,4, F. SIMION 1,3 1 National Environmental Protection Agency,
EHaz 26 April 2007 Questions. The following questions are arranged by topic. Risk assessment & management MTU
 EHaz 26 April 2007 Questions The following questions are arranged by topic. Risk assessment & management Slide 17 (very good slide, by the way!): In the case of the Merapi and Mt. St. Helens crises, how
Experiment Radioactive Decay of 220 Rn and 232 Th Physics 2150 Experiment No. 10 University of Colorado
 Experiment 10 1 Introduction Radioactive Decay of 220 Rn and 232 Th Physics 2150 Experiment No. 10 University of Colorado Some radioactive isotopes formed billions of years ago have half- lives so long
A bowl shaped depression formed by the collapse of a volcano is called a. Magma that has left the vent of a volcano is known as. Lava.
 Magma that has left the vent of a volcano is known as Lava A bowl shaped depression formed by the collapse of a volcano is called a Caldera This can form in a caldera when magma starts to come back up
Volcanism Activity. Choose one of the options below to complete for tomorrow. You may work with a partner on this activity. Be creative and realistic!
 Volcanism Activity Choose one of the options below to complete for tomorrow. You may work with a partner on this activity. Be creative and realistic! Option 1 Option 2 Option 3 Create a comic strip or
GEOS 606 Physical Volcanology GEOS 606 CRN credits
 GEOS 606 Physical Volcanology GEOS 606 CRN 74060 3 credits September 1th December 17 th, 2011 Mondays, Wednesdays and Fridays MWF 10:30-11:30 Irving 208 and Elvey 101 Dr. Jonathan Dehn office: WRRB 108G,
Earth and Planetary Science Letters
 Earth and Planetary Science Letters 295 (2010) 195 204 Contents lists available at ScienceDirect Earth and Planetary Science Letters journal homepage: www.elsevier.com/locate/epsl A model of degassing
ABSOLUTE AND RELATIVE GRAVITY MEASUREMENTS AT ETNA VOLCANO (ITALY)
") ABSOLUTE AND RELATIVE GRAVITY MEASUREMENTS AT ETNA VOLCANO (ITALY) F. Greco 1, G. Currenti 1, G. D Agostino 2, C. Del Negro 1, A. Di Stefano 1, A. Germak 2, R. Napoli 1, C. Origlia 2, A. Pistorio 1, 3,
ABSOLUTE AND RELATIVE GRAVITY MEASUREMENTS AT ETNA VOLCANO (ITALY) F. Greco 1, G. Currenti 1, G. D Agostino 2, C. Del Negro 1, A. Di Stefano 1, A. Germak 2, R. Napoli 1, C. Origlia 2, A. Pistorio 1, 3,
Volcanic SO 2 by UV-TIR satellite retrievals: validation by using ground-based network at Mt. Etna
 ; doi: 10.4401/ag-6641 Volcanic SO 2 by UV-TIR satellite retrievals: validation by using ground-based network at Mt. Etna CLAUDIA SPINETTI 1 *, GIUSEPPE GIOVANNI SALERNO 1, TOMMASO CALTABIANO 1, ELISA
Dipartimento di Scienze Biologiche, Geologiche e Ambientali, Sezione di Scienze della Terra, Università di Catania, Italy 2
 Structural pattern and active deformation in the northern sector of the Aeolian-Tindari-Letojanni fault system in the geodynamic framework of the southern Calabrian Arc: an integrated analysis of field,
Multilayer Nuclear Track Detectors for Retrospective Radon Dosimetry
 Multilayer Nuclear Track Detectors for Retrospective Radon Dosimetry V. V. Bastrikov 1, M. V. Zhukovsky 2 1 Experimental Physics Department, Ural State Technical University, Mira St., 19/5, 620002, Ekaterinburg,
UGRC 144 Science and Technology in Our Lives/Geohazards
 UGRC 144 Science and Technology in Our Lives/Geohazards Session 6 Volcanic Hazards Lecturer: Dr. Patrick Asamoah Sakyi Department of Earth Science, UG Contact Information: pasakyi@ug.edu.gh College of
Monthly Volcanic Activity Report (April 2013)
") Monthly Volcanic Activity Report (April 2013) Zaozan (Calm) Small-amplitude volcanic tremors were recorded on April 7 (duration: 3 min 20 sec), 9 (4 min 20 sec) and 21 (5 min 40 sec). These were the first
Monthly Volcanic Activity Report (April 2013) Zaozan (Calm) Small-amplitude volcanic tremors were recorded on April 7 (duration: 3 min 20 sec), 9 (4 min 20 sec) and 21 (5 min 40 sec). These were the first
Volcanic Plumes. JOHN WILEY & SONS Chichester New York Weinheim Brisbane Singapore Toronto
 Volcanic Plumes R. S. J. SPARKS University of Bristol, UK M. I. BURSIK State University of New York, USA S. N. CAREY University of Rhode Island, USA J. S. GILBERT Lancaster University, UK L. S. GLAZE NASA/Goddard