CR/15/120; Draft 0.1 Last modified: 2016/03/24 15:17
|
|
|
- Derek Jefferson
- 5 years ago
- Views:
Transcription

1 CR/15/120; Draft 0.1 Last modified: 2016/03/24 15:17 Reservoir evaluation of 12 wells in the Devonian Carboniferous of the Central North Sea: Petrophysical interpretations of clay volume, porosity and permeability estimations Energy and Marine Geoscience Programme Commissioned Report CR/15/120
2 CR/15/120; Draft 0.1 Last modified: 2016/03/24 15:17
3 CR/15/120; Draft 0.1 Last modified: 2016/03/24 15:17 BRITISH GEOLOGICAL SURVEY ENERGY AND MARINE GEOSCIENCE PROGRAMME COMMISSIONED REPORT CR/15/120 The National Grid and other Ordnance Survey data Crown Copyright and database rights Ordnance Survey Licence No EUL. Keywords Palaeozoic; Carboniferous; Devonian; CNS. Bibliographical reference Reservoir evaluation of 12 wells in the Devonian Carboniferous of the Central North Sea: Petrophysical interpretations of clay volume, porosity and permeability estimations S Hannis Contributor E Callaghan HANNIS, S Reservoir evaluation of 12 wells in the Devonian Carboniferous of the Central North Sea: Petrophysical interpretations of clay volume, porosity and permeability estimations. British Geological Survey Commissioned Report, CR/15/ pp. Copyright in materials derived from the British Geological Survey s work is owned by the Natural Environment Research Council (NERC) and/or the authority that commissioned the work. You may not copy or adapt this publication without first obtaining permission. Contact the BGS Intellectual Property Rights Section, British Geological Survey, Keyworth, ipr@bgs.ac.uk. You may quote extracts of a reasonable length without prior permission, provided a full acknowledgement is given of the source of the extract. Maps and diagrams in this book use topography based on Ordnance Survey mapping. NERC All rights reserved Keyworth, Nottingham British Geological Survey 2015
4 CR/15/120; Draft 0.1 Last modified: 2016/03/24 15:17 BRITISH GEOLOGICAL SURVEY The full range of our publications is available from BGS shops at Nottingham, Edinburgh, London and Cardiff (Welsh publications only) see contact details below or shop online at The London Information Office also maintains a reference collection of BGS publications, including maps, for consultation. We publish an annual catalogue of our maps and other publications; this catalogue is available online or from any of the BGS shops. The British Geological Survey carries out the geological survey of Great Britain and Northern Ireland (the latter as an agency service for the government of Northern Ireland), and of the surrounding continental shelf, as well as basic research projects. It also undertakes programmes of technical aid in geology in developing countries. The British Geological Survey is a component body of the Natural Environment Research Council. British Geological Survey offices BGS Central Enquiries Desk Tel Fax enquiries@bgs.ac.uk Environmental Science Centre, Keyworth, Nottingham NG12 5GG Tel Fax sales@bgs.ac.uk Murchison House, West Mains Road, Edinburgh EH9 3LA Tel Fax scotsales@bgs.ac.uk Natural History Museum, Cromwell Road, London SW7 5BD Tel Fax Tel /45 bgslondon@bgs.ac.uk Columbus House, Greenmeadow Springs, Tongwynlais, Cardiff CF15 7NE Tel Fax Maclean Building, Crowmarsh Gifford, Wallingford OX10 8BB Tel Fax Geological Survey of Northern Ireland, Colby House, Stranmillis Court, Belfast BT9 5BF Tel Fax Parent Body Natural Environment Research Council, Polaris House, North Star Avenue, Swindon SN2 1EU Tel Fax Website Shop online at
5 This report is for information only it does not constitute legal, technical or professional advice. To the fullest extent permitted by law The British Geological Survey shall not be liable for any direct indirect or consequential loss or damage of any nature however caused which may result from reliance upon or use of any information contained in this report. Requests and enquiries should be addressed to Alison Monaghan, 21CXRM Palaeozoic Project Leader, Foreword This report is a published product of the 21st Century Exploration Road Map (21CXRM) Palaeozoic project. This joint industry-government-bgs project comprised a regional petroleum systems analysis of the offshore Devonian and Carboniferous in the North Sea and Irish Sea. Mike Millar (BG Energy Holdings Limited), Carla Riddell (Centrica) and Mal Gall (OGA) are thanked for technical review of this report and associated digital data. Contents Foreword... i Contents... i Summary... iii 1 Introduction Outputs overview Technical details and data preparation Data types and sources Data preparation Curve interpretation method Incorporation of core porosity and permeability measurements Volume of clay curve (V CL ) Coal identification curve (V Coal ) Porosity curves Permeability estimation curve Outputs & results Interpreted curves Net to gross Average porosity and range average Estimated permeability and range Summary of petrophysical results Summary of core porosity-permeability data Maps summarising petrophysical result (in Table 1) i
6 5 Conclusions Appendix 1 Log plots Appendix 2 Core and curve data used for permeability estimations Depth shifts applied to core data Cross plots and summary statistics of relationships used for permeability estimations Appendix 3 Porosity versus depth plots PHIE versus depth for all wells, all formations Core porosities vs depth for all wells, all formations PHIE vs depth by formation: Appendix 4 Table of well information and log quality and interpretation comments Appendix 5 Copy of stratigraphic chart References FIGURES Figure 1 Map of the wells selected for the petrophysical study... 4 Figure 2 Cross plot of core porosity and permeability measurement data by formation for the wells examined TABLES Table 1 Results of petrophysical calculations listed by formation for each well (Table notes and units are listed on previous page) Table 2 Summary of digitised core porosity-permeability measurement data by formation, for the wells studied petrophysically Table 3 Synthesis of petrophysical results (data in Table 1& Table 2) by formation Table 4 Synthesis of petrophysical results (data in Table 1) by well Table 5 Depths shifts applied to core porosity and permeability data Table 6 Summary statistics of core porosity curve porosity relationships (Section 3.5 summarises the method) Table 7 Summary statistics of core porosity permeability relationships (Section 3.5 summarises the method) Table 8 Table of well information and log quality and interpretation comments ii
7 Summary This report details the reservoir evaluation of 12 wells across the Devonian-Carboniferous rocks of the UK Central North Sea for the 21CXRM Palaeozoic project. A companion report examines the source rock potential (total organic carbon content) of the non-reservoir intervals (for a different, but overlapping set of wells) (Gent, 2015). This reservoir evaluation is based on the petrophysical interpretation of available digital wireline log curve data for the 12 wells and digitised core porosity and permeability data (1 to 281 measurements available for 7 of the 12 wells) across the Devonian-Carboniferous interval (according to reinterpreted stratigraphic formations defined and correlated for this project, documented Kearsey et al. (2015). Outputs of this part of the project include continuous (along borehole) interpretations of porosity, clay volume, coal presence, and include basic permeability estimations where sufficient data exists to generate these. These interpreted curves were used to calculate Net to Gross (NTG) values and average porosities and permeabilities for each formation in each well analysed. The Yoredale and the Scremerston formations appear to have the most favourable reservoir properties in terms of porosity (up to 19% and 15% respectively), and permeability (up to md and md respectively). However, they have relatively low NTG values (0.27 & 0.18 respectively). The Fell Sandstone Formation has the greatest NTG of the intervals examined (0.61), but porosity and permeability values are lower (0.13 and 42.69mD are the greatest average values from the wells examined). All these reservoirs show heterogeneous character in the geophysical log response, with reservoir intervals interbedded with non-reservoir. Other reports document the stratigraphic extent of these units (e.g. Kearsey et al., 2015). Note that given the limited number of wells examined and the regional scale of the project, more detailed study of the reservoirs including mapping property trends and identifying prospective intervals was out of scope of this project. A brief examination of the distributions of net to gross and average porosities, both by formation in each well and for the total Devonian-Carboniferous interval in each well was not able to highlight any particular property trends or geographic areas with favourable properties. iii
8 1 Introduction The 21CXRM Palaeozoic project aimed to stimulate exploration of the Devonian and Carboniferous plays of the Central North Sea - Mid North Sea High - Moray Firth - East Orkney Basin and in the Irish Sea area. The objectives of the project included regional analysis of the plays and building of consistent digital datasets, working collaboratively with the OGA, Oil and Gas UK and industry. The project results are delivered as a series of reports and as digital datasets for each area. This report describes the methodology and results of a quick-look regional-scale petrophysical study of reservoir quality in the Central North Sea study area. Given this nature of the study, and the time & resources available for it, a full rigorous petrophysical interpretation of each well examined was not within scope. This is explained in the report and should be borne in mind when examining the outputs and results. 1.1 OUTPUTS OVERVIEW 1. Continuous digital interpreted curves across the Devonian-Carboniferous intervals for 12 wells in the CNS (method Section 2.2, 5 describes the selection process). Interpreted from geophysical log responses using Interactive Petrophysics software (IP TM, Version , LR-Senergy) Analysis for: Volume of clay(v CL ) Coal intervals (V COAL ) Porosity (PHIE & PHIT) Permeability estimate (PermEst) 2. Summary petrophysical results (based on interpreted curves (1.)) for the Devonian- Carboniferous interval by formation in each well Gross thickness Net* Net to Gross Average porosity (across the net intervals) Thickness of coals (across the gross interval) * Reservoir definition (i.e. Cut offs to derive Net ) o Porosity greater than 5% (PHIE>0.05) o Clay volume less than 50% (V CL <0.5) o No coal intervals (V COAL =0) 3. Digitised core-sample-derived basic porosity-permeability measurement data for the majority of wells in Quadrants that have Devonian-Carboniferous intervals and core reports available. Available as an Excel spreadsheet. 1
9 2 Technical details and data preparation This section outlines the data types, sources of data and preparation required prior to the petrophysical interpretation of selected wells in the Central North Sea. 2.1 DATA TYPES AND SOURCES A number of data types and sources were required for or contributed to the petrophysical interpretation: Digital geophysical log curve data, mainly in LAS format (or sometimes LIS or DLIS) were downloaded from CDA for the project (under licence), some BGS legacy data was also used. Scanned company reports downloaded from CDA, mainly in PDF format: o Composite logs used to check well location, depths, curves scales, spliced intervals etc Tabulated core porosity and permeability data (digitised for this project from PDFs of core reports or well completion reports on CDA). Generally the values used and referred to in this report represent helium porosity and horizontal permeability to air. Grain density was not recorded. Note that the laboratory and drying methods used were not always stated and associated data e.g. from Special Core Analysis (SCAL) reports was not generally recorded. The digitised dataset of core data (#3 listed in the outputs overview, Section 1.1) does contain some vertical permeability measurements and also instances of permeability to brine and klinkenberg corrected permeabilities (to give liquid permeability estimation) where these were listed in the core reports in addition to the horizontal air permeabilties. However these have not been included in the tabulated data in this report or used in the core-log interpretation. Stratigraphy: o Well tops, interpreted by BGS for this project (Kearsey et al., 2015). These were checked with or re-interpreted from the digital composite log well tops DECC composite tops, supplied from DECC/BGS database). Cored intervals based on BGS digital core-holdings database query. This was used to indicate core locations on log plots to help to distinguish intervals where data was derived from core, or from, for example, side wall cores or cuttings (particularly for the total organic carbon (TOC) study (Gent, 2015). 2.2 DATA PREPARATION The software used for the petrophysical interpretation was Interactive Petrophysics (IP TM, Version , Seneregy LR software, used under licence). Steps to select the study wells, import and prepare the data are described: 1. Digital geophysical log curve data were copied to IP TM from ODM TM (Senergy well manager software, used for the BGS correlation and re-interpretation of the stratigraphy). 2
10 2. The BGS-re-interpreted stratigraphy was loaded into IP for the wells it was available for (reformatted from the ODM-exported.xls file of the formation intervals) 1 3. BGS-digitised core porosity and permeability data was loaded into IP for the wells it was available for (reformatted from the BGS-digitised tabulation of data for all wells) 1 4. The cored intervals were loaded into IP for the wells it was available for (tops and bases, reformatted from the output of the BGS core database) 5. Wells to interpret were selected based on the length of Devonian-Carboniferous interval, stratigraphic intervals and geographic areas covered, and the availability and quality of suitable data over the interval. Figure 1 shows the location of the wells that were selected. The following list indicates the factors taken into consideration in their selection and the number of wells they apply to (listed by well in Table 8): Greater than 100m of Devonian-Carboniferous section ( m for the wells selected) Updated stratigraphy picked (12 of the 12 selected) Geophysical log curve data for reservoir evaluation, with suitable data quality (variable for each well) (see Appendix 4, Table 8) Core poroperm data available (6 of the 12 selected) TOC/VR data (8 of the 12 selected, to allow overlap in selection of wells between the reservoir and source rock interpretations) Company log composite available for cross checking data (12 of the 12 selected) Note that wellbore deviation surveys were not taken into account because the data is presented against measured depth (MD). Well 43/21-2 in particular is deviated up to around 30 deviation by the bottom of the Devonian-Carboniferous section. This may affect the relative thicknesses of intervals in those wells (but not their average properties). Well 37/10-1 is also noted as deviated, but negligibly so. 1 Note that this data was checked and reloaded throughout the process as more data was interpreted or digitised. Given the project time-constraints, these tasks were to a large extent performed simultaneously. 3

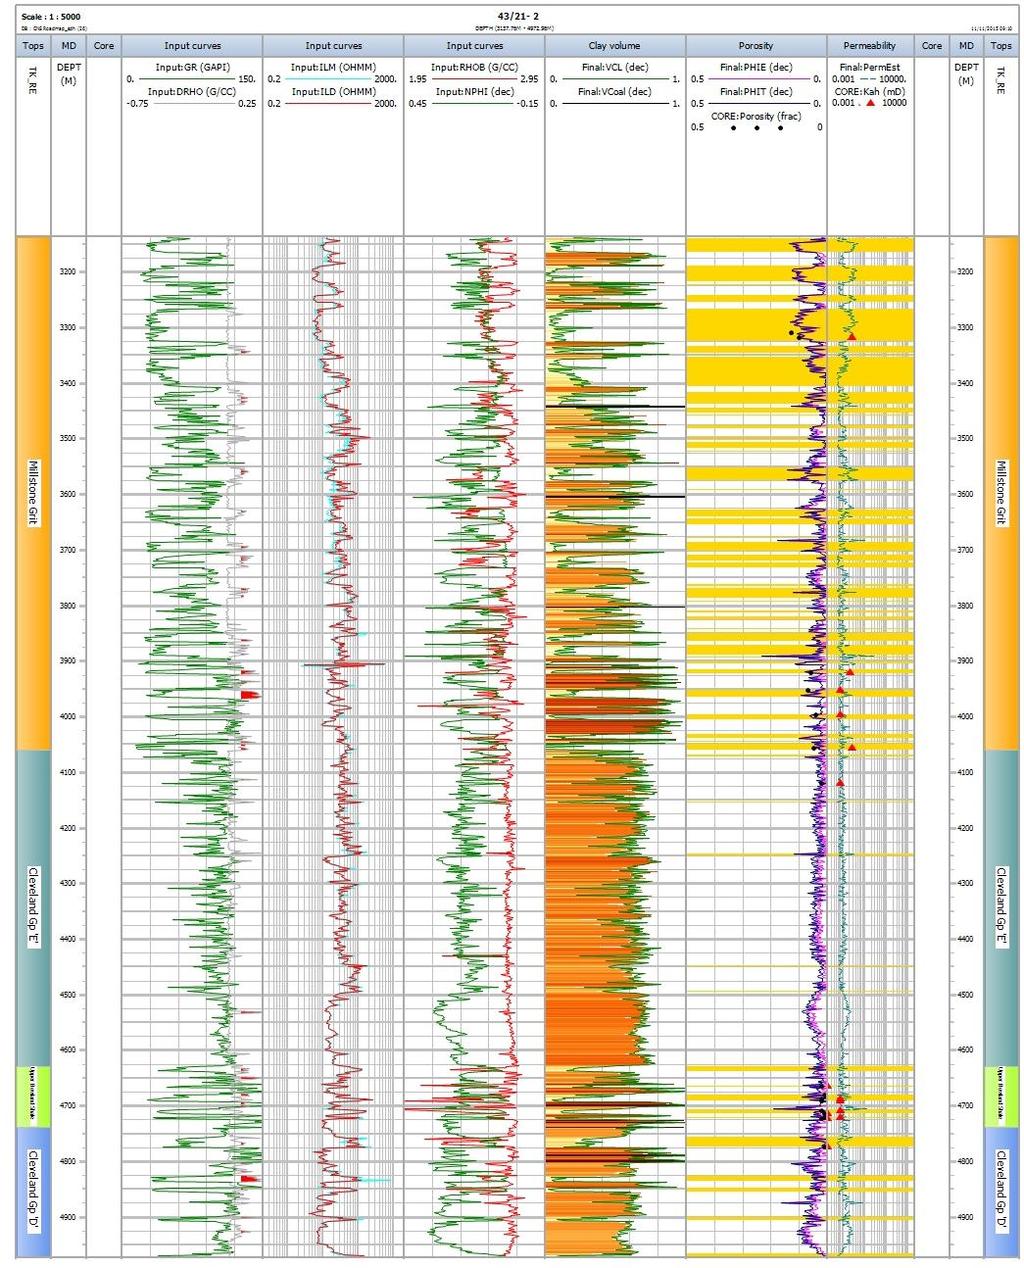
11 Figure 1 Map of the wells selected for the petrophysical study 4
12 3 Curve interpretation method Continuous interpreted curves were calculated from geophysical log responses over the Devonian-Carboniferous interval using Interactive Petrophysics software (IP TM, Version , LR-Senergy). Where available, core data was used to guide parameter selection. Given the quick-look and regional nature of this study, some broad assumptions were necessary for the log interpretation. These include the temperature gradient (35 C/km with a surface temp of 8 C was used, based on southern North Sea trends. This is broadly in line with those in the Basin modelling report: Vincent, 2015), likely mud type (water based mud was assumed, which may affect the output porosities), and that suitable environmental corrections had already been applied to logs. Table 8, Appendix 4 includes some quality control comments and assumptions for individual wells. 3.1 INCORPORATION OF CORE POROSITY AND PERMEABILITY MEASUREMENTS Core data was not available for all wells (see Table 8), or all reservoir intervals, but where it was available, core porosity measurements were displayed with the log porosities for comparison and to guide interpretation parameter selection (Section 3.4). Core porosity and permeability measurements were used to derive permeability estimation curves (Section 3.5). Core data is displayed on the log plots in Appendix 1. The usual procedure for matching core and log porosities on a field - scale would be to first depth shift the core to the logs and then correct the core measurements for downhole in-situ conditions (ideally using SCAL (Special Core Analysis Laboratory) data which includes measurements with different fluid phases and different confining pressures, for example, to understand the degree of overburden stress correction to apply). The log porosities could then be robustly calibrated to core porosity measurements, before using them (and potentially other logs) as permeability predictors. Usually a detailed knowledge of depositional environment and reservoir heterogeneity would allow appropriate statistical methods to be selected to define permeability predictors for each identified reservoir unit. However, in the tables of core porosity measurements digitised for this regional-scale project, details about core treatment, depth shifts to apply and the measurement method(s) were not generally captured. Therefore, within this report scope, the usual steps to correct the core data described above are not fully implemented (Table 2 summarises the core data available for the wells studied; Table 5, Appendix 2, lists the wells for which a core-depth-shift was possible to determine). These, together with the notes below, explain the limits to the possible match between log and core porosity that could be achieved. Other points of note for log-core matching include: Sample scale - the vertical resolution of geophysical logs are much larger than the few centimetres-across core samples retrieved. Thus in very heterogeneous formations, average log response over an interval may be very different to the point data measurements on core; Core treatment history - core porosity measurements (once shifted and corrected) generally fall between total and effective porosities, depending on the measurement method and also what was done to prepare it e.g. the degree of cleaning and drying processes applied prior to measurement. Permeability measurements from sidewall core samples (well 43/21-1) of sandstones are generally considered to less be valid than full cores as a result of drilling mud contamination (because of their smaller size relative to conventional core, which may have mud damage around the outsides). However, in this 5
13 case, because of the low permeabilities measured in this well, mud may have penetrated less far into the samples and so they may be valid. Comparisons of core-measured and log-interpreted porosities are shown graphically in Appendix 2 along with graphs showing core-measured porosity against core-measured permeability. Tables 5 & 6 show the relationships derived from these graphs (where they were possible to derive). 3.2 VOLUME OF CLAY CURVE (V CL ) A Volume of Clay (V CL ) curve was interpreted for each well. This gives a continuous, geophysical log-derived volume of clay for the intervals investigated. Input curves were the Gamma Ray (GR) and a combination of the Neutron, Density and Sonic curves where available and of good quality. These curves were used to select end points representing 0% clay and 100% clay for zones of the log, subdivided based on changing log character and curve responses with depth, to create a V CL log scaled from 0 (100% clean reservoir) to 1 (100% clay). Note that data on clay types (for example, evidence of tuffaceous beds) in individual wells or intervals of interest were not explored. This quick-look, regional scale study interpretation of clay volume is based on curve responses only. The V CL logs were used in combination with other curves to identify appropriate reservoir cuts off for the calculation of Net to Gross values for the main reservoir formations (section 4.2). 3.3 COAL IDENTIFICATION CURVE (V COAL ) A coal identification curve (V COAL ) curve was interpreted for each well, where coal indicated = 1, no coal indicated = 0. This gives an indication of whether coal is thought to be present at each depth, based on the log response, and certain cut off values. The cut off values selected were based on a combination of the log responses where the composite log lithology track indicated coal to be present, together with a visual evaluation of curve response with knowledge of expected responses expected in coal and other minerals. Thus slightly different cut offs were used in each well (Table 8, Appendix 3). The V COAL logs were used in combination with other curves to identify appropriate reservoir cut offs for the calculation of Net to Gross values for the main reservoir formations (section 4.2). 3.4 POROSITY CURVES Porosity curves were interpreted for each well. Input curves included the V cl curves (section 3.2), Neutron, Density and Sonic curves. (Resistivity and Photoelectric Factor curves were used as visual aids to interpretation where required and data appeared to be reading within expected ranges). Areas of poor log quality were identified using primarily the Density Correction and Caliper curves (Table 8, Appendix 4). Effective Porosity (PHIE) and Total Porosity (PHIT) curves were computed using the Neutron Density method*. Where Density or Neutron data was unavailable, or its quality was poor, porosity was calculated using the sonic curve. These computations take into account tool measurements and interpretations of clay, mud filtrate and rock matrix properties. Where sufficient data was available, core porosity measurements were used to guide parameter selection, see Section 3.1. *Using IP variable matrix density logic. IP solves the tool response equations for PHIE (corrected for wet clay volume). PHIT is then back-calculated by adding back in the clay bound water. Intervals that required sonic porosity calculations utilized the Wyllie equation. The PHIE logs were used in combination with other curves to identify appropriate reservoir cut offs for the calculation of Net to Gross values for the main reservoir formations (section 4.2). 6
14 3.5 PERMEABILITY ESTIMATION CURVE A permeability estimation was derived for the wells for which appropriate core data was available (Section 3.1). The estimates were based on the relationships between core porosity and log porosity, and core porosity and permeability where data was available and a relationship was found to exist. The same statistical method to examine these relationships was used for each well, as follows: Because insufficient data often existed to depth shift the core to the logs, the RMA (reduced major axis) method of regression was chosen to describe any relationship between core and log porosity to attempt to minimise depth matching errors. The Robust Fit method was used to calculate the regression line in the core porositypermeability data, because this reduces the effect of outliers in the dataset. This method minimises the sum of the errors in the Y (permeability) direction, rather than the square of the distances (as is the case with the ordinary Least Squares regression method). The resulting curve was clipped at 10,000 md, to remove any spuriously high permeability values (applied to well 26/07-1 and 41/01-1). As explained in Section 3.1, on a hydrocarbon field scale, the normal procedure to derive permeability curves would be more detailed than the method applied here. The permeability estimations here should therefore be regarded as a broad indicator of possible permeability fluctuations with depth and not as absolute values. 7
15 4 Outputs & results 4.1 INTERPRETED CURVES Continuous curves for 12 wells in the CNS were interpreted using Interactive Petrophysics software (IP TM, Version , LR-Senergy) and the methods described in section 3. Curve data were clipped to the Devonian-Carboniferous interval. Any small data gaps were filled (to allow software calculation of Net to Gross and curve averages, sections ). Note that in many cases the base of the Devonian-Carboniferous interval was not penetrated. Continuous curves produced were: Volume of Clay curve (V CL ); Coal Identification curve (V COAL ); Effective Porosity curve (PHIE); Total Porosity curve (PHIT) ; For some wells a curve of Estimated Permeability (PermEst) exists. Core data tables are available in Excel form. Plots of data for each well are available as a quick-look output in Appendix 1. (Note that the input data is also displayed in these plots, but is not provided as an output due to data permission constraints). 4.2 NET TO GROSS Net to Gross (NTG) in this report gives an indication of the amount of reservoir (Net) within an interval of interest (Gross). It is expressed as a fraction from 0 to 1, where a NTG of 0 means that no reservoir has been interpreted within the of interval and a NTG of 1 means that all of the rock within the interval has been interpreted to be composed of 100% reservoir. The NTG equation is shown below. Net to Gross (NTG) = Total thickness of reservoir (net) Total thickness of interval (gross) The total thickness of the interval of interest is the Gross. The Net interval is the sum of the thicknesses of those parts of the reservoir that meet a set of cut-off criteria (applied to one or more curves). These parameters (the cut off criteria that define the Net) will, at the field scale, be based on operator preferences or field observations of reservoir productivity that may be refined through time. However, at this quick-look, regional-scale, generic cut-offs have been applied to give a broad indication of the Net where: Clay volume is less than 50% (i.e. where V CL <0.5); Porosity is more than 5% (i.e. where PHIE > 0.05); No coal intervals are identified (i.e. where V COAL = 0). Note that permeability cut offs were not applied, due to the roughly-estimated nature of the derived curves and because they were not available for every well. NTG values were calculated for each stratigraphic unit in each well (and by stratigraphic unit (for all wells) and by well (for all stratigraphic units)). 4.3 AVERAGE POROSITY AND RANGE Average porosities and ranges were calculated for each stratigraphic unit in each well. These are based on arithmetic average calculations and curve statistics of the interpreted effective porosity (PHIE) curve (section 3.4) over the intervals defined as net reservoir (Net: see NTG, section 4.2). 8
16 4.4 AVERAGE ESTIMATED PERMEABILITY AND RANGE Given the nature of the permeability estimations, simple averages and ranges found over the stratigraphic units investigated for the wells studied are given, based on the estimated (PermEst) curve (Section 3.5) for the intervals defined as net reservoir (Net: see NTG, section 4.2). 4.5 SUMMARY OF PETROPHYSICAL RESULTS Summary results (based on interpreted curves, Section 4.1) are given for the whole Carboniferous interval and by individual formation in each well. These are shown plotted on maps in Section 4.7. Main reported results are highlighted in bold type. Table 1 Notes: All depths and thicknesses are in metres. Colours on the left side of the table refer to the standard colours of the stratigraphic units used throughout this project; Colours on the right side of the table are used to help highlight the maximum and minimum values in each column or set of columns. In general the colours are scaled from the highest value shown as brightest green, shading to the lowest value shaded in darkest red, grading midway through yellow, set as the 50 percentile value. Columns for Gross, Net and NTG are scaled as individual columns. The three porosity columns are scaled together, as are the three permeability columns. The right-most column (COAL*h) is scaled in reverse (highest value is red, lowest value is green); No deviation logs were loaded for this study (they are presented in measured depth (MD) along the borehole) and formation dip is not taken into account. Therefore thickness of intervals in Table 1 is the interval along the borehole that they can be recognised. This is not necessarily their true stratigraphic thickness (depending on formation dip and borehole deviation). (Note that only wells 37/10/1 and 43/21-2 are recorded as deviated, the former being negligibly so). 1 Note that the base of the Devonian-Carboniferous succession is not penetrated in most wells. (i.e. a small Gross value does not necessarily mean thin Devonian-Carboniferous rocks). The stratigraphic intervals for which this applies is indicated by nb (no base) in the Gross column. 2 Section 4.2 describes the curve cut-offs used to define Net. 3 Net to Gross, described in Section 4.2. See also note 1. 4 Effective porosity (PHIE). Section 3.4 describes the method of deriving the porosities curves. Average is arithmetic average. Average, Minimum and Maximum values are over the Net intervals only, see note 2. Expressed as a fraction. 5 Estimated permeability (PermEst) Section 3.5 describes the method of deriving the permeability curves. Average is arithmetic average. Average, Minimum and Maximum values are over the Net intervals only, see note 2. Units are milidarcies (md). 6 Total thickness of coal in the interval. Section 3.3 describes the coal identification method. 9
17 Stratigraphic unit name Well Time-equivalent Top Base Gross 1 Net 2 NTG 3 Average PHIE PHIE Average PermEst PermEst COAL name for maps PHIE 4 Min 4 Max 4 PermEst 5 Min 5 Max 5 *h 6 Grensen Formation 39/07-1 Grensen Millstone Grit Formation 43/21-2 Millstone Yoredale Formation 36/13-1 Yoredale nb Yoredale Formation 39/07-1 Yoredale Yoredale Formation 41/01-1 Yoredale Yoredale Formation 42/10a- 1 Yoredale nb Cleveland Gp 'E' 43/21-2 Yoredale Upper Bowland Shale 43/21-2 Yoredale Cleveland Gp 'D' 43/21-2 Yoredale nb Scremerston Formation 26/07-1 Scremerston Scremerston Formation 38/18-1 Scremerston Scremerston Formation 39/07-1 Scremerston nb Scremerston Formation 41/01-1 Scremerston Scremerston Formation 42/15A- 2 Scremerston Scremerston Formation 44/02-1 Scremerston Fell Sandstone Formation 26/07-1 Fell Fell Sandstone Formation 41/01-1 Fell Fell Sandstone Formation 42/15A- 2 Fell nb Fell Sandstone Formation 44/02-1 Fell Cementstone Formation 41/01-1 Cementstone nb Cementstone Formation 44/02-1 Cementstone Tayport Formation 37/10-1 Devonian Tayport Formation 44/02-1 Devonian Buchan Formation 30/23a- 3 Devonian nb Buchan Formation 37/10-1 Devonian nb Buchan Formation 37/12-1 Devonian Kyle limestone 37/12-1 Devonian nb Table 1 Results of petrophysical calculations listed by formation for each well (Table notes and units are listed on previous page) 10
18 Core permeability (md) Conventional core Rotary side wall core Number of points Core type Depth of top core measurement (m) Depth of bottom core measurement Average Minimum Maximum Average Minimum Maximum 4.6 SUMMARY OF CORE POROSITY-PERMEABILITY DATA Porosity and permeability data, measured from core samples is available as an Excel spreadsheet, contained within the digitised output dataset. Note that these measured values are against depth, and not by formation. However, for the subset of those wells that petrophysical interpretation was made, the core data has been assessed by formation. This is summarised in Table 2 and shown graphically in Figure 2, for all measurement data points (Note: the petrophysical data in Table 1 are displayed for the Net intervals only). Core porosity (fraction) Permeability (Kair, md) Well Formation Millstone Grit Cleveland Group E /21-2 Upper Bowland Shale Cleveland Group D /01-1 Yoredale /10a- 1 Yoredale /07-1 Scremerston /15a- 2 Scremerston /01-1 Fell Buchan /12-1 Kyle Table 2 Summary of digitised core porosity-permeability measurement data by formation, for the wells studied petrophysically Core porosity (fraction) Millstone Grit Cleveland Group E Upper Bowland Shale Cleveland Group D Yoredale Scremerston Fell Buchan Kyle Figure 2 Cross plot of core porosity and permeability measurement data by formation for the wells examined. 11

19 4.7 MAPS SUMMARISING PETROPHYSICAL RESULT (IN TABLE 1) Indication of Gross and Net thickness for whole Devonian-Carboniferous interval for each well Height of bars indicate the relative thickness of Carboniferous - Devonian rocks in each well (see Table 1, Note 1 about measured depth thickness versus true stratigraphic thickness, and note 2 about how Net was defined). 12


20 4.7.2 Calculated Net to Gross for whole Devonian-Carboniferous by well Calculated average porosities for whole Devonian-Carboniferous by well 13


21 4.7.4 Grensen & Millstone Grit properties Time equivalent interval referred to is shown on the stratigraphic column Appendix 5. M= Millstone Grit, G = Grensen Yoredale properties Time equivalent interval referred to is shown on the stratigraphic column Appendix 5. 14


22 4.7.6 Scremerston properties Time equivalent interval referred to is shown on the stratigraphic column Appendix Fell properties Time equivalent interval referred to is shown on the stratigraphic column Appendix 5. 15


23 4.7.8 Cementstone properties Time equivalent interval referred to is shown on the stratigraphic column Appendix Devonian properties Time equivalent interval referred to is shown on the stratigraphic column Appendix 5. 16
24 5 Conclusions Quick-look volume of clay (V CL ), coal identification (V COAL ) and effective and total porosity curves were interpreted from geophysical log responses in each of 12 wells across the Central North Sea (Quadrants 25-44). In addition a permeability estimation curve was derived for those wells with suitable core porosity and permeability measurement data. These curves were used to calculate quick-look net to gross (NTG) values and average porosities for the net intervals for each formation in each well. Syntheses of the petrophysical results by formation and by well are shown in Tables 3 & 4 respectively. Given this nature of the study, and the time & resources available for it, a full rigorous petrophysical interpretation of each well examined was not within scope. This is explained in the report and should be borne in mind when examining the outputs and results. The highest average porosities were found in the Yoredale Formation (19%), although it has a relatively low average NTG (0.27). Its highest average permeability estimate was md in one well. The Scremerston Formation had much higher average permeabilities in 1 well (up to 785 md). Porosities were variable, but up to 15% in another well, and net to gross was generally poorer than the Yoredale Formation (Scremerston average NTG 0.18). Highest average NTG values were found in the Fell Sandstone Formation (NTG 0.61), although average porosities and average estimated permeabilities were generally smaller than for those formations previously mentioned (averages up to 13% and 42 md respectively). There may also be potential reservoir in the Devonian Tayport & Buchan formations, as they have moderate NTG (0.49 and 0.48 respectively) and moderate average porosities (13% and 12% respectively). However, from the data examined, little is known about their permeabilities. One well with core data over the Buchan Formation suggests that it may be very low (37/12-1), but another well (with no core data, 37/10-1) has a markedly lower resistivity signature over the Net intervals, compared to 37/12-1, which could be indicative of less cemented, more permeable reservoir. Over these potential formations of interest, log responses suggest that clean good reservoir intervals are heterogeneously interbedded with non-reservoir intervals. Therefore individual reservoir units may be quite thin. Of the wells examined, the Fell Sandstone Formation appears to consistently have the most continuous reservoir intervals (i.e. thickest sand bodies, particularly in well 44/02-1), although the Buchan Formation in well 37/10-1 also appears to have relatively thick reservoir intervals compared other wells and formations. Given the relatively few wells interpreted and the distances between them, it has not been possible to discern any regional trends within the formations (data shown geographically in Section 4.7, some of which is tabulated below, extracted from Tables 1 & 2). 17
25 Formation Log curve (& core) derived (Table 1) NTG Highest Highest Av Av PHI PermEst Core measured (Table 2) Highest Highest Av Av core core perm porosity Grensen Formation Millstone Grit Formation Yoredale Formation Cleveland Gp 'E' Upper Bowland Shale Cleveland Gp 'D' Concluding comments Good porosity, although quite low NTG. Slightly better permeability than Fell (in 2 wells) Scremerston Formation Best permeability (in 1 well, poor in ) Low NTG, but moderate porosity Best NTG, but porosity and Fell Sandstone Formation permeability lower than Yoredale & Scremerston (data from 3 wells) Cementstone Formation Tayport Formation Moderate NTG and porosity, no - permeability data Buchan Formation Moderate NTG and porosity, Core 0.02 data from 1 well, suggests that permeability may be very low Kyle limestone Table 3 Synthesis of petrophysical results (data in Table 1& Table 2) by formation Well Gross Net N/G Average PHIE 26/ /23a / / / / / / /10a /15A / / Table 4 Synthesis of petrophysical results (data in Table 1) by well 18
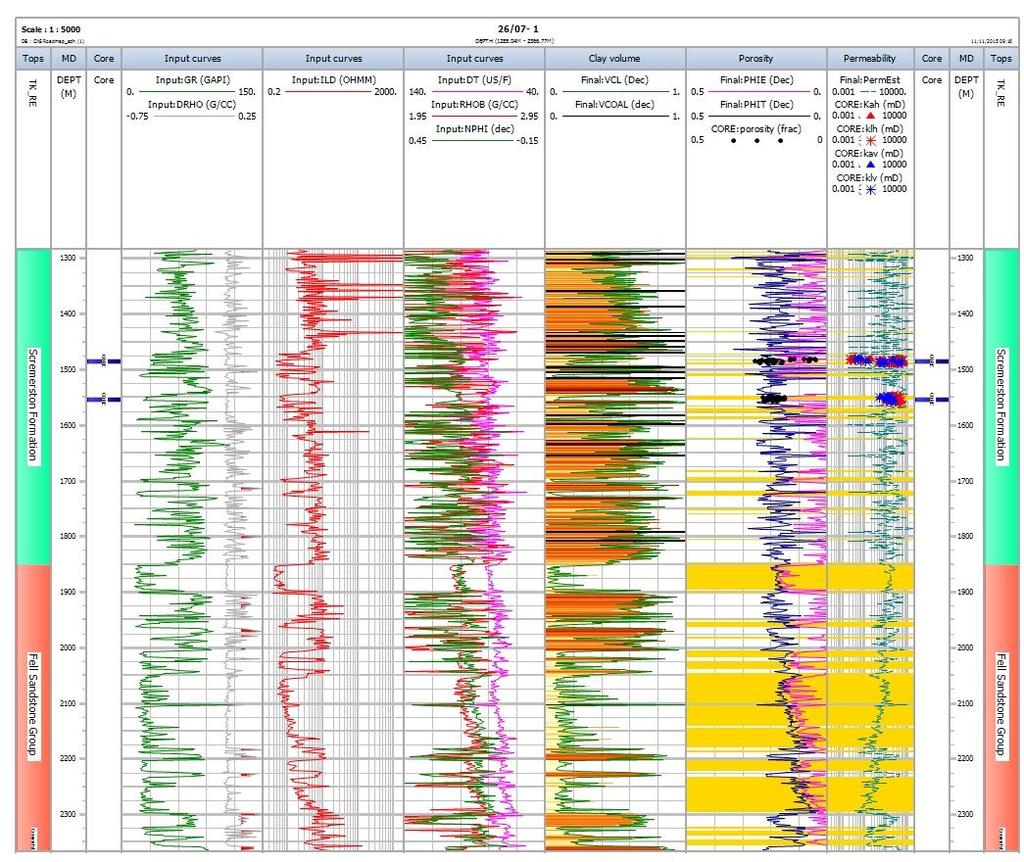
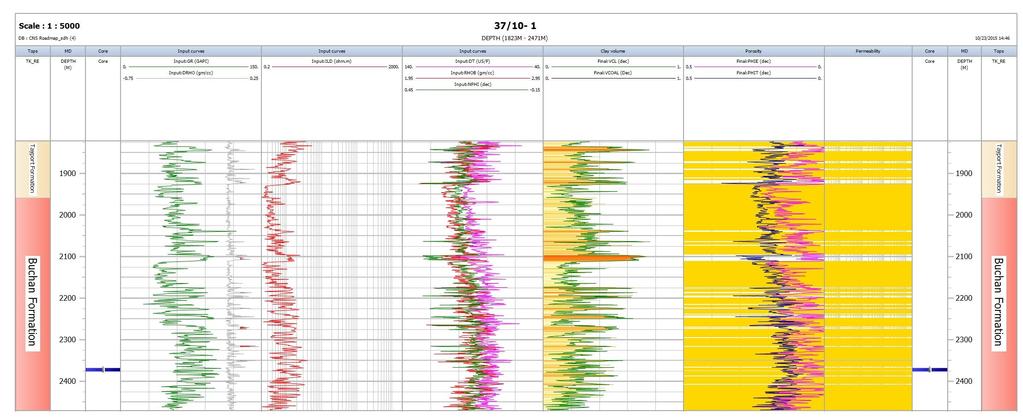
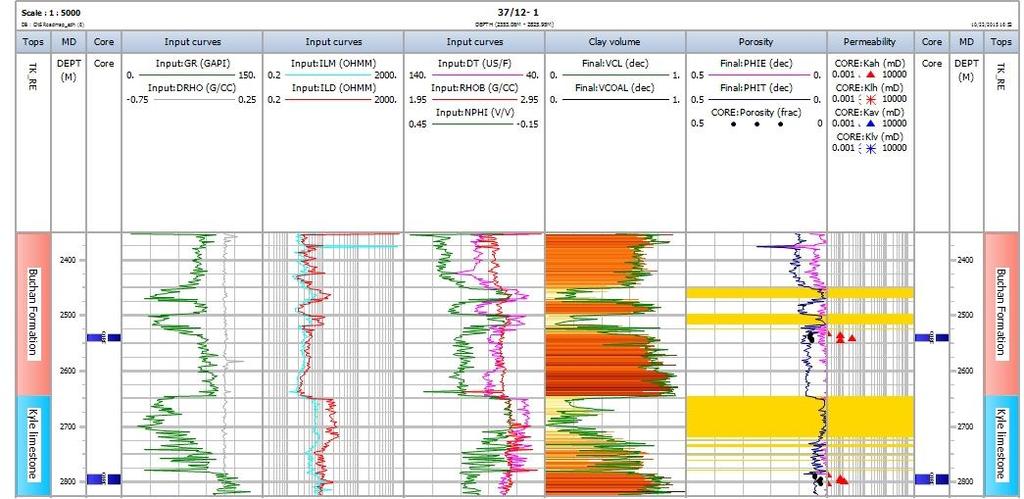
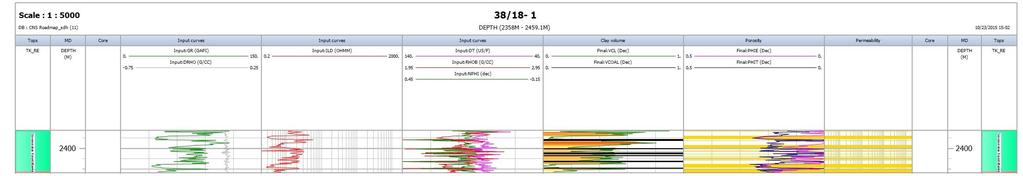
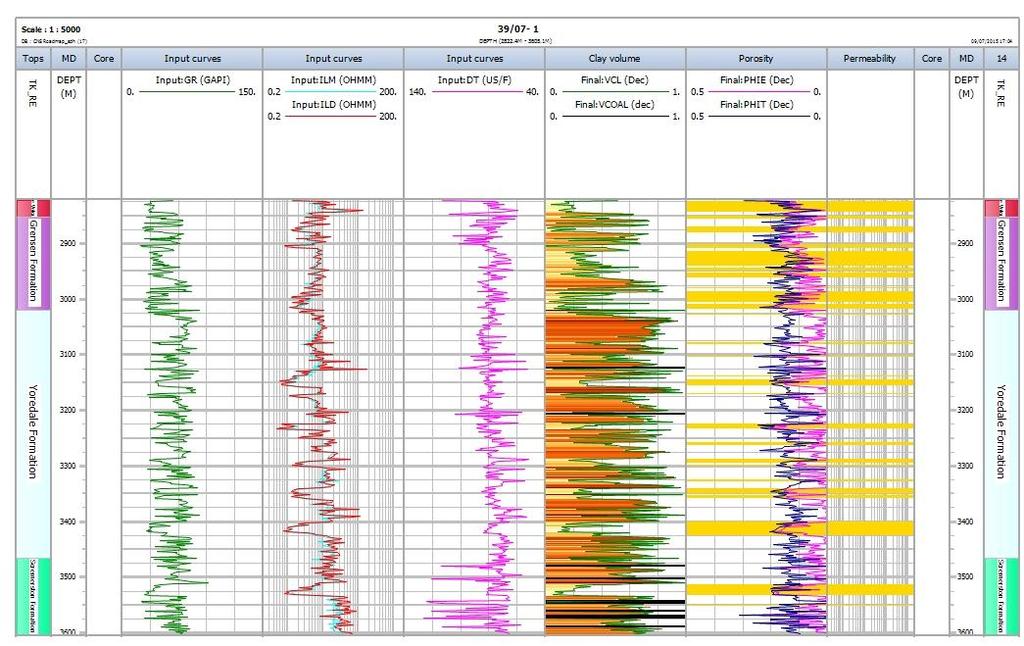
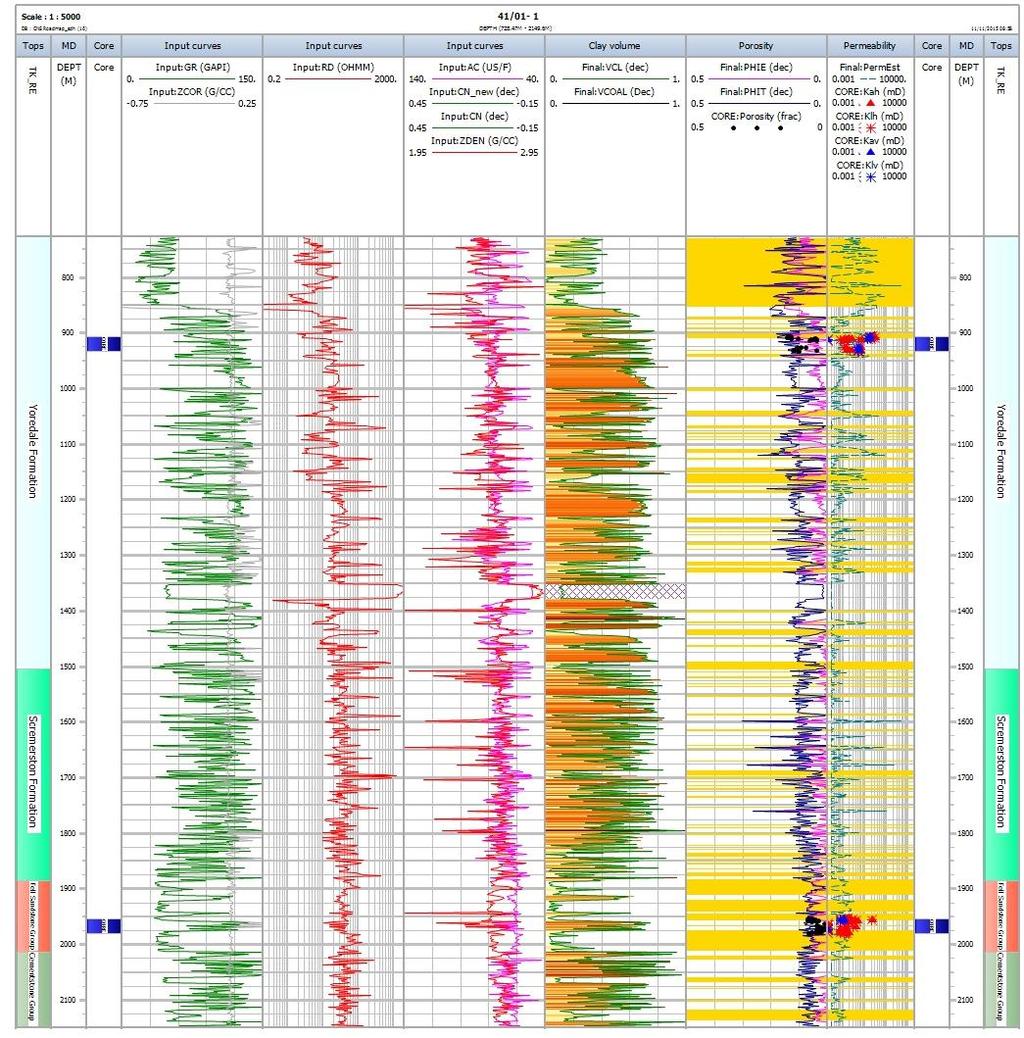
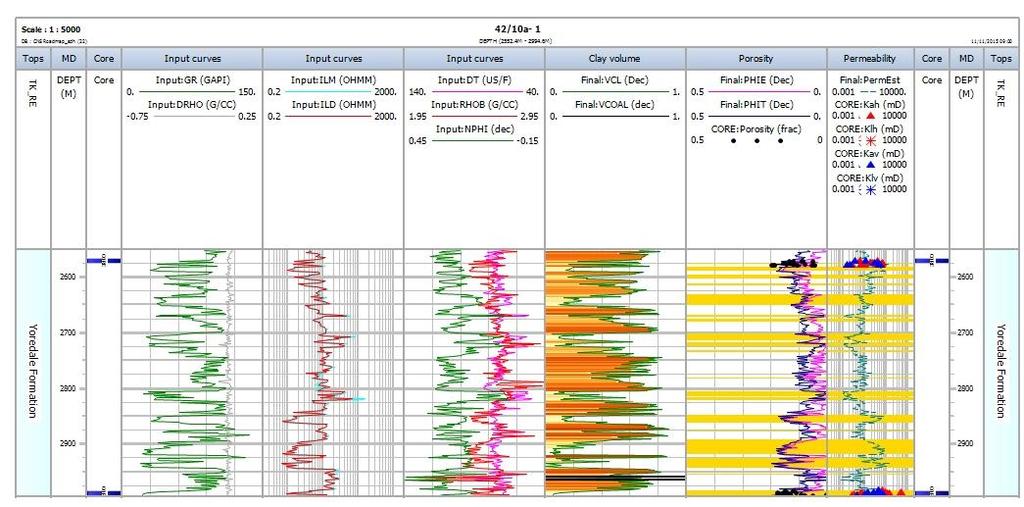
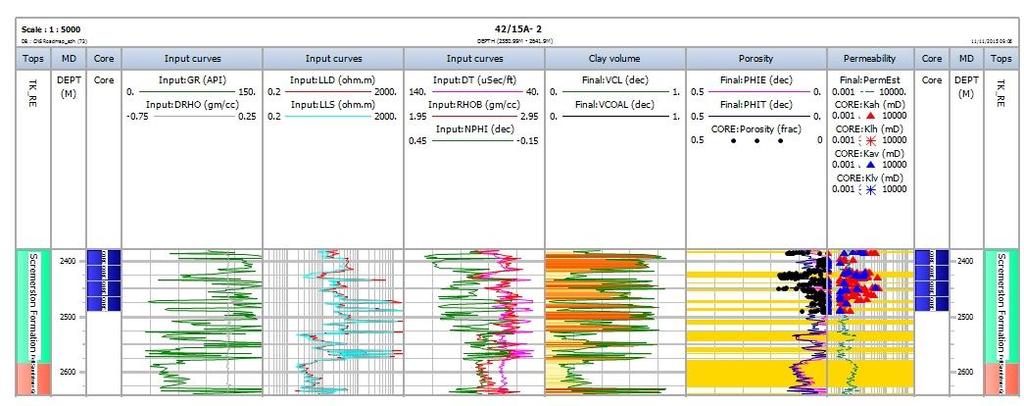
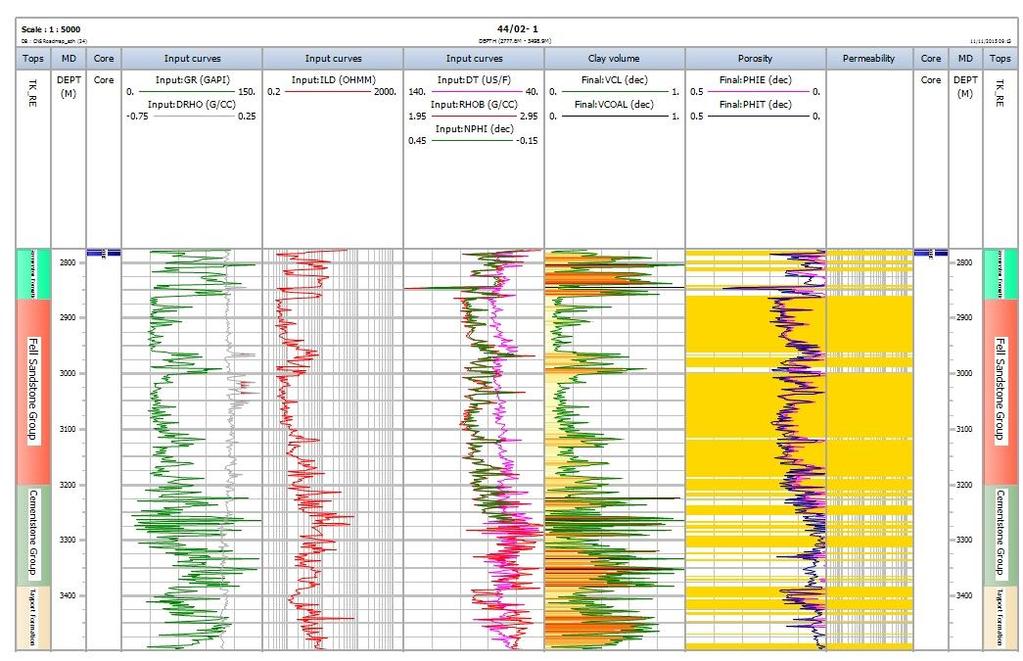
26 Appendix 1 Log plots Log plots from each well interpreted are presented. These are all shown at the same scale (1:5000) to allow some comparison of the thickness of the intervals and to summarise the data available for each well. They are not intended as a definitive output of the interpretation, the digital data is available as a project output for this purpose. Wells are shown in Quadrant block number order. Log plot tracks are explained from left to right here: Track 1 (far left): Stratigraphic intervals, (reinterpreted for this project). Track 2 (1 in from left): Depth in metres, measured depth Track 3 (2 in from left): core intervals (extracted from BGS core database) Tracks 1 to 3 are repeated in the reverse order at the far right of the plot. Track 4: Input curves: Gamma ray (green, e.g. GR) and density correction curve (grey, e.g. DRHO). Red shading indicates where the density correction curve is out of tolerance. This can adversely affect porosity derived from the density curve and so often the sonic or other curves may be used to derive porosity instead (Table 8, Appendix 4 summarises the tolerances and quality of data in each well) Track 5: Input curves: Resistivity curves (red, e.g. ILD, LLD etc) Track 6: Input curves: Porosity curves, sonic (pink, e.g. DT), density (red, e.g. RHOB) and neutron (green, e.g. NPHI) Track 7: Interpreted curves: Clay volume (V CL ) and coal indicator (V COAL ). Variable brown shading helps to highlight cleaner intervals in pale colours and clay-rich intervals in dark brown. Coal intervals are shown in black, as stripes across the full width of the track. Track 8: Interpreted curves: Effective porosity (PHIE), Total porosity (PHIT). Also includes any discrete core porosity data from core reports, where available. Track 9: Interpreted curves: Permeability (PermEst), estimated where sufficient core poro-perm data exists. Also includes discrete permeability data from core reports, where available. Yellow shading across the porosity permeability tracks (8&9) indicates the reservoir intervals (but not the Net). It shows where V CL <0.5 and V COAL =0. Note that intervals with less than 5% porosity are still included in this shaded area, unlike the definition of Net, used in the calculations (Section 4.2). Notes for specific wells: For wells 37/10-1 and 44/02-1, a cored interval is shown, but no core sample porosity or permeability measurement data is available for it. For well 43/21-2 core poroperm data is shown, but no cored interval. This is because the measurements come from rotary sidewall cores. In well 41/01-1 the presence of the Whin Sill is shown by purple hatched shading in track 8. It is removed from reservoir intervals shown by the yellow shading. It does not form part of the Net interval (as its porosity is too low in any case). 19
27 20


28 Raw input data supplied by: 21
29 22
30 23
31 24
32 25
33 26
34 27
35 28
36 29
37 30
38 Appendix 2 Core and curve data used for permeability estimations See section 3.5 for explanations. For some wells, where possible, the core data has been depth shifted to improve the relationship with the log porosity (Table 5). For each well that data was available for, the relationship between core porosity and log porosity, and core porosity core permeability is shown in cross plots. Relationship equations derived from the cross plots and used for the permeability estimation curve (PermEst) are shown together with their statistics (Table 6 and Table 7). DEPTH SHIFTS APPLIED TO CORE DATA Note that these depth shifts were based on comparison between the log and core porosity, rather than using a gamma ray log of the core stick as would be normal hydrocarbon-field-scale procedure. Therefore it was only possible where there was a sufficient density of core data to be able to correlate the two. Well Top depth (m) Bottom depth (m) Core depth shift (m) 26/ /10a /15A Table 5 Depths shifts applied to core porosity and permeability data CROSS PLOTS AND SUMMARY STATISTICS OF RELATIONSHIPS USED FOR PERMEABILITY ESTIMATIONS For each well that data was available for, core porosity is plotted against log porosity (left) and core porosity is plotted against permeability (right). The equations of the lines (where a relationship was found to exists) are summarised in Table 6 and Table 7. In general PHIT was found to give the best match to core porosity (except for 41/01-1). Usually core porosity falls between PHIT and PHIE. Further explanations of potential mismatches can be found in Section

39 WELL 26/07-1 WELL 37/


40 WELL 41/01-1 WELL 42/10A- 1 33

41 WELL 42/15A- 2 WELL 43/
42 # of points Core porosity - Curve porosity (PHI) relationship: RMA method Well Top depth Base depth Comments on core porosity - curve porosity relationship Porosity Curve (Final:PHI) = Relationship Core porosity statistics PHI curve statistics Core porosity points (Core:porosity) = R2 SD Mean Max Min SD Mean Max Min 26/ / / /10a A few points in top core omitted as they match PHIE better than PHIT. PHIE used, because of improved fit to PHIE over PHIT Basal points below 2991m omitted (base of log curves, no core-log match, log data probably spurious Final:PHIT= CORE:porosity= *CORE:por osity 77363*Final:PHIT Final:PHIT= E *CORE:P orosity Final:PHIE = * CORE:Porosity CORE:Porosity= E *Fina l:phit CORE:Porosity = * Final:PHIE Final:PHIT= CORE:Porosity= *CORE:Por osity 70607*Final:PHIT /15A Final:PHIT= CORE:Porosity= *CORE:Por osity 10988*Final:PHIT / Final:PHIT= CORE:Porosity= *CORE:Por osity 09795*Final:PHIT Table 6 Summary statistics of core porosity curve porosity relationships (Section 3.5 summarises the method) 35
43 #of points Well Top depth Base depth 26/ / Equation applied to porosity curve to derive permeability estimator (PermEst) curve 10^( *Final:PHIT) 41/ *Final:PHIE) 42/10a /15A / No poro-perm relationship seen. 10^( ^( *Final:PHIT) 10^( *Final:PHIT) 10^( *Final:PHIT) Core porosity - log of Core permeability relationship: Robust fit method Log of core permeability points (Log (Core:Kah)) = Log(CORE:Kah)= *CORE:porosity Log(CORE:Kah)= *CORE:Porosity Log(CORE:Kah)= *CORE:Porosity Log(CORE:Kah)= *CORE:Porosity Log(CORE:Kah)= *CORE:Porosity Relationship Core porosity points (Core:porosity) = Log(CORE:Kah)= *CORE:poro sity CORE:Porosity= *Log(CORE:Kah) CORE:Porosity= *Log(CORE:Kah) CORE:Porosity= *Log(CORE:Ka h) CORE:Porosity= *Log(CORE:Kah Table 7 Summary statistics of core porosity permeability relationships (Section 3.5 summarises the method) Core porosity statistics Log of core permeability stats R2 SD Mean Max Min SD Mean Max Min
 versus depth (m) plots are coloured by well (12 wells, see section 4.5).")
44 Appendix 3 Porosity versus depth plots These are included to show the data spread versus measured depth (m). The Log interpreted porosity (PHIE) versus depth (m) plots are coloured by well (12 wells, see section 4.5). Data points are filtered to show only those points for which clay volume is less than 50% (V CL <0.5) and there are no coals present (V COAL = 0), i.e. similar to the net reservoir definition (but without the removal of porosities less than 5%). The core porosities versus depth plot is coloured by formation and shows all core points (for the 7 wells, see section 4.6). (For information on the structure of the area and basin history, please refer to the relevant project reports Arsenikos et al., 2015, report CR/15/118; Kimbell & Williamson, 2015, report CR15/119; Vincent, 2015, report CR/15/122). PHIE VERSUS DEPTH FOR ALL WELLS, ALL FORMATIONS CORE POROSITIES VS DEPTH FOR ALL WELLS, ALL FORMATIONS Measured depth (m) Core porosity (fraction) Millstone Grit Cleveland Group E Upper Bowland Shale Cleveland Group D Yoredale Scremerston Fell Buchan Kyle

45 PHIE VS DEPTH BY FORMATION: GRENSEN & MILLSTONE GRIT 38

46 PHIE vs DEPTH: YOREDALE 39

47 PHIE vs DEPTH: CLEVELAND GROUP E, UPPER BOWLAND SHALE, CLEVELAND GROUP D 40

48 PHIE vs DEPTH: SCREMERSTON 41

49 PHIE vs DEPTH: FELL 42

50 PHIE vs DEPTH: CEMENTSTONE 43

51 PHIE vs DEPTH: TAYPORT, BUCHAN, KYLE 44
52 New strat Core data Composite Rock Eval TOC points Vr Points Gamma Ray (GR) Resistivity Sonic, DT (S) Density (D) Neutron (N) Clay vol:gr Clay vol:nd Clay vol:ds Poro: ND Poro: D Poro: S Appendix 4 Table of well information and log quality and interpretation comments Well Selection process Curves available Curves used for V cl and poro Cut off values for V COAL D N S Interpretation/data quality comments for report. Notes: Tension curves were generally not available (because the files were composites). It was assumed that appropriate borehole corrections had already been applied to all curves. DRHO in tolerance was assumed to be -0.1 to 0.1 Calliper logs were compared to bit size to identify washouts or zones of potential poor pad-tool contact. All curves were compared to their expected responses and to the company composite pdf logs where available. Poor density data quality: DHRO indicates that D is frequently out of tolerance, probably 26/07-1 x x x x x x x x x x x due to hole rugosity (CALI shows frequent washouts). N-D used to help select GR Clay volume parameters, but not used for calculation. S used for poro because D poor quality. 30/23a-3 x x x x x x x x x x /13-1 x x 11 7 x x x x x x Data quality appears good: DHRO indicates that D is in tolerance. No other indicators suggest poor data quality. Data quality appears OK, but only CALI available for assessment and D poro mostly agrees well in comparison to S poro. 37/10-1 x x x x x x x x x x x Potentially spurious Neutron data (source/processing). A few intervals of poor D quality (DRHO out of tolerance). N-D used to help select GR Clay volume parameters, but not used 90 for calculation. N-D used for poro except where DRHO indicates poor D, then S used for poro. S poro across whole interval compares well to N-D poro. Data quality appears good: DHRO indicates that D is in tolerance. No other indicators 37/12-1 x x x x x x x x x x x suggest poor data quality. A few spikes (not within Net intervals) appear to be a lithological response. 38/18-1 x x 17 8 x x x x x x x /07-1 x x 20 8 x x x x x Potentially spurious Neutron data (source/processing). Density data quality appears good (DRHO in tolerance). GR-S curves depth shifted to match Res, D, N to ensure N,D,S peaks were on depth with each other for Coal ID calculation. N-D used to help select GR Clay volume parameters, but not used for calculation. N-D used for poro (compares well to S poro). Only Sonic available for poro calc. S spikes > 100 over Yoredale & Scremerston inferred to be coals from composite pdf. Only GR used for Clay volume calculation. No other curves available for verification of parameters. 45
53 Well Selection process Curves available Curves used for V cl and poro Cut off values for V COAL 41/01-1 x x x x 26 x x x x x x x /10a- 1 x x x x x x x x x x x x /15a- 2 x x x x 10 x x x x x x x x /21-2 x x x x x x x x x x /02-1 x x x x x x x x x x Interpretation/data quality comments for report. Notes: Tension curves were generally not available (because the files were composites). A few intervals of poor density data quality (DHRO out of tolerance, appears to be due to hole rugosity (CALI). May correspond to coaly/carbonaceous intervals, but unable to verify. Coal ID therefore a compromise. May correspond simply to areas of poor data quality, but either way are excluded from Net calculations. This has led to some sharp changes in porosity curve). D used to help select GR Clay volume parameters, but not used for calculation. D used for poro except where DRHO indicates poor D, then S used for poro. S poro across whole interval compares reasonably well to D poro. Data quality appears good: DHRO indicates that D is in tolerance apart from at a couple of points. No other indicators suggest poor data quality. N-D and D-S used to help select GR Clay volume parameters, N-D and GR used for calculation. Appear to be thin carbonaceous intervals in base of Yoredale creating high poro spikes. Edited coal ID parameters to exclude them. Data quality appears good despite multiple washouts 2-5" from bit size. : DHRO indicates that D is in tolerance apart from at a couple of points. No other indicators suggest poor data quality. N-D and D-S used to help select GR Clay volume parameters, N-D and GR used for calculation. Poor density data quality: DHRO indicates that D is frequently out of tolerance, probably due to hole rugosity (CALI shows corresponding washouts). N-D & D-S used to help select GR Clay volume parameters, but not used for calculation. N-D used for poro as it corresponded reasonably well to S poro over the net reservoir intervals. Data quality appears mostly OK apart from interval where DRHO is out of tolerance. No CALI available over that interval. D poro mostly agrees in comparison to S poro. Table 8 Table of well information and log quality and interpretation comments 46

54 Appendix 5 Copy of stratigraphic chart Generalised time-equivalent slices shown in the maps (Section 4.7) are highlighted in red. The stratigraphic report is from (Kearsey et al., 2015, report CR/15/117) GRENSEN MILLSTONE YOREDALE SCREMERSTON FELL CEMENTSTONE DEVONIAN 47
Measurement of Gravity at the Viking Gas Terminal, Theddlethorpe St Helen, Lincolnshire
 Measurement of Gravity at the Viking Gas Terminal, Theddlethorpe St Helen, Lincolnshire Engineering Geology Programme Commissioned Research Report CR/14/085 BRITISH GEOLOGICAL SURVEY ENGINEERING GEOLOGY
Saline intrusion: a screening tool for the assessment of risk to coastal aquifers in Scotland
 Saline intrusion: a screening tool for the assessment of risk to coastal aquifers in Scotland water Management Programme Commissioned Report CR/06/025N BRITISH GEOLOGICAL SURVEY GROUNDWATER MANAGEMENT
Geology Map Extracts. Geology Map Extracts. Report prepared for: Orkney Sustainable Energy Ltd 6 North End Road Stromness Orkney KW16 3AG
 Report prepared for: Orkney Sustainable Energy Ltd 6 North End Road Stromness Orkney KW16 3AG Geology Map Extracts This report is designed for users carrying out preliminary site assessments who require
Relinquishment Report
 Relinquishment Report Licence P1403 Block 13/22d Chevron North Sea Limited Korean National Oil Company Chevron North Sea Limited December 2009 1 SYNOPSIS... 3 2 INTRODUCTION. 3 2.1 Licence Terms.. 3 2.2
Reservoir Rock Properties COPYRIGHT. Sources and Seals Porosity and Permeability. This section will cover the following learning objectives:
 Learning Objectives Reservoir Rock Properties Core Sources and Seals Porosity and Permeability This section will cover the following learning objectives: Explain why petroleum fluids are found in underground
Calculating Total Organic Carbon (TOC) using the Passey Method
 using the Passey Method") Calculating Total Organic Carbon (TOC) using the Passey Method Chris Gent Overview 1. Passey method 2. Importance of TOC and maturity data. 3. Case Study: The Weald, UK. 1. The Passey Method A Practical
Calculating Total Organic Carbon (TOC) using the Passey Method Chris Gent Overview 1. Passey method 2. Importance of TOC and maturity data. 3. Case Study: The Weald, UK. 1. The Passey Method A Practical
Constraining Uncertainty in Static Reservoir Modeling: A Case Study from Namorado Field, Brazil*
 Constraining Uncertainty in Static Reservoir Modeling: A Case Study from Namorado Field, Brazil* Juliana F. Bueno 1, Rodrigo D. Drummond 1, Alexandre C. Vidal 1, Emilson P. Leite 1, and Sérgio S. Sancevero
Sequence Stratigraphy of the Upper Cretaceous Niobrara Formation, A Bench, Wattenberg Field, Denver Julesburg Basin, Colorado*
 Sequence Stratigraphy of the Upper Cretaceous Niobrara Formation, A Bench, Wattenberg Field, Denver Julesburg Basin, Colorado* Lisa E. Remington LaChance 1 and Mark C. Robinson 1 Search and Discovery Article
Hydrocarbon plays of the Mid North Sea High: an integrated seismic and basin modelling study
 Hydrocarbon plays of the Mid North Sea High: an integrated seismic and basin modelling study Stephen Corfield, Julian Moore, Maurice Bamford, Andrew Barnwell and Patrick Barnard -OGA Frontier exploration
Maximising the use of publicly available data: porosity and permeability mapping of the Rotliegend Leman Sandstone, Southern North Sea
 Maximising the use of publicly available data: porosity and permeability mapping of the Rotliegend Leman Sandstone, Southern North Sea Claire Imrie & Henk Kombrink 09 May 2018 Overview The Oil and Gas
Geological Indicators of Flooding. User Guidance Notes. Information Products Programme Open Report OR/10/064
 Geological Indicators of Flooding. User Guidance Notes Information Products Programme Open Report OR/10/064 BRITISH GEOLOGICAL SURVEY INFORMATION PRODUCTS PROGRAMME OPEN REPORT OR/10/064 Geological Indicators
N121: Modern Petrophysical Well Log Interpretation
 Summary This course presents the principles and methods associated with the petrophysical interpretation of openand cased-hole wireline and LWD well logs. Open-hole topics covered include the use of log
PETROPHYSICAL EVALUATION CORE COPYRIGHT. Petrophysical Evaluation Approach and Shaly Sands Evaluation. By the end of this lesson, you will be able to:
 PETROPHYSICAL EVALUATION CORE Petrophysical Evaluation Approach and Shaly Sands Evaluation LEARNING OBJECTIVES By the end of this lesson, you will be able to: Discuss how to approach a petrophysical evaluation
Shear Wave Velocity Estimation Utilizing Wireline Logs for a Carbonate Reservoir, South-West Iran
 Iranian Int. J. Sci. 4(2), 2003, p. 209-221 Shear Wave Velocity Estimation Utilizing Wireline Logs for a Carbonate Reservoir, South-West Iran Eskandari, H. 1, Rezaee, M.R., 2 Javaherian, A., 3 and Mohammadnia,
Importance of regional geological and petrophysical analysis: Bakken/Three Forks formations of the Williston basin North Dakota and Montana
 Importance of regional geological and petrophysical analysis: Bakken/Three Forks formations of the Williston basin North Dakota and Montana Presenter: Stefani Brakenhoff The Discovery Group Team: Bob Cluff,
Summary report on the Arthur s Seat rockfall, Edinburgh, February Physical Hazards Programme Internal Report IR/07/033
 Summary report on the Arthur s Seat rockfall, Edinburgh, February 2007 Physical Hazards Programme Internal Report IR/07/033 BRITISH GEOLOGICAL SURVEY PHYSICAL HAZARDS PROGRAMME INTERNAL REPORT IR/07/033
Geological Classification of Seismic-Inversion Data in the Doba Basin of Chad*
 Geological Classification of Seismic-Inversion Data in the Doba Basin of Chad* Carl Reine 1, Chris Szelewski 2, and Chaminda Sandanayake 3 Search and Discovery Article #41899 (2016)** Posted September
FORMATION EVALUATION PETE 321
 FORMATION EVALUATION PETE 321 DENSITY AND NEUTRON LOGS Summer 2010 David Schechter Fluorescent Intervals in 1U Sand Sharp transition between oil saturated pay and non-pay observed by fluorescence in core
PROSPECT EVALUATION OF UNCONVENTIONAL PLAYS IN RUSSIA EPUG 2014
 PROSPECT EVALUATION OF UNCONVENTIONAL PLAYS IN RUSSIA EPUG 2014 Main definitions AGENDA Shale/shale play definition - Organic matter content - Thermal maturity Potential for unconventionals development
Technology of Production from Shale
 Technology of Production from Shale Doug Bentley, European Unconventional, Schlumberger May 29 th, 2012 Johannesburg, South Africa What are Unconventional Reservoirs Shale both Gas & Oil Coal Bed Methane
User Guide: RADON POTENTIAL DATASET - England and Wales
 User Guide: RADON POTENTIAL DATASET - England and Wales This document provides information for users of the joint HPA-BGS RADON POTENTIAL DATASET for England and Wales. 1. Background to joint Health Protection
RELINQUISHMENT REPORT
 RELINQUISHMENT REPORT Licences P1743 & P1744 Blocks 47/10c & 48/6d BP Exploration Operating Company Ltd. Prepared by: Rishi Dorai (BP Exploration) Issued: 02 March 2015 CONTENTS 1 Licence Information...
West of Shetland Area
 West of Moray Shetland Firth Area What is it? Roknowledge West of Shetland is a rock physics interpretation study and database designed to provide a visual look-up reference of rock physics relationships
Comparison of Classical Archie s Equation with Indonesian Equation and Use of Crossplots in Formation Evaluation: - A case study
 P-310 Summary Comparison of Classical Archie s Equation and Use of Crossplots in Formation Evaluation: - A case study Nitin Sharma In petroleum Exploration and Development Formation Evaluation is done
A Case Study in Integrating Core into an Oil Field Development
 A Case Study in Integrating Core into an Oil Field Development Mike Millar With acknowledgements to: Ichron Ltd; Rob Newbould, James Gifford and other colleagues at Petro-Canada. Aberdeen Formation Evaluation
Formation Evaluation: Logs and cores
 These powerpoint files were produced for the Earth History class at the Free University Berlin, Department of Geological Sciences The copyright for texts, graphical elements, and images lies with C. Heubeck,
F794. GEOLOGY Environmental Geology ADVANCED GCE. Friday 10 June 2011 Afternoon
 ADVANCED GCE GEOLOGY Environmental Geology F794 *F711210611* Candidates answer on the question paper. OCR supplied materials: None Other materials required: Electronic calculator Ruler (cm/mm) Friday 10
ECS Elemental Capture Spectroscopy Sonde. Fast, accurate lithology evaluation
 ECS Elemental Capture Spectroscopy Sonde Fast, accurate lithology evaluation Applications n Identify carbonate, gypsum, and anhydrite; quartz, feldspar, and mica; pyrite, siderite, coal, and salt fractions
Characteristics of the Triassic Upper Montney Formation (Unit C), West-Central Area, Alberta
, West-Central Area, Alberta") Characteristics of the Triassic Upper Montney Formation (Unit C), West-Central Area, Alberta Omar Derder NeoSeis Technology Group Ltd., Calgary, Alberta omarderder@neoseis.com Abstract Unconventional hydrocarbon
Characteristics of the Triassic Upper Montney Formation (Unit C), West-Central Area, Alberta Omar Derder NeoSeis Technology Group Ltd., Calgary, Alberta omarderder@neoseis.com Abstract Unconventional hydrocarbon
Generation of Pseudo-Log Volumes from 3D Seismic Multi-attributes using Neural Networks: A case Study
 5th Conference & Exposition on Petroleum Geophysics, Hyderabad-2004, India PP 541-549 Multi-attributes using Neural Networks: A case Study V.B.Singh, S.P.S.Negi, D.Subrahmanyam, S.Biswal & V.K.Baid G&G
Petrophysical Charaterization of the Kwale Field Reservoir Sands (OML 60) from Wire-line Logs, Niger Delta, Nigeria. EKINE, A. S.
 from Wire-line Logs, Niger Delta, Nigeria. EKINE, A. S.") JASEM ISSN 1119-8362 All rights reserved Full-text Available Online at wwwbiolineorgbr/ja J Appl Sci Environ Manage December, 2009 Vol 13(4) 81-85 Petrophysical Charaterization of the Kwale Field Reservoir
JASEM ISSN 1119-8362 All rights reserved Full-text Available Online at wwwbiolineorgbr/ja J Appl Sci Environ Manage December, 2009 Vol 13(4) 81-85 Petrophysical Charaterization of the Kwale Field Reservoir
Barnett Shale-Woodford Shale play of the Delaware basin is it another giant shale gas field in Texas?
 Barnett Shale-Woodford Shale play of the Delaware basin is it another giant shale gas field in Texas? Bob Cluff The Discovery Group, Inc Denver, Colorado, USA bobcluff@discovery-group.com Delaware basin
Technical Note: Hyporheic Zone Sampling Procedures. Groundwater Science Programme Open Report OR/10/048
 Technical Note: Hyporheic Zone Sampling Procedures Groundwater Science Programme Open Report OR/10/048 BRITISH GEOLOGICAL SURVEY GROUNDWATER SCIENCE PROGRAMME OPEN REPORT OR/10/048 Technical Note: Hyporheic
Hydrocarbon Volumetric Analysis Using Seismic and Borehole Data over Umoru Field, Niger Delta-Nigeria
 International Journal of Geosciences, 2011, 2, 179-183 doi:10.4236/ijg.2011.22019 Published Online May 2011 (http://www.scirp.org/journal/ijg) Hydrocarbon Volumetric Analysis Using Seismic and Borehole
LITTLE ABOUT BASIC PETROPHYSICS
 LITTLE ABOUT BASIC PETROPHYSICS Author: MUHAMMAD ZAHID M.Sc (Applied Geology) Specialization in Petrophysics University of Azad Jammu & Kashmir, Muzaffarabad. ENTER Introduction - Determination of Physical
Core Technology for Evaluating the Bakken
 Core Technology for Evaluating the Bakken Fundamentals for Reservoir Quality Assessment and Completion Analysis John Kieschnick and Roberto Suarez-Rivera TerraTek 1 Topics Covered Core Technology Changes
BGS Downhole Record Types for the National Borehole Information Capture Project. National Borehole Information Capture Internal Report IR/06/067
 BGS Downhole Record Types for the National Borehole Information Capture Project National Borehole Information Capture Internal Report IR/06/067 BRITISH GEOLOGICAL SURVEY NATIONAL BOREHOLE INFORMATION
Oil and Natural Gas Corporation Ltd., VRC(Panvel), WOB, ONGC, Mumbai. 1
, WOB, ONGC, Mumbai. 1") P-259 Summary Data for identification of Porosity Behaviour in Oligocene Lime Stone of D18 Area Of Western Offshore, India V.K. Baid*, P.H. Rao, P.S. Basak, Ravi Kant, V. Vairavan 1, K.M. Sundaram 1, ONGC
P-259 Summary Data for identification of Porosity Behaviour in Oligocene Lime Stone of D18 Area Of Western Offshore, India V.K. Baid*, P.H. Rao, P.S. Basak, Ravi Kant, V. Vairavan 1, K.M. Sundaram 1, ONGC
Abstract. Introduction to Area
 Petro physical analysis of Habib Rahi Limestone of Mari Gas Field using open hole wire line logs of well Mari Deep -06 Central Indus Basin Pakistan (A Case Study) 1a Quaid Khan Jadoon, 1a Muhammad Zahid
Land at Larchwood Farm, Whitehorse Lane Finchampstead, Berkshire
 Land at Larchwood Farm, Whitehorse Lane Finchampstead, Berkshire An Archaeological Evaluation for Mr. John Westbrook by James McNicoll-Norbury Thames Valley Archaeological Services Ltd Site Code LFF08/103
Archaeological Evaluation of Land off Hubbards Lane, Boughton Monchelsea, Kent
 Archaeological Evaluation of Land off Hubbards Lane, Boughton Monchelsea, Kent NGR: 576190 151300 Site Code: HUB/EV/16 (Planning Application: 16/500014/OUT/MA) SWAT Archaeology The Office, School Farm
A E. SEG/San Antonio 2007 Annual Meeting. exp. a V. a V. Summary
 Time-lapse simulator-to-seismic study - Forties field, North Sea. Christophe Ribeiro *, Cyrille Reiser, Philippe Doyen, CGGeritas, London, UK August Lau, Apache Corp., Houston, US, Steve Adiletta, Apache
Bulletin of Earth Sciences of Thailand. Evaluation of the Petroleum Systems in the Lanta-Similan Area, Northern Pattani Basin, Gulf of Thailand
 Evaluation of the Petroleum Systems in the Lanta-Similan Area, Northern Pattani Basin, Gulf of Thailand Sirajum Munira Petroleum Geoscience Program, Department of Geology, Faculty of Science, Chulalongkorn
The UK GeoEnergy Test Bed Ceri J Vincent British Geological Survey
 The UK GeoEnergy Test Bed Ceri J Vincent British Geological Survey Thanks to Matthew Hall (GTB Theme Lead for G ERA), Phil Meldrum, Russell Swift, Oliver Kuras, Richard Luckett, Andrew Butcher, Jonathan
Oxford Bus Company Depot, Cowley Road, Oxford
 Oxford Bus Company Depot, Cowley Road, Oxford An Archaeological Evaluation (Stage 2) for Berkeley Homes (Oxford and Chiltern) Ltd by Jo Pine Thames Valley Archaeological Services Ltd Site Code GAG 00/32
INTRODUCTION TO LOGGING TOOLS
 BY: MUHAMMAD ZAHID INTRODUCTION TO LOGGING TOOLS 1- SPONTANEOUS POTENTIAL (SP) The Spontaneous potential survey, (sp) was one of the first measurements, which was carried out, in a well bore. The SP log
SCAL, Inc. Services & Capabilities
 SCAL, Inc. Services & Capabilities About Us 30 years of service 2019 marks the 30th year in operation for Midlandbased Special Core Analysis Laboratories, Inc. (SCAL, Inc.). We're proud to celebrate this
Monday 2 June 2014 Morning
 Monday 2 June 2014 Morning A2 GCE GEOLOGY F794/01 Environmental Geology *3076922876* Candidates answer on the Question Paper. OCR supplied materials: None Other materials required: Electronic calculator
An Overview of the Tapia Canyon Field Static Geocellular Model and Simulation Study
 An Overview of the Tapia Canyon Field Static Geocellular Model and Simulation Study Prepared for Sefton Resources Inc. Jennifer Dunn, Chief Geologist Petrel Robertson Consulting Ltd. Outline Background
UNICEF IWASH Project, Northern Region, Ghana: An Adapted Training Manual for Groundwater Development
 UNICEF IWASH Project, Northern Region, Ghana: An Adapted Training Manual for Groundwater Development Groundwater Science Programme Open Report OR/11/047 BRITISH GEOLOGICAL SURVEY GROUNDWATER SCIENCE PROGRAMME
Calibration of the petro-elastic model (PEM) for 4D seismic studies in multi-mineral rocks Amini, Hamed; Alvarez, Erick Raciel
 for 4D seismic studies in multi-mineral rocks Amini, Hamed; Alvarez, Erick Raciel") Heriot-Watt University Heriot-Watt University Research Gateway Calibration of the petro-elastic model (PEM) for 4D seismic studies in multi-mineral rocks Amini, Hamed; Alvarez, Erick Raciel DOI: 10.3997/2214-4609.20132136
Heriot-Watt University Heriot-Watt University Research Gateway Calibration of the petro-elastic model (PEM) for 4D seismic studies in multi-mineral rocks Amini, Hamed; Alvarez, Erick Raciel DOI: 10.3997/2214-4609.20132136
Petrophysical Rock Typing: Enhanced Permeability Prediction and Reservoir Descriptions*
 Petrophysical Rock Typing: Enhanced Permeability Prediction and Reservoir Descriptions* Wanida Sritongthae 1 Search and Discovery Article #51265 (2016)** Posted June 20, 2016 *Adapted from oral presentation
RELINQUISHMENT REPORT. UK Traditional Licence P Blocks 12/16b & 12/17b. First Oil Expro Limited (Operator, 46.67%)
") RELINQUISHMENT REPORT UK Traditional Licence P.1887 Blocks 12/16b & 12/17b First Oil Expro Limited (Operator, 46.67%) Nautical Petroleum Limited (26.67%) North Sea Energy (UK NO2) Limited (26.67%) February
RELINQUISHMENT REPORT UK Traditional Licence P.1887 Blocks 12/16b & 12/17b First Oil Expro Limited (Operator, 46.67%) Nautical Petroleum Limited (26.67%) North Sea Energy (UK NO2) Limited (26.67%) February
But these are what we really measure with logs..
 The role of the petrophysicist in reservoir characterization and the analysis of reservoir performance. What do we bring to the table? What do we want to take home? Bob Cluff The Discovery Group Inc. consulting
For personal use only
 ASX Announcement 11 March 2014 Sunbird Receives Independent Certification of 7.8 Tcf (SNY 76%: 5.9 Tcf) of Best Estimate Prospective Resources for Block 2A in South Africa Independent certification of
User Guide for the BGS-HPA OneGeology Radon Potential Dataset for the UK. Open Report OR/12/082
 User Guide for the BGS-HPA OneGeology Radon Potential Dataset for the UK Open Report OR/12/082 BRITISH GEOLOGICAL SURVEY OPEN REPORT OR/12/082 User Guide for the BGS-HPA OneGeology Radon Potential Dataset
GEOLOGICAL LOG INTERPRETATION TUTORIAL
 GEOLOGICAL LOG INTERPRETATION TUTORIAL Text and Figures by Geoff Bohling and John Doveton The following pages will familiarize you with the basics of the geological interpretation of common logs as they
Serica Energy (UK) Limited. P.1840 Relinquishment Report. Blocks 210/19a & 210/20a. UK Northern North Sea
 Limited. P.1840 Relinquishment Report. Blocks 210/19a & 210/20a. UK Northern North Sea") Serica Energy (UK) Limited P.1840 Relinquishment Report Blocks 210/19a & 210/20a UK Northern North Sea January 2013 1 Header Licence: P.1840 Round: Licence Type: 26th Round Traditional "Drill-or-Drop"
Serica Energy (UK) Limited P.1840 Relinquishment Report Blocks 210/19a & 210/20a UK Northern North Sea January 2013 1 Header Licence: P.1840 Round: Licence Type: 26th Round Traditional "Drill-or-Drop"
Geologic and Reservoir Characterization and Modeling
 Geologic and Reservoir Characterization and Modeling Scott M. Frailey and James Damico Illinois State Geological Survey Midwest Geologic Sequestration Science Conference November 8 th, 2011 Acknowledgements
ALBERTA S CARDIUM OIL AND THE EVOLUTION OF CUTOFFS AND EVALUATION PROCEDURES IN RESPONSE TO HORIZONTAL DRILLING
 ALBERTA S CARDIUM OIL AND THE EVOLUTION OF CUTOFFS AND EVALUATION PROCEDURES IN RESPONSE TO HORIZONTAL DRILLING Alberta s Cardium Oil and the Evolution of Cutoffs and Evaluation Procedures in Miranda Stoffman,
FORMATION EVALUATION OF SIRP FIELD USING WIRELINE LOGS IN WESTERN DEPOBELT OF NIGER DELTA
 FORMATION EVALUATION OF SIRP FIELD USING WIRELINE LOGS IN WESTERN DEPOBELT OF NIGER DELTA 1 Obioha C, ²Adiela U. P and ³*Egesi N 1,3 Department of Geology, Faculty of Science, University of Port Harcourt,
OTC OTC PP. Abstract
 OTC OTC-19977-PP Using Modern Geophysical Technology to Explore for Bypassed Opportunities in the Gulf of Mexico R.A. Young/eSeis; W.G. Holt, G. Klefstad/ Fairways Offshore Exploration Copyright 2009,
SPE These in turn can be used to estimate mechanical properties.
 SPE 96112 Pressure Effects on Porosity-Log Responses Using Rock Physics Modeling: Implications on Geophysical and Engineering Models as Reservoir Pressure Decreases Michael Holmes, SPE, Digital Formation,
Economic information for planning
 Economic information for planning Fiona McEvoy Economic Geologist and GIS Specialist Kingsley Dunham Centre Keyworth Nottingham NG12 5GG Tel 0115 936 3100 Overview Original MIST project environmentally
Managing Radioactive Waste Safely: Initial Geological Unsuitability Screening of West Cumbria. Commissioned Report CR/10/072
 Managing Radioactive Waste Safely: Initial Geological Unsuitability Screening of West Cumbria Commissioned Report CR/10/072 BRITISH GEOLOGICAL SURVEY GEOLOGY AND LANDSCAPE, ENGLAND COMMISSIONED REPORT
Oxford Options Resource Centre, Horspath Driftway, Headington, Oxford
 Oxford Options Resource Centre, Horspath Driftway, Headington, Oxford An Archaeological Watching Brief For Oxfordshire County Council by Tim Dawson and Heather Hopkins Thames Valley Archaeological Services
Evaluation of Rock Properties from Logs Affected by Deep Invasion A Case Study
 Evaluation of Rock Properties from Logs Affected by Deep Invasion A Case Study Jahan Zeb a, Reece Murrell b a CGG Australia, 1 Ord Street, West Perth, WA 6005 Contact email: Jahan.Zeb@cgg.com b Esso Australia,
Drillworks. DecisionSpace Geomechanics DATA SHEET
 DATA SHEET Drillworks overview DecisionSpace Geomechanics Key features Pre-drill, real-time, and post-drill analyses are all easily performed in one application using the latest data from across the field
Source Protection Zones. National Dataset User Guide
 Source Protection Zones National Dataset User Guide Version 1.1.4 20 th Jan 2006 1 Contents 1.0 Record of amendment...3 2.0 Introduction...4 2.1 Description of the SPZ dataset...4 2.1.1 Definition of the
RWE Dea UK SNS Limited (50%, operator) Dana Petroleum (E&P) Limited (50%)
 Dana Petroleum (E&P) Limited (50%)") 1. Licence Information Licence Number P1726 Licence Round 25 th (2008) Licence Type Traditional Blocks 43/17a & 43/18a Licensees Work Programme RWE Dea UK SNS Limited (50%, operator) Dana Petroleum (E&P)
1. Licence Information Licence Number P1726 Licence Round 25 th (2008) Licence Type Traditional Blocks 43/17a & 43/18a Licensees Work Programme RWE Dea UK SNS Limited (50%, operator) Dana Petroleum (E&P)
Advances in Elemental Spectroscopy Logging: A Cased Hole Application Offshore West Africa
 Journal of Geography and Geology; Vol. 9, No. 4; 2017 ISSN 1916-9779 E-ISSN 1916-9787 Published by Canadian Center of Science and Education Advances in Elemental Spectroscopy Logging: A Cased Hole Application
ARCHAEOLOGICAL S E R V I C E S. 1 Beechmount Road, Southampton, Hampshire. Archaeological Watching Brief. by David Platt. Site Code: SOU1649
 T H A M E S V A L L E Y ARCHAEOLOGICAL S E R V I C E S 1 Beechmount Road, Southampton, Hampshire Archaeological Watching Brief by David Platt Site Code: SOU1649 (SU 4188 1616) 1 Beechmount Road, Southampton,
Hydrocarbon potential of the Lower Carboniferous in the Dutch northern offshore
 Hydrocarbon potential of the Lower Carboniferous in the Dutch northern offshore Palaeozoic Plays of Northwest Europe, 26-27 May 2016, London Marten ter Borgh, Bastiaan Jaarsma, Walter Eikelenboom and Eveline
EAS 233 Geologic Structures and Maps Winter Miscellaneous practice map exercises. 1. Fault and separation:
 Miscellaneous practice map exercises 1. Fault and separation: With respect to Map 1, what are (a) the orientation of the fault, and (b) the orientation of bedding in the units cut by the fault. (c) Mark
The Stratigraphic Trap in the Benchamas Field Pattani Basin, Gulf of Thailand
 The Stratigraphic Trap in the Benchamas Field Pattani Basin, Gulf of Thailand Jurairat Buangam Petroleum Geoscience Program, Department of Geology, Faculty of Science, Chulalongkorn University, Bangkok
A STATIC 3D MODELING OF HYDROCARBONIC RESERVOIR WITH THE HELP OF RMS CASE study: THE SOUTH EAST ANTICLINE OF KHUZESTAN IRAN
 :43-48 www.amiemt.megig.ir A STATIC 3D MODELING OF HYDROCARBONIC RESERVOIR WITH THE HELP OF RMS CASE study: THE SOUTH EAST ANTICLINE OF KHUZESTAN IRAN Hamid reza samadi 1,mohammad hadi Salehi 2 1 PH.D
SESE MEASURED RESOURCE EXCEEDS 650MT COAL
 For electronic distribution 15 th August 2012 SESE MEASURED RESOURCE EXCEEDS 650MT COAL Highlights: Initial Measured Resource at Sese calculated at 651Mt coal. Sese Coal & Power Project: Resource Summary
Fundamentals Of Petroleum Engineering FORMATION EVALUATION
 Fundamentals Of Petroleum Engineering FORMATION EVALUATION Mohd Fauzi Hamid Wan Rosli Wan Sulaiman Department of Petroleum Engineering Faculty of Petroleum & Renewable Engineering Universiti Technologi
Simultaneous Inversion of Clastic Zubair Reservoir: Case Study from Sabiriyah Field, North Kuwait
 Simultaneous Inversion of Clastic Zubair Reservoir: Case Study from Sabiriyah Field, North Kuwait Osman Khaled, Yousef Al-Zuabi, Hameed Shereef Summary The zone under study is Zubair formation of Cretaceous
RESERVOIR SEISMIC CHARACTERISATION OF THIN SANDS IN WEST SYBERIA
 www.senergyltd.com RESERVOIR SEISMIC CHARACTERISATION OF THIN SANDS IN WEST SYBERIA Erick Alvarez, Jaume Hernandez, Bolkhotivin E.A., Belov A.V., Hakima Ben Meradi,Jonathan Hall, Olivier Siccardi, Phil
2003 GCSSEPM Foundation Ed Picou Fellowship Grant for Graduate Studies in the Earth Sciences Recipient
 2003 GCSSEPM Foundation Ed Picou Fellowship Grant for Graduate Studies in the Earth Sciences Recipient Tarek A. El Shayeb University of Texas at Austin Integrated reservoir characterization and 3-D diagenetic
Land adjacent to 103 Pound Lane, Sonning, Berkshire
 Land adjacent to 103 Pound Lane, Sonning, Berkshire An Archaeological Evaluation for Hicks Development Ltd by James McNicoll-Norbury Thames Valley Archaeological Services Ltd Site Code PLS 09/50 June 2009
Keywords. PMR, Reservoir Characterization, EEI, LR
 Enhancing the Reservoir Characterization Experience through Post Migration Reprocessed (PMR) Data A case study Indrajit Das*, Ashish Kumar Singh, Shakuntala Mangal, Reliance Industries Limited, Mumbai
We apply a rock physics analysis to well log data from the North-East Gulf of Mexico
 Rock Physics for Fluid and Porosity Mapping in NE GoM JACK DVORKIN, Stanford University and Rock Solid Images TIM FASNACHT, Anadarko Petroleum Corporation RICHARD UDEN, MAGGIE SMITH, NAUM DERZHI, AND JOEL
INTRODUCTION TO WELL LOGS And BAYES THEOREM
 INTRODUCTION TO WELL LOGS And BAYES THEOREM EECS 833, 7 February 006 Geoff Bohling Assistant Scientist Kansas Geological Survey geoff@kgs.ku.edu 864-093 Overheads and resources available at http://people.ku.edu/~gbohling/eecs833
Predicting the path ahead
 Predicting the path ahead Horizontal drilling has become a routine procedure in many parts of the world and is particularly popular in the Middle East. Despite increasing familiarity with the techniques,
Block 43B - Onshore Oman
 Block 43B - Onshore Oman SUMMARY Block 43B is an 11,967 km 2 area located along the coastal area of Oman north of the Hajar Mountains. This is an unexplored region, both geographically and stratigraphically.
What is the scope for carbon capture and storage in Northern Ireland. Michelle Bentham
 What is the scope for carbon capture and storage in Northern Ireland Michelle Bentham Kingsley Dunham Centre Keyworth Nottingham NG12 5GG Tel 0115 936 3100 What is Carbon Capture and Storage? Capture of
Risk Factors in Reservoir Simulation
 Risk Factors in Reservoir Simulation Dr. Helmy Sayyouh Petroleum Engineering Cairo University 12/26/2017 1 Sources Of Data Petro-physical Data Water saturation may be estimated from log analysis, capillary
The importance of stratigraphic plays in the undiscovered resources of the UKCS
 The importance of stratigraphic plays in the undiscovered resources of the UKCS Sue Stoker 1, Joy Gray 2, Peter Haile 2, Ian Andrews 1 & Don Cameron 1 1 British Geological Survey 2 Department of Trade
NAPE 2011 Lagos, Nigeria 28 November-2 December 2011 Extended Abstract
 T: +44 191 334 2191 E: info@ikonscience.com W: www.ikonscience.com Pore Pressure Prediction in the Niger Delta NAPE 2011 Lagos, Nigeria 28 November-2 December 2011 Extended Abstract PORE PRESSURE PREDICTION
Key Elements of the Petroleum Systems of the Rockall and Slyne-Erris Basins
 Key Elements of the Petroleum Systems of the Rockall and Slyne-Erris Basins Bandon Corrib Dooish Atlantic Ireland Conference, Dublin, 1 st - 2 nd November 2016 Rockall and Slyne-Erris Basins Only 11 exploration
Formation evaluation of an onshore appraisal well KG-5, green field, Niger Delta, Nigeria
 AMERICAN JOURNAL OF SCIENTIFIC AND INDUSTRIAL RESEARCH 2010, Science Huβ, http://www.scihub.org/ajsir ISSN: 2153-649X doi:10.5251/ajsir.2010.1.2.262.270 Formation evaluation of an onshore appraisal well
Relinquishment Report for Licence Number P1435, Block 30/25a March 2009
 Relinquishment Report for Licence Number P1435, Block 30/25a March 2009 Endeavour Energy UK Ltd Relinquishment Report for Licence Number P1435 Block 30/25a 1 Table of Contents 1.0 Header...3 2.0 Synopsis...3
Big data in the Geoscience: A portal to physical properties Andrew Kingdon, Mark Fellgett and Martin Nayembil
 Big data in the Geoscience: A portal to physical properties Andrew Kingdon, Mark Fellgett and Martin Nayembil British Geological Survey, Keyworth, Nottingham, NG12 5GG, aki@bgs.ac.uk Geosciences were early
Exploration / Appraisal of Shales. Petrophysics Technical Manager Unconventional Resources
 Exploration / Appraisal of Shales Rick Lewis Petrophysics Technical Manager Unconventional Resources Organic Shale Factors Controlling Gas Reservoir Quality Conventional sandstone Mineral framework Gas
Downloaded 09/09/15 to Redistribution subject to SEG license or copyright; see Terms of Use at
 Reservoir properties estimation from marine broadband seismic without a-priori well information: A powerful de-risking workflow Cyrille Reiser*, Matt Whaley and Tim Bird, PGS Reservoir Limited Summary
ractical Geomechanics for Oil & Gas Industry
 P ractical Geomechanics for Oil & Gas Industry Practical Geomechanics for Oil and Gas Industry The integrity of the wellbore plays an important role in petroleum operations including drilling, completion
ACAE -- ESTUDIO PILOTO DE DIAGNÓSTICO DE FÍSICA DE ROCAS DEL YACIMIENTO CABALLOS EN LOS CAMPOS PUERTO COLON - LORO Y HORMIGA AREA SUR PUTUMAYO
 ACAE -- ESTUDIO PILOTO DE DIAGNÓSTICO DE FÍSICA DE ROCAS DEL YACIMIENTO CABALLOS EN LOS CAMPOS PUERTO COLON - LORO Y HORMIGA AREA SUR PUTUMAYO PROBLEM: Provide a rational rock-physics basis for determining
The SPE Foundation through member donations and a contribution from Offshore Europe
 Primary funding is provided by The SPE Foundation through member donations and a contribution from Offshore Europe The Society is grateful to those companies that allow their professionals to serve as