MISCELLANEOUS PAPER EL Marian E. Poindexter Environmental Laboratory
|
|
|
- Suzanna Hensley
- 5 years ago
- Views:
Transcription
1 ICFILE COP1 I MISCELLANEOUS PAPER EL U A EVALUATION OF DREDGED MATERIAL FOR USE AS SANITARY LANDFILL COVER S by Marian E. Poindexter Environmental Laboratory DEPARTMENT OF THE ARMY Waterways Experiment Station, Corps of Engineers PO Box 631, Vicksburg, Mississippi DTIC 05 D November 1988 g Final Report _ " ~ ~~~Aproved F R- ea, Dslr~btO n,r',te \ JNew ',t?-! York. New 'York
2 71---L Unclassified SECURITY CLASSIFICATION of THIS PAGE la REPORT SECURITY CLASSIFICATION Unclassified REPORT DOCUMENTATION PAGE lb RESTRICTIVE MARKINGS Form Approved 0M81o ' Exp Dare Jun30,?986 2a SECURITY CLASSIFICATION AUTHORITY 3 DISTRIBUTION IAVAILABILITY OF REPORT Approved for public release; distribution 2b. DECLASSIFICATION /DOWNGRADING SCHEDULE unlimited. 4 PERFORMING ORGANIZATION REPORT NUMBER(S) S MONITORING ORGANIZATION REPORT NUMBER(S) Miscellaneous Paper EL a- NAME OF PERFORMING ORGANIZATION 6b. OFFICE SYMBOL 7a NAME OF MONITORING ORGANIZATION USAEWES (if aible) Environmental Laboratory 6c. ADDRESS (Ciy, State, and ZIP Code) 7b. ADDRESS (City, State, and ZIP Code) PO Box 631 Vicksburg, MS Ba. NAME OF FUNDING/SPONSORING Sb OFFICE SYMBOL 9. PROCUREMENT INSTRUMENT IDENTIFICATION NUMBER ORGANIZATION (If applicable) USAED, New York I Sc. ADDRESS (City, State. and ZIP Code) 10. SOURCE OF FUNDING NUMBERS PROGRAM I PROJECT TASK WORK UNIT New York, NY ELEMENT NO. NO NO 1ACCESSION NO 11. TITLE (Include Security Classification) Evaluation of Dredged Material for Use as Sanitary Landfill Cover 12. PERSONAL AUTHOR(S) Poindexter, Marian E. 13a. TYPE OF REPORT TIME COVERED 13b 14 DATE OF REPORT (Year, MonthDay) 15 PAGE COUNT Final report FROM TO November SUPPLEMENTARY NOTATION Available from National Technical Information Service, 5285 Port Royal Road, Springfield, VA COSATI CODES 18. SUBJECT TERMS (Continue on reverse if necessary and identify by block number) FIELD GROUP SUB-GROUP -;Beneficial uses - Sanitary landfill cover Dredged material6, Drying 19. ABSTRACT (Continue on reverse if necessary and identify by block number) The consolidation and devatering characteristics of 10 sediment samples from the New York/New Jersey Harbor were investigated to determine their potential for use as sanitary landfill cover. The rates and depths of drying were determined for various dredgea material layer thicknesses through computer modeling using,the computer code entitled "rimary Consolidation and Desiccation of Dredged Fill (PCDDF).-' The various sediments were ranked according to the rate of dewatering and the quantity of dried material produced. Six potential dredged material disposal sites, previously identified by the New York District, were assessed as to their suitability to use as dewatering sites for the 10 dredged materials. This study indicated that, with appropriate disposal site management, the dredged material can be dewatered so that it is suitable for use as sanitary landfill cover. 20 DISTRIBUTIONAVAILABILITY OF ABSTRACT 21 ABSTRACT SECURITY CLASSIFICATION E]UNCLASSIFIEDAUNLIMITED [I SAME AS RPT 0 DTIC USERS Unclassified 22a NAME OF RESPONSIBLE INDIVIDUAL 22b TELEPHONE (Include Area Code) 22c OFFICE SYMBOL DO FORM 1473,84 MAR 83 APR edition may be used until exhausted SECURITY CLASSIFICATION OF THIS PAGE All other editions are obsolete Unclassified
3 PREFACE This report was prepared by the Environmental Laboratory (EL), US Army Engineer Waterways Experiment Station (WES), as part of a reimbursable project for the US Army Engineer District, New York. Funding for this investigation was authorized by IAO NYD The report was prepared by Dr. Marian E. Poindexter under the general supervision of Dr. John J. Ingram, Chief, Water Resources Engineering Group (WREG), EL; Dr. Raymond L. Montgomery, Chief, Environmental Engineering Division (EED), EL; and Dr. John Harrison, Chief, EL. Acknowledgement is made to Mr. Daniel A. Leavell, Soils Research Facility, Geotechnical Laboratory, EL, for conducting the laboratory consolidation testing program. The assistance of Mrs. Cheryl M. Lloyd, WREG, is also acknowledged. Technical reviewers for this report were Drs. Michael R. Palermo, EED, and Gary F. Goforth, WREG. COL Dwayne G. Lee, EN, was Commander and Director of WES. Dr. Robert W. Whalin was Technical Director. This report should be cited as follows: Poindexter, Marian E "Evaluation of Dredged Material for Use as Sanitary Landfill Cover," Miscellaneous Paper EL-88-15, US Army Engineer Waterways Experiment Station, Vicksburg, MS. Accession For NTIS GRA&I Unannounced [ justification Distributicn/ Availability Codes Avali and/or Dist Special 11
4 CONTENTS Page LIST OF TABLES... 3 LIST OF FIGURES..o... 3 CONVERSION FACTORS, NON-SI TO SI (METRIC) UNITS OF MEASUREMENT...o... 5 PART I: INTRODUCTION... o... 6 Background PART II: FIELD SITES... 8 Sediment Samples... 0# ** Dewatering Disposal Sites... 9 PART III: LABORATORY INVESTIGATIONS Soil Classification Tet q Consolidation Tet Consolidation Test Results PART IV: CONSOLIDATION/DEWATERING ANALYSIS... o Approach,...,,*, * Mathematical Model Assumptions... 0* Results of Dewatering Analyses PART V: CONCLUSIONS Sedim ent De a e l g Dewatering Disposal Sites General 4omns... 8 REFERENCES APPENDIX A: SCHEMATIC DRAWINGS OF DEWATERING DISPOSAL SITES... Al APPENDIX B: GRAIN-SIZE DISTRIBUTION CURVES... B1 2
5 No. LIST OF TABLES 1 Sediment Sampling Locations in the New York Harbor Area Size of Dewatering Disposal Sites in the New York Harbor Area Classification Test Results Climatological Data for New York Harbor Area Comparison of Sediment Dewatering Characteristics Ranking of Sediments byrate ofdewatering Ranking of Sediments by Quantity of Dry Material Produced Page No. LIST OF FIGURES 1 Locations of dewatering disposal sites in the New York Harbor area Void ratio and effective stress relationship for Lower Passaic Void ratio and permeability relationship for Lower Passaic Void ratio and effective stress relationship for Port Elizabeth Void ratio and permeability relationship for Port Elizabeth Void ratio and effective stress relationship for Newark Bay Void ratio and permeability relationship for Newark Bay Void ratio and effective stress relationship for US Metals Void ratio and permeability relationship for US Metals Void ratio and effective stress relationship for Seguine Point Void ratio and permeability relationship for Seguine Point Void ratio and effective stress relationship for Earle Navy Void ratio and permeability relationship for Earle Navy Void ratio and effective stress relationship for Red Hook Void ratio and permeability relationship for Red Hook Void ratio and effective stress relationship for Dutch Kills Void ratio and permeability relationship for Dutch Kills Void ratio and effective stress relationship for Port Authority Void ratio and permeability relationship for Port Authority Page 3
6 No. Page 20 Depth of dry material as a function of lift thickness and time for Lower Passaic Dredged material surface elevation as a function of lift thickness and time for Lower Passaic Depth of dry material as a function of lift thickness and time for Port Elizabeth Dredged material surface elevation as a function of llft thickness and time for Port Elizabeth Depth of dry material as a function of lift thickness and time for Newark Bay Dredged material surface elevation as a function of lift thickness and time for Newark Bay Depth of dry material as a function of lift thickness and time for US Metals Dredged material surface elevation as a function of lift thickness and time for US Metals Depth of dry material as a function of lift thickness and time for Seguine Point Dredged material surface elevation as a function of lift thickness and time for Seguine Point Depth of dry material as a function of lift thickness and time for Earle Navy Dredged material surface elevation as a function of lift thickness and time for Earle Navy Depth of dry material as a function of lift thickness and time for Red Hook Dredged material surface elevation as a function of lift thickness and time for Red Hook Depth of dry material as a function of lift thickness and time for Dutch Kills Dredged material surface elevation as a function of lift thickness and time for Dutch Kills Depth of dry material as a function of lift thickness and time for Port Authority Dredged material surface elevation as a function of lift thickness and time for Port Authority... o.37 4
7 CONVERSION FACTORS, NON-SI TO SI (METRIC) UNITS OF MEASUREMENT Non-SI units of measurement used in this report can be converted to SI (metric) units as follows: Multiply By To Obtain acres 4, square metres cubic feet cubic metres cubic yards cubic metres feet metres gallons (US liquid) cubic decimetres inches 2.54 centimetres tons (force) per square foot kilopascals 5
8 EVALUATION OF DREDGED MATERIAL FOR USE AS SANITARY LANDFILL COVER PART I: INTRODUCTION Background 1. As a part of the Dredged Material Disposal Management Plan for the Port of New York and New Jersey, the US Army Engineer District, New York (NYD) has conducted numerous studies to identify and evaluate potential disposal alternatives for sediments dredged from the New York Harbor area. One of the potential uses of dewatered dredged material is as sanitary landfill cover. Initial feasibility studies (Malcolm Pirnie, Inc and 1983) indicated that dewatered dredged material has properties which will allow it to be successfully utilized as daily, intermediate, and/or final landfill cover in some cases. 2. Use of dredged material as cover in sanitary landfills would have two beneficial effects in the NY/NJ Harbor area: (a) the availability of suitable cover material would be maintained; additionally, the cost of cover material would not escalate rapidly in future years as a result of scarcity of cover material, and (b) the service life of dredged material containment areas would be increased since material would be removed for landfill cover uses. 3. In order to use dredged material as cover, the dredged material must be dewatered or dried to a water content which is acceptable for use in a sanitary landfill. Research conducted at the US Army Engineer Waterways Experiment Station (WES) has indicated that evaporative drying is the most cost effective means of dewatering dredged material (Haliburton 1978). The effectiveness of evaporative drying is partially controlled by climatic conditions existing at the dredged material containment area as well as by the consolidation and permeability characteristics of the dredged material. Purpose 4. The purpose of this study was to investigate the consolidation and dewatering characteristics of 10 sediment samples identified by the NYD. This 6
9 work included laboratory testing for material characterization, consolidation/ desiccation (dewatering) analysis utilizing mathematical models, and comparison of results for the ten discrete sediment samples. 7
10 PART II: FIELD SITES Sediment Samples 5. In previous studies, sediments from various locations within the New York Harbor area have been extensively sampled. By utilizing sediment classification and properties determined from the previous investigations, NYD personnel identified representative sediment samples to be tested in the present study. Ten sediment sampling sites were selected from the 23 harborwide sites initially investigated. The criteria used in selection of the 10 representative sediment sampling locations included: a. Geographical location within the harbor. b. Volume of material to be dredged. c. Grain size analysis. d. Atterburg limits. e. EP toxicity tests. Eight of the sampling locations were selected based solely upon the above criteria; two additional locations (Lower Passaic and Lower Hackensack) were included since these projects may potentially be used for the thick lift study at De Korte State Park (Malcolm Pinie, Inc. 1983). The ten sediments analyzed in this study are listed and identified by their various designations in Table Sediment samples were collected by NYD personnel at each of the ten sites previously identified. Since all of the sediments are part of future maintenance dredging projects (as opposed to new work dredging projects), grab sampling techniques were utilized. This technique is more expedient and more economical than is a subaqueous coring operation, and for maintenance dredged material it provides a suitable representative sediment sample. 7. Approximately five gallons of sediment were collected at eftch of the 10 sites during the period April-May The material from each site was sealed in a 5-gallon plastic bucket which was labeled with appropriate site identification codes. The ten buckets were subsequently shipped to the WES at the end of May 1984 for laboratory testing and analysis. 8
11 Table I Sedimen. Sampling Locations in the New York Harbor Area Sampling Corps Site No.* Project No. Project 1. (1) 64D Lower Hackensack 2. (3) 64E Lower Passaic 3. (4) 64C Port Elizabeth 4. (5) 64B Newark Bay 5. (9) Non-Federal US Metals 6. (12) 63A Seguine Point Bend 7. (13) Non-Federal Earle Navy 8. (17) 34 Red Hook Channel 9. (20) 39 Dutch Kills 10. (21) Non-Federal Port Authority NY/NJ Terminals Numbers in parentheses indicate sampling site numbers used by Malcolm Pirnie, Inc. (1982 and 1983). Dewatering Disposal Sites 8. The NYD has conducted extensive investigations to locate regional upland disposal sites for containment and possible dewatering of dredged material. As a result of these investigations, six sites have been identified as potential dredged material dewatering sites. These sites are N37, N61, L13, N30, Raritan Center, and Newark Bay. Locations of these sites are shown in Figure I and sizes of the sites are listed in Table 2. Schematic drawings of the disposal sites are located in Appendix A. 9
12 i 4 L13 NEW JERSEY NEWARK BAY,, NEWARK N37 d NEW YORK LAND, N RARITAN CENTER N61 Figure 1. Locations of dewatering disposal sites in the New York Harbor area Table 2 Size of Devatering Disposal Sites in the New York Harbor Area Site Surface Area, acres N N61 82 L13 48 N30 64 Raritan Center 740 Newark Bay
13 oa.l. Lt..... S. ± b,,4td... *. ". -7 PART III: LABORATORY INVESTIGATIONS 9. In order to predict the consolidation and dewatering behavior of dredged materials, laboratory testing to determine material properties must be accomplished. The properties which are of particular interest in this study are the void ratio-effective stress relationship and the void ratiopermeability relationship. These relationships are determined from various types of laboratory consolidation tests. The consolidation tests must be accompanied by soil classification tests which give indications of the basic differences in the sediment samples. Soil Classification Tests 10. Upon receipt of the ten sediment samples from the NYD, each sample was classified by the WES Geotechnical Laboratory. The classification tests performed included Atterberg Limits, specific gravity, organic content, and grain-size distribution (both sieve and hydrometer analyses). Upon completion of these tests, each sediment was classified according to the Unified Soil Classification System (USCS) as described in US Army Engineer Waterways Experiment Station (1953). Table 3 shows the results of the soil classification tests for each of the sediment. Grain-size distribution curves for all sediments are included in Appendix B. It should be noted that the determination of the Atterburg Limits includes determination of both the liquid limit (LL) and the plastic limit (PL). The difference in these values is then calculated to obtain the value of plasticity index (PI). When a soil is non-plastic, the designation NP is given to the soil as was done in the case of the Lower Hackensack sediment. 11. Inspection of Table 3 indicates that the sediments tested exhibit a wide range of plasticity values, from a non-plastic sand to highly plastic clays (CH classification). The range of organic contents (0-12%) is typical of sediments to be dredged. The specific gravity values are consistently lower than would be expected for clays designated CH in the Unified Soil Classification System. Typically, sandy or silty clays have a specific gravity of about 2.72 and highly plastic clays have specific gravities in the range of 2.75 to The lower specific gravities of the New York Harbor sediments may result from the presence of specific mineral grains which have lower 11
14 Table 3 Classification Test Results Liquid Plasticity Specific Organic USCS Limits Index Gravity Content Classi- Sediment Location LL PI s Z fication Lower Hackensack NP NP SW-SM Lower Passaic CH Port Elizabeth CH Newark Bay SC US Metals CR Seguine Point Bend CH Earle Navy SC Red Hook Channel CH Dutch Kills OH Port Authority NY/NJ CH individual specific gravities, or they may possibly result from the presence of contaminants in the sediments and interaction of these materials with the clay particles. Consolidation Tests 12. A finite strain (large strain) consolidation testing program and theoretical analysis was utilized to analyze the New York Harbor sediment samples. This approach allows a more accurate prediction of field behavior of very soft materials (which may undergo 50 percent strain or more) than does the staudard Terzaghi-Frohlich small strain consolidation theory. 13. Performance of a large strain consolidation testing program requires the conducting of two companion consolidation tests. A self-weight consolidation test is required to obtain soil properties at high void ratios (low densities). This test must be supplemented by another consolidation test in which the soil sample is subjected to an imposed vertical loading to simulate the loading conditions of the dredged material located deeper within the field deposit. The second test which is normally run is the large strain, controlled rate of strain (LSCRS) test; this test is conducted on a slurry of L2 A
15 fine-grained dredged material. Because of the classification of some sediment samples, i.e. more coarse-grained materials, the LSCRS test cannot be run on these sediments. In this case the self-weight consolidation test is supplemented by a standard consolidation test which is then analyzed by finite strain theory. Seven of the New York Harbor sediments were subjected to selfweight and LSCRS testing, two (Newark Bay and Earle Navy) underwent selfweight and standard consolidation tests, and one (Lower Hackensack) was not tested in consolidation since it is classified as a sand and was therefore not amenable to consolidation testing. 14. For any of the consolidation tests mentioned above, only fine-grained material (passing the No. 40 sieve) should be utilized. The slurry used in the self-weight and LSCRS testing should have a void ratio representative of the dredged material slurry as it enters the containment area or slightly higher. The water added to the sediment to obtain the appropriate void ratio should be from the dredging site, or water should be mixed to represent dredging site water, i.e., the ph and salinity should be representative of that at the project site. Self-weight test 15. The self-weight consolidation device consists of a plexiglass cylinder which allows consolidation testing and subsequent incremental sampling of a specimen 6 in. in diameter and 9 in. high. Dredged material slurry placed in the consolidometer is allowed to undergo self-weight consolidation. Deformation versus time data are collected during the consolidation process. After completion of primary consolidation, the test device can be disassembled and the specimen sampled in 1/4-in. increments to obtain the necessary data to calculate void ratio, effective stress, and permeability values for the upper portion of the e-a and e-k curves. Typical void ratios encountered in the specimen after completion of this test range from 5 to 12 (from bottom to top of specimen). This test should be performed as described by Cargill (1986). Large strain test 16. The LSCRS test involved deformation of a large cylindrical specimen of slurry under a controlled, but variable, rate of strain. The specimen tested is 6 in. in diameter and 9 in. in height. During the test, measurements are made of the effective stress at each end of the specimen and the excess pore water pressure throughout the sample height. With these measurements, the required consolidation properties can be calculated for the lower IPJ 13
16 end of the range of void ratios encountered in a dredged material containment area. This test procedure is described by Cargill (1986). Standard test 17. The standard consolidation test is run on a remolded soil specimen which is at a water content typical of the in situ channel sediment. The test specimen is 1.25 in. high and 4.25 in. in diameter. This test should be run in accordance with EM (Office, Chief of Engineers 1970). Consolidation Test Results 18. The void ratio-effective stress (e-a') and the void ratiopermeability (e-k) relationships for each sediment were developed from the laboratory test data in order to analyze the compressibility and dewatering characteristics of these materials. The curves were developed by combining results from the self-weight consolidation test and LSCRS test, except in the - - cases of the Newark Bay and Earle Navy sediments. For these two sediments, results from the self-weight and the standard consolidation tests were combined to form the required curves. The e-o' and e-k relationships for each sediment are shown in Figures 2 through As shown on the e-a' and e-k curves, the value of the initial void ratio e 0 is that at which a particular laboratory test was begun. For instance, the self-weight consolidation test on the US Metals sediment was begun at an initial void ratio, e, of 14.0 and the LSCRS test was begun at e The higher initial void ratio was utilized in the self-weight test in order to be certain that this test was begun at a void ratio, e o, which was higher than the zero-effective-stress void ratio e oo. (The void ratio e 0 0 indicates the point at which the process of consolidation begins; therefore the test must begin at a higher void ratio if the entire e-a' and e-k relationships are to be developed.) The zero-effective-stress void ratio is the void ratio at which the e-a' curve becomes approximately horizontal. 14
17 i n I IIfln I I ifl I I LEGEND 10 SELF-WEIGH4T CONSOLIDATIONi TEST s * LSCRS TEST e =9.60 Os 07 0 > * *a IInpa ant a I a ilui 10o EFFECTIVE STRESS, o', TSF Figure 2. Void ratio-effective stress relationship, Lover Passaic 13 an aat uai a uua a a" LEGEND I1 I 10 SLSCRS TEST SELF-WEIGH4T CONSOLIDATION TEST a g e =9.60 a06 > 5 4 3* S PERMEABILITY, k, FT/DAY Figure 3. Void ratio-permeability relationship, Lover Passaic 15
18 LEGEND 1O SELF-WEIGHT CONSOLIDATION TEST e-* 14.0A 6= io 4 5 io o EFFECTIVE STRESS, a', TSF Figure 4. Void ratio-effective stress relationship, Port Elizabeth il I I wil 1 I LEGEND ~SELF.-WE IGHIT CONSOLIDATION TEST a *LSCRS TEST e O ~ I~ i ii uli aaa 1 ] PERMEABILITY, k, FT/DAY Figure 5. Void ratio-permeability relationship, Port Elizabeth 16
19 12 11 LEGEND 10 SE LF-WEIGH4T CONSOLI DATION LSCRS TEST > EFFECTIVE STR~ESS, U', TSF Figure 6. Void ratio-effective stress relationship, Newark Bay u 111 II I111 I LEGEND I1 I SELF-WEIGHT CONSOLIDATION TEST e, LSCRS TEST 9 e =10.0 o06 > PERMEABILITY, k, FTIDAY Figure 7. Void ratio-permeability relationship, Newark Bay 17
20 12 g ui Ilil un 1an vigi 11 -LEGEND A SELF-WEIGHT CONSOLIDATION TEST * LSCRS TEST e = > EFFECTIVE STRESS, 0'. TSF Figure 8. Void ratio-effective stress relationship, US Metals I I 5I1 11 I1115 I II LEGEND Ii I StLF-WEIGIIT CONSOLIDATION TEST s-= * LSCRS TEST 9 e = > o1-' PERMEABILITY, kc, FT/DAY Figure 9. Void ratio-permeability relationship, US Metals 18
21 LEGEND SELF-WEIGHT CONSOLIDATION TEST 10 a LSCRS TEST e = CC Io Figure 10. EFFECTIVE STRESS, 0', TSF Void ratio-effective stress relationship, Seguine Point five" I a LEGEND 11 SELF-WE IGHT CONSOLIDATION TEST It LSCRS TEST 9 *= > 5, O I' 10o Figure 11. PERMEABILITY, k, FT/DAY Void ratio-permeability relationship, Seguine Point 19
22 12 11 LEGEND 10 SELF-WEIGHT CONSOLIDATION TEST e-* OEDOMETER TEST e 2.12 I & 2 I I0 1 a1jit Il f i o Figure 12. EFFECTIVE STRESS, a', TSF Void ratio-effective stress relationship, Earle Navy 12 LEGEND 11 SELF-WEIGHT CONSOLIDATION TEST 14.0 *OEDOMETER TEST e = > o Figure 13. PERMEABILITY, k, FT/DAY Void ratio-permeability relationship, Earle Navy 20
23 LEGEND ASELF-WEIGHT CONSOLI DATION TEST 10 6=t-14.0 * > LSCRS TEST e EFFECTIVE STRESS, U', TSF Figure 14. Void ratio-effective stress relationship, Red Hook 13 I u ilm1 I LEGEND a1 SELF-WEIGHT CONSOLIDATION TEST s LSCRS TEST 9 0-=9.0 C; 0 6 > [hill[ I I I111 1ifl I iii I i I iiiiiii a I PERMEABILITY. kc, FT/DAY Figure 15. Void ratio-permeability relationship, Red Hook 21
24 12 2. I I I IIIIII N IlilllU I I I lll1 l I 1f I l m I 1 I - I I i IIII t 11 LEGEND 10 A SELF-WEIGHT CONSOLIDATION TEST e LSCRS TEST., 8 e = ~ I I IIII n I ii 1111u U llts I I ilii Figure 16. EFFECTIVE STRESS, a', TSF Void ratio-effective stress relationship, Dutch Kills 12 LEGEND I I- A SELF-WEIGHT CONSOLIDATION TEST e LSCRS TEST e= n, > PERMEABILITY, k, FT/DAY Figure 17. Void ratio-permeability relationship, Dutch Kills 22
25 12 11 LEGEND 10 SELF-WEIGHT CONSOLIDATION TEST 10e *LSCRS TEST S*10.0 jr o 0 0 EFFECTIVE STRESS, a', TSF Figure 18. Void ratio-effective stress relationship, Port Authority 13 1 ai lil UH 111 III LEGEND 11 SELF-WEIGHT CONSOLIDATION LSCRS TEST 9 e = > 4 3 0L PEMAIIY kma 22
26 D -7 9 PART IV: CONSOLIDATION/DEWATERING ANALYSIS Approach In order to predict the consolidation and dewatering behavior of the ten New York Harbor sediments, the laboratory test results discussed in Part III were utilized in a computerized mathematical model which accounts for both consolidation and desiccation. Analysis of results obtained from this model provides information on variation in dredged material surface elevation with time, reduction in void ratio (and thus water content) as consolidation and desiccation progress, and depth of dried crust. Mathematical Model Finite strain consolidation 21. The governing equation for finite strain consolidation theory is based on the continuity of fluid flow in a differential soil element, Darcy'q law, and the effective stress principle, similar to the conventional consolidation theory (Gibson, England, and Hussey 1967). However, finite strain theory can additionally consider vertical equilibrium of the soil mass, place no restriction on the form of the stress-strain relationship, allow for variable coefficient of permeability, and accommodate any degree of strain. The governing (s equation is: d k(e) ke)d +e+2_ a e- +Le0 w e[ + e az az w(1 + e) de z at where ys unit weight of solids w unit weight of water e void ratio k(e) - soil permeability as a function of void ratio z - vertical material coordinate measured against gravity a' - effective stress as a function of void ratio t - time 24
27 -71 This equation is well suited for the prediction of consolidation in thick deposits of very soft dredged materials since it accounts for the large strains and nonlinear soil properties inherent in these materials. Desiccation 22. The removal of water by desiccation from a normally consolidating dredged material layer will result in formation of a surface crust; this in turn will cause additional consolidation due to the surcharge created by crust formation. Since surface drying may be significant between disposal operations, it is essential to incorporate predictions of desiccation settlement in evaluations of disposal site capacity. 23. An empirical description of the desiccation has been developed in terms of water balance in the upper portion of dredged material layers (Cargill 1985). Procedures for calculation of soil evaporation rates and depths of influence have been developed. Site-specific climatic conditions are incorporated in the analysis procedures. The predictive model developed utilizes void ratios instead of water contents in order to be compatible with the consolidation model. Computer model 24. Both the finite strain consolidation model and the empirical desiccation model have been programmed for computer solution (Cargill 1985). The program Primary Consolidation and Desiccation of Dredged Fill (PCDDF) incorporates an explicit finite difference mathematical approximation to describe the consolidation process. Monthly adjustments in the top boundary condition and location are made to account for the amount of desiccation which has occurred. In addition to material settlement which comes from a calculation of void ratio distribution, the program also calculates the distribution of stresses and pore pressures throughout the dredged material layer. Assumptions 25. The computer model of the consolidation/desiccation process is designed to be capable of analyzing very involved, or complicated, field situations. Therefore when general dredging and/or disposal operations are analyzed and specific details of the operations are not known, some assumptions are required. By making the assumptions reasonable and uniform in all cases 25
28 to be analyzed, comparisons can be made as to the relative performance of the various cases. The assumptions made in this analysis are discussed below. Foundation soil conditions 26. The foundation soil was considered to be rigid and impermeable in all cases. The assumption of rigidity is without consequence since the ultimate storage capacity of the disposal site is not of concern in this study. The assumption of an impermeable foundation soil is necessary (a) for uniformity of the analyses, (direct comparison of sediment behaviors) since it is not known which sediment will be placed into each disposal area, and (b) since information on foundation soil permeabilities is not available. The assumption of an impermeable foundation will be conservative, or worst-case, since existence of a permeable foundation would allow drainage, and thus somewhat more rapid dewatering of the dredged material. Dredging operations 27. For purposes of computer simulation, it was assumed that the dredging operation would begin in January for each sediment to be dredged. The assumption is significant only because the evaporative drying rates vary during different seasons of the year. The most effective drying period in the New York Harbor area is May to September, whereas no significant evaporative drying will occur during the period of November through March. If the sediment is allowed to dry for a period of one year, then the effect of timing of initiation of dredging is insignificant. 28. An additional assumption was made regarding the time which will elapse between initiation of disposal operations and decantation of ponded surface waters in the disposal site. A period of 90 days (3 months) was assumed in all cases for this study. Such a period of time allows for completion of dredging and gradual lowering of the weir crest elevation to allow removal of clarified surface water. Since specific information on particular dredging operations was not known during feasibility/planning studies and since this time has been found to be typical of such operations, the 90 day time period was used. The significance of this assumption is that the abscissa will need to be adjusted appropriately on any plots showing some variable as a function of "Time From Initiation of Disposal." The assumption made regarding placement of the dredged material was that the material was placed in a containment area at or above the water table. This assumption is necessary if any drying of the material is to be accomplished. If dredged 26
29 material is placed in a submerged containment area, the material below the water table will not dry although it will undergo consolidation and can subsequently be used as a foundation for other lifts of dredged material which will undergo both consolidation and desiccation. Lift thickness 29. Three dredged material lift thicknesses which have been found to be typical of various disposal operations were utilized in this study. The lift thicknesses used in calculations were 3 ft, 5 ft, and 7 ft. By utilizing the same lift thicknesses for all sediments under study, comparisons of dewatering potential can be made between sediments. Because three different thicknesses were considered for any one sediment, the maximum depth of drying can be determined for each individual sediment. Limits of drying 30. Values for the saturation limit, esl' and the desiccation limit, edl' for the sediments in this study were assumed since no specific data were available. By utilizing the values of liquid limit and plastic limit of the sediments under study, estimates of the average values of esl and CDL were made. The value of esl was assumed to be 4.0 while edl was taken to be 1.5. These values are consistent with those determined from other field sites for similar dredged materials. The values of e SL and edl are simply indicators of the void ratios of dredged materials at the end of first stage and second stage drying, respectively (Cargill 1985). Climatological data 31. The monthly averages for rainfall and evaporation in the New York Harbor area were calculated. The rainfall data was obtained from the National Oceanic and Atmospheric Administration (1980) and was averaged for a period of 50 years. Evaporation data was averaged over a 30-year time period (Haliburton 1978). The data utilized in the analysis is shown in Table 4. Results of Dewatering Analyses 32. In the following subsections, the results of the analyses are discussed for each sediment. Two figures are plotted for each of the New York Harbor sediments (except Lower Hackensack) in this section. For each sediment, both depth of dry material (as a percentage of initial lift thickness) and surface elevation are plotted against time (Figures 20-37). For the 27
30 Table 4 Climatological Data for New York Harbor Area Rainfall, Pan Evaporation, Month inches inches January February March April [ May June July August September October November December dewatering analysis the value of edl of 1.5 corresponds to a moisture content within the dried material of approximately 60 percent. Dredged material at this water content should be acceptable for use as sanitary landfill cover. It should be noted that this water content was determined from empirical relationships between void ratio and moisture content within the dried dredged material crust and must therefore be considered to be an approximate value. Lower Hackensack 33. Because this sediment was non-plastic (USCS classification of NP), it will not undergo consolidation and therefore was not subjected to consolidation testing. This sediment should dewater rapidly because of its granular (coarse-grained) composition. In order to dry this material, the weir crest elevation should be gradually lowered to allow drainage of the water ponded above and within the dredged material. This operation will leave the material in a moist, but not saturated, condition; therefore it should be available for use as landfill cover shortly after drainage of the containment area has been completed
31 100 1D / 70 - L_ 70 w.340 g0 w~ a0.j 50 i/!. LEGEND.- U tut 0I 0 3 FT LIFT 10-7 FT LIFT " U Figure 20. <4 7 uf 30 TIME FROM INITIATION OF DISPOSAL, YEARS Depth of dry material as a function -if lift thickness and time for Lower Passiac LEGEND" 6 3 FT LIFT 5 FT LIFT I-7 i. 2 FT LIFT Figure 21. TIME FROM INITIATION OF DISPOSAL, YEARS Dredged material surface elevation as a function of lift thickness and tme for Lower Passaic 29
32 [90 i,' I :" /'U / FTLT. 0 s I FT LIFT O 7 FT LIFT LEGEND TIME FROM INITIATION OF DISPOSAL, YEARS 0 3 FT LIFT Figure 22. Depth of dry material as a function of lift thickness and time for Port Elizabeth 7 5~ U FT LIFT IA. I- 2 0 Ui z! Figure 23. TIME FROM INITIATION OF DISPOSAL. YEARS Dredged material surface elevation as a function of thickness and time for Port Elizabeth 30
33 ,-,. 2 m, 100 so a 1 w 70 O z I- 60 a s- -J 40 F 30 Z, LEGEND.,. O FT LIFT 10 5 FT LIFT 7 FT LIFT oi I I I I I TIME FROM INITIATION OF DISPOSAL. YEARS Figure 24. Depth of dry material as a function of lift thickness and time for Newark Bay IA. 2F 0 I- LEGEND 6 S3 FT LIFT 5FT LIFT 5 7 FT LIFT 4 UJ3 0 i I I I I Figure 25. TIME FROM INITIATION OF DISPOSAL. YEARS Dredged material surface elevation as a function of lift thickness and time for Newark Bay 31
34 z t40 if 3 0 &L FT LIFT 10~ * FT LIFT Figure 26. TIME FROM INITIATION OF DISPOSAL. YEARS Depth of dry material as a function of lift thickness and time f or US Metals i 0 A (4 LEGEND 6~ 3 FT LIFT & 5FT LIFT 5~7 FT LIFT.j Figure 27. TIME FROM INITIATION OF DISPOSAL, YEARS Dredged material surface elevation as a function of thickness and time for US Metals 32
35 100 *, 90 90/ 'U U 60 FLF zr&5ftlf 10-0 ii F LF 6~ 5FT L IFT 10~ * FT LIFT TIME~~ ~ ~ ~ FRMFNTITILOFDSPSAYER Figure~~~~~~~ 295rdeFaeia ufc lvtinfst fucto of litthcnssadtimeft r SeuiePon 23
36 C w ~LEGEND 0e 0 3 FT LIFT i10 ~6 10& 5 FT LIFT 7 FT LIFT TIME FROM INITIATION OF DISPOSAL, YEARS Figure 30. Depth of dry material as a function of lift 7 thickness and time for Earle Navy LEGEND 3 FT LIFT 1 5 FT LIFT I-5 7 FT LIFT 0 0 I I i I I 4 F 3 u 2 7_! LEEN I I a Figure 31. TIME FROM INITIATION OF DISPOSAL, YEARS Dredged material surface elevation as a function of lift thickness and time for Earle Navy 34
37 a 15 w a 6 t 40 <70 3 LGEN z.2 0 TLF A F LF 10-7-TLF a Figure TIPAE FROM INITIATION OF DISPOSAL, YEARS Depth of dry material as a function of lift thickness and time for Red Hook LEGEND 0 3 FTLIFT & 5 FT LIFT 5~ 7 FT LIFT 0 I-. 4 'U -j Figure 33. TIME FROM INITIATION OF DISPOSAL. YEARS Dredged material surface elevation as a function of lift thickness and time for Red Hook 35
38 too 90 U1 I- 8u0 70 ~40 30 U. 20 & 5 FT LIFT 10~ * FT LIFT Figure TIME FROM INITIATION OF DISPOSAL. YEARS Depth of dry material as a function of lift thickness and time for Dutch Kills LEGEND 3FT LIFT 5 FT LIFT 5~7 FT LIFT I'- LU IL Figure 35. TIME FROM INITIATION OF DISPOSAL, YEARS Dredged material surface elevation as a function of lift thickness and time for Dutch Kills 36
39 o - / I Iu 30 wu 60 z ~LEGEND 0 3 FT LIFT 2O A 5 FT LIFT 10 * 7 FT LIFT TIME FROM INITIATION OF DISPOSAL, YEARS Figure 36. Depth of dry material as a function of lift thickness and time for Port Authority LEGEND 6- S3 FT LIFT *5 FT LIFT I- 5 7 FT LIFT U. 0 4.j W 3 U U Figure 37. TIME FROM INITIATION OF DISPOSAL, YEARS Dredged material surface elevation as a function of lift thickness and time for Port Authority 37
40 Lower Passaic 34. The Lower Passaic sediments exhibited a minimum depth for dewatering of approximately 3.1 ft (Figure 20). This was evidenced by the complete drying of the 3 ft lift of material as well as the ultimate drying of 63 percent or 3.15 ft of the 5 ft lift and 43 percent or 3.01 ft of the 7 ft lift. These depths of drying represent percentages of initial lift thickness; they do not indicate actual depths of dry material. Therefore if it is desired to have a lift of dredged material dried throughout its depth, the initial thickness of the dredged material should not exceed about 3 ft. Drying of a 3 ft lift (initial thickness) of dredged material will result in a final depth of dry material of approximately 10 inches. This would provide approximately 36,300 ft 3 of dried material per acre. 35. A 3 ft lift of Lower Passaic sediment would be dried throughout approximately 80 percent of its depth at the end of one summer drying period. Because evaporation decreases markedly in the other portions of the year, drying of the remaining 20 percent of the 3 ft lift would probably not be accomplished until the next year's drying period. Port Elizabeth 36. The Port Elizabeth sediment exhibited a maximum depth for dewatering - of approximately 3.65 ft. As shown in Figure 22, this was evidenced by the ultimate drying of 73 percent or 3.65 ft of the 5 ft lift and 52 percent or 3.64 ft of the 7 ft lift. The 3 ft lift dried throughout its depth. Again, these depths of drying represent percentages of initial lift thickness; they do not indicate actual depths of dry material. 37. If it is desired to place a lift of dredged material which will dry throughout its depth, the initial thickness of the lift should not exceed about 3.65 ft. Drying of 3.65 ft lift (initial thickness) of dredged material will result in a final depth of dry material of approximately 9.4 inches. This would provide approximately 34,125 ft 3 dried material per acre. 38. A 3 ft lift of Port Elizabeth sediment would be dried throughout approximately 80 percent of its depth at the end of one summer drying period. Because evaporation decreases markedly in the other portions of the drying of the remaining 20 percent of the 3 ft lift would probably not be accomplished until the following year's drying period. 38
41 *...i i n Newark Bay 39. The Newark Bay sediment exhibited a maximum depth for dewatering of approximately 5.0 ft (Figure 24). This was evidenced by the complete drying of both the 3 ft and the 5 ft lifts. The ultimate drying of the 7 ft lift proceeded 60 percent or 4.2 ft into the 7 ft lift. It is suggested that the difference in depth of drying in the 5 ft and 7 ft layers is related to the permeability and capillarity of this sandy material; it may also result in part from the formulation of the computer code. These depths of drying are once again percentages of initial lift thickness; they do not indicate actual depths of dry material. 40. If it is desired to place a lift of dredged material which will dry throughout its depth, the initial thickness of the lift should not exceed * about 5.0 ft. Drying of a 5.0 ft lift (initial thickness) of dredged material will result in a final depth of dry material of a roximately 11.2 inches. This would provide approximately 40,650 ft 3 of dried material per acre. 41. A 5 ft lift of Newark Bay sediment would be dried throughout approximately 70 percent of its depth at the end of one summer drying period. Because evaporation decreases markedly in the other portions of the year, drying of the remaining 30 percent of the 5 ft lift would probably not be accomplished until the following year's drying period. US Metals 42. The US Metals sediment exhibited a maximum depth for dewatering of approximately 3.75 ft (Figure 26). This was evidenced by the ultimate drying of 74 percent or 3.70 ft of the 5 ft lift and 54 percent or 3.78 ft of the 7 ft lift. The 3 ft lift dried throughout its depth. These depths of drying are percentages of initial lift thickness; they do not indicate actual depths of dry material. 43. If it is desired to place a lift of dredged material which will dry throughout its depth, the initial thickness of the lift should not exceed about 3.75 ft. Drying a 3.75 ft lift (initial thickness) of dredged material will result in a final depth of dry material of approximately 9.4 inches. This would provide approximately 34,125 ft 3 of dried material per acre. 44. A 3.75 ft lift of US Metals sediment would be dried throughout approximately 50 percent of its depth at the end of one summer drying period. Because evaporation decreases markedly in the other portions of the year, 39
42 drying of the remaining 50 percent of the 3.75 ft lift would probably not be accomplished until the following year's drying period. Seguine Point Bend 45. The Seguine Point sediment exhibited a maximum depth of drying of approximately 3.35 ft (Figure 28). This was evidenced by the ultimate drying of 67 percent or 3.35 ft of the 5 ft lift and 48 percent or 3.36 ft of the 7 ft lift. The 3 ft lift dried throughout its depth. These depths of drying are percentages of initial lift thickness; they do not indicate actual depths of dry material. 46. If it is desired to place a lift of dredged material which will dry throughout its depth, the initial thickness of the lift should not exceed about 3.35 ft. Drying of a 3.35 ft lift (initial thickness) of dredged material will result in a final depth of dry material of approximately inches. This would provide approximately 31,415 ft of dried material per acre. 47. A 3.35 ft lift of Seguine Point sediment would be dried throughout approximately 45 percent of its depth at the end of one summer drying period. Because evaporation decreases markedly in the other portions of the year, drying of the remaining 55 percent of the 3.35 ft lift would probably not be accomplished until the following year's drying period. Earle Navy 48. The Earle Navy sediment exhibited a maximum depth of drying of 4.20 ft (Figure 30). This was evidenced by the ultimate drying of 84 percent or 4.20 ft of the 5 ft lift and 60 percent or 4.20 ft of the 7 ft lift. 3 ft lift dried throughout its depth. These depths of drying are percentages of initial lift thickness; they do not indicate actual depths of dry material. 49. If it is desired to place a lift of dredged material which will dry throughout its depth, the initial thickness of the lift should not exceed about 4.20 ft. Drying of a 4.20 ft lift (initial thickness) of dredged material will result in a final depth of dry material of approximately 10.4 inches. This would provide approximately 37,750 ft 3 of dried material Ter acre. 50. A 4.20 ft lift of Earle Navy sediment would be dried throughout approximately 70 percent of its depth at the end of one summer drying period. Because evaporation decreases markedly in the other portions of the year, The 40
43 drying of the remaining 30 percent of the 4.20 ft lift would probably not be accomplished until the following year's drying period. Red Hook Channel 51. The Red Hook sediment exhibited a maximum depth of drying of 3.0 ft (Figure 32). This was evidenced by complete drying of the 3 ft lift as well as the ultimate drying of 60 percent or 3.0 ft of the 5 ft lift and 43 percent or 3.0 ft of the 7 ft lift. These depths of drying are percentages of initial lift thickness; they do not indicate actual depths of dry material. 52. If it is desired to place a lift of dredged material which will dry throughout its depth, the initial thickness of the lift should not exceed about 3.0 ft. Drying of a 3.0 ft lift (initial thickness) of dredged material will result in a final depth of dry material of approximately 9.47 inches. This would provide approximately 34,385 ft 3 of dried material per acre. 53. A 3.0 ft lift of Red Hook sediment would be dried throughout approximately 72 percent of its depth at the end of one summer drying period. Because evaporation decreases markedly in the other portions of the year, drying of the remaining 28 percent of the 3.0 ft lift would probably not be accomplished until the following year's drying period. Dutch Kills 54. The Dutch Kills sediment exhibited a maximum depth of drying of approximately 3.65 ft (Figure 34). This was evidenced by the ultimate drying of 73 percent or 3.65 ft of the 5 ft lift and 52 percent or 3.64 ft of the 7 ft lift. The 3 ft lift dried throughout its depth. These depths of drying are percentages of initial lift thickness; they do not indicate actual depths of dry material. 55. If it is desired to place a lift of dredged material which will dry throughout its depth, the initial thickness of the lift should not exceed about 3.65 ft. Drying of a 3.65 ft lift (initial thickness) of dredged material will result in a final depth of dry material of approximately 9.4 inches. This would provide approximately 34,125 ft 3 of dried material per acre. 56. A 3.65 ft lift of Dutch Kills sediment would be dried throughout approximately 50 percent of its depth at the end of one summer drying period. Because evaporation decreases markedly in the other portions of the year, drying of the remaining 50 percent of the 3.65 ft lift would probably not be accomplished until the following year's drying period. 41
44 Port Authority NY/NJ Terminals 57. The Port Authority sediment exhibited a maximum depth of drying of approximately 3.35 ft (Figure 36). This was evidenced by the ultimate drying of 67 percent or 3.35 ft of the 5 ft lift and 48 percent or 3.36 ft of the 7 ft lift. The 3 ft lift dried throughout its depth. These depths of drying are percentages of initial lift thickness; they do not indicate actual depths of dry material. 58. If it is desired to place a lift of dredged material which will dry throughout its depth, the initial thickness of the lift should not exceed about 3.35 ft. Drying of the 3.35 ft lift (initial thickness) of dredged material will result in a final depth of dry material of approximately inches. This would provide approximately 34,300 ft of dried material per acre. 59. A 3.35 ft lift of Port Authority sediment would be dried throughout approximately 60 percent of its depth at the end of one summer drying period. Because evaporation decreases markedly in the other portions of the year, drying of the remaining 40 percent of the 3.35 ft lift would probably not be accomplished until the following year's drying period. Comparison of sediments 60. Table 5 presents a comparison of the 10 New York Harbor sediments. This table shows the depth of drying calculated as a percentage of initial lift thickness, final thickness of dry material, and the ultimate yield of dry material per acre of containment area. 42
45 Table 5 Comparison of Sediment Dewatering Characteristics Depth of Drying Thickness of Dry (Z Initial Lift) Material Yield pir Acre Sediment ft in. ft Lower Hackensack (Throughout lift) Lower Passaic ,300 Port Elizabeth ,125 Newark Bay ,650 US Metals Seguine Point ,415 Bend Earle Navy ,750 Red Hook ,735 Channel Dutch Kills ,125 Port Authority ,300 43
46 PART V: CONCLUSIONS Sediment Dewatering 61. Based upon the preceding discussions of the dewatering analyses, it is evident that the sediments analyzed in this study can be dewatered to their maximum depth within a period of approximately 2 years in most cases. The maximum depth to which a sediment may be dewatered by evaporative drying varies somewhat depending upon the properties of the particular sediment. This depth ranges from 3.35 ft to 5.0 ft except in the case of the Lower Hackensack sediment which will probably dry throughout the depth of deposit. Quantities of dried material available for use as sanitary landfill cover vary from 31,415 ft 3 per acre to 40,650 ft 3 per acre, or the quantity of Lower Hackensack sediment deposited per acre. 62. The sediments reach various degrees of dewatering after the first summer evaporative drying cycle. Lower Hackensack would probably be dried throughout 100 percent of its depth. The Port Authority sediment would be dried throughout 60 percent of its depth. Both the US Metals and Dutch Kills sediments would be dried throughout 50 percent of their depths while the Seguine Point sediment would be dried throughout only 45 percent of its depth. All other sediments would dry throughout 70 to 80 percent of their depths at the end of one summer drying cycle. 63. The sediments may be ranked in order of their dewaterability based upon either the rate of dewatering or upon the ultimate quantity of dry material which will be produced. Although the latter will probably be most useful, the sediments were ranked each way. Table 6 shows the ranking of sediments by their respective rates of dewatering, while Table 7 shows the ranking based upon quantities of dry material produced. 64. Comparison of Tables 6 and 7 indicates that the Lower Hackensack sediment will be most quickly and completely dewatered. The US Metals, Dutch Kills and Sequine Point sediments are ranked lowest according to both methods. There is a certain amount of similarity in the ranking of sediments shown in Table 6 and 7. The only sediments which were changed in their relative rankings were Lower Passaic and Port Elizabeth. Lower Passaic moved from No. 2 when ranked according to rate of drying to the No. 4 position according to 44
47 Table 6 Ranking of Sediments by Rate of Dewatering Thickness Dry Depth of Dry Ultimate Depth at End of Material After of Dry Mate- Ranking Sediment First Season, % First Season, in. rial, in. 1 Lower Hackensack Lower Passaic Newark Bay Port Elizabeth Earle Navy Red Hook Channel Port Authority US Metals Dutch Kills Seguine Point Bend Table 7 Ranking of Sediments by Quantity of Dry Material Produced Ultimate Thickness of Yield Y per Acre Ranking Sediment Dry Material, in. ft 1 Lower Hackensack... 2 Newark Bay ,650 3 Earle Navy ,750 4 Lower Passaic ,300 5 Red Hook Channel ,385 6 Port Authority ,300 7 Port Elizabeth ,125 8 US Metals ,125 9 Dutch Kills , Seguine Point ,415 Bend 45
48 ultimate quantity of dry material produced. Port Elizabeth moved from No. 4 by rate of dewatering to No. 7 quantity of dry material. Dewatering Disposal Sites 65. For maximum efficiency and economy of the dredged material dewatering operation, consideration must be given to the dewatering characteristics of - the sediments, location of material to be dredged with respect to the disposal site, and proximity of the disposal site to the potential user of the dried material, i.e. the sanitary landfill, as well as to the characteristics and conditions existing in the disposal site. 66. Each disposal operation which is undertaken should be managed so that disposal of dredged material results in thin lift placement. Thin lifts are generally considered to be no more than 3 ft to 5 ft at completion of the disposal operation. Lift thicknesses of this depth range were found in this study to be the maximum depth of dredged material which could be completely dewatered by evaporative drying. 67. The quantity of a particular sediment which is placed into a specific disposal area should be controlled, for maximum efficiency of dewatering, so that the resulting lift thickness does not exceed the maximum dewatering depth for that sediment. The quantity of sediment which can be placed into a specific disposal area, while meeting the above mentioned criteria may be calculated as follows: 1 +e V - c HA c + e 00 where Vc - volume of sediment in channel to be dredged, yd 3 H - dredged material lift thickness in disposal site, ft A - surface area of disposal site, acres c e 0 W void ratio of sediment in channel void ratio of sediment in disposal site at beginning of consolidation 68. In the following subsections, the suitability of the individual disposal sites for use as dredged material dewatering sites will be discussed. 46
49 Site N As a dewatering disposal site, N37 would be a good site. Although it may contain wetlands, it seems to be roughly at or above sea level. This means that almost all dredged material placed in this site could be subjected to evaporative drying since only a relatively small quantity would be below water level. Also, the size of the site (approximately 155 acres) makes it viable for thin lift placement of considerable quantities of dredged material. The major problems with this site would seem to be (a) the political aspects regarding presence of wetlands and (b) presence of the Public Service Gas and Electric Company's 16-inch gas transmission main. Site N This 82-acre site would be good for a dredged material dewatering site if the associated political questions can be resolved. The site does contain some tidal wetlands along the eastern perimeter which would result in placement of some dredged material that would not be subjected to evaporative drying; this should be a minimal amount of material. Since this site is subjected to periodic flooding during storm events, the confining dikes constructed at this site should be designed to prevent entrance of storm water into the dewatering site. Site L Although this site (48 acres) is somewhat smaller than the other dewatering sites considered in this study, it is considered to be a good site from the standpoint of location and elevation. The site does contain some tidal flats, but once again the major portion of the dredged material placed in this site would be subjected to dewatering forces. The quantity of dredged material placed in this site during a specific disposal operation should be more limited than at the other sites if total dewatering of the material is desired. Site N This site is considered to have a total of 64 acres which are available for dewatering of dredged material. This site should be suitable for use as a dewatering disposal site. No particular problems are noted for this site. Raritan Center 73. This site would be excellent as a regional dewatering site. Because of the size of this site (approximately 740 acres), this site could be managed 47 '_i'
50 very effectively and efficiently for dewatering of dredged material. The site could be compartmentalized to allow periodic disposal into each of the compartments with subsequent drying of the dredged material in adjacent compartments. The location of this site in close proximity to both the ILR Landfill and the Edison Town Landfill makes it ideal as a supply of sanitary landfill cover. The major problem with this site is the political determination of whether the site contains wetlands. Any engineering problems associated with dewatering of dredged material in a wet environment would be minimal; only a relatively small quantity of the dredged material would be adversely affected in its dewatering. Newark Bay 74. This 165-acre site is located in a subaqueous environment. Large quantities of dredged material could be contained in this site before the dredged material surface emerges above the water surface. Therefore, although this site would be excellent as a dredged material containment area, it would not be suitable as a dredged material dewatering site at the present time. After the dredged material surface has risen to the point that some dredged material can undergo evaporative drying, significant problems with removal of the dried material would probably be encountered since the material under the dried crust would be in a soft condition. This would not necessarily be the case if some of the granular dredged materials were placed in this site, but it would necessitate sacrificing this good landfill cover material to act as a foundation material for other dredged material. General Comments 75. The following comments may be made with regard to dewatering dredged material for use as sanitary landfill cover. a. Dredging quantities and rates should be controlled to maintain thin lift placement in the dewatering disposal sites if the entire lift of dredged material is to be dewatered. b. Initial lift thickness affects the rate of dewatering. Thicker lifts have a somewhat slower rate of dewatering because continuing consolidation of underlying dredged material supplies additional water to the dredged material surface for an extended period of time. 48
51 c. Good disposal site management practices should be followed to assure maximum dewatering of the dredged material. These practices should include: (1) Thin lift placement. (2) Compartmentalization of large disposal sites. (3) Prompt removal of weir boards for removal of water ponded during the disposal operations. (4) Continued periodic lowering of the weir crest elevation to allow prompt removal of precipitation. This continuing action is necessary as the dredged material surface subsides from consolidation and dewatering. d. Any estimated water content of the dried dredged material is of necessity an average value. In cohesive materials there will be a very distinct gradation of water content from top (drier) to bottom (wetter) of the dried crust. As the sediments become more coarse-grained, the average water content of the dried material will more closely reflect the conditions throughout the dried material. e. When thick lifts of dredged material must periodically be placed, this material may ultimately be dewatered to depths greater than those found in this study if it is possible to harvest the dried material at intervals before the next disposal operation. f. If requirements on landfill cover moisture contents are rigid, it might be advantageous to conduct field tests to determine the actual moisture content at completion of evaporative drying. If the water contents at completion of drying are not within specifications it might be necessary to provide for a minimal amount of rehandling of the dredged material, i.e. discing to aerate, etc. to bring the water content into acceptable limits. Since dried dredged material has not previously been used a. sanitary landfill cover, it may be necessary to modify the procedure being utilized as the first such operation begins. 49
52 REFERENCES Cargill, K. W "The Large Strain, Controlled Rate of Strain (LSCRS) Device for Consolidation Testing of Soft, Fine-Grained Soils," Technical Report GL-86-13, US Army Engineer Waterways Experiment Station, Vicksburg, Miss "Mathematical Model of the Consolidation/Desiccation Process in Dredged Material," Technical Report D-85-4, US Army Engineer Waterways Experiment Station, Vicksburg, Miss. Gibson, R. E., England, G. L., and Hussey, M. J. L "The Theory of One-Dimensional Consolidation of Saturated Clays; I. Finite Non-Linear Consolidation of Thin Homogeneous Layers," Geotechnigue, Vol 17, No. 3, pp Haliburton, T. A "Guidelines for Dewatering/Densifying Confined Dredged Material," Technical Report DS-78-11, US Army Engineer Waterways Experiment Station, Vicksburg, Miss. Malcolm Pirnie, Inc "Feasibility Study for Use of Dredged Material from NY/NJ Harbor as Sanitary Landfill Cover; Phase I: Development and Application of Criteria to Sediment Sampling Results," prepared for US Army Engineer District, New York, New York, N. Y "Feasibility Study for Use of Dredged Material from NY/NJ Harbor as Sanitary Landfill Cover; Phase II: Case Studies at Fresh Kills, NY and De Korte Park, NJ," prepared for US Army Engineer District, New York, New York, N. Y. National Oceanic and Atmospheric Administration "Narrative Summaries, Tables, and Maps for Each State," Climates of the States, 2d ed., 2 vols. Office, Chief of Engineers, Department of the Army Testing," Engineer Manual , Washington, D. C. "Laboratory Soils Palermo, M. R., Montgomery, R. L., and Poindexter, M. E "Guidelines for Designing, Operating, and Managing Dredged Material Containment Areas," Technical Report DS-78-10, US Army Engineer Waterways Experiment Station, Vicksburg, Miss. US Army Engineer Waterways Experiment Station "The Unified Soil Classification System," Technical Memorandum No , Vicksburg, Miss. 50
53 APPENDIX A: SCHEMATIC DRAWINGS OF DEWATERING DISPOSAL SITES
54 -N- SAYREVILLE"* Figure Al. Schematic drawings of disposal sites N18 and Raritan Center A3
55 STATE -N- ISLAND FigreA2 Sheatc rain o dspsa ste03 A4l
56 id V.. -N-3 n- ELIZABETH PORT STATEN ISLAND Figure A3. Schematic drawing of disposal site N37 A5

57 BELFO RD LEONARDO Figure A4. Schematic drawing of disposal site N61 A6
58 -N- Figure A5. Schematic drawing of disposalst 1 A7
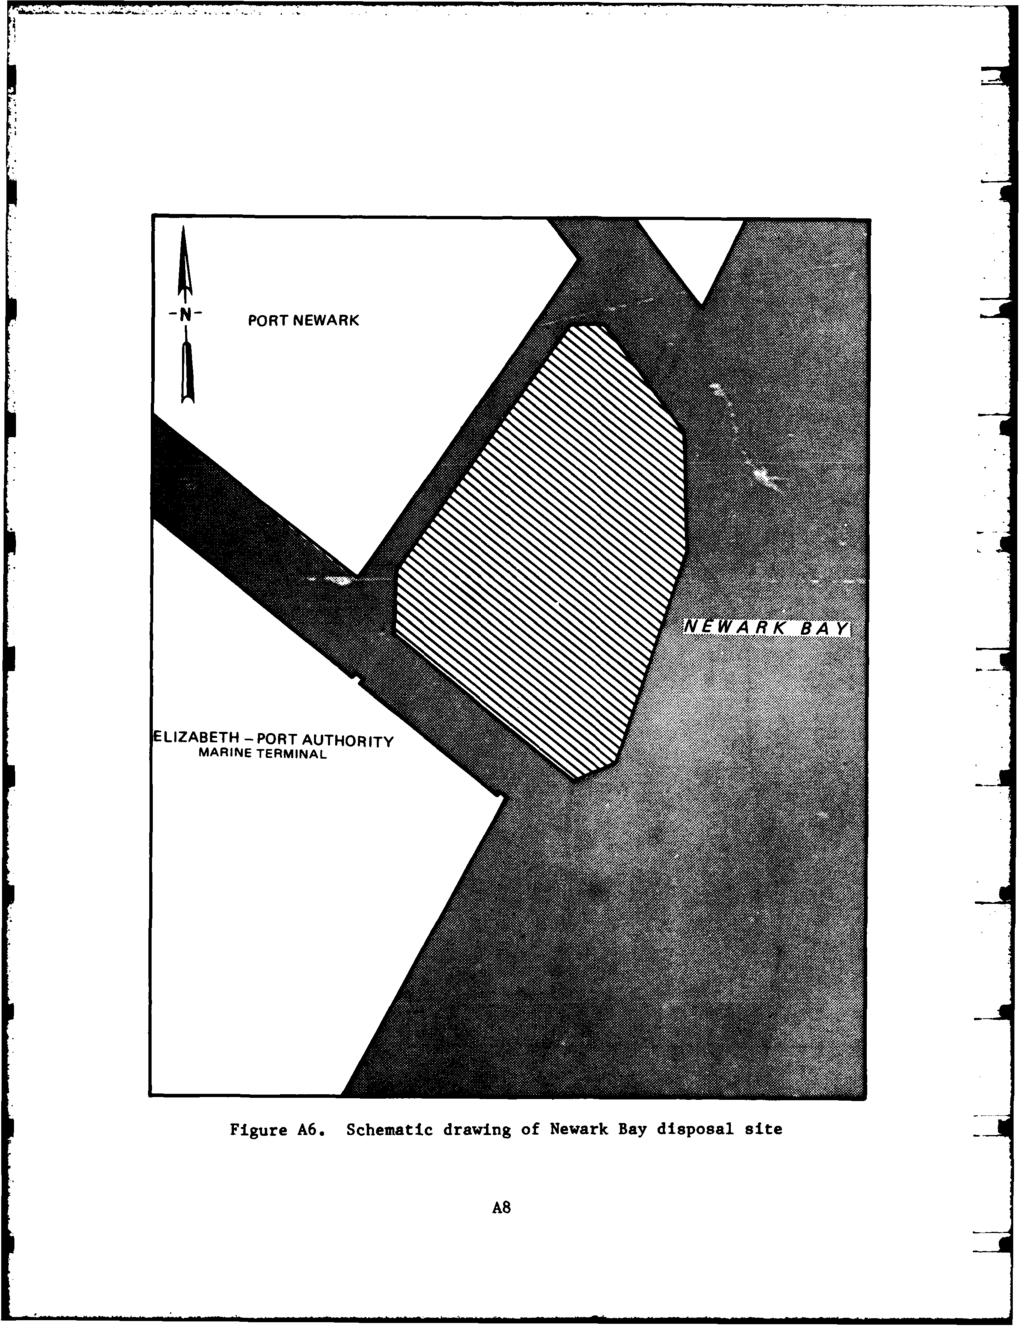
59 AA8
Effects of D~edghag Technical Notes
 Environmental Effects of D~edghag Technical Notes PCDDF89--UPDATEDCOMPUTER MODEL TO EVALUATE CONSOLIDATION/DESICCATIONOF SOFT SOILS PURPOSE: This technical note describes a modified and updated version
Case Studies of PSDDF Application for Phased Placement of Dredged Soils
 Case Studies of PSDDF Application for Phased Placement of Dredged Soils Timothy D. Stark, Ph.D., P.E. Professor of Civil and Environmental Engineering University of Illinois at Urbana-Champaign 205 N.
 Project: ITHACA-TOMPKINS REGIONAL AIRPORT EXPANSION Project Location: ITHACA, NY Project Number: 218-34 Key to Soil Symbols and Terms TERMS DESCRIBING CONSISTENCY OR CONDITION COARSE-GRAINED SOILS (major
Seepage Induced Consolidation Model Correlation with Index Properties
 Seepage Induced Consolidation Model Correlation with Index Properties M. Janbaz, A. Maher, S. Janbaz Abstract. Consolidation of soft sediments stored in the confined disposal facilities or mine tailing
Compressibility & Consolidation
 CHAPTER Compressibility & Consolidation Settlement If a structure is placed on soil surface, then the soil will undergo an elastic and plastic deformation. In engineering practice, the deformation or reduction
Class Principles of Foundation Engineering CEE430/530
 Class Principles of Foundation Engineering CEE430/530 1-1 General Information Lecturer: Scott A. Barnhill, P.E. Lecture Time: Thursday, 7:10 pm to 9:50 pm Classroom: Kaufmann, Room 224 Office Hour: I have
Introduction to Soil Mechanics Geotechnical Engineering-II
 Introduction to Soil Mechanics Geotechnical Engineering-II ground SIVA Dr. Attaullah Shah 1 Soil Formation Soil derives from Latin word Solum having same meanings as our modern world. From Geologist point
Geotechnical Properties of Soil
 Geotechnical Properties of Soil 1 Soil Texture Particle size, shape and size distribution Coarse-textured (Gravel, Sand) Fine-textured (Silt, Clay) Visibility by the naked eye (0.05 mm is the approximate
Calculation of 1-D Consolidation Settlement
 Calculation of 1-D Consolidation Settlement A general theory for consolidation, incorporating threedimensional flow is complicated and only applicable to a very limited range of problems in geotechnical
IN SITU SPECIFIC GRAVITY VS GRAIN SIZE: A BETTER METHOD TO ESTIMATE NEW WORK DREDGING PRODUCTION
 IN SITU SPECIFIC GRAVITY VS GRAIN SIZE: A BETTER METHOD TO ESTIMATE NEW WORK DREDGING PRODUCTION Nancy Case O Bourke, PE 1, Gregory L. Hartman, PE 2 and Paul Fuglevand, PE 3 ABSTRACT In-situ specific gravity
CONSOLIDATION OF SOIL
 Lecture-6 Soil consolidation Dr. Attaullah Shah 1 CONSOLIDATION OF SOIL When a soil mass is subjected to a compressive force there is a decrease in volume of soil mass. The reduction in volume of a saturated
EEEEEEE. 7 nd-a1?2 ii7 STATEMENT OF NEGATIVE FINDINGS ON THE TEST EXCAVATIONS 1;1
 7 nd-a1?2 ii7 STATEMENT OF NEGATIVE FINDINGS ON THE TEST EXCAVATIONS 1;1 AT THE REUNION SITE -- 32WA406(U) NORTH DAKOTA UNIY GRAND FORKS DEPT OF ANTHROPOLOGY AND ARCHAEOLOGY UNCLASSFIE EEEEEEE L L LOENDORF
Appendix E. Phase 2A Geotechnical Data
 Appendix E Phase 2A Geotechnical Data Appendix E1 Geotechnical Testing of Sediment ApPENDIX El. GEOTECHNICAL TESTING OF SEDIMENT (Modified from Exponent, 20Q1c) E.I Introduction This appendix presents
University, 470 Hitchcock Hall, 2070 Neil Ave., Columbus, OH 43210, US, Tel: (614) 292-
 292-") 2013 World of Coal Ash (WOCA) Conference - April 22-25, 2013 in Lexington, KY http://www.flyash.info/ Liquefaction Potential of Impounded Class F Fly Ash Nathan A. Yencho 1, Brian C. Dudley 1, Pedro J.
2013 World of Coal Ash (WOCA) Conference - April 22-25, 2013 in Lexington, KY http://www.flyash.info/ Liquefaction Potential of Impounded Class F Fly Ash Nathan A. Yencho 1, Brian C. Dudley 1, Pedro J.
CE 240 Soil Mechanics & Foundations Lecture 3.2. Engineering Classification of Soil (AASHTO and USCS) (Das, Ch. 4)
 (Das, Ch. 4)") CE 240 Soil Mechanics & Foundations Lecture 3.2 Engineering Classification of Soil (AASHTO and USCS) (Das, Ch. 4) Outline of this Lecture 1. Particle distribution and Atterberg Limits 2. Soil classification
CE 240 Soil Mechanics & Foundations Lecture 3.2 Engineering Classification of Soil (AASHTO and USCS) (Das, Ch. 4) Outline of this Lecture 1. Particle distribution and Atterberg Limits 2. Soil classification
B-1 BORE LOCATION PLAN. EXHIBIT Drawn By: 115G BROOKS VETERINARY CLINIC CITY BASE LANDING AND GOLIAD ROAD SAN ANTONIO, TEXAS.
 N B-1 SYMBOLS: Exploratory Boring Location Project Mngr: BORE LOCATION PLAN Project No. GK EXHIBIT Drawn By: 115G1063.02 GK Scale: Checked By: 1045 Central Parkway North, Suite 103 San Antonio, Texas 78232
DATA REPORT GEOTECHNICAL INVESTIGATION GALVESTON CRUISE TERMINAL 2 GALVESTON, TEXAS
 DATA REPORT GEOTECHNICAL INVESTIGATION GALVESTON CRUISE TERMINAL 2 GALVESTON, TEXAS SUBMITTED TO PORT OF GALVESTON 123 ROSENBERG AVENUE, 8TH FLOOR GALVESTON, TEXAS 77553 BY HVJ ASSOCIATES, INC. HOUSTON,
Correlation of unified and AASHTO soil classification systems for soils classification
 Journal of Earth Sciences and Geotechnical Engineering, vol. 8, no. 1, 2018, 39-50 ISSN: 1792-9040 (print version), 1792-9660 (online) Scienpress Ltd, 2018 Correlation of unified and AASHTO classification
Chapter 7: Settlement of Shallow Foundations
 Chapter 7: Settlement of Shallow Foundations Introduction The settlement of a shallow foundation can be divided into two major categories: (a) elastic, or immediate settlement and (b) consolidation settlement.
Variability in Geotechnical Properties of Sediments and Dredged Materials
 Variability in Geotechnical Properties of Sediments and Dredged Materials PURPOSE: This technical note provides an overview of selected uncertainties involved in estimating or characterizing pre-dredged
Consolidation Properties of NAPL Contaminated Sediments
 Consolidation Properties of NAPL Contaminated Sediments M. B. Erten 1, C. S. El Mohtar 2, D. D. Reible 3, R. B. Gilbert 4 1 Graduate Research Assistant, University of Texas at Austin, 1 University Station
GEOTECHNICAL INVESTIGATION REPORT
 GEOTECHNICAL INVESTIGATION REPORT SOIL INVESTIGATION REPORT FOR STATIC TEST FACILITY FOR PROPELLANTS AT BDL, IBRAHIMPATNAM. Graphics Designers, M/s Architecture & Engineering 859, Banjara Avenue, Consultancy
Solution:Example 1. Example 2. Solution: Example 2. clay. Textural Soil Classification System (USDA) CE353 Soil Mechanics Dr.
 CE353 Soil Mechanics Dr.") CE353 Soil Mechanics CE353 Lecture 5 Geotechnical Engineering Laboratory SOIL CLASSIFICATION Lecture 5 SOIL CLASSIFICATION Dr. Talat A Bader Dr. Talat Bader 2 Requirements of a soil Systems Why do we need
CE353 Soil Mechanics CE353 Lecture 5 Geotechnical Engineering Laboratory SOIL CLASSIFICATION Lecture 5 SOIL CLASSIFICATION Dr. Talat A Bader Dr. Talat Bader 2 Requirements of a soil Systems Why do we need
Module 1 GEOTECHNICAL PROPERTIES OF SOIL AND OF REINFORCED SOIL (Lectures 1 to 4)
") Module 1 GEOTECHNICAL PROPERTIES OF SOIL AND OF REINFORCED SOIL (Lectures 1 to 4) Topics 1.1 INTRODUCTION 1.2 GRAIN-SIZE DISTRIBUTION Sieve Analysis Hydrometer Analysis 1.3 SIZE LIMITS FOR SOILS 1.4 WEIGHT-VOLUME
Module 1 GEOTECHNICAL PROPERTIES OF SOIL AND OF REINFORCED SOIL (Lectures 1 to 4) Topics 1.1 INTRODUCTION 1.2 GRAIN-SIZE DISTRIBUTION Sieve Analysis Hydrometer Analysis 1.3 SIZE LIMITS FOR SOILS 1.4 WEIGHT-VOLUME
Redwood City Harbor, California, Navigation Improvement Feasibility Study. Appendix D. Geotechnical Engineering. DRAFT April 2015
 1 Redwood City Harbor, California, Navigation Improvement Feasibility Study Appendix D Geotechnical Engineering DRAFT April 2015 2 Contents 1 Purposes of Report... 3 2 Background... 3 3 References and
SECURITY CLASSIFICATION OF TWI",A,'- Form Approved. ICUMENTATION'PAGE OMB No b. RESTRICTIVE MARKINGS OF
 SECURITY CLASSIFICATION OF TWI",A,'- Form Approved ICUMENTATION'PAGE OMB No. 0704-0188 AD- A207 216 1b. RESTRICTIVE MARKINGS OF 3. DISTRIBUTION/AVAILABILITY OF REPORT Approved for puli c release b. DECLASSiFICATION
The Effects of Different Surcharge Pressures on 3-D Consolidation of Soil
 The Effects of Different Surcharge Pressures on 3-D Consolidation of Soil Arpan Laskar *1 and Sujit Kumar Pal 2 *1 Department of Civil Engineering, National Institute of Technology Agartala, Tripura, India.
Principles of Foundation Engineering 8th Edition Das SOLUTIONS MANUAL
 Principles of Foundation Engineering 8th Edition SOLUTIONS MANUAL Full clear download (no formatting errors) at: https://testbankreal.com/download/principles-foundation-engineering- 8th-edition-das-solutions-manual/
Tikrit University College of Engineering Civil engineering Department
 Tikrit University SOIL CLASSIFICATION College of Engineering Civil engineering Department Soil Mechanics 3 rd Class Lecture notes Up Copyrights 2016 Classification of soil is the separation of soil into
Chapter 1 - Soil Mechanics Review Part A
 Chapter 1 - Soil Mechanics Review Part A 1.1 Introduction Geotechnical Engineer is concerned with predicting / controlling Failure/Stability Deformations Influence of water (Seepage etc.) Soil behavour
Appendix I. Dredged Volume Estimates. Draft Contractor Document: Subject to Continuing Agency Review
 Appendix I Dredged Volume Estimates Draft Contractor Document: Subject to Continuing Agency Review Interoffice Correspondence Date: April 6, 2007 To: L. Bossi (WHI) Copy: S. Thompson (WHI), B. Fidler (NNJ)
173 ENERGETIC ION BERN-PLASMA INTERACTIONS(U) PRINCETON i/i UNIV N J PLASMA PHYSICS LAB P KULSRUD 09 MAR 84 RFOSR-TR AFOSR
 PRINCETON i/i UNIV N J PLASMA PHYSICS LAB P KULSRUD 09 MAR 84 RFOSR-TR AFOSR") ,-AD-A14@ 173 ENERGETIC ION BERN-PLASMA INTERACTIONS(U) PRINCETON i/i UNIV N J PLASMA PHYSICS LAB P KULSRUD 09 MAR 84 RFOSR-TR--84-9228 AFOSR-83-0203 UNCLRSSIFIED F/G 20/9 NL iii LL~ -A M ma -wn STMaRCS1g3-
,-AD-A14@ 173 ENERGETIC ION BERN-PLASMA INTERACTIONS(U) PRINCETON i/i UNIV N J PLASMA PHYSICS LAB P KULSRUD 09 MAR 84 RFOSR-TR--84-9228 AFOSR-83-0203 UNCLRSSIFIED F/G 20/9 NL iii LL~ -A M ma -wn STMaRCS1g3-
GEOTECHNICAL TESTING OF SEDIMENT
 ApPENDIX El. GEOTECHNICAL TESTING OF SEDIMENT (Modified from Exponent, 20Q1c) E.I Introduction This appendix presents information regarding geotechnical testing performed in 2000 on sediments in Onondaga
4. Soil Consistency (Plasticity) (Das, chapter 4)
 (Das, chapter 4)") 4. Soil Consistency (Plasticity) (Das, chapter 4) 1 What is Consistency? Consistency is a term used to describe the degree of firmness of fine-grained soils (silt and clay). The consistency of fine grained
4. Soil Consistency (Plasticity) (Das, chapter 4) 1 What is Consistency? Consistency is a term used to describe the degree of firmness of fine-grained soils (silt and clay). The consistency of fine grained
A. V T = 1 B. Ms = 1 C. Vs = 1 D. Vv = 1
 Geology and Soil Mechanics 55401 /1A (2002-2003) Mark the best answer on the multiple choice answer sheet. 1. Soil mechanics is the application of hydraulics, geology and mechanics to problems relating
Geology and Soil Mechanics /1A ( ) Mark the best answer on the multiple choice answer sheet.
 Mark the best answer on the multiple choice answer sheet.") Geology and Soil Mechanics 55401 /1A (2003-2004) Mark the best answer on the multiple choice answer sheet. 1. Soil mechanics is the application of hydraulics, geology and mechanics to problems relating
Geology and Soil Mechanics 55401 /1A (2003-2004) Mark the best answer on the multiple choice answer sheet. 1. Soil mechanics is the application of hydraulics, geology and mechanics to problems relating
PREDICTING SOIL SUCTION PROFILES USING PREVAILING WEATHER
 PREDICTING SOIL SUCTION PROFILES USING PREVAILING WEATHER Ronald F. Reed, P.E. Member, ASCE rreed@reed-engineering.com Reed Engineering Group, Ltd. 2424 Stutz, Suite 4 Dallas, Texas 723 214-3-6 Abstract
Field Exploration. March 31, J-U-B ENGINEERS, Inc. 115 Northstar Avenue Twin Falls, Idaho Attn: Mr. Tracy Ahrens, P. E. E:
 March 31, 201 11 Northstar Avenue 83301 Attn: Mr. Tracy Ahrens, P. E. E: taa@jub.com Re: Geotechnical Data Report Preliminary Phase 1 Field Exploration Revision No. 1 Proposed Rapid Infiltration Basin
Prof. B V S Viswanadham, Department of Civil Engineering, IIT Bombay
 06 Index properties Review Clay particle-water interaction Identification of clay minerals Sedimentation analysis Hydrometer analysis 0.995 20-40 Hydrometer is a device which is used to measure the specific
DRAFT ONONDAGA LAKE CAPPING AND DREDGE AREA AND DEPTH INITIAL DESIGN SUBMITTAL H.4 SEISMIC SLOPE STABILITY ANALYSES
 DRAFT ONONDAGA LAKE CAPPING AND DREDGE AREA AND DEPTH INITIAL DESIGN SUBMITTAL H.4 SEISMIC SLOPE STABILITY ANALYSES Parsons P:\Honeywell -SYR\444576 2008 Capping\09 Reports\9.3 December 2009_Capping and
Time Rate of Consolidation Settlement
 Time Rate of Consolidation Settlement We know how to evaluate total settlement of primary consolidation S c which will take place in a certain clay layer. However this settlement usually takes place over
Assessment of accuracy in determining Atterberg limits for four Iraqi local soil laboratories
 IOP Conference Series: Materials Science and Engineering PAPER OPEN ACCESS Assessment of accuracy in determining Atterberg limits for four Iraqi local soil laboratories To cite this article: H O Abbas
OF NAVAL RESEARCH. Technical Report No. 87. Prepared for Publication. in the.. v.. il and/or -- c Spocial Journal of Elactroanalytical Chemistry it
 ,~OFFICE OF NAVAL RESEARCH Contract N00014-86-K-0556 Technical Report No. 87. Th., Combined Influence of Solution Resistance and Charge-Transfer Kinetics on Microelectrode Cyclic Voltammetry oo i Acee'ic
CHARACTERIZATION OF SOFT CLAY- A CASE STUDY AT CRANEY ISLAND
 National Defense Industrial Association 2005 Tri-Service Infrastructure Systems Conference and Exhibition Re-Energizing Engineering Excellence CHARACTERIZATION OF SOFT CLAY- A CASE STUDY AT CRANEY ISLAND
APPLICATION OF LABORATORY AND MODELING TOOLS TO DESIGN THIN LAYER PLACEMENT PROJECTS FOR MARSH NOURISHMENT
 APPLICATION OF LABORATORY AND MODELING TOOLS TO DESIGN THIN LAYER PLACEMENT PROJECTS FOR MARSH NOURISHMENT Susan Bailey 1, Zachary Tyler 2 and Timothy Welp 3 ABSTRACT Thin layer placement of dredged material
USEPA National Watershed Protection Program NY/NJ Harbor Estuary Program USEPA Region 2 New York, New York. USEPA Contract EP-C
 USEPA National Watershed Protection Program NY/NJ Harbor Estuary Program USEPA Region 2, EVALUATION OF AMMONIA TOXICITY IN THE NY/NJ HARBOR WITHIN THE CONTEXT OF NITROGEN AND CARBON TMDL PLANNING FOR ATTAINMENT
 QUESTION BANK DEPARTMENT: CIVIL SUBJECT CODE / Name: CE 2251 / SOIL MECHANICS SEMESTER: IV UNIT 1- INTRODUCTION PART - A (2 marks) 1. Distinguish between Residual and Transported soil. (AUC May/June 2012)
Applying Electrical Resistivity Methods for Measuring Dredged Material Density in Hopper Bins
 DRP-3-07 November 1992 Dredging Technical Research Notes Applying Electrical Resistivity Methods for Measuring Dredged Material Density in Hopper Bins Purpose This technical note provides information on
H.1 SUMMARY OF SUBSURFACE STRATIGRAPHY AND MATERIAL PROPERTIES (DATA PACKAGE)
") DRAFT ONONDAGA LAKE CAPPING AND DREDGE AREA AND DEPTH INITIAL DESIGN SUBMITTAL H.1 SUMMARY OF SUBSURFACE STRATIGRAPHY AND MATERIAL PROPERTIES (DATA PACKAGE) Parsons P:\Honeywell -SYR\444576 2008 Capping\09
DRAFT ONONDAGA LAKE CAPPING AND DREDGE AREA AND DEPTH INITIAL DESIGN SUBMITTAL H.1 SUMMARY OF SUBSURFACE STRATIGRAPHY AND MATERIAL PROPERTIES (DATA PACKAGE) Parsons P:\Honeywell -SYR\444576 2008 Capping\09
WRb-Al? 164 STATISTICAL TECHNIQUES FOR SIGNAL PROCESSING(U) 1/1 PENNSYLVANIA UNIV PHILADELPHIA S A KASSAN 30 NAY 85 AFOSR-TR-6-01?
 1/1 PENNSYLVANIA UNIV PHILADELPHIA S A KASSAN 30 NAY 85 AFOSR-TR-6-01?") WRb-Al? 164 STATISTICAL TECHNIQUES FOR SIGNAL PROCESSING(U) 1/1 PENNSYLVANIA UNIV PHILADELPHIA S A KASSAN 30 NAY 85 AFOSR-TR-6-01?2 RFOSR-82-9022 UNCLASSFE F/G 9/4 NL ti 1.0 i Q.2. UILO III,-. o,33% %
WRb-Al? 164 STATISTICAL TECHNIQUES FOR SIGNAL PROCESSING(U) 1/1 PENNSYLVANIA UNIV PHILADELPHIA S A KASSAN 30 NAY 85 AFOSR-TR-6-01?2 RFOSR-82-9022 UNCLASSFE F/G 9/4 NL ti 1.0 i Q.2. UILO III,-. o,33% %
IUNCLSSIME N E F/G 11?2 NL
 AD-RI58 658 BORON-NITROGEN POLYNERS(U) ULTRASYSTENS INC IRVINE CA III 1 K L PACIOREK ET AL. 01 JUL 85 SN-2822-F NS9914-82-C-9482 IUNCLSSIME N E F/G 11?2 NL 1.0 16 2.: w1111342 1.8 11111125 1111.4 L MICROCOPY
MARTIN COUNTY BOARD OF COUNTY COMMISSIONERS
 MARTIN COUNTY BOARD OF COUNTY COMMISSIONERS 4 S.E. MONTEREY ROAD STUART, FL 34996 DOUG SMITH Commissioner, District ED FIELDING Commissioner, District ANNE SCOTT Commissioner, District 3 SARAH HEARD Commissioner,
The Ohio Department of Transportation Office of Research & Development Executive Summary Report
 The Ohio Department of Transportation Office of Research & Development Executive Summary Report Shear Strength of Clay and Silt Embankments Start Date: January 1, 2007 Duration: 2 Years- 10 Months Completion
P.E. Civil Exam Review: GEOMECHANICS. Jerry Vandevelde, P.E.
 P.E. Civil Exam Review: GEOMECHANICS Jerry Vandevelde, P.E. gtv@gemeng.com GEOMECHANICS National Council of Examiners for Engineering and Surveying http://www.ncees.org/ 3 STUDY REFERENCES Foundation Engineering;
December 5, Junction Gateway, LLC 7551 W. Sunset Boulevard #203 Los Angeles, CA Mr. James Frost P: Dear Mr.
 December 5, 2014 Junction Gateway, LLC 7551 W. Sunset Boulevard #203 90046 Attn: Re: Mr. James Frost P: 323.883.1800 Geotechnical Update Letter Sunset & Effie Mixed Use Development 4301 to 4311 Sunset
The process of consolidation and settlement
 Consolidation Based on part of the GeotechniCAL reference package by Prof. John Atkinson, City University, London The process of consolidation and settlement One-dimensional consolidation theory The oedometer
CHAPTER-11 CLIMATE AND RAINFALL
 CHAPTER-11 CLIMATE AND RAINFALL 2.1 Climate Climate in a narrow sense is usually defined as the "average weather", or more rigorously, as the statistical description in terms of the mean and variability
Assistant Prof., Department of Civil Engineering Bhagwant University,Ajmer,Rajasthan,India ABSTRACT
 Study of Index Properties of the Soil 1 Mr Utkarsh Mathur 2 Mr Nitin Kumar 3 Mr Trimurti Narayan Pandey 4 Mr.Amit Choudhary 1 PG Scholar, Department of Civil Engineering Bhagwant University,Ajmer,Rajasthan,India
Chapter I Basic Characteristics of Soils
 Chapter I Basic Characteristics of Soils Outline 1. The Nature of Soils (section 1.1 Craig) 2. Soil Texture (section 1.1 Craig) 3. Grain Size and Grain Size Distribution (section 1.2 Craig) 4. Particle
DEPARTMENT OF THE ARMY WATERWAYS EXPERIMENT STATION. CORPS OF ENGINEERS P. 0. BOX 631 VICKSBURG. MISSISSIPPI 39180
 DEPARTMENT OF THE ARMY WATERWAYS EXPERIMENT STATION. CORPS OF ENGINEERS P. 0. BOX 631 VICKSBURG. MISSISSIPPI 39180 IN REPLY REF6R TO: WESYV 31 July 1978 SUBJECT: Transmittal of Technical Report D-78-34
Table of Contents Chapter 1 Introduction to Geotechnical Engineering 1.1 Geotechnical Engineering 1.2 The Unique Nature of Soil and Rock Materials
 Table of Contents Chapter 1 Introduction to Geotechnical Engineering 1.1 Geotechnical Engineering 1.2 The Unique Nature of Soil and Rock Materials 1.3 Scope of This Book 1.4 Historical Development of Geotechnical
SHEAR STRENGTH OF SOIL
 Soil Failure Criteria SHEAR STRENGTH OF SOIL Knowledge about the shear strength of soil important for the analysis of: Bearing capacity of foundations, Slope stability, Lateral pressure on retaining structures,
PRELIMINARY DRAFT FOR DISCUSSION PURPOSES
 Memorandum To: David Thompson From: John Haapala CC: Dan McDonald Bob Montgomery Date: February 24, 2003 File #: 1003551 Re: Lake Wenatchee Historic Water Levels, Operation Model, and Flood Operation This
I., 1 Wright-Patterson Air Force Base, Ohio DTIC OFP S AP119D AIR FORCE INSTITUTE OF TECHNOLOGY ELECTE
 OFP CI THE APPLICATION OF KRIGING IN THE STATISTICAL ANALYSIS OF ANTHROPOMETRIC DATA VOLUME II THESIS Michael Grant Captain, USAF AFIT/G OR/ENY/ ENS /90M-8 DTIC ELECTE DEPARTMENT OF THE AIR FORCE AIR UNIVERSITY
Civil Engineering, Surveying and Environmental Consulting WASP0059.ltr.JLS.Mich Ave Bridge Geotech.docx
 2365 Haggerty Road South * Canton, Michigan 48188 P: 734-397-3100 * F: 734-397-3131 * www.manniksmithgroup.com August 29, 2012 Mr. Richard Kent Washtenaw County Parks and Recreation Commission 2330 Platt
WASTE CLAY DISPOSAL IN MINE CUTS FINAL REPORT. BY BROMWELL ENGINEERING, INC. 202 Lake Miriam Drive Lakeland, Florida
 WASTE CLAY DISPOSAL IN MINE CUTS FINAL REPORT BY BROMWELL ENGINEERING, INC. 202 Lake Miriam Drive Lakeland, Florida 33803 Principal Investigator: W. David Carrier, III Prepared for FLORIDA INSTITUTE OF
B-1 SURFACE ELEVATION
 5A 5B LOGGED BY El. S. Bhangoo DRILLING CONTRACTOR Pitcher Drilling DRILLING METHOD Rotary Wash BEGIN DATE 12-14-12 SAMPLER TYPE(S) AND SIZE(S) (ID) SPT, MC BOREHOLE BACKFILL AND COMPLETION COMPLETION
 Photo 1 - Southerly view across 2700 parking lot toward existing building. Multi-residential building borders western side of property in upper right of view. Photo 2 - Southerly view across 2750 parking
Vermont Soil Climate Analysis Network (SCAN) sites at Lye Brook and Mount Mansfield
 sites at Lye Brook and Mount Mansfield") Vermont Soil Climate Analysis Network (SCAN) sites at Lye Brook and Mount Mansfield 13 Years of Soil Temperature and Soil Moisture Data Collection September 2000 September 2013 Soil Climate Analysis Network
Vermont Soil Climate Analysis Network (SCAN) sites at Lye Brook and Mount Mansfield 13 Years of Soil Temperature and Soil Moisture Data Collection September 2000 September 2013 Soil Climate Analysis Network
FUNDAMENTALS OF CONSOLIDATION
 FUNDAMENTALS OF CONSOLIDATION σ (Vertical Stress Increase) SAND CLAY CONSOLIDATION: Volume change in saturated soils caused by the expulsion of pore water from loading. Saturated Soils: σ causes u to increase
Chapter 2. 53% v. 2.2 a. From Eqs. (2.11) and (2.12), it can be seen that, 2.67
 and (2.12), it can be seen that, 2.67") Chapter 2 2.1 d. (87.5)(9.81) (1000)(0.05) 3 17.17 kn/m c. d 1 w 17.17 1 0.15 3 14.93 kn/m G a. Eq. (2.12): s w (2.68)(9.81). 14.93 ; e 0.76 1 e 1 e e 0.76 b. Eq. (2.6): n 0.43 1 e 1 0.76 Vw wgs (0.15)(2.68)
Chapter 2 2.1 d. (87.5)(9.81) (1000)(0.05) 3 17.17 kn/m c. d 1 w 17.17 1 0.15 3 14.93 kn/m G a. Eq. (2.12): s w (2.68)(9.81). 14.93 ; e 0.76 1 e 1 e e 0.76 b. Eq. (2.6): n 0.43 1 e 1 0.76 Vw wgs (0.15)(2.68)
2012 USACE Drought Actions
 2012 USACE Drought Actions for Inland Waterway Users Board 68 Jim Walker Navigation Branch Chief 19 December 2012 US US Army Corps of of Engineers US Drought Monitor 1 2 3 4 6 5 Impacts: 1. The area in
Cyclic Triaxial Testing of Water-Pluviated Fly Ash Specimens
 2013 World of Coal Ash (WOCA) Conference - April 22-25, 2013 in Lexington, KY http://www.flyash.info/ Cyclic Triaxial Testing of Water-Pluviated Fly Ash Specimens Jeffrey S. Dingrando 1, Michael E. Kalinski
FUNDAMENTALS SOIL MECHANICS. Isao Ishibashi Hemanta Hazarika. >C\ CRC Press J Taylor & Francis Group. Taylor & Francis Group, an Informa business
 SOIL MECHANICS FUNDAMENTALS Isao Ishibashi Hemanta Hazarika >C\ CRC Press J Taylor & Francis Group Boca Raton London New York CRC Press is an imprint of the Taylor & Francis Group, an Informa business
APPENDIX F CORRELATION EQUATIONS. F 1 In-Situ Tests
 APPENDIX F 1 APPENDIX F CORRELATION EQUATIONS F 1 In-Situ Tests 1. SPT (1) Sand (Hatanaka and Uchida, 1996), = effective vertical stress = effective friction angle = atmosphere pressure (Shmertmann, 1975)
Depth (ft) USCS Soil Description TOPSOIL & FOREST DUFF
 USCS Soil Description TOPSOIL & FOREST DUFF") Test Pit No. TP-6 Location: Latitude 47.543003, Longitude -121.980441 Approximate Ground Surface Elevation: 1,132 feet Depth (ft) USCS Soil Description 0 1.5 1.5 5.0 SM 5.0 8.0 SM Loose to medium dense,
Test Pit No. TP-6 Location: Latitude 47.543003, Longitude -121.980441 Approximate Ground Surface Elevation: 1,132 feet Depth (ft) USCS Soil Description 0 1.5 1.5 5.0 SM 5.0 8.0 SM Loose to medium dense,
Coastal and Hydraulics Laboratory
 ERDC/CHL TR-05-6 Texas City Ship Channel Deepening Study, Hydrodynamic Model Lisa M. Lee, Jennifer N. Tate, and R. C. Berger August 2005 Coastal and Hydraulics Laboratory Approved for public release; distribution
Soil Mechanics Brief Review. Presented by: Gary L. Seider, P.E.
 Soil Mechanics Brief Review Presented by: Gary L. Seider, P.E. 1 BASIC ROCK TYPES Igneous Rock (e.g. granite, basalt) Rock formed in place by cooling from magma Generally very stiff/strong and often abrasive
Geotechnical Engineering I CE 341
 Geotechnical Engineering I CE 341 What do we learn in this course? Introduction to Geotechnical Engineering (1) Formation, Soil Composition, Type and Identification of Soils (2) Soil Structure and Fabric
CHAPTER: 4 PLASTICITY OF SOILS
 CHAPTER: 4 PLASTICITY OF SOILS CONTENTS: Plasticity characteristics of soils, Atterberg limits, determination of shrinkage limit, plasticity, liquidity & consistency indexes, thixotropy, activity of soil,
CE 240 Soil Mechanics & Foundations Lecture 5.2. Permeability III (Das, Ch. 6) Summary Soil Index Properties (Das, Ch. 2-6)
 Summary Soil Index Properties (Das, Ch. 2-6)") CE 40 Soil Mechanics & Foundations Lecture 5. Permeability III (Das, Ch. 6) Summary Soil Index Properties (Das, Ch. -6) Outline of this Lecture 1. Getting the in situ hydraulic conductivity 1.1 pumping
CE 40 Soil Mechanics & Foundations Lecture 5. Permeability III (Das, Ch. 6) Summary Soil Index Properties (Das, Ch. -6) Outline of this Lecture 1. Getting the in situ hydraulic conductivity 1.1 pumping
Compute the lateral force per linear foot with sloping backfill and inclined wall. Use Equation No. 51, page 93. Press ENTER.
 Sample Problems Problem 5.1 A gravity retaining wall is supporting a cohesionless soil. The active lateral force per linear foot of the retaining wall is most nearly (A) 5,000 lb/ft (B) 6,000 lb/ft (C)
Highland Lake Bathymetric Survey
 Highland Lake Bathymetric Survey Final Report, Prepared For: The Town of Highland Lake 612 Lakeshore Drive Oneonta, AL 35121 Prepared By: Tetra Tech 2110 Powers Ferry Road SE Suite 202 Atlanta, GA 30339
SOME OBSERVATIONS RELATED TO LIQUEFACTION SUSCEPTIBILITY OF SILTY SOILS
 SOME OBSERVATIONS RELATED TO LIQUEFACTION SUSCEPTIBILITY OF SILTY SOILS Upul ATUKORALA 1, Dharma WIJEWICKREME 2 And Norman MCCAMMON 3 SUMMARY The liquefaction susceptibility of silty soils has not received
Stone Outlet Sediment Trap
 3.12 Sediment Control Description: A stone outlet sediment trap is a small detention area formed by placing a stone embankment with an integral stone filter outlet across a drainage swale for the purpose
 SOIL CLASSIFICATION CHART COARSE-GRAINED SOILS MORE THAN 50% RETAINED ON NO.200 SIEVE FINE-GRAINED SOILS 50% OR MORE PASSES THE NO.200 SIEVE PRIMARY DIVISIONS GRAVELS MORE THAN 50% OF COARSE FRACTION RETAINED
SECONDARY COMPRESSION BEHAVIOR IN ONE-DIMENSIONAL CONSOLIDATION TESTS
 Journal of GeoEngineering, Vol. 7, No., pp. 53-58, August Takeda et al.: Secondary Compression Behavior in One-Dimensional Consolidation Tests 53 SECONDARY COMPRESSION BEHAVIOR IN ONE-DIMENSIONAL CONSOLIDATION
Supplementary Problems for Chapter 7
 Supplementary Problems for Chapter 7 Problem 7.1 consolidation test has been carried out on a standard 19 mm thick clay sample. The oedometer s deflection gauge indicated 1.66 mm, just before the removal
Introduction to Soil Mechanics
 Introduction to Soil Mechanics Sela Sode and Colin Jones WILEY Blackwell Contents Preface Dedication and Acknowledgments List of Symbols Soil Structure 1.1 Volume relationships 1.1.1 Voids ratio (e) 1.1.2
ADDENDUM 1 FISHER SLOUGH RESTORATION PROJECT SKAGIT COUNTY, WASHINGTON
 F I N A L A D D E N D U M 1 R E P O R T ADDENDUM 1 FISHER SLOUGH RESTORATION PROJECT SKAGIT COUNTY, WASHINGTON REPORT OF GEOTECHNICAL INVESTIGATION URS JOB NO. 3376186 Prepared for Tetra Tech Inc. 142
APPENDIX B HYDROLOGY
 APPENDIX B HYDROLOGY TABLE OF CONTENTS 1.0 INTRODUCTION... 1 2.0 PROBABLE MAXIMUM PRECIPITATION (PMP)... 1 3.0 DESIGN FLOW CALCULATION... 1 4.0 DIVERSION CHANNEL SIZING... 2 5.0 REFERENCES... 4 LIST OF
Illinois Drought Update, December 1, 2005 DROUGHT RESPONSE TASK FORCE Illinois State Water Survey, Department of Natural Resources
 Illinois Drought Update, December 1, 2005 DROUGHT RESPONSE TASK FORCE Illinois State Water Survey, Department of Natural Resources For more drought information please go to http://www.sws.uiuc.edu/. SUMMARY.
Lake Sedimentation Survey of Siloam Springs State Park Lake, Adams County, Illinois
 Contract Report 567 Lake Sedimentation Survey of Siloam Springs State Park Lake, Adams County, Illinois by Richard L. Allgire Office of Sediment & Wetland Studies Prepared for the Illinois Department of
MEMORANDUM. Scott Pickard, CELRB-TD-EH Michael Asquith, CELRB-PM-PM. From: Paul R. Schroeder, Ph.D., PE Earl Hayter, Ph.D. Date: 14 March 2016
 DEPARTMENT OF THE ARMY ENGINEER RESEARCH AND DEVELOPMENT CENTER, CORPS OF ENGINEERS ENVIRONMENTAL LABORATORY WATERWAYS EXPERIMENT STATION, 3909 HALLS FERRY ROAD VICKSBURG, MISSISSIPPI 39180-6199 29 November
NONDESTRUCTIVE TESTING OF CONCRETE T-WALLS, ATCHAFALAYA BASIN PROTECTION LEVEES, NEW ORLEANS DISTRICT
 \ u '-..J1:'rot:env of the United States --~---- ~ MISCELLANEOUS PAPER SL-79-18 NONDESTRUCTIVE TESTING OF CONCRETE T-WALLS, ATCHAFALAYA BASIN PROTECTION LEVEES, NEW ORLEANS DISTRICT by l-lenry T. Thornton,
APPENDIX A LAKE EVAPORATION
 APPENDICES APPENDIX A LAKE EVAPORATION 457 APPENDIX A LAKE EVAPORATION A.1 INTRODUCTION The net historic monthly inflows to Okanagan Lake as determined by change in lake storage and outflow corrected for
CONSOLIDATION TEST REPORT
 5 5 7 INITIAL.5.4... Pressure, p, tsf SUMMARY OF TEST RESULTS DRY DENSITY MOISTURE SATURATION VOID SPECIFIC OVERBURDEN P C C C SWELL PRESS. FINAL (pcf) CONTENT, (%) (%) RATIO GRAVITY (pcf) (pcf) (pcf)
ADVANCES in NATURAL and APPLIED SCIENCES
 ADVANCES in NATURAL and APPLIED SCIENCES ISSN: 1995-0772 Published BY AENSI Publication EISSN: 1998-1090 http://www.aensiweb.com/anas 2016 Special10(7): pages 386-391 Open Access Journal Shear Modulus
January 25, Summary
 January 25, 2013 Summary Precipitation since the December 17, 2012, Drought Update has been slightly below average in parts of central and northern Illinois and above average in southern Illinois. Soil
Tikrit University. College of Engineering Civil engineering Department CONSOILDATION. Soil Mechanics. 3 rd Class Lecture notes Up Copyrights 2016
 Tikrit University CONSOILDATION College of Engineering Civil engineering Department Soil Mechanics 3 rd Class Lecture notes Up Copyrights 2016 Stresses at a point in a soil mass are divided into two main