The significance of textures and trace element chemistry of quartz with regard to the petrogenesis of granitic rocks
|
|
|
- Jocelin McBride
- 5 years ago
- Views:
Transcription
1 Francois JACAMON The significance of textures and trace element chemistry of quartz with regard to the petrogenesis of granitic rocks Doctoral Thesis For the degree of Philosophiae Doctor (PhD) Trondheim, May 2006 Norwegian University of Science and Technology Faculty of Engineering Science and Technology Department of Geology and Mineral Resources Engineering Innovation and Creativity
2 Table of contents 1. Introduction Definition and objectives of the PhD project 3 Organization of the Doctoral Thesis..4 Summary 5 Publications and presentations related to the PhD project....8 Acknowledgments.9 2. Paper1. Relationship between SEM-Cathodoluminescence and trace element chemistry of quartz in granitic igneous rocks of the Oslo continental Rift. 50 pages, in review. 3. Paper2. Trace element evolution in quartz during fractional crystallisation of the high T and P charnockitic Kleivan granite, south-western Norway. 34 pages, in review. 4. Paper3. The Kleivan granite zonation: The result of close isobaric differentiation of a H 2 O-rich charnockitic melt at high P and T. 38 pages, in review. 2
3 Introduction Definition and objectives of the PhD project This doctoral project is a part of a larger project entitled "The value chain from mineral deposit to beneficiated product with emphasis on quartz". Several researchers from the Department of Geology and Mineral Resources Engineering (IGB) at the Norwegian University of Science and Technology (NTNU) are involved in three different subprojects. The general aim of this project is to meet the expected future shortage of high purity quartz raw materials for the solar cell market. The "geology" part of this project consists of prospecting for high purity natural quartz in Norway. The "beneficiation" part focuses on the processing techniques necessary for the refinement of quartz, so that it obtains the purity level required for industrial purposes, whereas the "characterization" part is largely concerned with the development of microscopic analytical techniques. This doctoral project is devoted to the geology part of the quartz project. The general objective of the present project is to contribute to a better understanding of the role of the different petrological processes upon the composition of quartz formed during the petrogenesis of granitic rocks. The intragranular textures and quartz grain framework and morphology yield important information on the nature and evolution of the melt from which quartz crystallized. The relative chemical and structural stability of quartz enables the conservation of quartz generations of different size, habit and structural state during the magmatic and post magmatic stages experienced by the granites. Contrary to quartz, feldspar is less resistant to alteration and its composition changes during cooling and reequilibration with the melt and the volatile fluids. This work focuses on primary magmatic quartz, but also documents the textural and chemical features of secondary quartz that formed at submagmatic conditions by reactions with coexisting hydrothermal fluids. The aim of this study is to determine the petrological significance of the trace element distribution and of the textures visible in cathodoluminescence (CL), to relate the chemical composition of quartz (trace element concentrations) to the thermodynamic variables characterizing the magmatic system: The bulk chemistry of 3
4 the parental melt (X), the pressure (P) and temperature (T) applied to the system, the water content of the melt (wt.% H 2 O) and the oxygen fugacity of the system (f O2 ). Combination of CL studies with micro-analytical results (EPMA, LA-ICP-MS) brings new insights into the origin, emplacement, crystallisation and textural evolution of fractionated granitic melts and provides valuable information about the complexity of petrological processes in granitic systems. This work is realized in close collaboration with a parallel project that specifically addresses metamorphic quartz and post-magmatic processes, i.e. dissolution and recrystallization under metamorphic conditions (Sørensen B. E., Metamorphic refinement of quartz under influence of fluids with reference to the metamorphic/metasomatic evolution observed in amphibolites- a detailed field, microtectonic and geochemical study from the Bamble Sector, South Norway. PhD Thesis (in prep.), IGB, NTNU, Trondheim). Organization of the Doctoral Thesis This dissertation is organised as a collection of papers and comprises four parts, including an introduction and three papers intended for publication in scientific journals. Paper 1, Relationship between SEM-Cathodoluminescence and trace element chemistry of quartz in granitic igneous rocks of the Oslo continental Rift addresses primary igneous processes as well as the role of hydrothermal fluids during the formation and alteration of quartz in granitic rocks from the Oslo continental rift. Particularly, this work emphasizes the corrosive and purifying effects of highly saline Cl-, F-rich aqueous fluids during the reaction with magmatic quartz and the formation of new quartz generations. Papers 2 and 3 are devoted to the Kleivan charnockitic granite of the Rogaland Igneous Province, Southwestern Norway. This granite shows a remarkable magmatic zonation from pyroxene-, through hornblende- to biotite-bearing compositions produced by granite fractionation and melt differentiation, which makes this intrusion particularly relevant in investigating the evolution of the quartz chemistry during magma differentiation. 4
5 The variations in the chemistry of magmatic quartz during differentiation of the Kleivan melt is documented and discussed in paper 2, Trace element evolution in quartz during fractional crystallisation of the high T and P charnockitic Kleivan granite, south-western Norway. This work demonstrates the strong influence of the temperature, the melt composition and the coexistence of other mineral phases on the partitioning of trace elements into quartz during cooling and differentiation of high T, high P granitic rocks. In addition to the study of quartz in the Kleivan granite, a new petrological model for the formation of the Kleivan intrusion and its particular zonation is addressed in paper 3, The Kleivan granite zonation: The result of close isobaric differentiation of a H 2 O-rich charnockitic melt at high P and T. This work investigates the igneous processes and thermodynamic conditions (P, T, H 2 O in the melt, fo 2 ) that controlled the solidification of the Kleivan magma chamber. The authors demonstrate the role of the high T, P, H 2 O content of the melt allowing convection in the chamber and gradual melt differentiation and granite fractionation. Each paper in this manuscript is independent from one another as the candidate intended to present each of them in its final form for publication. For publication, a subchapter on the regional geology, petrography and methodology is included in each paper. This implies unavoidable repetitions in the manuscript, in particular in the two papers dealing with the Kleivan granite. Similarly, several references are recurrent among the papers and thus are repeated in the reference list of the individual papers. Summary Several studies are devoted to the setting and speciation of trace elements in quartz. However, very few studies are concerned with the chemistry of quartz as a function of geological processes. Structurally bound elements in quartz are highly sensitive to petrogenetic processes. Due to their special physico-chemical properties, they feature a strong affinity to specific substitution sites and modes. Therefore, they are potential tracers of both the origin and the evolution of granitic rocks and efficiently discriminate between melts of different origins that otherwise may share many similarities. 5
6 By weight, Al, Ti, P, Li, Ge are the most abundant elements in quartz in that order of abundance. Fe, K, Na, B, Be comprise the remaining elements but are difficult to measure, either because their concentration is below detection limit (B, Be) or because of nonlinear analytical problems due to high background levels (Na, K, Fe). Ti 4+ and Ge 4+ are present in simple substitution after Si 4+, whereas P 5+ and an equivalent mole fraction of Al 3+ (Fe 3+, B 3+ ) substitute for two Si 4+ in the double (coupled) substitution mode. Al 3+ may also be associated with a charge compensator alkali cation (Li +, K +, Na + ) to replace Si 4+ in the compensated substitution mode. In the Oslo area, numerous granitic intrusions were emplaced during the main rifting episode ( Ma). The Drammen biotite granite as well as the Eikeren- Skrim and Hurdal-Nordmarka alkali feldspar granites (ekerites) belong to the most evolved rock types related to this period of plutonic activity. The study of quartz in these granites by SEM-CL and EPMA analysis reveal the presence of several generations of quartz distinguished by their particular textures and chemistry. The primary magmatic quartz (Qz1) has been partially replaced to secondary quartz by reaction with the hydrothermal fluids present in the magmatic systems. Typical growth sector zoning is nonetheless preserved and recognizable in most of the grains. Qz2 formed by diffusion of the fluids through Qz1 structure and is featured by a gradual variation of luminescence and chemistry from the margin to the core of the quartz grain. On the contrary, Qz3 is more evenly luminescent and is chemically homogeneous. Irregular Qz3 textures suggest a formation by dissolution/reprecipitation after interaction with the hydrothermal fluids. Qz4 represent the latest and tiniest structures. The intensity of luminescence seems to be strongly positively related to the Ti concentration in quartz. Ti and Al contents are highest in the magmatic quartz (Qz1) and vary from 50 to 200 ppm and from values below detection limit (LOD Al, 2σ =14 ppm) to 100 ppm, respectively. In the ekerites, Al is associated with K either in compensated substitution in quartz, or comprises accumulations of nano clusters or inclusions of K-feldspar adsorbed on certain faces during crystal growth of quartz. Conversely, Qz2 and Qz3 are strongly depleted in Ti and Al. These results demonstrate the important role of Cl-F-rich hydrothermal fluids in purifying the magmatic quartz by leaching Ti and Al from the quartz structure. The good wetting properties of these fluids and their ability to dissolve SiO 2 and Ti make them powerful chemical agents responsible for the alteration of igneous quartz in the Oslo rift granites. 6
7 The Kleivan granitic intrusion in the Rogaland Igneous Province, south-west Norway, features a spectacular magmatic zonation from charnockitic-granite, through hornblende-granite to biotite- and aplite-granites resulting from the progressive differentiation of the high T, P, H 2 O-rich Kleivan granitic melt. High initial temperature (T 900 C) and H 2 O content of the melt ( 5 wt.%), as well as the H 2 O enrichment in the successive melts during differentiation maintained a relatively low melt viscosity (η 10 5 poise) despite the drop of temperature with further cooling. Moreover heat loss through the surrounding country rock is restricted at high pressure (P 5 kbar). These special conditions promoted long lived magma convection in the chamber that facilitated the processes of melt differentiation and granite fractionation responsible for the zonation in the Kleivan granite. Trace element analysis of quartz from the Kleivan granite indicates that the compositional variation in quartz follows the magmatic zonation trend observed within this intrusion. The evolution of the concentration of specific trace elements in quartz such as Ti, Al, Ge, P and Li during differentiation of the Kleivan melts confirms that quartz records the igneous processes. The Ge/Ti ratio represents a strong index of the evolution of melt differentiation in the Kleivan granite. During the formation of the Kleivan granite, quartz roughly crystallized at 800 C to 750 C, 750 C to 700 C, 700 C to 645 C, and around 645 C in the pyroxene-, hornblende-, biotite-, and aplite-granites, respectively. Therefore, the Ge/Ti ratio may be used as a potential geothermometer, although its applicability to other granitic systems remains to be confirmed. Al-inquartz seems to be controlled by the Aluminum Saturation Index (ASI) of the melt, rather than by the temperature of the melt. Accordingly, the concentration of Al in quartz steadily increases as the melt evolves from metaluminous to peraluminous compositions. The concentration of P and Li in quartz is buffered by the presence of fractionating mineral phases that particularly incorporate these elements at the expense of the residual melt and quartz. However, Li may also have partitioned into the late aqueous fluids coexisting with the melt hence explaining the depletion of Li-in-quartz in the most evolved granitic rocks. 7
8 Publications and presentations related to the PhD project Some of the results obtained during this Phd project were presented at international conferences and published in scientific journals: Jacamon F. and Larsen R.B. (2005). Relationship Between SEM- Cathodoluminescence and Trace Element Chemistry of Quartz in Granitic Igneous Rocks of the Oslo Continental Rift. Poster, V13B American Geological Union (AGU) fall meeting. San Francisco, USA. Jacamon F., Larsen R.B., Skjerlie K.P. and Prestvik T. (2004). Trace element evolution of quartz in the charnockitic Kleivan granite: a possible tracer of petrogenetic processes in granitic rocks. The 26 th Nordic Geological Winter meeting. Uppsala, Sweden. Larsen R.B., Ihlen P.M., Jacamon F., Müller A., Sørensen B.E. (2005). Igneous refinement of quartz-raw materials. Geological Society of America Abstracts with Programs. Vol. 37, No. 7, pp Larsen R.B., Henderson I., Ihlen P.M., Jacamon F. (2004). Distribution and petrogenetic behaviour of trace elements in granitic pegmatite quartz from South Norway. Contributions to Mineralogy and Petrology. Vol 147, pp Larsen R.B., Ihlen P.M., Jacamon F. & Dundas S. (2003). Trace elements in igneous quartz: implications for granitic pegmatite genesis and high purity quartz formation. Nordic Geological Winter meeting. Oslo, Norway. Larsen R. B., Ihlen P. M., Henderson I., Jacamon F., Prestvik T. (2002). Trace element evolution of quartz during igneous differentiation of granitic melts: is it erratic or systematic? Poster. American Geological Union (AGU) fall meeting. San Francisco, USA. Larsen R.B., Henderson I., Ihlen P.M., Jacamon F., & Flem B. (2002) Application of trace elements in granitic quartz to unravel petrogenetic links in complex igneous fields. International Mineralogical Association (IMA). Edinburgh, Scotland. 8
9 Acknowledgements A number of people have supported this PhD project by contributing to my education in geology, taking part in critical discussions, in addition to other useful assistance. I am particularly grateful to my supervisor Rune Berg Larsen, associate professor at IGB, NTNU, for his advices and support during this project. I wish to thank Peter Ihlen, Iain Henderson and Rolf Lynum, researchers at NGU for their assistance during fieldwork. Professors Stephen Lippard and Allan G. Krill are acknowledged to have introduced me to the basics of structural geology. I am indebted to the laboratory staff at IGB and NGU for helping me with the preparation and analysis of my samples. I am thankful to my PhD fellows, Bjørn Eske Sørensen, Chris Magombedze, Erik Larsen, Gyanendra Lal Shrestha, Kari Moen, Krishna Kanta Panthi, Lasse Telstø and Nghia Trinh for their kindness, good company and the fruitful discussions that we had together. Thank you to my family and all my friends, for their support and understanding. I would like to thank the Nordisk Forskerutdanningsakademi network (NORFA) and all the enthusiastic geologists that I had the chance to meet during the memorable excursions in northern Norway (the Troms-Lofoten geology, 2002) and in Greenland (Petrogenesis and Crystallisation of igneous rocks, 2003). Finally, I am indebted to the Norwegian Research Council and the Department of Geology and Mineral Resources Engineering (IGB, NTNU), which funded this research project. Francois JACAMON, Trondheim, May
10
11 Relationship between SEM-CL and trace element chemistry of quartz in selected granitic igneous rocks of the Oslo continental rift Francois Jacamon Department of Geology and Mineral Ressources Engineering, Norwegian University of Science and Technology (NTNU), N-7491 Trondheim, Norway Rune Berg Larsen Department of Geology and Mineral Ressources Engineering, Norwegian University of Science and Technology (NTNU), N-7491 Trondheim, Norway Andreas Kronz EMPA laboratory. Geowissenschaftliches Zentrum der Universität Göttingen, Germany Abstract This study documents the textures and chemical evolution of different generations of quartz in granitic rocks from the Oslo continental Rift (Norway), in relation with igneous as well as subsolidus hydrothermal processes. The granites suffered pervasive deuteric alteration by hydrothermal fluids at magmatic and subsolidus conditions. Contrary to many other major minerals, primary igneous quartz is well preserved. However, SEM-CL imaging reveals several generations of secondary quartz that formed by reaction with infiltrating hydrothermal fluids. Four types of quartz may be categorised by SEM-CL luminescence and texture. Qz1: Bright primary magmatic quartz frequently showing sector zoning that reflect compositional variations in the crystallising melt. Qz2: Light grey up to hundreds µm wide diffuse alteration zones that follow grain boundaries and open cracks intersecting Qz1 grains. Qz3: Usually darker than Qz2. Qz3 is featured by irregular structures intersecting Qz1 and Qz2 suggesting a formation by dissolution/recrystallization processes involving a hydrothermal fluid. Qz4: Narrow cracks and patches of black quartz intersecting all the other types. EPMA in situ analyses of the different quartz generations confirm that the intensity of luminescence of quartz is strongly positively correlated to the Ti content of 1
12 the quartz. Al and K are versatile elements and mostly are incorporated in quartz together in the form of either feldspar micro inclusions or [AlO 4 /K + ] 0 centres defects. Ti- and Al-in-Qz1 averages 200 ppm and 80 ppm respectively in sample D470. Ti-in- Qz1 varies from 65 to 95 ppm and 50 to 80 ppm in samples E465 and E863, respectively, whereas Al contents in quartz are irregular and range between 100 ppm and values below detection limit (LOD Al, 2σ =14 ppm). In all samples, Qz2 and Qz3 are strongly depleted in Ti and Al. This drop is gradual in Qz2 and is correlated to the intensity of diffusion within quartz, whereas it is sharp at the transition between Qz1 and Qz3. K is irregular in all quartz types and samples and varies from values below the detection limit (LOD K, 2σ =8 ppm) to 120 ppm. Qz type 4 was not analyzed as the width of the structures were lower than the beam resolution. These results demonstrate that quartz alteration by percolating fluids has a purifying effect, leaching Ti and Al from Qz1, either by diffusion (Qz2) or by dissolution/recrystallization (Qz3). In all granites, quartz crystallized at P 1.5 kbar and T= C from haplogranitic melts. The discrepancy in the Ti content in magmatic quartz (Qz1) measured between sample D470 and samples E465 and E863 is essentially due to a difference in the Ti activity in the melt at the time of quartz crystallization. Cl-F rich hydrosaline fluids at magmatic conditions feature good wetting abilities and enhance SiO 2 and Ti solubility in the aqueous fluid. Such fluids present in the granitic rocks of the Oslo rift thus represent powerfull chemical agents responsible for the alteration textures observed in quartz. Keywords: Quartz, trace elements, SEM-CL textures, EPMA analysis, fluid/rock interaction, deuteric alteration, granites, Oslo continental rift. Introduction Abundant hydrothermal fluids were produced during formation and emplacement of some of the most evolved granitic rocks in the Oslo continental rift (Ihlen et al., 1982; Olsen and Griffin, 1984I, 1984II; Hansteen and Burke, 1990; Neumann et al., 1990; Trønnes and Brandon, 1992). These deuteric fluids were present in the granite forming system at magmatic and subsolidus conditions and played a major role in melt/minerals trace element partitioning during crystal growth and are responsible for the pervasive alteration observed throughout the rocks. Quartz is one of the most resistant minerals to alteration and unlike most other major minerals, is remarkably resistant to subsolidus processes. Quartz is often the only mineral that 2
13 preserves a record of the granitic igneous system prior to the hydrothermal stage and subsolidus alteration (Larsen et al., 2004). Scanning Electron Microscope Cathodoluminescence (SEM-CL) is a sensitive technique for visualizing microtextures in minerals that are invisible in conventional transmitted or polarized-light microscopy (D lemos et al., 1997; Watt et al., 1997; Müller et al. 2000, 2002, 2003; Götze et al., 2001; Landtwing and Pettke, 2005). The textures revealed by SEM-CL pictures, such as grain morphology, crystal growth zoning, alteration patterns and dissolution/recrystallization features contribute to a better understanding of petrogenetic processes. For example, magmatic quartz and several generations of alteration-related quartz can be distinguished by SEM-Cl imaging. The intensity of cathodoluminescence reflects structural and chemical variations within quartz grains, which are related to growth zoning or alteration features. A combination between SEM-CL and in situ EMPA analysis allows to quantitatively measuring the trace element chemistry of quartz in relation with SEM-CL textures. With a high spatial resolution (<10μm) making possible the analysis of fine structures, EPMA is the most reliable instrument to quantitatively measure trace element concentrations in quartz in a range of a few 10 s ppm. Ti, Al, K, Fe are the most abundant and usual trace elements measured in EMPA analysis of quartz. This study focuses on the quartz trace element chemistry (Ti, Al, K, Fe) and SEM-CL textures in an attempt to document the petrogenetic processes that monitored the formation and alteration of selected granitic plutons in the Oslo rift. The influence of T, P and melt composition upon the trace element partitioning during quartz crystal growth, and the effects of hydrothermal fluids on quartz alteration will be documented and discussed. Geological setting and samples studied Felsic plutonism related to the Oslo continental rift The selected granitic samples of this study belong to the most evolved felsic rock types generated during the period of plutonic activity associated with the formation of the Oslo rift Graben, South Norway. In the Oslo area, the main rifting and volcanic stage ( Ma) is characterized by numerous eruptions of rhomb porphyry lavas inter-layered with basalts. This period is followed by a stage of central volcano activity 3
14 and a composite intrusion stage ( Ma), during which the magmatic style changed producing more evolved magmatic products with the intrusion of composite batholiths of intermediate to granitic compositions (Neumann et al., 1992). An overview of the lithology of the Oslo rift is presented in Fig 1. In both Graben Segments (GS), intrusions of biotite granites (BG1 granites: Gaut, 1981) accompanied the larger alkaline intrusions, which represent the dominating plutonic rock-type in the rift (Larvikite, Nordmakite, Ekerite: Sundvoll et al., 1990). This bimodal plutonic activity is documented in the Vestfold Segment with the occurrence of the contemporaneous Drammen biotite granite ( Ma: Sundvoll et al., 1990) and larvikite-ekerite series of the Eikeren-Skrim area ( Ma: Sundvoll et al., 1990). In the Nordmarka/Hurdal sector of the Akershus GS, smaller bodies of BG1 granites are scattered within the wide syenitic massifs (syenite, nordmarkite, alkali granite) stretching from north of Oslo to south of the lake Mjøsa in the Hurdal area. These granites, the Holterkollen, Stor Öyungen, Hersjö granites among others, are slightly older ( 263 Ma: Rasmussen et al., 1988; Sundvoll et al., 1990) than the alkaline rocks series of the Nordmarka/Hurdal area (251±2 Ma, Rasmussen et al., 1988). The two rock groups, biotite BG1 granites and syenitic rocks, although contemporaneous and in close proximity to each other, are truly independent in terms of field relationships, chemistry and petrogenesis (Dietrich et al., 1965; Gaut, 1981; Trønnes and Brandon, 1992). Sample localities For the purpose of a comparative study, we selected granite samples from the two rock groups in the Oslo rift mentioned before. We opted for the Drammen Granite (samples D452, D461, D462, D464, D470) located SSW of Oslo in the Vestfold GS, which is the largest and most representative granite of the BG1 biotite group and the Eikeren-Skrim ekerite, situated SSW of the Drammen granite and intercalated between the latter and the Skrim larvikite massif. The rock name ekerite (samples E465, E872) was first introduced by Brøgger (1906) and refers to alkali feldspar granites. Depending on the quartz content, ekerites are derived from alkali syenite (Larvikite) or quartz alkali syenite (Normarkite). In addition to the samples of the Eikeren-Skrim ekerite, we selected one sample of each of the two main ekerites outcropping in the Nordmarka (sample E807) and Hurdal (sample E807) terrains within the dominant field of Nordmarkite on the Akershus GS. All the selected plutons and sample localities are marked on the lithological map of the Oslo rift (Fig 1). General geological and petrological information related to the granites investigated in this study are summarized in Appendix 2. 4
15 Fig 1: Lithological map of the Oslo rift with intrusions and samples localities. Modified from Sigmond et al. (1984). Letter symbols indicate the main lava areas (Sk: Skien; Ve: Vestfold; Kr: Krokskogen) and the main batholiths (La: Larvik; Skr: Skrim; Dr: Drammen; Fi: Finnemarka; No: Nordmarka; Hu: Hurdal). Methodology Whole rock chemical analysis Major and trace elements were determined by x-ray fluorescence (XRF) at the Norwegian Geological Survey (NGU) in Trondheim with a Philips PW1480 x-ray spectrometer. For major elements, fused pellets were prepared by mixing 7 parts of Litetraborate (Li 2 B 4 O 7 ) with 1 part rock powder before melting, whereas pressed rock power pellets composed of 4.5 parts rock powder added to 1 part of gluing material 5
16 were analyzed for trace elements. Certified international standards were used to establish the calibration curves. The results of analysis are summarized in Appendix 1. Major elements and trace elements compositions are expressed in wt.% (±e) and ppm (±e), respectively. The analytical error (e) equals e. K i C [%,2σ ] = 2 i, where K i is a calibration coefficient for the element i and C i is the reported concentration of element i in wt.% and ppm for major and trace elements respectively. Scanning electron microscope cathodoluminescence (SEM-CL) All quartz grains in the granite samples of this study were SEM-CL imaged using a HITACHI S-3500N scanning electron microscope at the Institute of Geology and Mineral Ressources Engineering (IGB) at the Norwegian University of Science and Technology (NTNU) in Trondheim. SEM-CL images were collected by using a Robinson CL detector producing monochromatic images (256 grey levels), slow beam scan rates of 20s per image and an image resolution of 1024X860 pixels. The electron beam voltage and current were 20 kv and 80nA, respectively. Electron microprobe analysis (EPMA) Trace element abundances of Ti, Al, K and Fe in quartz were performed with a JEOL 8900 RL electron microprobe equipped with five wavelength dispersive detectors at the Geowissenschaftliches Zentrum in Göttingen, Germany. Synthetic Al 2 O 3 (52.9 wt.% Al), orthoclase from Lucerne, Switzerland (12.2 wt.% K), synthetic TiO 2 (59.9 wt.% Ti), and hematite from Rio Marina, Elba (69.9 wt.%fe) were used as standards. A 80 na beam current, a 15μm diameter beam size and an 20 kv accelerating voltage were used. Counting times of 60s for Si, and of 300s for Ti, Al, K and Fe were set up for each background and total signal analysis. Raw analysis were converted into concentrations using the Φ-Ρ(rho)-Z matrix correction method of Armstrong (1995). Analytical errors were calculated from the counting statistics of peak and background signals, following the Gauss law of error propagation. At low element concentrations, the background forms the main part of the total signal. On the other hand, the background signal is nearly constant for a given quartz matrix hence the absolute error based on counting statistic is also constant. The precision of the analyses (at 2σ, 95% confidence level) is 14 ppm analytical error for Ti, 12 ppm for Al, 10 ppm for K, and 18 ppm for Fe. Limits of detection (LOD) are 17 ppm for Ti, 14 ppm for Al, 8 ppm for K and 18 ppm for Fe, and were calculated with a confidence level of 95% on the basis of 6
17 the Student s t-distribution from 205 background measurements. More details about calculations of detection limits from EPMA analysis are described in Müller et al. (2003). Petrography The Drammen granite The Drammen granite is not a single homogeneous pluton but a granitic batholith comprising several granite types with distinct petrographic textures. A detailed mapping and petrographic description of the different granite varieties was done by Trønnes and Brandon (1992). The most representative types are the coarse-grained granite dominating the northern part of the massif around the Drammen cauldron and sandwiched between the medium- to fine-grained two mica granite central granite and the southern most coarse-grained cumulophyric granite (See Fig 2.a in Trønnes and Brandon, 1992). Most of the granite types encountered in the Drammen batholith share diffuse contact relations varying from sharp to gradational transitions, suggesting formation of the batholith by successive magma pulses intruding incompletely solidified rocks. Biotite is the main mafic phase in the Drammen granite. Fe-Ti oxides, titanite, zircon and apatite are common accessory minerals. Chlorite (in chloritized biotite), calcite, rutile and red iron oxide (hematite) are frequent alteration products. Exotic mineralizations were also reported in the Drammen granite by Ihlen et al. (1982) and Trønnes and Brandon (1992). Perthitic alkali feldspars and quartz are the dominant minerals in the granite. Plagioclase is less common and share complex contact relations with alkali feldspar. Plagioclase grains are usually euhedral to subhedral and smaller than alkali feldspar grains. They are usually strongly altered to a mixture of sericite and red iron oxide (hematite). Plagioclase is frequently replaced and overgrown by alkali feldspar. Relicts of these plagioclase grains form the core of large alkali feldspar grains together with quartz patches that seem to have formed during the replacement reaction (Fig 2c, Fig 2d). A corona of altered red stained plagioclase occasionally surrounds alkali feldspar cores in the form of rapakivi-like textures. A thin rim of quartz separates the two feldspars (Fig 2a). This texture may result from subsolvus re-equilibration of alkali feldspar compositions at both magmatic and subsolidus conditions (Dempster et 7
18 al., 1994). Most of the perthitic alkali feldspar grains are partially albitisized (Fig 2e). albitization seems to be the result of a two-stage process. Firstly, parallel albite bands exsolved in the form of a ribbon texture and later recombined locally to form relatively fresh albite patches (patch texture) overprinting the former texture (Trønnes and Brandon, 1992; Lee et al., 1995). Quartz grains are usually subhedral to anhedral with various sizes and morphologies. Interstitial fine-grained granophyric quartz is abundant in sample D470 (Fig 2b) surrounding older quartz phenocrysts. A more detailed description of quartz textures revealed by SEM-CL pictures will be addressed in this paper. Numerous miarolitic cavities are present in sample D470, suggesting water oversaturated conditions of the granitic system. The pervasive alteration features of the granites (resorbed quartz grains, plagioclase sericitization, and alkali feldspar albitization) confirm the existence of magmatic and hydrothermal fluids during formation of the textures observed in the rocks. The ekerites All the ekerite samples of this study are chiefly composed of alkali feldspars and quartz. The Eikeren ekerite (E465, E872) is a coarse-grained miarolitic granite with equi-granular euhedral to subhedral quartz and alkali feldspar grains. One ekerite sample (E807) in the Hurdal/Nordmarka sector contains alkali feldspar phenocrysts (cm wide) embedded in a matrix of coarse-grained quartz (mm wide) and fine-grained quartz together with feldspar crystals forming intergrowth textures. The other ekerite sample (E863) of the Hurdal/Nordmarka area displays a more uneven texture of irregularly sized and shaped subhedral quartz and feldspar grains. The most common magmatic minerals in the Eikeren ekerite are acmitic pyroxene, sodic amphiboles, manganiferous ilmenite, magnetite, zircon, titanite, apatite, astrophyllite, rutile and biotite (Neumann, 1976; Neumann et al., 1990). Alkali feldspar is mesoperthitic and suffered pervasive albitization. Besides patches of clean albite replacing the interior of alkali feldspar grains, thin albite rims are commonly seen at the margin of adjacent perthitic alkali feldspar (Fig 2e), which formed by coalescing of exsolved albite from the adjoining feldspars at the grain boundary. All the samples suffered pervasive alteration. Amphibole and biotite are generally chloritisized, titanite partly broke down to calcite + rutile + quartz. Additional petrographic information about the Eikeren ekerite can be found in Neumann et al. (1990). 8
 mantle enclosing an alkali feldspar grain")
 Granophyric texture developing around the")

 and d) Replacement of Plag by Kfd.")

19 Fig 2: a) Rapakivi texture of a plagioclase (Plag) mantle enclosing an alkali feldspar grain (Kfd). b) Granophyric texture developing around the margin of a Kfd grain. Both the Kfd grain and the granophyric Kfd are extremely altered. c) and d) Replacement of Plag by Kfd. Note the patches of Qz surrounding the Plag remains in the core of the Kfd grain. e) Cluster of perthitic Kfd grains showing intense albitization with production of albite (Ab) patches at the margin between adjacent grains. 9
20 Geochemistry Whole rock compositions were measured for all the samples (Appendix 1), from which the Aluminium Saturation Index, ASI (mol) = Al 2 O 3 /(CaO+Na 2 O+K 2 O) and the peralkaline index, PI (mol) = Al 2 O 3 /(Na 2 O+K 2 O) were calculated. ASI and (PI) -1 indexes of the granites are plotted versus each other in Fig 3. The samples of Trønnes and Brandon (1992) of the Drammen granite are midly peraluminous, whereas most of the Eikeren ekerite compositions recalculated from the Neumann et al. (1990) samples plot in the peralkaline field as defined by Shand (1947). Although they plot in their respective fields as defined by Neumann et al. (1990) and Trønnes and Brandon (1992), all the granites of this study are located in the intermediate metaluminous sector (ASI 1) of the diagram and therefore represent rather primitive granites of each series. Normative compositions were calculated from major whole rock compositions. Normative Qz (SiO 2 ), Ab (NaAlSi 3 O 8 ) and Or (KAlSi 3 O 8 ) represent more than 90 wt.% of the total normative weight in all rock types. Therefore, the haplogranitic system (Qz- Ab-Or) represents an appropriate sub-system to study these granites. Projected rock compositions of the samples of this study are plotted on the Thompson and McKenzie (1967) representation of the liquidus surface in the water-saturated (a H2 O=1) haplogranitic system (H 2 O-Qz-Or-Ab) at P=1 kbar (Fig 4a). Most of the granites plot in the low thermal valley of the liquidus surface in the feldspar field, close to the quartz/feldspar cotectic curve, implying low temperature crystallization of quartz (720<T< 750 C). At P=1 kbar, ah 2 O=1, for all compositions, one feldspar (hypersolvus granite) will crystallise and develop a mesoperthitic texture (Or 40 -Or 50 ) after exsolution at sub-solvus conditions for T<660 C (Fig 4b). 10
21 Fig 3: Aluminum saturation index, ASI (mol) = Al 2 O 3 /(CaO+Na 2 O+K 2 O) versus the reciproqual peralkaline index (PI) -1 (mol) = Al 2 O 3 /(Na 2 O+K 2 O) with fields boundary from Shand (1943). The ASI-ratio is corrected for the CaO content of apatite assuming all P 2 O 5 present as apatite. The sector demarcated by the dotted line is the compositional field of the Drammen batholith from Trønnes and Brandon (1992), including all granite types in the batholith. The dashed line outline the range of compositions in the Eikeren ekerite calculated from Neumann et al. (1990) analyses. The ekerite samples of this study (squares) are slightly more alkaline than the Drammen samples (diamonds). However, they are not peralkaline according to Shand s definition but rather fall in the metaluminous field together with the Drammen samples. 11
 Isobaric projection at P=1 kbar of the liquidus surface in the system Qz-Ab-Or-H 2 O onto the Qz-Ab-Or plane.")
 and Thompson and McKenzie (1967).")
22 Fig 4: Equilibrium phase relations in the system Qz (SiO 2 )-Ab (NaAlSi 3 O 8 )-Or (KAlSi 3 O 8 )- H 2 O at P=1 kbar at water saturated conditions (ah 2 O=1). a) Isobaric projection at P=1 kbar of the liquidus surface in the system Qz-Ab-Or-H 2 O onto the Qz-Ab-Or plane. The isotherms and position of the quartz-feldspars cotectic curve are from Carmichael and MacKenzie (1963). The dotted lines join liquid compositions in equilibrium with a particular composition of alkali feldspar and are adapted from Tuttle & Bowen (1958) and Thompson and McKenzie (1967). b) Perspective representation of the system Qz-Ab-Or showing hypersolvus conditions at low pressure (P 1 kbar), ah 2 O=1. Samples of the Drammen granite are shown with purple triangles, the Ekerite samples with red triangles. 12
23 Nature of aqueous fluids present during emplacement of the granites The Drammen and ekerite granites of the Oslo rift formed at low pressures from water-oversaturated systems, in which an aqueous fluid coexists with the crystallizing melt (Olsen and Griffin, 1984a, b; Hansteen and Burke, 1990; Andersen et al., 1990). The presence of aqueous fluids in the system at different magmatic, submagmatic and hydrothermal stages is determinant for the partitioning of trace elements between the fluids, the silicate melt, and the rock forming minerals. These fluids are also responsible for the pervasive alteration observed throughout the rock at both magmatic and submagmatic conditions. Fluids present during formation of the Drammen granite The existence of miarolitic cavities in the coarse-grained cumulophyric granite (sample D470) as well as the study of fluid inclusions trapped in miarolitic quartz demonstrate that the melt was saturated with an aqueous phase at a late magmatic stage close to solidus conditions (Olsen and Griffin, 1984a). Different fluid inclusion types were distinguished from the nature of their constitutive phases by Olsen and Griffin (1984a). Type A inclusions (two-phase liquid inclusions) represent a magmatic fluid that was present early in the water-saturated system (type A,I) and evolved with further crystal fractionation of the melt until final crystallization (type A,II), whereas type B (multi-phase liquid inclusions) and C (two-phase gaseous inclusions) inclusions correspond to late subsolidus fluids. Type A inclusions are characterized by moderate to low salinities and low CO 2 contents, while Type B and C inclusions represent highly saline (hydrosaline) fluids. The magmatic aqueous fluid is featured by a gradual compositional change throughout crystallization, with salinity decreasing from eq.wt.% NaCl in the early fluid (type A,I) down to about 5 eq.wt.% NaCl in the late and post magmatic fluids (type A,II and A,III, respectively) and CO 2 contents increasing from 0-2 to 6-8 mol.% during the same system evolution (Olsen and Griffin,1984a). This type of evolution is typical of water-rich magma, from which chlorine (Cl) will strongly partition into the coexisting aqueous phase, leading to less and less chloride-rich fluids (NaCl + KCl) during further evolution and depletion of the melt (Kilinck and Burnham, 1972). The slight enrichment in CO 2 in the latest fluids is attributed to mixing of the magmatic fluid with meteoric fluids derived from the surrounding calcareous sedimentary rocks at subsolidus conditions (Olsen and Griffin, 13
24 1984a). Types B and C high salinities (55 to 85wt. % NaCl + KCl) were likely produced during boiling of the moderately saline fluids (type A) at hydrostatic conditions. Fluids present during formation of the Eikeren ekerite Numerous miarolitic cavities in the Eikeren ekerite witness the coexistence of an aqueous fluid with the silicate melt during crystallization of the rock. Hansteen and Burke (1990) studied fluid inclusions in quartz and distinguished compositionally different fluids. The composition of fluids was determined from volume estimates of daughter minerals coexisting with the fluid in the inclusions. One magmatic to submagmatic fluid found in rock forming quartz (type 1A) and miarolitic quartz (type 1A, 1B) is characterized by an extremely high salinity (55-70 eq.wt.% NaCl). This fluid also contains S ( wt.%) in sulphate minerals (KNaSO 4 ), minor amount of carbonate in calcite and unidentified Ti-Fe bearing opaque phases. All other types (1C, 2, 3, 4, V) represent submagmatic to post magmatic fluids with lower salinity and sulphate content than the magmatic fluid (type 1A, 1B). P, T conditions during quartz crystallization The Drammen granite Temperature and pressure of formation of the earliest magmatic fluid together with the host quartz were estimated by intersecting fluid inclusion isochors with the solidus and liquidus demarcating the stability domain of quartz (Type AI, Olsen and Griffin, 1984a). A revised version of Olsen and Griffin (1984a) P, T diagram is presented in Fig 5. No references about the position of the granite liquidus and solidus (see curves I and II in Fig 10, Olsen and Griffin, 1984a) are given by the authors and we propose new values for the location of the quartz liquidus and solidus determined from experimental work of similar granites. The suggested solidus corresponds to water saturated (ah 2 O=1) conditions for a minimum melt composition (Ebadi and Johannes, 1991). The quartz liquidus was constructed from three experimental points at 2 kbar, 1 kbar and 1 bar. T=720 C at P=2 kbar is from Whitney (1975) for the R1 synthetic granite at water saturation (4 wt.% H 2 O in the melt) in the Qz-Ab-Or-H 2 O haplogranitic system. T 750 C at P=1 kbar is inferred from Carmichael and McKenzie (1963) at water saturated conditions (ah 2 O=1) in the Qz-Ab-Or-H 2 O haplogranitic system for compositions equivalent to the Drammen granite, close to the quartz-alkali feldspars 14
25 cotectic in the hollow part of the thermal valley of the liquidus surface in the alkali feldspar field (Fig 4). Data at atmospheric pressure ( 1 bar) are from Tuttle and Bowen (1958). The quartz solidus and liquidus curves are not so well constrained for pressures below 1 kbar and are therefore plotted as dotted lines. The new P, T estimate, although close to Olsen and Griffin (1984a), gives slightly lower values in temperature (700 C<T<750 C) and pressure (1.3 kbar < P < 1.4 kbar) for the formation of quartz in the Drammen granite. Fig 5: Isochors for the earliest magmatic H 2 O-rich fluids from Olsen and Griffin (1984a) fluid inclusions study. The thin dashed lines are the solidus and liquidus for the granite defined by the authors. Curves 1 and 2 are the revised solidus and liquidus defined from experimental work of similar granites (solidus: after Kerrick and Jakobs, 1981; liquidus: after Whitney, 1975 and Thompson and McKenzie, 1963). Dash rectangle: P, T estimates from Olsen and Griffin (1984a). Shaded solid rectangle: new P, T estimates. (See text for explanations). 15
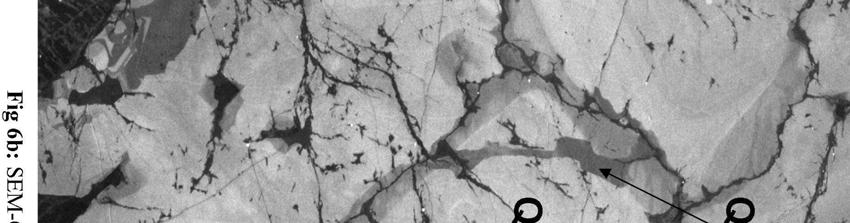
26 The ekerites No microthermometric data are available concerning the aqueous fluids present during crystallization of the ekerites. Therefore, no P and T estimates can be made by crossing fluid inclusion isochors with the stability domain of quartz, like it was done in the case of the Drammen granite by Olsen and Griffin (1984a). The complete absence of Al in octahedral position (Al VI ) in pyroxene and amphibole from ekerite samples of the Oslo rift suggests crystallization of these minerals at shallow depths (Neumann, 1976). Sodic amphiboles and pyroxenes in the most differentiated samples belong to the last minerals to form in the crystallization sequence according to petrographic textural evidences and crystallized at low temperatures below 780 C (Neumann, 1976). These temperatures around T=750 C are close from the thermal minimum in the water saturated haplogranitic system (Qz-Ab-Or-H 2 O) at P=1-2 kbar (Tuttle and Bowen, 1958; Carmichael and MacKenzie, 1963, + Fig 4) and correspond to temperatures of crystallization of alkali feldspar and quartz in this system. It is therefore likely that these rocks crystallized at pressures around 1 to 2 kbar. Moreover, all the ekerite and Drammen granite samples of this study have a similar Qz-Or-Ab normative composition and plot close to the quartz-feldspar cotectic curve of the water saturated haplogranite system at P= 1 kbar (Fig 4), suggesting that the two rock types formed at similar conditions. We can therefore assume that quartz in the ekerite of this study, like quartz in the Drammen granite samples, formed at pressure between 1 and 2 kbar and 700 C<T qz <750 C. Quartz textures and trace element chemistry Based on the SEM-CL studies, a few quartz grains were selected for their remarkable textures in order to distinguish the different quartz generations, describe their structural relationship with each other and analyze their trace element composition. Fig 6a, 6b, 6c, 6d represent SEM-CL pictures of sample D470, E465, E863 and E807, respectively, from which the following quartz generations have been identified and studied. 16


27 17


28 18


29 19


30 20
31 SEM-CL textures of different quartz generations Four quartz types can be distinguished by SEM-CL luminescence and textures. Qz1: Qz1 represents the primary magmatic quartz that first crystallized from the melt. It frequently shows growth zoning in the form of alternating brighter and darker concentric sectors reflecting compositional variations of the melt composition. During crystal growth, changes in magma composition at the origin of the luminescent contrast between adjacent zones may produce smooth rounded boundaries as the result of resorption (Fig 6d). Qz2: Qz2 develops in up to several hundred µm wide diffusive alteration zones that follow grain boundaries and open cracks intersecting Qz1 grains. Qz2 is less luminescent than Qz1 and formed by a diffusion-like process, as the intensity of the grey color is gradually tapering off away from the fluid pathways. The diffusion profile is well revealed on SEM-CL images by the gradual decrease of luminescence from core to rim of the quartz grains. Qz3: Contrary to Qz2, Qz3 is not necessarily directly associated with macroscopic fracturing features. Although it developed originally along fractures or at grain boundaries, Qz3 propagation is not controlled by a diffusion front, like in the case of Qz2. Occasionally Qz3 randomly intersects previous structures (Qz1 and Qz2) in an irregular pattern. Qz3 is easily distinguished from brighter Qz1 and Qz2 quartz by its dark grey color on SEM-CL images. In sample E863 on Fig 6c large veins of Qz3 intersect Qz1 and subsequently fractured into individual grains probably due to local deformation. The texture of these veins reveals heterogeneously distributed zones of varying luminescence, which represent irregular growth lines or sectors. This new texture overprinted the former texture of Qz1 (and occasionally Qz2, see sample E465 on Fig 6b) and indicates formation of new quartz after dissolution of primary quartz. In sample D470 (Fig 6a), the wavy outline of the zones of Qz3 with numerous curves and lobes suggest a formation by interaction with a fluid. Qz4: Qz4 comprises narrow cracks and patches of black quartz intersecting all the other quartz types. The structures are usually thin and complicated and most of them represent micro fractures and defects that were healed by crystallization of Qz4. The observation of SEM-CL pictures allow us to establish a chronological sequence of formation of the different quartz types outlined above. Qz1 represents primary magmatic quartz, whereas the other quartz types correspond to later generations 21
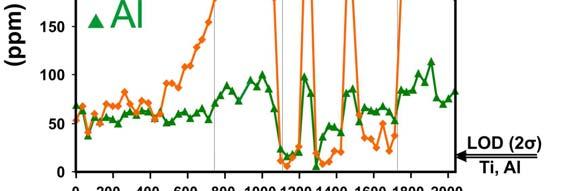
32 that formed by reaction between Qz1 and deuteric fluids (Qz2, Qz3) and/or meteoric fluids (Qz4). Qz1 is the most abundant quartz type, is intersected by all other types, and commonly features a zoning pattern characteristic of a magmatic origin. Qz4 seems to be the latest generation as it features the slimmest structures and randomly intersects all the other quartz types. The relationships between Qz2 and Qz3 are well revealed in sample D470 and E465 (Fig 6a and 6b). Although Qz3 is darker (or less luminescent) than Qz2, it does not necessary mean that it represents a later generation. Both quartz types formed in the presence of volatile fluids along grains boundaries and fractures by different processes of interaction between these fluids and the host quartz. Quartz chemistry in relation to SEM-CL textures EMPA analysis were carried out to measure the trace element composition of the different generations of quartz observed in SEM-CL imaging in order to determine if the variations in luminescence and texture of the quartz are related to changes in the chemistry. These analyses might provide useful information to comprehend the mechanisms controlling mass balance properties between quartz and the altering fluids. Among all the trace elements present as impurities in the quartz lattice, only Ti, Al, K and Fe are abundant enough to be quantitatively measured by the microprobe, having a detection limit (LOD) around 10 ppm (2σ). Trace element measurements were performed as line scans intersecting the different quartz types in order to allow a direct comparison between textural and chemical variations (Fig 7a-c). Each traverse comprises about 50 analytical points and the distribution profiles for the different elements are drawn with the corresponding line scan on a SEM-CL picture. We opted for three analytical profiles belonging to different samples, which are represented on Fig 6, and on Fig 7 together with the results of the analysis. All the Fe-in quartz analysis fall below the detection limit (LOD Fe=18 ppm, 2σ) hence are not reported here. 22


33 Fig 7a: Quartz EPMA analysis of sample D


34 Fig 7b: Quartz EPMA analysis of sample E


35 Fig 7c: Quartz EPMA analysis of sample E
36 In sample D470 of the Drammen granite, Qz2 and Qz3 are progressively replacing the primary Qz1. The analytical profile goes from rim to core, which is also the direction of fluid propagation. The scan line and all the quartz types encountered are summarized in Fig 7a. Qz1 has a constant concentration in Ti and Al averaging 200 ppm and 80 ppm respectively. Qz3 is strongly depleted in these elements, Ti in particular dropped to 25 ppm, whereas the Al concentration decreased to about 40 ppm. Moreover, we note the gradual Ti decrease in Qz2 from 200 ppm in the core at the transition between Qz2 and Qz1 to 50 ppm at the edge of the grain. Al is rather constant in Qz2 along the diffusion profile with a concentration of roughly 60 ppm. We observe a strong correlation between the intensity of luminescence and the Ti concentration in quartz, with the brightest intensities corresponding to the highest Ti concentrations. This is remarkable along the diffusion profile in Qz2, where the regular shading of the luminescence from core to rim corresponds to the steady decrease of the Ti content in quartz. K is irregular, ranges between values smaller than the detection limit (12 ppm, 2σ) and about 40 ppm and is not correlated with Al. The second sample represents a group of adjacent zoned quartz grains in sample E465, which are intersected by a network of fractures at the origin of formation of Qz2 and Qz3. The profile was sampled from core to core of adjoining quartz grains, going across successive growth sectors within Qz1, and Qz2 and Qz3 in the vicinity of the crack separating the two grains. The different growth sectors (S1, S2, S3) in Qz1, and the fracture and zones of Qz2 and Qz3 are depicted on the SEM-CL picture in Fig 7b. The Ti concentration in Qz1 varies from 65 ppm (S3) to 95 ppm (S2) in average across the different growth sectors. The Ti content drops drastically in Qz2 and ranges between 50 ppm and 20 ppm, with the lowest values for points bordering the fracture. The first analytical point on the right of the fracture seems to represent Qz3 with 45 ppm of Ti. The two next characterize Qz2 by alteration of Qz1 of S1 in grain2 (Gr2), whereas all the points directly on the left side of the fracture correspond to Qz2 of S1 in grain1 (Gr1). The development of Qz2 is more pronounced in Gr1 making a 300μm wide diffusion profile through Qz1. The evolution of the Ti concentration along this profile is small and gradual until the diffusion front, where the Ti content doubles from 50 ppm to about 100 ppm at the transition between Qz2 and Qz1. This observation is contradictory to the diffusion profiles on the right hand site of the fracture and in sample D470 (Fig 7a), where the transition between Qz1 and Qz2 is rather steady in terms of Ti content variations. Al concentration is irregular, ranges from values <14 ppm (LOD, 2σ) to 60 ppm and do not correlate with the different quartz types, although the highest 26
37 concentrations are measured in Qz1. Al contents are below the detection limit in Qz2. In the same manner, K is irregular and varies between values of <8 ppm (LOD, 2σ) to 50 ppm. A strong correlation is observed between SEM-CL luminescence and Ti concentration in quartz, but not with Al and K. There is a weak correlation (R 2 =0.65) between Al and K atomic proportions, when only values above the detection limits for both elements are considered (Fig 8a). The third sample E863 focuses on Qz1 and Qz3. A coarse grain of zoned magmatic quartz (Qz1) is intersected by veins of Qz3 expending from the grain margins towards its core. New cracks developed within the veins probably as the result of brittle deformation after Qz3 was formed. The luminescence contrast between the two types of quartz is striking and the growth zoning pattern of Qz1 is still recognizable despite Qz3 overprint. The profile successively intersects Qz1 growth sectors S1, S2, S3 and S4 to end up in Qz3 (Fig 7c). In the magmatic quartz, Ti concentrations average 50 ppm in S1 and S3, 60 ppm in S4 and 80 ppm in S2, in accordance with the luminescence pattern. The Ti content is comparatively low in Qz2 and approaches the limit of detection of 17 ppm (2σ). Similarly to sample E465 (Fig 7b), Al and K concentrations are irregular with most of the values situated below the detection limit (LOD Al=14 ppm, LOD K=8 ppm, 2σ). Two independent peaks, however, with extremely high values reaching 130 ppm for Al and 100 ppm for K, seem to represent microscopic impurities in quartz (Fig 8b). Al and K are strongly positively correlated to each other in atomic proportions (R 2 =0.97), most of the values above detection limit corresponding to the peaks mentioned before. Discussion Alkaline rich deuteric fluids coexisting with the silicate phases at magmatic and hydrothermal conditions played a major role in the formation of the Oslo rift granites. These fluids are strongly corrosive and react with the early formed minerals, including the most resistant ones such as quartz. Therefore, they are responsible for the pervasive alteration of the rock and for the formation of the different generations of quartz that are continuously replacing primary magmatic quartz. 27
38 Fig 8: Plots of K against Al contents in magmatic quartz (Qz1) in atomic proportions (ppma) in sample E465 (a) and sample E863 (b). Sequence of quartz alteration The hypothetical sequence of alteration of primary magmatic quartz (Qz1) by hydrothermal fluids has been reconstructed in Fig 9. The gradual process of corrosion and decomposition of Qz1 is divided into three stages. Stage1: The upper part of the quartz grain is in direct contact with the hydrothermal fluid and therefore more exposed to alteration than the lower part, which is protected from fluid infiltrations by the presence of adjacent mineral phases. Diffusive decomposition progresses along the crystal margins surrounded by the fluid and 28
39 dissolution/recrystallization related to Qz3 formation develop in weakness zones more vulnerable to fluid infiltrations and attacks. Stage2: Alteration and decomposition of Qz1 is progressing. Grain margins are eroded and larger zones of Qz2 and Qz3 have replaced the primary quartz. The advance of fluid diffusion related to the formation of Qz2 is regular and uniform throughout Qz1, whereas patches of Qz3 seem to develop faster and deeper inside the grain, causing grain crumbling once they connect to each other. Stage3: The quartz grain is represented at its present alteration state as observed on SEM-CL picture (Fig 6a). Most of the magmatic quartz has been replaced by Qz2, Qz3 and Qz4, which have completely transformed the original texture and morphology of the grain. Formation mechanisms of Qz2 and Qz3 In the samples of this study, Qz2 and Qz3 formation is intimately related to the presence of aqueous fluids infiltrating the primary magmatic quartz (Qz1). The particular composition of these fluids facilitates the reaction with quartz by different processes resulting in the transformation and alteration of Qz1 to produce Qz2 and Qz3 types. In most cases, SEM-CL pictures and analytical results support the formation of Qz2 by a diffusive process that gradually leaches trace elements from the quartz lattice. The fluids percolate along grain boundaries and diffuse into the grain itself. The progress of fluids into the grain may be controlled by a network of propagating micro cracks conveying the fluids inwards. The gradual fall in luminescence coincides with falling Ti contents, suggesting that the fluid reacts with quartz and leaches Ti from the quartz lattice. SEM-CL textures, as well as the sharp variations of Ti and Al contents across the contacts between Qz1 and Qz3 suggest the formation of Qz3 by precipitation of new quartz from a fluid that infiltrated Qz1. The original structure of the infiltrated quartz is destroyed and is replaced by new quartz from the fluid. Diffusion-like profiles are absent in Qz3, leaving fairly constant trace elements contents and luminescence intensities. 29
 in sample D470.")
.")


40 Fig 9: Scheme illustrating the sequence of alteration of magmatic quartz (Qz1) in sample D470. Stage 3 represents the present alteration state of the grain as observed on SEM-CL picture (Fig 6a). The abundance of fluid around the upper part of the grain resulted in a more severe alteration of this grain part in comparison with the lower part, which was protected from fluid infiltration by the presence of adjacent plagioclase grains. 30
41 Quartz porosity and permeability to brines The ability of a fluid to dissolve a mineral is partly dependent on the porosity and permeability of this mineral that again is a function of the density of structural defects. For example, substitutional impurities such as Ti 4+ or Al 3+ having relatively large ionic radii compared to Si 4+ deform the atomic framework causing distortion and weakening of the lattice structure. The higher the porosity (permeability) on a specific location, the larger the quantity of fluid in contact with quartz, the more likely is the chance of reaction and dissolution of quartz. The permeability of a mineral grain is favored by high fluid pressure gradients, quartz lattice defects and/or local deformation. Norton and Knapp (1977) defined three different contributions to the total porosity (Ф T ). Ф T = Ф F + Ф D + Ф R Ф F is the flow porosity, develops along fractures and cracks and contributes to the permeability of the medium. Ф D is the diffusion porosity and represents pore space that is not contributing to flow. Material can diffuse from the fluid in Ф D to the fluid in Ф F channels and hence contribute to the transport of chemical elements between fluid and rock. Ф R is the residual porosity and is related to isolated pores of the structure not connected with any of the other porosity types. According to this definition, Qz2 would rather form in quartz whose total porosity is mainly a diffusion porosity (Ф D ) associated to a tight network of unconnected microcracks. On the contrary, Qz3 would crystallize from fluid circulating in the larger channels and fractures that contribute to the flow porosity (Ф F ) of the quartz grain. The porosity can also be expressed by considering surface energies between the fluid and mineral grains in contact with each other (Watson and Brennan, 1987). The wetting angle or dihedral angle (Θ) is defined from the ratio of the solid-solid interfacial energy and the solid-fluid interfacial energy as the contact angle between two adjacent grains and the fluid (Fig 10). γ Θ = 2 arccos 2 s-s γ s f 31


 as defined in")
42 whereγ s-s and γ s f are the solid-solid and solid-fluid interfacial energies (per unit area), respectively. The wetting angle was constructed originally to describe the geometry of fluid filled pockets in rocks, but could as well be applied to a fluid penetrating along a crack within a quartz grain. A low Θ value signifies that the fluid has a good wetting ability and hence will wet the fractures throughout the mineral grain. Fluids in systems with low Θ are more mobile than fluids in systems characterized by a high Θ. Large surface contacts between the fluid and the quartz will favor reaction hence quartz alteration. Fig 10: Schematic illustration of a fluid pocket trapped at the intersection of three adjacent grains showing the wetting angle or dihedral angle (Θ) as defined in the contact model of Watson and Brenan (1987). The expected geometries at crystal intersections are represented for various wetting angles (Θ) between 0 and 180 C. Modified from Watson and Brennan (1987). 32
43 Besides the slight effect of temperature and the modest pressure dependence, i.e. the wetting angle increases with decreasing pressures, the wetting angle mainly depends on the fluid composition. (Lee et al., 1991; Laporte and Watson, 1991). Salting-in in H 2 O-rich H 2 O-CO 2 solutions has a profound effect on the wetting angle, which is decreasing with higher fluid salinities. For instance, Laporte and Watson (1991) concluded that at 2 kbar and 600 C, Θ changes from 40 to 33, while increasing the concentration of NaCl in the solution from 3 to 6 m (m = mol/kg solution mol/kg H 2 O). However, these results contradict Lee et al., (1991), who measured a dihedral angle of Θ 77 at 2 kbar, and 600 C for a NaCl (6.5m)-H 2 O solution,. Lee et al., (1991) explain the discrepancy between the two Θ values as the effect of differences in the scale of observation, stating that no consistent measurement could be established at the low magnification used by Laporte and Watson (1991). On their side, Laporte and Watson (1991) criticize the reliability of the work of Lee et al., (1991), claiming that textural equilibrium cannot be attained in short duration experiments. However, according to Lee et al., (1991) experimental results, the presence of salt like NaCl (but also KCl, MgCl 2, CaCl 2 ) in an aqueous fluid reduces its wetting angle (Θ) and hence enhances its wetting ability. Therefore, we may also expect the fluids present in the Drammen granite and ekerite of the Oslo rift, which are highly saline, to penetrate efficiently along grain boundaries and fractures in the rock and, in particular, to be decisive agents in the formation of the alteration textures encountered in quartz. The formation of Qz2 by fluid diffusion inside a quartz grain is not as dramatic as the processes responsible for the formation of Qz3 in terms of alteration intensity. From an energy point of view, it requires more energy to dissolve quartz, implying complete destruction of the crystalline network, than is necessary for elements to diffuse through the structure. Furthermore, it is likely that formation of Qz2 prior or contemporaneous to Qz3 enhances the formation of Qz3. Indeed, the network of micro channels monitoring the fluid diffusion inside the quartz grain increases the porosity and adds to the development of larger conveying structures along which the fluids may infiltrate the quartz. Silica solubility in brines Fluids play a major role in the mobilization of silica as well as in the diffusion and dissolution of trace elements present in quartz, leading to the purification of quartz (Larsen et al., 2004). Other than quartz porosity, parameters like temperature, pressure, 33
44 fluid salinity and ph also have a profound influence on the ability of the fluid to dissolve quartz. Rimstidt (1997) studied the effects of temperature, pressure and ph in a pure H 2 O fluid. The solubility of silica (S) generally increases with pressure and temperature in a pure H 2 O fluid. At constant temperature, the effect of pressure is maximized at high temperatures, i.e. S 0.01 m between 1 and 7 kbar at 200 C, but S increases from 0.05 m at 1 kbar to almost 0.5 m at 7 kbar at 700 C. At constant pressure around 1.5 kbar, the silica solubility roughly increases with one order of magnitude from S=0.01 m at 200 C to S=0.1 m at 700 C (Fournier and Potter, 1982). At low pressures, the addition of salt to an aqueous fluid increases the solubility of silica (Rimstidt, 1997; Fournier, 1983; Xie and Walther, 1993; Newton and Manning, 2000). The increase of the silica solubility with the salt content (salting-in) is further enhanced at high temperatures T>450 C (Rimstidt, 1997). A salting-out effect is observed for high pressures at high T, which may be explained by the tendency of salt to destabilize long polymers of silica in solution (Newton and Manning, 2000; Manning 2001). The effect of ph upon the silica solubility is strong for temperatures between 100 C and the critical temperature of H 2 O ( 374 C), S is increasing with a factor 10 from S=0.01 m at ph=8 to S=0.1 m at ph=10 (Rimstidt, 1997). The role of ph at high temperature (T>350 C) was not studied by Rimstidt (1997). Although high salinity aqueous solutions likely have a ph in that range (weakly basic solutions), a strong positive effect of ph on the silica solubility is uncertain at magmatic temperatures ( 700 C). The solubility of silica is much higher in brines than in CO 2 -H 2 O fluids, given that CO 2 is acting as a depolymerization agent (Manning 2001). The high permeability of silicate rocks for brines in combination with the high solubility of silica in these hydrosaline solutions at magmatic conditions in the upper crust (T 700 C, P 1-2 kbar) suggest that these brines, rather than CO 2 rich fluids, are responsible for the alteration of magmatic quartz (Qz1) and the subsequent production of new generation of quartz (Qz2, Qz3) in the Drammen granite and ekerites of the Oslo rift. Growth control of magmatic quartz (Qz1) Most of the primary quartz (Qz1) reveals a pronounced growth zoning pattern during SEM-CL imaging, which is characteristic of its magmatic origin. Step or compositional zoning is dominant in samples E465, E863 and E807, and is featured by concentric sectors with contrasting luminescence that witness the successive stages 34
45 during crystal growth of the quartz grain. Oscillatory zoning is rare but is observable in sample E465 in the upper left quartz grain (Fig 6b). Whereas the variation of the luminescence contrast is weak and gradual in oscillatory zoning patterns, the border between two adjacent sectors featuring compositional zoning is abrupt with a sharp luminescence contrast. These luminescence changes correspond to parallel steps in the Ti content of the quartz, as it was measured by EPMA analysis in the successive growth sectors (S1 to S4) of samples E465 and E863 (Fig 7b, 7c). Fine scale local oscillatory zoning within the different growth zones, although not visible in the analyzed portions of quartz, might be responsible for the local variations of the Ti concentration. The intimate relationship between growth zones and Ti distribution suggest that the variations of the Ti content are responsible for the CL-contrasted zoning within magmatic quartz (Qz1) and that the Ti analyzed is mainly structurally incorporated in the quartz lattice. Special growth zoning patterns also bring additional information about the conditions of crystallization of magmatic quartz. For example, in sample E863, what at first glance seems to be a single quartz grain would rather be interpreted as simultaneous growth of two individual grains impeding each other. Although one has to imagine the primary texture before alteration and formation of the veins of Qz2, the bright ring-like sector in the grains are not connected, but deformed and squeezed against each other at the grain contact (Fig 6c). This so called growth impediments texture, where zoning adjusts to the shape of the encountered obstacle, has previously been described by Lowenstern (1995) and Müller et al. (2003). Step zoning and oscillatory zoning are interpreted to form from two different processes of interaction between the growing crystal and the parental melt. Oscillatory zoning is caused by self-organised growth, whereas step zoning arises when physicochemical changes occur in the melt, such like variations in temperature, pressure or melt composition (Allègre, 1981; Shore and Fowler, 1996; Müller et al., 2003). On the contrary, oscillatory zoning does not form because of changes of external factors in the melt, but as the result of the competition between the crystal growth rate and the diffusion rate of Si and trace elements nutrients at the crystal-melt interface. Step zoning commonly results in the formation of resorption textures that appear when the melt becomes locally undersaturated in SiO 2 and starts to dissolve the newly formed rim of the growing crystal. Changes in the melt state parameters are usually accompanied by abrupt changes of the Ti content of the new crystallising layer (step zoning) that causes 35
46 a sharp luminescence contrast. Thus, resorption surfaces are usually lightning up on SEM-CL pictures and appear as rounded inner surfaces after erosion of the adjacent angular prograding layer. They may occasionally truncate pre-existing growth zones and form discordant boundaries between adjoining growth sectors (Landtwing and Pettke, 2005; Müller et al., 2003, 2005). In sample E807 (Fig 6d), the size and zoning textures of the quartz grains carry important petrological information relative to quartz crystallization in the granite. Two large quartz grains (a few mm wide) with an identical zoning pattern are surrounded by clusters of smaller quartz grains (a few 100 μm wide) with a different zoning texture. The large grains display a large dark luminescence core with a circular outline after resorption, which is overgrown by a bright new layer grading towards darker luminescence at the grain edge. On the contrary, the small quartz grains feature a bright core with the same luminescence intensity as the bright layer of the large grains also grading into darker tones at the grain margin. In all the grains, the contact bordering the two outer zones is not sharp and rounded but gradual and angular suggesting regular prograding growth. These observations suggest that a first generation of magmatic quartz crystallized forming what is now the core of the two large grains with the darkest luminescence. During further growth, thermodynamic changes occurred in the system causing partial resorption of the early formed grains. Then, a new episode of quartz growth began that produced high luminescent bright quartz. During that stage, conditions were favorable for the nucleation of a new generation of quartz forming the small crystals that grouped into clusters around the larger early grains. Following this event, all crystals continued growing while the system steadily evolved hence causing the gradation in luminescence towards darker tones in the outer part of the quartz grains. Relationship between Al- and K-in magmatic quartz A positive correlation is observed between Al and K atomic contents in Qz1 from the two ekerites samples E465 and E863 (Fig 9a and Fig 9b) that is not observed in quartz from sample D470 of the Drammen granite. This association suggests a special affinity between these two elements at the time of their introduction into the quartz structure during crystal growth. It is difficult to define the nature of the defects related to Al-K combinations on a local site, without studying the crystalline structure of quartz at a molecular scale. Alkali cations (K +, Na +, Li + ), possibly associated with adsorbed water and hydroxyl groups, are interpreted to act as charge compensators in 36
47 Al-bearing related defects in quartz (Watt et al., 1997; Larsen et al., 1998, 2000; Müller et al., 2002, and references therein). Therefore, Al is considered as a structural impurity associated to diamagnetic [AlO 4 /M + ] 0 centers, for which M + ( K +, Na +, Li +, H + ) is the charge compensating cation. However, some of the bulk Al measured in quartz must be contained in interstitial positions such as micro inclusions or non-paramagnetic Al centres (Götze et al., 2001, and references therein). The slopes of the linear regression lines for Al and K in atomic proportions are 0.41 (R 2 =0.65) and 0.89 (R 2 =0.97) for sample E465 and E863 respectively. Na, which was not measured in this study, can also replace K in association with Al defects. At least in sample E863, not accounting for Na, the slope value is close to 1, which is the ratio expected for all defects types for the ideal charge balance of Al 3+ by M +. However, we expect a low number of [AlO 4 /M + ] 0 centres to form within quartz, far below some of the concentrations recorded in this study (up to 100 ppm of Al and 130 ppm of K for the peaks measured in sample E863). Therefore, we may assume that the high values of Al and K recorded in the analysis of quartz in the ekerites most likeky correspond to micro inclusions and/or nano clusters of alkalies adsorbed on certain grain faces of quartz. The occurrence of such inclusions would not be surprising, given that quartz and alkali feldspar usually represent cotectic phases during crystallization of granites. Ti solubility in high salinity, Cl-F rich fluids In all three granites of this study a drastic decrease of the Ti content in Qz2 and Qz3 in comparison to the Ti levels measured in the primary magmatic quartz (Qz1) was observed (Fig 7a, 7b, 7c). Petrographic evidences (miarolitic cavities, fluid inclusions and mineral textures), as well as SEM-Cl pictures of quartz, demonstrate the existence of magmatic hydrosaline deuteric fluids that exsolved from the melt at the time of quartz crystallization. These fluids are responsible for the alteration textures observed in quartz and appear to have a special ability to leach Ti. Specific compositional factors have to favor the solubility of Ti in these fluids. Factors increasing Ti solubility in aqueous solutions Like the other High Field Strength Elements (HFSE), Ti hydrolyses easily and forms non soluble hydroxides and oxides in aqueous solutions (Goldschmidt, 1954). Therefore, the mobility of Ti in aqueous fluids, which is a function of its solubility in 37
48 these fluids, is limited. The Ti solubility in supercritical fluids is essentially temperature dependent and log [Ti] (mol/kg H 2 O) increases from -5.5 at T= 18 C to -0.6 at T= 1100 C (ref in Van Baalen, 1993). The effect of pressure is unknown except for high pressures, where an inverse relationship between Ti solubility and pressure is reported in the kbar range at T = C, log [Ti] varying from -0.6 at 10 kbar to at 29.3 kbar (Ayers and Watson, 1993). Ti solubility in aqueous solutions is ph dependent and is at the lowest in neutral solutions at ph=4-8 with log [Ti] -7.5 (Knauss et al, 2001). At low ph (<2.5) and ambient conditions (P=1 bar, T=25 C), there is a steep inverse relationship between ph and the TiO 2 solubility (Babko et al., 1962; Liberti et al., 1963). Knauss et al. (2001) observed the same trend at ph<3-4, P=200 bar over a temperature range of 100 to 300 C, with a maximal value of log [Ti] -6 at ph=1, T=300 C. Ti dissolves in these acidic fluids in the form of TiO or Ti (OH ) 2 hydroxyl 0 0 complexes, whereasti (OH ) 4, TiO (OH ) 2 and HTiO 3 are the most likely complexes present in aqueous solutions at more neutral conditions at ph=3-7 (Baes and Mesmer, 1986; Schmets et al., 1966). In alkaline solution at ph>7-10, the TiO 2 solubility also increases with ph up to log [Ti]=-4.0 at ph 10 and T=300 C (Knauss et al, 2001). The solubility of Ti is also enhanced in fluorine rich fluids, in which they form hydroxyfluoride complexes[ Ti 4 ( ) ( OH m+ n ) ], with the number of hydroxyl groups m F n (moh - ) decreasing and the number of fluorine ligands (nf - ) increasing at higher concentrations of HF (Barsukova et al., 1980; Purtov and Kotel nikova, 1993). For similar fluorine concentrations, the solubility of Ti in acid solutions (HF) is 0.5 log units higher than what is measured in alkaline solutions (NH 4 F). Ti-hydroxychloride complexes [ Ti 4 ( ) ( OH m+ n ) ] m Cl n, as well as other chloride complexes are only stable in acid solutions and the solubility of Ti in solutions of KCl is much lower than in solutions of HCl (Purtov and Kotel nikova, 1993). The Ti content in aqueous solutions increases with increasing concentration of fluorine and chlorine, but for equal concentrations the solubility of Ti is higher in fluoride than chloride solutions and in acid than neutral to alkaline solutions. At T=500 C, P=1 kbar, log[ti] varies from -5.4 to -3.8 with increasing log [HF] from -3.4 (5 ppm) to -0.5 (0.5 wt.%), whereas log [Ti] ranges between -5.6 and -3.7 with increasing log [HCl] from -4 (4ppm) to 0 (3.5wt.%) (Purtov and Kotel nikova, 1993). 2 2 Sulphate ( SO ) and carbonate ligands ( CO ) appear to be of minor importance in the 4 formation of Ti complexes (Agapova et al., 1989). The possibility of enhancement of Ti 3 38
49 solubility by complexation with SO, Kotel nikova (1993), although not proven , CO3 HS ions is suggested by Purtov and Solubility of fluorine in aqueous fluids Strübel (1965) and Richardson (1977) measured the effects of temperature, pressure and salinity upon the solubility of fluorine in aqueous solutions by studying the solubility of fluorite controlled by the precipitation of F - ions with Ca 2+ ions to form fluorite (CaF 2 ). The solubility of fluorite increases with temperature and pressure of about one log unit from log [CaF 2 ] -3.8 at T=200 C and P=0.5 kbar to log [CaF 2 ] -3.1 at T=600 C and P=2 kbar (Strübel, 1965). This increase of solubility is most remarkable at high temperatures (T>400 C). A similar increase of fluorite solubility of one log unit is measured at T=350 C by addition of NaCl to the solution, log [CaF 2 ] varying from to -2.9 while [NaCl] increases from 0 to 2 moles (11.6 wt.% NaCl) (Strübel, 1965; Richardson, 1977). The solubility of fluorine should also increase in acid fluids, which stabilize HF in low ph solutions. Ti solubility in magmatic F-Cl rich fluids of the Oslo rift In both the Drammen granite and the ekerites of the Oslo rift, F-rich systems are implied from the presence of F-rich phases and accessory fluorite. In the Drammen granite, biotite contain about 3.5 wt.% F (Trønnes and Brandon, 1992). In the Eikeren ekerite, apatite ( wt.% F), sodic amphibole ( wt.% F) and biotite (2.6 wt.% F) confirm that the melt was relatively F-rich (Neumann,1976; Neumann et al.,1990). Inversely, the Cl content in apatite, amphibole and biotite of the Eikeren ekerite is below or close to the detection limit (200 ppm). Candela (1986) demonstrated that when f / m a fluid exsolves, Cl strongly partition into the fluid ( D = 40 ± 10), whereas F tends to f / m remain in the silicate melt ( D F = ), leading to high F/Cl ratio in the subsequent mineral phases crystallising from the silicate melt. Webster (1990) showed the positive effect of temperature, X H2 O of the aqueous fluid, and wt.% F in the melt upon f m D / F between an aqueous fluid in equilibrium with a peraluminous topaz- f / m rhyolite melt ( D = at T=800 C, X H2 O=1, 1 wt.% F, P=2 kbar). F Cl These results confirm the early coexistence of an aqueous phase with the melt, into which Cl strongly partitioned. In the Drammen granite, no Cl was detected in the F- 39
50 rich biotite (Trønnes and Brandon, 1992) suggesting that a fluid phase coexisted with the melt at the time of biotite crystallization. Although F is mostly retained in the melt during exsolution of an aqueous fluid, we can expect for the particular conditions of formation of the Oslo rift granites described before, that a reasonable amount of F will partition into the fluid, considering the presumably high total F content of the system, the high temperature and high salinity of the fluid. All these features enhance the solubility of F in aqueous solutions and consequently, the solubility of Ti in Cl-rich F fluids. Furthermore, one or two unidentified opaque daughter minerals present in all type 1 fluid inclusions (magmatic fluid) in the Eikeren ekerite show a Ti and Fe peak by EDS and may be ilmenite and/or magnetite (Hansteen and Burke, 1990). Fluorite is also identified in a few of these inclusions. All these phases represent true daughter minerals that formed from the fluid. A small opaque phase with a square or rectangular outline, presumably a Fe-Ti bearing phase, is commonly encountered in the type A fluid inclusions representing the magmatic fluid in the Drammen granite (Olsen and Griffin, 1984a). Hence, the existence of Ti bearing phases as daughter minerals in fluid inclusions in both granite types confirm the presence of substantial amounts of Ti dissolved in the fluid phases. Factors influencing the Ti concentration in magmatic quartz (Qz1) During crystallization of a silica rich melt, Ti is a compatible element that will partition in favor of the high temperature phases forming early in the crystallization sequence. The main mineral phases containing Ti as a major element are rutile (TiO 2 ), ilmenite (FeTiO 3 ), titanite (CaTiSiO 5 ) and Ti-magnetite (Fe 2+ [Fe 3+,Ti] 2 O 4 ), whose stability depends on the oxygen fugacity of the system. If the water activity in the melt is high enough, amphibole and biotite may form and contain up to 10 wt. % TiO 2. The solubility of Ti in a silicate melt is strongly dependent on temperature and most of the initial Ti content of the system will fractionate at the beginning of crystallization in favor of the early mafic phases mentioned before. The most important criteria that may explain the difference in the Ti concentrations in primary magmatic quartz observed between the Drammen granite (Ti, Qz1 =200 ppm) and the ekerites of the Oslo rift (Ti, Qz1 =100 ppm) is the activity of Ti in the melt at the stage of quartz crystallization. Neumann (1976) measured very low 40
51 TiO 2 content in sodic amphibole in the ekerites. Some amphibole grains coexist with pure aegirine, forming an assemblage stable over a limited range of T-fO 2 conditions, T varying between 700 and 780 C and fo 2 controlled by the Quartz-Fayalite-Magnetite (QFM) and the Wüstite-Magnetite (WM) oxygen buffers (Bailey, 1969). Therefore, amphibole crystallized close to solidus conditions (Ts 700 C, P=1 kbar, ah 2 O=1) and likely formed slightly before or together with quartz from the ekerite melt. Accordingly, the Ti depleted melt at the stage of quartz crystallization may explain the low Ti content of quartz measured in these rocks. On the contrary, sample D470 of the Drammen granite represents a granite type within the batholith that has the highest content of accessory titanite, zircon and Fe-Ti oxides (Trønnes and Brandon, 1992). The high TiO 2 and Fe 2 O 3 content of sample D470 measured in whole rock analysis (Appendix 1) supports this observation. Indeed, except for sample E872, whose quartz chemistry was not measured in this study, sample D470 has the richest TiO 2 (0.35wt.%) and Fe 2 O 3t (1.74wt.%) contents among all samples. Accordingly, the existence of a Ti-rich parental melt may explain the remarkably high Ti contents ( 200 ppm) measured in the magmatic quartz from sample D470 of the Drammen granite. Otherwise, the magmatic aqueous fluids that exsolved and coexisted with the melt during quartz crystallization may partially be responsible for the difference of Ti-in quartz content observed between the two granite types. The ability of high temperature hydrosaline Cl-F rich fluids to dissolve Ti might have played a decisive role for the partitioning of Ti in the fluid/melt/quartz system during crystal growth. The main difference between the fluids present during formation of the Drammen granite and the ekerites is compositional, as we presume that the temperature (T= C) and pressure (P=1-1.5 kbar) were similar in the two magmatic systems at the time of quartz crystallization. Considering the earliest magmatic aqueous fluid exsolved during formation of the granites, the ekerite fluid is more saline than the fluid present during the Drammen granite formation, with eq.wt.% NaCl and eq.wt.% NaCl respectively. Although the two magmatic systems contained substantial amount of F, the F content in the respective aqueous fluids present during quartz crystallization has not been determined from mineral and/or fluid inclusions compositions. Therefore, it remains uncertain exactly how much Ti the aqueous fluid could dissolve. 41
52 Conclusions -Variations of SEM-CL luminescence in quartz are predominantly caused by variations of the Ti concentration. The more Ti in the quartz, the brighter is the luminescence on SEM-CL images. Al is generally less abundant than Ti in all quartz types and a there is no direct link between Al content and SEM-CL intensity. - Al is a versatile element. In the Drammen granite (D470), the Al content is positively correlated with the Ti content in quartz, whereas Al is closely associated with K in the ekerites (E465, E863). The abundance of alkali elements in ekerites forming melts may explain the occurrence of Al-K defects such as the [AlO 4 /M + ] 0 centres, where Al substituted for Si in the SiO 4 tetrahedra of the quartz lattice and M is a monovalent charge compensator cation (K, Na, Li). -Ti-related defects, and to a lesser extent Al-related defects, in quartz are strongly sensitive to fluid-related interaction processes affecting primary magmatic quartz (Qz1). Ti and Al become unstable in the presence of deuteric aqueous fluids and are removed from the host quartz. - Two distinct processes may be distinguished in relation to quartz alteration by deuteric fluids: a diffusion-like process occurring along grain margins caused by fluids propagating inside Qz1 grains that react with Qz1 to produce Qz2; a dissolution/recrystallization process involving replacement of Qz1 by Qz3 after reaction with the percolating fluid. Both processes have a purifying effect, leaching Ti and Al out of the quartz lattice. The type of alteration process involved depends on specific parameters of the infiltrating fluid. High T and salinities enhance SiO 2 solubility in aqueous fluids and thus formation of Qz3. - High T and high F-Cl contents increase Ti solubility in aqueous fluids by favoring the formation of soluble Ti hydroxy-fluoride and -chloride complexes. In the selected Oslo rift granites of this study, high salinity Cl-F rich hydrothermal fluids existed during and after quartz crystallization and might have contributed to the severe Ti depletion observed in Qz2 and Qz3 after reaction with Qz1. -The fluids that infiltrated the grains were highly corrosive and completely obliterated most of the igneous mineral assemblage. Quartz is the only mineral that partially 42
53 survived fluid infiltration and actually, in places, preserved the original magmatic trace elements signature. Acknowledgements The authors are indebted to the Norwegian Research Council for funding of this study (Project: The value chain from mineral deposit to beneficiated product with emphasis on quartz ). We would like to thank the people from the Norwegian Geological Survey (NGU) in charge of the LITO project, Jan Cramer in particular, who kindly supplied the samples for this study. We are grateful to Axel Müller (NGU) for the arrangement of the EPMA analysis in Göttingen, Germany. References Agapova G.F., Modnikov I.S., Shmariovich Ye.M. (1989). Experimental study of the behaviour of titanium in hot sulphide-carbonate solutions. International Geology Review. Vol 31(4), pp Armstrong J.T. (1995). CITZAF: A package of correction programs for the quantitative electron microbeam x-ray analysis of thick polished materials, thin films, and particules. Microbeam Analysis. Vol 4, pp Andersen T., Rankin A.H., Hansteen T.H. (1990). Melt-mineral-fluid interaction in peralkaline silicic intrusions in the Oslo Rift, Southeast Norway. III) Alkali geothermometry based on bulk fluid inclusions content. Norsk Geol. Under. Bull. Vol 417, pp Ayers J.C. and Watson E.B. (1993). Rutile solubility and mobility in supercritical aqueous fluids. Contrib. Mineral. Petrol. Vol 114, pp Babko A.K., Gridchina G.I., Nabivanets B.I. (1962). Study of titanium (IV) in hydrochloric acid by dialysis and exchange-ion chromatography. Russ. J. Inorg. Chem. Vol 7, pp Baes C.F. and Mesmer R.E. (1986). The Hydrolysis of Cations. R.E. Krieger, Malabar, Fla., 489 pp. 43
54 Bailey D.K. (1969). The stability of acmite in the presence of H 2 O. Am. J. Sci. Schairer. Vol 267A, pp Barsukova M.L., Kuznetsov V.A., Dorofeyeva V.A., Khodakovskiy L.I. (1980). Measurement of the solubility of rutile TiO 2 in fluoride solutions at elevated temperatures. Geochemistry international. Vol 7, pp Brøgger W.C. (1906). Eine Sammlung der wichtigsten Typen der Eruptivgesteine des Kristianiagebietes: Nyt Magazin f. Naturvidenskaberne, Vol 44, pp Candela P.A. (1986). Toward a thermodynamic model for the halogens in magmatic systems: An application to melt-vapor-apatite equilibria. Chemical Geology. Vol 57, pp Carmichael I. S. E. and MacKenzie W.S. (1963). Feldspar-liquid equilibria in pantellerites: an experimental study. Am. J. Sci. Vol 2261, pp Dempster T.J., Jenkin G.R.T., Rogers G. (1994). The Origin of Rapakivi Texture. Journal of Petrology. Vol 35 (4), pp Dietrich R.V., Heier K.S., Taylor S.R. (1965). Studies on the igneous rock complex of the Oslo Region. XX. Petrology and geochemistry of ekerite. Skr. Norske Vidensk.- Akad. Oslo. I. Mat.-Naturv. Kl. Ny ser. Vol 19, 31 pp. D lemos R.S., Kearsley A.T., Pembroke J.W., Watt G.R., Wright P. (1997). Complex quartz growth histories in granite revealed by scanning cathodoluminescence techniques. Geol. Mag. Vol 134, pp Ebadi A. and Johannes W. (1991). Experimental investigation of composition and beginning of melting in the system NaAlSi 3 O 8 - KAlSi 3 O 8 -SiO 2 -H 2 O-CO 2. Contrib. Mineral. Petrol. Vol 106, pp Fournier R.O. (1983). A method of calculating quartz solubilities in aqueous sodium chloride solutions. Geochimica et Cosmochimica Acta. Vol 47, pp
55 Fournier R.O. and Potter R.W. III (1982). An equation correlating the solubility of quartz in water from 25 C to 900 C at pressures up to bars. Geochimica et Cosmochimica Acta. Vol 46, pp Gaut A. (1981). Field relations and Petrography of the Biotite Granites of the Oslo Region. Norsk Geol. Under. Bull. Vol 367, pp Goldschmidt V.M. (1954). Ionic potential and its implications. Geochemistry: Oxford, Clarendon Press. 730 pp. Götze J., Plötze M., Habermann D. (2001). Origin, spectral characteristics and practical applications of the catodoluminescence (CL) of quartz- a review. Mineralogy and Petrology. Vol. 71, pp Hansteen T.H. and Burke E.A.J. (1990). Melt-mineral-fluid interaction in peralkaline silicic intrusions in the Oslo Rift, Southeast Norway. II) High temperature fluid inclusions in the Eikeren Skrim complex. Norsk Geol. Under. Bull. Vol 417, pp Ihlen P.M., Trønnes R. and Vokes F.M. (1982). Mineralization, Wall Rock Alteration and Zonation of Ore Deposits Associated with the Drammen Granite in the Oslo Region, Norway. Metallization Associated with Acid Magmatism. Vol 6, pp Kilinck I.A. and Burnham C.W. (1972). Partitioning of chloride between a silicate melt and coexisting aqueous phase from 2 to 8 kilobars. Economic Geology. Vol 67, pp Knauss K.G., Dibley M. J., Bourcier W.L., Shaw H. F. (2001). Ti(IV) hydrolysis constants derived from rutile solubility measurements made from 100 to 300 C. Applied Geochemistry. Vol 16, pp Landtwing M. and Pettke T. (2005). Relationships between SEMcathodoluminescence response and trace-element composition of hydrothermal vein quartz. American Mineralogist, Vol 90, pp
56 Laporte D. and Watson E.B. (1991). Direct observation of near-equilibrium pore geometry in synthetic quartzites at 600 C and 800 C and kbar. Journal of Geology. Vol 99, pp Larsen R.B., Polvé M., Juve G., Poitrasson F. (1998). Composition of volatiles and structural admixtures in quartz in granitic pegmatites, Evje-Iveland, South Norway (ext. absta.). Bull. Geological Survey Norway. Vol 433, pp Larsen R.B., Polvé M., Juve G. (2000). Granitic pegmatite quartz from Evje-Iveland: trace element chemistry and implications for high purity quartz formation. Bull. Geological Survey Norway. Vol 436, pp Larsen R.B., Henderson H., Ihlen P.M., Jacamon F. (2004). Distribution and petrogenetic behaviour of trace elements in granitic pegmatite quartz from granite from South Norway. Contrib. Mineral. Petrol. Vol 147, pp Lee V.W., Mackwell S.J., Brantley S.L. (1991). The effect of fluid chemistry on wetting textures in novaculite. Journal of Geophysical Research. Vol 96, pp Lee M.R., Waldron K.A., Parson I. (1995). Exsolution and alteration microtextures in alkali feldspar phenocrysts from the Shap granite. Mineralogical Magazine. Vol 59, pp Liberti A., Chiantella V., Corigliano F. (1963). Monocluear Hydrolysis of titanium (IV) from partition equilibria. J. Inorg. Nucl. Chem. Vol 25, pp Lowenstern J.B. (1995). Applications of silicate-melt inclusions to the study of magmatic volatiles. In: Thompson JFH (ed) Magmas, fluids and ore deposits. Mineral Assoc Canada Short Course. Vol 23, pp Manning C.E. (2001). Experimental studies of fluid-rock interaction at high pressure: the role of polymerization and depolymerization of solutes. Eleventh annual V.M. Goldschmidt Conference. 46
57 Müller A., Seltmann R., Behr H. J. (2000). Application of cathodoluminescence to magmatic quartz in a tin granite case study from the Schellerhau Granite Complex, Eastern Erzgebirge, Germany. Mineralium Deposita. Vol 35, pp Müller A., Kronz A., Breiter K. (2002). Trace elements and growth patterns in quartz: a fingerprint of the evolution of the subvolcanic Podlesí Granite System (Krušné hory Mts., Czech Republic). Bull. Czech Geol. Survey. Vol 77, No 2, pp Müller A., René M., Behr H. J., Kronz A. (2003). Trace elements and cathodoluminescence of igneous quartz in topaz granites from the Hub Stock (Slavkovskỷ Les Mts., Czech Republic). Mineralogy and Petrology. Vol 79, pp Müller A., Breiter K., Seltmann R., Pécskay Z. (2005). Quartz and feldspar zoning in the eastern Erzgebirge volcano-plutonic complex (Germany, Czech Republic): evidence of multiple magma mixing. Lithos. Vol 80, pp Neumann E-R. (1976). Compositional relations among pyroxenes, amphiboles and other mafic phases in the Oslo region plutonic rocks. Lithos. Vol 9, pp Neumann E-R., Olsen K.H., Baldridge W.S., Sundvoll B. (1992). The Oslo Rift: A review. Tectonophysics. Vol 208, pp Neumann E-R., Andersen T., Hansteen T.H. (1990). Melt-mineral-fluid interaction in peralkaline silicic intrusions in the Oslo Rift, Southeast Norway. I) Distribution of elements in the Eikeren ekerite. Norsk Geol. Under. Bull. Vol 417, pp Newton R.C. and Manning C. E. (2000). Quartz solubility in H 2 O-NaCl and H 2 O-CO 2 solutions at deep crust-upper mantle pressures and temperatures: 2-15 kbar and C. Geochimica et Cosmochimica Acta. Vol 64 (17), pp Norton D., Knapp R. (1977). Transport phenomena in hydrothermal systems: the nature of porosity. American Journal of Science. Vol 277, pp
58 Olsen K.I. and Griffin W.L. (1984a). Fluid inclusions studies of the Drammen granite, Oslo Paleorift, Norway. I) Microthermometry. Contrib. Mineral. Petrol. Vol 87, pp Olsen K.I. and Griffin W.L. (1984b). Fluid inclusions studies of the Drammen granite, Oslo Paleorift, Norway. II) Gas- and leachate analyses of miarolytic quartz. Contrib. Mineral. Petrol. Vol 87, pp Pedersen L.E., Heaman L.M., Holm P.M. (1995). Further constraints on the temporal evolution of the Oslo Rift from precise U-Pb zircon dating in the Siljan-Skrim area. Lithos. Vol 34, pp Purtov V.K. and Kotel nikova A.L. (1993). Solubility of titanium in chloride and fluoride hydrothermal solutions. International Geology Review. Vol 3, pp Rasmussen E., Neumann E.R., Andersen T., Sundvoll B., Fjerdingstad V. and Stabel A. (1988). Petrogenetic processes associated with intermediate and silicic magmatism in the Oslo rift, south-east Norway. Mineralogical Magazine. Vol 52, pp Richardson C.K. (1977). The solubility of fluorite in hydrothermal solutions: Ph.D. Thesis, Harvard University. Rimstidt J.D. (1997). Gangue mineral transport and deposition. In: Barnes, H.L. (ed) Geochemistry of Hydrothermal Ore Deposits 3 rd edition. New York, NY: John Wiley, pp Schmets J., Van Muylder J., Pourbaix M. (1966). Titanium. In: M Pourbaix (Editor), Atlas of Electrochemical Equilibria in Aqueous Solutions. Pergamon, New York, N.Y. pp Shand (1947). Eruptive rocks, their genesis, composition, classification, and their relation to ore deposit, with a chapter on meteorites. 3 rd ed. London: Thomas Murby. 488 p. 48
59 Shore M., Fowler A.D. (1996). Oscillatory zoning in minerals: a common phenomenon. Canadian Mineralogist. Vol 34, pp Sigmond E.M.O., Gustavsen M., Roberts D. (1984). Bedrock map of Norway, 1:1 million. Geol. Surv. Norway. Strübel G. (1965). Quantitative Untersuchungen über die hydrothermale Löslichkeit von Flußpat. (Quantitative analysis of the hydrothermal solubility of fluorite). Neues Jahrb. Mineral. Monatsh. Vol 3, pp Sundvoll B. and Larsen B.T. (1990). Rb-Sr isotope systematics in the magmatic rocks of the Oslo Rift. Norsk Geol. Under. Bull. Vol 418, pp Thompson R.N. and Mackenzie W.S. (1967). Feldspar-liquid equilibria in peralkaline acid liquids: an experimental study. American Journal of Science. Vol 265, pp Trønnes R.G. and Brandon A.D. (1992). Midly peraluminous high-silica granites in a continental rift: the Drammen and Finnemarka batholiths, Oslo Rift, Norway. Contrib. Mineral. Petrol. Vol 109, pp Tuttle O. F. and Bowen N. L. (1958). Origin of granite in the light of experimental studies in the system NaAlSi 3 O 8 - KAlSi 3 O 8 -SiO 2 -H 2 O. Geol. Soc. America Mem. Vol 74, 153 pp. Van Baalen M.R. (1993). Titanium mobility in metamorphic systems: a review. Chemical Geology. Vol 110, pp Watson E.B, Brennan J.M. (1987). Fluids in the Lithosphere. Experimentally determined wetting characteristics of CO 2 -H 2 O fluids and their implications for fluid transport, host-rock physical properties, and fluid inclusion formation. Earth Planetary Scientific Letters. Vol 85, pp Watt G.R., Wright P., Galloway S., Mclean C. (1997). Cathodoluminescence and trace element zoning in quartz phenocrysts and xenocrysts. Geochimica et Cosmochimica Acta. Vol 61 (20), pp
60 Webster J. D. (1990). Partitioning of F between H 2 O and CO 2 fluids and topaz rhyolite melt. Contrib. Mineral. Petrol. Vol 104, pp Whitney J. A. (1975). The effects of pressure, temperature and X H2O on phase assemblage in four synthetic rock compositions. Journal of Geology. Vol 83, pp Xie Z., Walther J.V. (1993). Quartz solubilities in NaCl solutions with and without wollastonite at elevated temperatures and pressures. Geochimica et Cosmochimica Acta. Vol 57, pp
61 Appendix 1: Whole rock XRF analysis D452 D461 D462 D464 D470 E465 E872 E807 E863 wt.% ±e wt.% ±e wt.% ±e wt.% ±e wt.% ±e wt.% ±e wt.% ±e wt.% ±e wt.% ±e SiO TiO Al 2 O Fe 2 O 3 t MnO MgO CaO Na 2 O K 2 O P 2 O LOI TOTAL ASI (mol) (PI) -1 (mol) XFe (wt.) Trace Elements ppm ±e ppm ±e ppm ±e ppm ±e ppm ±e ppm ±e ppm ±e ppm ±e ppm ±e Ba Rb Sr Zr Nb Y La Ce Nd Cr Zn Ga W Pb Th U (-) falling below the limit of detection. (±e) analytical error. ASI: Aluminium Saturation Index. PI: Peralkaline Index. XFe: (FeOt/FeOt+MgO),wt. See text for details.

62 Appendix 2: General geological and petrological information
63
64 Trace element evolution in quartz during fractional crystallisation of the high T and P charnockitic Kleivan granite, south-western Norway Francois Jacamon Department of Geology and Mineral Ressources Engineering, Norwegian University of Science and Technology (NTNU), N-7491 Trondheim, Norway (francois.jacamon@geo.ntnu.no) Rune Berg Larsen Department of Geology and Mineral Ressources Engineering, Norwegian University of Science and Technology (NTNU), N-7491 Trondheim, Norway (rune.larsen@geo.ntnu.no) Abstract Trace elements analyses of quartz from the layered charnockitic Kleivan granite in the Rogaland Igneous Province indicate that the compositional variation of quartz follows the igneous evolution of the intrusion. Combined SEM-CL imaging and LA- ICP-MS analyses allow us to quantify the trace element content of quartz and to distinguish primary igneous quartz from secondary quartz. Al, Ti, Li, P and Ge are the most abundant trace elements in the Kleivan quartz. Each element displays a characteristic behaviour during the differentiation of the Kleivan granite. This study confirms that the Ge/Ti ratio of quartz is a strong index of the magmatic evolution of silica saturated melts. Ti and Ge show a pronounced compatible and incompatible character, respectively. The temperature of the quartz crystallisation depends on the H 2 O content of the differentiating melt and varies between 800 C in the primitive charnockitic granite and 645 C in the most evolved aplite-granite. Therefore, the regular evolution of Ti- and Ge-in quartz during cooling of the melt may be developed as an igneous geothermometer. P and Li evolution patterns in quartz are buffered by the occurrence of P- and Li-bearing phases coexisting with quartz, whereas Al-in-quartz seems to be controlled by the aluminium saturation index (ASI) of the melt. 1
65 Accordingly, Al-in-quartz is rising in the Kleivan granite as it develops towards peraluminous compositions. A few important trace elements such as Fe, K, and Na could not be thoroughly investigated because they are easily remobilised during subsolidus hydrothermal processes. Introduction The study of rock mineralogy and bulk chemistry is not the only method allowing the reconstruction of the petrogenesis of silica oversaturated rocks. The purpose of this paper is to demonstrate that the trace element chemistry of quartz can also be used as a petrogenetic tool to characterise an igneous evolving system and, in certain cases, provides information that otherwise may be difficult to obtain. Quartz is superior in recording and sustaining the differentiation processes in granitic systems, compared to other minerals that are usually altered beyond recognition during hydrothermal processes (like feldspars, Larsen et al., 2004). Quartz may incorporate trace amounts of foreign elements into the atomic lattice during crystallisation. The concentration of these impurities is controlled by their abundance in the melt, the partitioning between different phases, the thermodynamic conditions prevailing in the system and the structural order of the quartz lattice. Trace elements in quartz are highly sensitive to petrogenetic processes and therefore, potential tracers of both the origin and the evolution of granitic rocks (e.g., Larsen, 2004). The combination of Cathodoluminescence Scanning Electron Microscopy Imaging (SEM-CL) and Laser Ablation Inductively Coupled Plasma Mass Spectrometry (LA-ICP-MS) analyses were used to select and determine the trace element chemistry of primary igneous quartz. SEM-CL images distinguish different quartz generations within a single grain. The LA-ICP-MS method is an excellent approach to estimate the trace element composition of quartz, due to the low detection limit of the instrument and the ability to run in situ analysis. Only a few studies are conducted on igneous quartz and in particular in granitic pegmatites. (Larsen et al., 1998, 2000, 2004; Müller et al., 2002a, 2003a; Götze et al., 2
66 2004). The study of the trace element composition in granitic quartz enables to recognise contrasting magmatic origins and evolutionary trends in pegmatite fields that otherwise share many similarities (Larsen 2002; Larsen et al., 2004). Other studies are addressing micro textures in metamorphic quartz or fluid-quartz interaction processes during subsolidus and deformation events (Monecke et al., 2002; Müller et al., 2002b; Van Der Kerkhof et al., 2004). In contrast to the previous studies cited above, the current study also focuses on the trace element distribution in quartz that formed at high T and P, i.e. early in the petrogenetic evolution of granitic rocks. The Kleivan granite, part of the Rogaland igneous Province, was selected for this purpose because of its spectacular magmatic differentiation featuring a well developed compositional zonation beginning with primitive charnockitic granite and ending with aplite biotite granite and granitic pegmatite. Regional geology The Rogaland-Vest Agder sector is the westernmost segment of the Precambrian basement of southern Norway separated from the Telemark terrane to the east by the Mandal-Ustaoset fault zone and by the Norwegian Caledonides to the north. The basement is composed of different generations of massive banded, migmatitic and augen granitic gneisses that formed during the three metamorphic events related to the Sveconorwegian orogeny (Maijer, 1987). Numerous late to post-tectonic intrusions intruded the precambrian basement in the region. These can be divided into two main rock suites (Fig 1). The first represents the Anorthosite-Mangerite-Charnockite (AMCG) suite of the Rogaland Igneous Province emplaced in a short time span around 930 Ma in Rogaland (Pasteels et al., 1979; Schärer et al., 1996). The second rock suite comprises a series of A-type hornblende- biotite-bearing granitoids (HBG) forming a north-south trending belt extending along the Mandal-Ustaoset line in the eastern part of the Rogaland/Vest Agder sector (Vander Auwera et al, 2003). These two suites are petrogenetically distinct and were generated by partial melting and differentiation of different sources: a lower crustal anhydrous, gabbronoritic source for the AMCG rock 3
67 series and a hydrous undepleted to slightly depleted potassic mafic source for the HBG granitoids (Vander Auwera et al., 2003). The zoned Kleivan granite The Kleivan granite forms an oval body covering 20 km 2, which is located 25 km north of Lindesnes, the southernmost point of Norway. It is separated from the Farsund charnockite of the Rogaland Igneous Province by the large Lyngdal granodiorite body (Fig 1), which belongs to the HBG rock suite (Bogaerts et al., 2003; Vander Auwera et al., 2003). The contact between the undeformed coarse-grained granite and the country rock gneisses is usually sharp and well defined. The Kleivan granite represents a series of genetically related granitic rocks produced by magmatic differentiation, which can be divided in four types easily recognisable in the field by their mineral assemblages. At first, a charnockitic granite (Px-granite) formed in the north-western part and developed into hornblende-bearing granite (Hbl-granite), then a biotite-bearing granite (Bi-granite) to end up as a fine grained biotite-bearing aplitegranite (Apl-granite) with pods and lenses of granitic pegmatites (Fig 1). The Kleivan zonation is the result of the successive separation of granite fractions from a convecting magma. Mushes of melt and crystals accumulated at the bottom of the magma chamber in a series of gradually more evolved compositions toward the top of the reservoir. Pyroxene, hornblende and biotite in that order of appearance are the dominant fractionating ferromagnesian phases with falling temperature and advance of the solidification (Jacamon and Larsen, in review). The pyroxene and hornblende part of the body formed at 5 kbar and fo 2 around QFM level, whereas the top part of the intrusion probably crystallised at slightly lower pressure of 4 kbar and higher fo 2 (Jacamon and Larsen, in review). The temperature of crystallisation varies from 900 C to the solidus temperature of the most evolved aplitegranite at 645 C and was controlled by the H 2 O content of the residual melts. A more thorough discussion concerning the igneous evolution of the Kleivan granite is addressed by Jacamon and Larsen (in review). 4


 Geological map of the Kleivan granite with")
68 Fig 1: (Top) The Rogaland intrusive complex. Eg-Og, Egersund-Ogna Anorthosite; H-H, Håland-Helleren twin anorthosites; Å-S, Åna-Sira Anorthosite; E-R, Eia-Rekefjord intrusion; BKSK, Bjerkreim-Sokndal layered intrusion; QMG, Quartz-mangerite units above the BKSK intrusion; Apo, Apophysis intrusion; F, Farsund charnockite; K, Kleivan granite. L, Lyngdal granodiorite (HBG rock suite). Partially redrawn and modified from Duchesne and Michot (1984). (Bottom) Geological map of the Kleivan granite with sample localities. The dotted lines correspond to the borders between the different granite types defined by Petersen (1980). 5

.")
 SEM-CL picture of a few mm-wide quartz vein intersecting the aplite-granite and showing massive quartz recrystallisation within the vein.")
69 Petrography of the Kleivan granite The general textural relationships among the primary minerals contained in the various rock types composing the Kleivan granite support progressive evolution of the crystallising melt by magmatic differentiation. This picture of transitional mineralogical evolution from pyroxene to hornblende and biotite is often overprinted by post magmatic textures due to late magmatic deuteric alteration, subsolidus recrystallisation and exsolution (Fig 2b, Fig 2d). Fig 2: a) Ablation crater in homogeneous magmatic quartz on a Back Scattered Electrons (BSE) picture (note the mesh of individual laser shots in raster mode). b) SEM-CL picture of a few mm-wide quartz vein intersecting the aplite-granite and showing massive quartz recrystallisation within the vein. (black stains are felt-tip pen marks added by the author). c) Combined BSE and SEM-CL picture of a quartz crystal. Trails and patches of late secondary quartz are only visible on the SEM-CL part of the picture. d) SEM-CL picture of an altered quartz grain in the hornblende-granite. 6
70 Pyroxene-granite (Px-g) This charnockitic granite is the most primitive rock in the Kleivan intrusion and is located in the north westernmost part of the massif (Fig 1). The mafic mineral assemblage comprises Fe-rich orthopyroxene (charnockite granite) and calcium-rich hornblende (ferro-hastingsite) and opaque minerals (ilmenite/ti-magnetite). Clinopyroxene, apatite, zircon and calcite comprise the accessory mineral assemblage. Orthopyroxene is usually altered and is partly replaced by hornblende. Accessory opaque minerals, apatite and zircon are closely associated with pyroxene and hornblende. A few subhedral calcite grains of probable magmatic origin are also present in this rock-type. The felsic assemblage consists of plagioclase (andesine), perthitic alkali-feldspars and quartz. The Px-granite has a modal Kfs/Plag ratio of about 1.2, with a Q: A: P ratio of 26:40:34 (Petersen, 1980). Hornblende-granite (Hbl-g) This type of granite typically occupies the central and north-eastern part of the pluton (Fig 1), with a transitional composition between the primitive pyroxene-granite and the more evolved biotite-granite in the southern part. The mafic assemblage in this rock type is mostly composed of coarse-grained hornblende (hastingsite) and accessory biotite. Pyroxene is absent and opaque minerals, apatite and zircon are less abundant. Allanite becomes prominent southwards. Hornblende disappears southwards at the expense of biotite, the rock showing transitional assemblages of hornblende and biotite intergrowths. The feldspars are composed of more sodic plagioclases (oligoclase, An 26 ) and perthitic alkali-felspars. The Hornblende-granite has a modal Kfs /Plag ratio of about 1.8, with a Q: A: P ratio of 28:48:26 (Petersen, 1980). Biotite-granite (Bi-g) The biotite-granite occupies the southern part of the Kleivan intrusion. The modal proportion of biotite in the rock decreases drastically southwards, finally representing a few % of the modal composition in the most evolved part. Based on the 7
71 biotite pleochroism, two types of biotite-granites are defined. Biotite in the biotite1- granite (Fig 1, samples Bi-1, Bi-2) occupying the northen part features a brown pleochroism, whereas in the southern part, biotite in the biotite2-granite (samples Bi-3, Bi-4, Bi-5) shows green pleochroism. The Bi-granite has a modal Kfs/Plag ratio of 2.7 with a Q:A:P ratio of 33:49:18, the feldspars being plagioclase (oligoclase An 18 ) and perthitic microcline (Petersen, 1980). Aplite-granite (Apl-g) The aplite-granite is located in the southern most part of the Kleivan intrusion and defines the contact of the pluton towards the country rock gneisses. Accessory garnets and sillimanite were found in the aplite-granite. Sillimanite, not previously reported in this intrusion, occurs as spherulitic aggregates of euhedral slender fibers, hence is interpreted as a primary igneous phase. Finally, granitic pegmatites occur as pods and sheets intermingled with the aplite-granite and are particularly abundant in the roof pendant of the intrusion. Altogether, the zone that was denoted aplite-granite by Petersen (1980) is rather a zone that varies between aplitic, granitic and pegmatitic domains. Methodology The sampling was planned after the descriptive map by Petersen (1980) showing the magmatic differentiation pattern of the pluton defined by the occurrence of the four main granite types described above (Fig 1). Seven samples of pyroxene-granite were gathered in the north-western part of the body (Px-1 Px-7), five samples of hornblende-granite are from the central part (Hbl-1 Hbl-5), five samples from the biotite-granite covering the southern part of the intrusion (Bi-1 Bi-5) and one sample of the aplite-granite (Apl), from the southernmost rock type at the contact with the country rock gneisses. Chemical analyses included X-ray fluorescence spectrometry using a Philips PW 1480 spectrometer at the Department of Geology and Mineral Resources Engineering 8
72 (IGB) at the Norwegian University for Science and Technology (NTNU) in Trondheim, Norway. Five USGS standards, BHVO-2/1, DNC-1/1, JGb-1/1, RGM-1/1, GSP-2/1 from the U.S. Geological survey, Denver Federal Center, Colorado, were used for the calibration of trace element data and four USGS strandards, BHVO-2/1, RGM-1/1, BCR-2/1 and BIR-1/1 were used for the calibration of major elements. Mean values for bulk major and trace elements in the four main granite types are listed in Appendix micrometers polished thick sections were prepared from the samples in order to run LA-ICP-MS analyses of quartz. The great advantage of this technique compared to conventional solution ICPMS, is the possibility to work in situ hence to avoid foreign inclusions and to analyse texturally significant areas of the quartz grains. Quartz analyses were performed at the Geological Survey of Norway (NGU) in Trondheim with a standard, double focusing sector field ICP-MS instrument (Finnigan MAT, ELEMENT1) with a CD-1 option from Finnigan MAT and with a UV-laser from Finnigan MAT/Spectrum, Berlin, Germany. 7 Li, 9 Be, 11 B, 27 Al, 74 Ge, 85 Rb, 88 Sr, 137 Ba, 208 Pb, 238 U were analysed at low resolution (m/δm=300) and 23 Na, 31 P, 25 Mg, 39 K, 44 Ca, 47 Ti, 56 Fe at medium resolution (m/δm 3500). The isotopes 29 Si and 30 Si were used as internal standard at low and medium resolution, respectively. External calibration was done with the following international standards: NIST610, NIST612, NIST614, NIST616, NIST 1830, BCS313 and Blank SiO 2 (Federal Institute for Material Research and Testing, Berlin, Germany). Blank SiO 2 was used to constrain the detection limits (LOD) between 0.01 and 10 ppm depending on the ionization potential and availability of well characterized standards. The detection limits (LOD=3σ/S) are estimated from the standard deviation (σ) of 15 measurements of blank SiO 2 and the sensitivity factor (S, in cts/ppm) defined as the slope of the regression line of the calibration curve established with the standards set. The accuracy of the analysis is estimated from measurements of control standards at regular intervals. Using several standards with a wide range of concentrations facilitates more accurate calibration curves than the twopoint calibration (typically Ar-blank and NIST612) that is commonly used by the LA- ICP-MS community. Laser ablation was performed in rasters of about 150X180 μm areas (Fig 2a), with average laser energy of 1.3 mj, a laser frequency of 10 Hz and a 9
73 spot size of 30 μm. Each measurement includes 20 scans of each isotope. The choice of measurement time depends on the resolution, expected element concentration, the number of channels in the mass range and the required mass window. More information about the methodological method may be found in Flem et al. (2002). Back Scattered Electrons (BSE), SEM-CL and optical microscopy allow to carefully select homogeneous areas of primary quartz for LA-ICP-MS analyses. SEM- CL was used to unravel several generations of quartz and to locate the primary igneous quartz (Fig 2b, 2c, 2d). BSE pictures reveal the surface topography defects (open cracks, surface irregularities). Mineral inclusions are easily distinguished from the host quartz and may be identified by energy or wavelength dispersive spectrometry (EDS, WDS). Microscopic optical observations in transmitted light reveal the distribution of inclusions, such as fluid inclusions trails or solid mineral inclusions, inside the volume of the thick section. The penetration depth of the electron beam used for BSE and SEM- CL pictures is usually relatively small (a few μm), so that these techniques only give information about the top layer of the sample. As the depth of an ablation crater can be up to several tens of micrometers, it was controlled by optical microscopy that the selected volume of quartz was void of inclusions. Geochemistry Bulk major and trace element evolution The results from XRF analyses for both major and trace elements (Fig 3) support the overall evolution of the Kleivan granite by melt differentiation and successive granite fractionation from pyroxene charnockitic to aplitic compositions. According to Shand s classification (1947), the Aluminium Saturation Index, ASI=Al 2 O 3 /(CaO+Na 2 O+K 2 O),mol increases steadily from metaluminous compositions (ASI=0.87) in the pyroxene-granite to peraluminous composition (ASI=1.14) in the aplite-granite. This trend is also confirmed by the higher content of normative corundum in the successive granites and the presence of igneous sillimanite and garnet in the aplite-granite (Fig 3a, Appendix 1). 10
74 Chemistry of quartz Quartz is a tectosilicate in which every silicon atom is tetrahedrally coordinated to four oxygens. Depending on the T, P conditions, silica (SiO 2 ) may form in different crystallographic structures known as the silica polymorphs. At appropriate P (P<20 kbar) and T (T<1000 C), magmatic quartz usually occurs in the form of low temperature α-quartz or high temperature β-quartz. Its structure consists of interlocking spirals (screw axis) of SiO 4 tetrahedra that run parallel to the c-axis of the structure. At lower temperature, the β-quartz hexagonal structure undergoes a structural rearrangement to reach the more stable α-quartz trigonal structure. The purity of quartz is usually not related to the macroscopic or microscopic appearance of quartz. Indeed, just a few ppm of an element at specific colour centres provides the macroscopic colouring whereas clear transparent quartz may contain hundreds of ppm of impurities. For example, Fe contamination gives the yellowish colour to the citrine quartz variety and the purple colour to amethyst quartz, depending on its valence and place in the quartz lattice. Ti in the structure gives a rose colour to quartz or may occur as thin microscopic rutile needles that exsolved from the quartz structure during cooling. Smoky quartz results from structural damages caused by ionising radiations emitted from radiogenic elements like 40 K from the neighbouring feldspars, but smoky quartz may nevertheless be very pure (Rossman, 1994; Larsen et al., 1998). In an attempt to classify different varieties and qualities of quartz, different types of lattice defects must be recognised. 11
75 Fig 3: (a) Evolution of the Aluminium Saturation Index ASI, (b) CaO/K 2 O, (c) FeO/MgO with magmatic differentiation (Ge/Ti,qz). Trace element relations in the Kleivan granite: d) Ba vs Rb, e) Ba vs Sr), f) Rb/Sr vs Sr, g) Zr vs Rb, h) Ba vs Pb. 12
76 Lattice defects and inclusions Inclusions and defects in the crystallographic structure of quartz may be divided into three categories: 1) points defects 2) solid or fluid inclusions i.e. foreign minerals and volatiles and 3) dislocations. The following discussion will emphasise the first category. Electron Paramagnetic Resonance (EPR) either alone or combined with other spectroscopic methods such as thermoluminescence (TL), cathodoluminecence (CL), infrared spectroscopy and atomic absorption spectrometry is the most efficient technique to identify point defects in quartz (Weil, 1984, 1993; Götze and Plötze, 1997; Götze et al., 2001). Spectral CL analysis in combination with spatially resolved traceelement EPMA, SIMS or LA-ICP-MS analysis is an alternative technique to investigate and quantify point defects in quartz (Müller et al., 2003b). Up to date, about 20 different types of paramagnetic defect centres have been recognised in quartz (Weil, 1984, 1993). The most encountered point defects in quartz are summarized in Fig 4. The ideal quartz structure is represented by the perfect arrangement of interconnected chains of SiO 4 tetrahedra extending along the crystallographic c-axis. From that ideal state, atoms may be missing, creating oxygen or silicon vacancies (Moiseev, 1985; Halliburton et al., 1984; Jani et al., 1983). Non bridging oxygen hole centres were first described by Griscom (1985). Some bonds can also break and recombine with other elements to form different chemical groups such as silanol groups, i.e. OH - centres (Weil, 1984) or peroxy radicals and linkages (Baker and Robinson, 1983; Friebele et al., 1979). Substitution for Si in quartz is seldom because of the small ionic radius and the high valence of Si 4+ (0.40Å, Shannon, 1976). However, during crystal growth of quartz, foreign elements present in the crystallising melt may be incorporated into the quartz structure at the cation site. The ionic potential (charge/ionic radius: Z/R) and bonding type (ionic-covalent bond) are the most important factors that control the incorporation of a foreign element. The size of the inter-atomic cavities 13
77 between the ions defining the quartz lattice will also prevent large cations from entering the structure. The temperature and pressure of crystallization controls the elasticity of the lattice as well as the space available for trace element incorporation. Foreign elements substituting for silicon are known as structurally bound elements and are strongly confined to the structure. On the contrary, interstitial elements are accommodated in channels extending along the c-crystallographic axis or at vacancies in the lattice to balance the charge anomalies of the structure. In comparison to structurally bound elements, charge compensators are more subject to mobility in the structure, because of the relative weakness of pure ionic bonds in comparison to ioniccovalent bonds. Their abundance in quartz may, therefore, be sensitive to remobilization processes (Larsen et al, 2004). Fig 4: Schematic illustration summarizing the most important point defects detected in quartz (modified from Götze et al., 2001). 14
78 In quartz three main substitution modes govern the incorporation of structural trace elements: 1) single substitution, 2) double substitution, 3) compensated substitution. Single substitutions correspond to an isoelectronic substitution of one Si 4+ by an other tetravalent cation, like Ti 4+ or Ge 4+. Double substitution refers to AlPO 4 groups (Huttenlocher, 1935; Beck, 1949) and comparable Al-O - -P colour centres responsible for the pink colour of rose quartz (Maschmeyer and Lehmann, 1983; Balitsky et al., 1996) that form after substitution of two Si 4+ cations by one trivalent Al 3+ and a neighbouring pentavalent P 5+ to balance the total charge. Compensated substitutions occur when trivalent (Al 3+, Fe 3+ ) cations substitute for Si 4+ to form [(Al,Fe)O 4 /M + ] 0 centres, in which M + represents a charge compensator alkali cation such as H +, Li +, Na + and K + (Mackey, 1963; Götze et al., 2001, 2004). Quartz trace element composition in the Kleivan granite Potentially, there are many trace elements that may be found as impurities in quartz. Their concentration in quartz range from a few ppb to hundreds of ppm, depending on the nature and abundance of the considered element in the melt. According to most studies B, Be, Ge, Ti, P, Al, Fe, H, Li, Na, K, Rb, Sr may be considered as true structural elements, among them the alkali elements usually represent monovalent charge compensators cations confined to interstitial positions in the crystallographic framework. On the contrary, Ca, Cr, Cu, Mg, Mn, Pb and U, whose ionic potentials are incompatible for Si 4 + substitutions, may rather be concentrated in sub microscopic fluid and/or solid inclusions (Larsen et al., 2004 and ref. therein). The alkali cations may also occur as sub microscopic atomic clusters (Brouard et al., 1995). In the Kleivan granite the most important elements by weight are Al, Ti, Fe, P, Li and Ge in that order of abundance. In molar proportions, Li is found between Al and Ti. These elements represent about 95 wt% of the trace elements in quartz. Fe, Na, K, B, Be are among the most abundant elements of the 5% remaining, but they are difficult to measure, either because their concentration is below the detection limit (B, Be) or because of nonlinear analytical problems with high background levels (Na, K, Fe). Only Al, Ti, Fe, P, Li and Ge analysis in quartz are reported in this study of the Kleivan 15
79 granite. The detection limit (LOD) is 10.7 ppm for Al, 0.8 ppm for Ti, 1.0 ppm for P, 1.8 ppm for Fe, 2.1 for Li and 0.35 for Ge. The analytical error ranges within 10% of the absolute concentration of the element (Flem et al., 2002). Geochemical behaviour of structural trace elements in igneous quartz Specific ions like Ti 4+, Ge 4+, Al 3+, P 5+ having a similar charge/radius as Si 4 +, make strong ionic-covalent bonds with the oxygen atoms, while substituting for Si 4+ in the (SiO 4 ) - tetrahedron. Therefore, they are strongly confined to the structure and their concentration in quartz is a robust magmatic signature, which may be used as a petrogenetic indicator of igneous processes (Larsen et al., 2004). The ratio between a compatible and an incompatible element is a widespread index used as an expression of the differentiation of an igneous system. Due to their contrasting geochemical behaviour, the ratio is strongly sensitive to the evolution of the system. The Rb/Sr, Rb/Ba and the K/Rb ratios of whole rock samples and feldspars are commonly used to demonstrate the evolution of an igneous system. Ti is a strongly compatible element in a granitic system, due to its strong affinity for early forming mafic minerals (ilmenite, magnetite and pyroxene, amphibole, biotite). On the contrary, Ge does not partition strongly into any particular mineral phase and is concentrated in the residual melt and, therefore, is behaving as an incompatible element (Larsen et al., 2004). Furthermore, Ge and Ti develop the same bonding behaviour in the quartz crystallographic structure and are normally immobile during subsolidus processes. Hence the Ge/Ti ratio is of particular interest for trace element studies of quartz. The Ge/Ti ratio seems to be even more sensitive at high degrees of differentiation and is particularly relevant for the study of highly evolved pegmatitic quartz (Larsen et al., 2004). 16
80 Trace element variation diagrams Fig 5. The trace element variation in quartz from the Kleivan granite is presented in The steady decrease of the titanium concentration of quartz, from about 100 ppm in the charnockitic pyroxene-granite down to 10 ppm in the aplite-granite (Fig 5a, 5b) confirms the expected compatible behaviour of this element, which partitions into the early forming mafic phases and is continuously extracted from the melt. The incompatible character of germanium is well demonstrated in Fig 5c, 5d, where its concentration increases regularly as the melt becomes more evolved, from 0.5 ppm in the primitive pyroxene-granite to 2.5 ppm in the aplite-granite. Phosphorus concentrations in Kleivan quartz vary from 7 ppm to 21 ppm. There is about 10 ppm phosphorus in the pyroxene-granite, and the concentration drops down to 7 ppm in the hornblende-granite and in the biotite1-granite. From that point, a sharp increase to 21 ppm is observed towards the aplite-granite (Fig 5e, 5f). Lithium should be considered as a special element that of course is lithophile in character, but differs from the other LILE elements due to its small size and atomic weight. In the Kleivan granite, the Li concentration in quartz ranges from 9 ppm to 26 ppm by weight, but it is the most abundant alkali element in molar proportions because of its low atomic weight compared to Na or K. The evolution of the Li concentration in quartz shows a complex behaviour relative to the degree of differentiation of the granite (Fig 5i, 5j). The concentration of aluminium in quartz increases four times during the evolution of the Kleivan granite. It evolves from about 100 ppm in the pyroxene- and hornblende-granites to 150 ppm at the biotite1-granite stage, 250 ppm at the biotite2- granite stage and reaches a 450 ppm concentration in the aplite-granite (Fig 5g, 5h). 17
81 Fig 5: Quartz trace element variations in the Kleivan granite with magmatic differentiation (Ge/Ti, qz). All data are plotted on a), c), e), g), i). On b), d), f), h), j), mean values are given together with error bars corresponding to one standard deviation (1σ). See appendix 2a, 2b for complete data set. Trend curves are constructed from the data mean values. 18
82 Quartz geothermometry The temperature T=760 C (±40 C) calculated with the geothermobarometer of Holland and Blundy (1994) corresponds to the equilibrium temperature of the hornblende-plagioclase assemblage. Usually, quartz forms later in the crystallisation sequence at lower temperature. At water undersaturated conditions, the quartz liquidus temperature strongly depends on the water content of the melt and decreases drastically with high H 2 O contents (Whitney, 1975, 1988; Naney 1983). New experimental data acquired from a hornblende-biotite-monzogranite (charnockite) composition (Dall agnol et al., 1999) demonstrated however, that quartz, hornblende and plagioclase can represent an equilibrium assemblage at 3 kbar, T solidus <T<800 C, fo 2 QFM-0.5 (NNO- 1.5) and >4 wt.% H 2 O in the melt, which, except for the pressure, are similar conditions to those prevailing during emplacement of the Kleivan granite (Jacamon and Larsen, in review). Therefore, we consider that the temperature T=760 C (±40 C) calculated with the geothermobarometer of Holland and Blundy (1994) is relevant for quartz. However, at fixed pressure and fo 2, the temperature range for quartz crystallisation varies as a function of the melt composition and the H 2 O content (or H 2 O activity) in the melt. Therefore the formerly calculated temperature of 760 C (±40 C) just represents an estimate of the temperature of quartz formation in the pyroxenehornblende-kleivan granite, corresponding to a particular H 2 O content in the melt at the time of fractionation of this granite. Jacamon and Larsen (in review) have described the process of differentiation responsible for the zonation of the Kleivan granite and have estimated the evolution of the H 2 O content in the differentiating melt. At 5 kbar, the H 2 O content in the parent melt (ini.melt), in the melt at the transition between pyroxeneand hornblende-granite (res.melt1), and in the melt at the transition between the hornblende- and biotite-granite (res.melt2) averages 4.6, 5.8 and 10.1 wt.% H 2 O, respectively (Jacamon and Larsen, in review). The H 2 O contents in the melt during formation of the pyroxene- and hornblende-granites were approximated as the average H 2 O content of ini.melt plus res.melt1, and of res.melt1 plus res.melt2, respectively. At 5 kbar, the melt is saturated in water at the time of crystallisation of the biotite- and aplite-granite. 19
83 Fig 6: Liquidus phase relations of the Kleivan granites series in the system Qz-Ab-Or- H 2 O at P=5 kbar for three H 2 O activities in the system, ah 2 O=0.4, ah 2 O=0.6 and ah 2 O=1. The position of the minimum melt temperature is labelled by a star for each system. Normative compositions of all samples reduced to the dry haplogranite system are plotted on the top-left diagram. Dark symbols represent the average composition of each granite type, which was considered to determine liquidus temperatures. See discussion in the text. Liquidus phase relations in the system Qz-Ab-Or-H 2 O-CO 2 at 5 kbar were established by Holtz et al. (1992) for three different H 2 O contents (activities) in the melt, for 4 wt.% H 2 O (a H2O =0.39), 5.5 wt.% H 2 O (a H2O =0.57), and 9.9 wt.% (a H2O =0.98) in the melt. At equilibrium conditions, the activity of water in the system may be calculated either from the water content in the melt with the model of Burnham (1979) or from the vapour composition by using the modified Redlich-Kwong equation (Kerrick and Jacobs, 20
84 1981). The normative compositions of the Kleivan pyroxene-, hornblende-, biotite- and aplite-granites projected in the haplogranitic system (Qz-Or-Ab) are plotted in the former ternary diagrams in order to determine the liquidus temperatures of quartz and alkali feldspars during crystallisation of the different granites (Fig 6). It is assumed that most of the other components of the system already have partitioned into early refractory phases and that reequilibration between these phases and the interstitial haplogranitic melt is limited, perhaps with the exception of plagioclase. The addition of calcium to the haplogranitic system increases solidus and liquidus temperatures of the cotectic melt, quartz, alkali feldspar, and plagioclase assemblage (references in Johannes and Holtz, 1996). Therefore liquidus temperature estimates for the pyroxenegranite (11.0 wt.% An normative) and to a lesser extent the hornblende-granite (5.5 wt.% An normative) might be slightly underestimated by studying phase relations in the haplogranite system. Most of the Kleivan normative haplogranitic compositions are located close to the cotectic lines between quartz and alkali feldspars regardless of the H 2 O activity in the melt hence implying that the liquidus temperature of quartz and feldspars are similar with a few tens of degrees. Solidus temperatures for minimum melt compositions in the hydrated haplogranitic system at 5 kbar were established by Ebadi and Johannes (1991) as a function of the activity of H 2 O in the fluid in equilibrium with the melt. The average H 2 O contents and activities in the ini.melt, res.melt1, res.melt2 and in the Pyr-, Hbl-, Bio-, Apl-granites forming melts are summed up in Table 1. The H 2 O activities during formation of the pyroxene-granite (0.43<aH 2 O<0.67) and hornblendegranite (0.78<aH 2 O<1) are intermediate between those used by Holtz et al. (1992) for their experiments. Therefore, liquidus temperatures were interpolated from the available experimental data at ah 2 O=0.4, 0.6 and 1, respectively. 21
85 P=5 kbar TQz ( C) TKfs ( C) wt.% H2O ah2o* ah2o=0.4 ah2o=0.6 ah2o=1 ah2o=0.4 ah2o=0.6 ah2o=1 ini.melt Pyr-g res.melt Hbl-g res.melt Bi-g >( ) Apl-g >( ) Table 1: Liquidus temperatures of quartz (T Qz ) and alkali feldspar (T Kfs ) in the different Kleivan granite types as a function of the H 2 O activity in the system from experimental data at ah 2 O=0.4, ah 2 O=0.6, ah 2 O=1 by Holtz et al. (1992). The activity of H 2 O (ah 2 O) was determined from the H 2 O content in the melt with the model of Burnham (1979). Solidus temperatures (T S ) are estimated from Ebanni and Johannes (1991). From the above considerations, we may infer as a rough estimate that quartz and alkali feldspar crystallised in the range T= C, T= C, T= C, and around T=645 C in the pyroxene-, hornblende-, biotite- and aplite-granites, respectively. Behaviour of trace elements in quartz during Kleivan differentiation The regular evolution of the Ti- and Ge-in-quartz in the Kleivan melt may be related to the decrease of the temperature of quartz crystallisation during differentiation. Table 2 summarizes the concentration of Ti, Ge and Ge/Ti ratio in quartz as a function of the crystallisation temperature of quartz determined before. These values may be used as a geothermometer for similar magmatic systems. However, one should be aware of the uncertainties pertaining to the analytical data and temperature estimates discussed before and should use these data with caution. 22
86 Ti (ppm) Ge (ppm) Ge/Ti T ( C) Pyr-g 89±11 0.7± ± Hbl-g 73±12 0.8± ± Bi-g 49±18 1.3± ± Apl-g 8±0 2.5± ± Table 2: Variations of Ti, Ge (Ge/Ti) contents in quartz as a function of the temperature of formation of quartz. Errors correspond to one standard deviation (±σ). Large variations in phosphorus-in-quartz have been observed within most of the granite types composing the Kleivan granite (Fig 5e, 5f). Although an evolutionary trend may be defined from mean values of the data set, there are large uncertainties associated with the P-in-quartz evolution. However, the amount of phosphorus in the successive generations of melts apparently is controlled by the presence of accessory apatite. Indeed, apatite is common in the pyroxene-granite, but is considerably less abundant in the hornblende-granite and entirely absent in the biotite-granite. Therefore, the amount of apatite, which is the dominant phosphorous-bearing phase in the system, seems to control the activity of phosphorus of the melt. Accordingly, the continuous crystallisation of apatite buffers phosphorous in the melt, which may account for the stability or slight depletion of phosphorous in quartz during the first stages of differentiation, from 10 ppm in the pyroxene-granite to 7 ppm in the hornblende- and biotite1-granites. The sudden disappearance of apatite in the biotite and aplite-granite may be responsible for the net increase of phosphorous up to 21 ppm in the most evolved aplite-granite. Phosphorous is incompatible in this part of the system, where apatite is absent, hence is enriched in the melt. This relationship demonstrates the importance of buffering phases with regard to specific trace elements in quartz. The small atomic size of lithium favours the substitution of Li + for Mg 2+ (to some extent Fe 2+ ) in the ferro-magnesium minerals, unlike the other larger alkalies. The regular increase of the Li/Mg ratio during igneous differentiation is well-established (e.g. Nockolds and Allen, 1953, 1954, 1956). During the first part of the evolution of the Kleivan granite, the Li concentration in quartz decreases steadily from 15 ppm in the 23
87 pyroxene-granite to 9 ppm in the biotite1-granite. Along this path of fractional crystallisation, orthopyroxene is gradually taken over by hornblende and biotite, which have a more open structure facilitating the incorporation of lithium. This makes lithium compatible during this part of the igneous evolution and may explain the falling Li concentrations found in the quartz. At the transition between the biotite1- and the biotite2-granite, we observe a sharp increase in Li going up to 26 ppm, which coincides with a massive drop in the biotite content of the biotite-granite. In the most differentiated rock, biotite is the only mafic mineral and comprises <1 vol.% of the rock (Petersen, 1980). The disappearance of a dominant Li sink and the parallel increase of the concentration of Li in the melt is strongly recorded in quartz. An alternative interpretation of the strong Li-in-quartz enrichment may be related to the increase of the Al content in quartz (Fig 5e, 5f), because a monovalent cation is required to charge balance Al when substituting for Si. However, this scenario does not explain the abrupt increase in the Li concentration, given that Al experiences a much more steady increase. Furthermore, the linear correlation between Al- and Li-in quartz is poor. Hence we conclude that the strong Li increase is the result of much higher concentrations in the melt. The lithium decrease to 21 ppm at the last stage of differentiation in the aplitegranite is more difficult to explain. Not much work has been done on lithium partitioning between a silicate melt, an aqueous phase and minerals (Shaw and Sturchio, 1992; Ansom and Lagache, 1991; Lagache and Ansom, 1991), particularly in the general case of lithium-poor systems. The primary lithophile character of lithium might favour partitioning into the silicate melt and quartz rather than in aqueous fluids. However, Ansom and Lagache (1991), and Lagache and Ansom (1991) did not find consistent lithium partitioning coefficients among silicate melt, aqueous fluid and minerals relative to the total alkali content (Na + K). Some studies do indeed imply that Li has a strong affinity to the aqueous phase and partition into the immiscible volatiles developing towards terminal crystallization of a granitic melt (Larsen et al., 2004). The lithium depletion in the Kleivan aplite-granite quartz thus suggests that some lithium may have partitioned into the coexisting aqueous fluid. Additionally, deuteric alteration by the abundant fluids present at the final stage of differentiation may be responsible for 24
88 selective depletion of Li from quartz as it is observed in pegmatitic and aplitic rocks elsewhere (Larsen et al., 2004). Aluminium may either be paired with phosphorous or with a monovalent alkali cation. Although both the P- and Al-in quartz contents increase at the end of the igneous evolution, the low molar proportions of phosphorous relative to aluminium cannot fully account for the charge balance of Al. Besides, there should have been fairly high and detectable K and Na concentrations in quartz if they acted as charge compensators for Al, even though the LA-ICP-MS method is hampered by high detection limits for these elements. However, hydroxyl groups and adsorbed water have been identified in [2AlO 4 /M + ] - defects, where they act as charge compensators together with Li +,K + and Na + (Müller et al., 2002a, 2003a and references therein). The increase of the H 2 O content and the evolution of late aqueous fluids during final differentiation of the Kleivan melt may have enhanced the formation of such H 2 O-related defects towards the end of crystallisation and assisted Al incorporation in the quartz lattice in the most evolved granites. Furthermore, the high Al-in-quartz content in the aplite-granite may result from fast crystal growth rates, which enhance impurities uptake (Müller, 2002a and ref therein). Indeed, the fine-grained texture suggests rapid crystallisation probably induced by volatile exsolution and degassing pulses during the latest stage of differentiation of the Kleivan granite (Jacamon and Larsen, in review). Finally, the regular increase in aluminium in quartz is positively correlated to the Aluminium Saturation Index (ASI) in the melt (Fig 3a). The Kleivan pyroxene-granite samples are metaluminous in average (ASI 0.9), whereas the hornblende- and biotite-granite samples are subaluminous (ASI 1.0) and the aplite-granite sample is peraluminous (ASI 1.1). This trend of increasing aluminium contents in quartz with further differentiation and thus decreasing temperature contrasts with the general idea of increasing aluminium contents in quartz with increasing temperatures (Perry, 1963; Dennen et al., 1970). However, the Aluminium in quartz geothermometer of Dennen et al. (1970) is poorly constrained for magmatic temperatures and not applicable to granitic rocks, as mentioned by the authors. No reliable Al-in-quartz geothermometer has been developed for magmatic conditions, most likely because of the coupled behaviour of Al, i.e. its ability to form coupled substitution with P at high temperatures 25
89 and stuffed derivatives with alkali elements at low temperature (Larsen et al., 2004). Together with temperature, melt composition, i.e. the availability of aluminium and charge compensators seems to have an important role for the partitioning of aluminium in quartz. Here in the Kleivan granite, melt composition was apparently the most decisive parameter. Recent studies confirm that igneous quartz in peraluminous granites and granitic pegmatites actually are characterised by extremely high aluminium contents (Larsen et al., 2005). Iron in quartz was either not analysed or falling below LOD (see Appendix 2a, 2b). However, a general decrease of the iron content in quartz is observed in the progressively more differentiated melts. As a compatible element, iron is continuously depleted from the melt and consequently is less abundant in quartz as differentiation proceeds. Moreover, Fe 2+ and Fe 3+ are large cations (rfe 2+ =0.77Å, rfe 3+ =0.62Å) relatively to Si 4+ (rsi 4+ =0.40 Å) and do not fit very well into the quartz lattice, therefore iron is mostly concentrated in the marginal parts of grains. Müller et al. (2002b) observed iron diffusion in quartz at the contact with a biotite grain and Van der Kerkhof et al. (2004) measured a high iron concentration in the quartz bordering an open fracture in the grain. The high iron content in the primary melt and its ability to be remobilized during alteration and weathering processes may also explain the inconsistency of the iron data. Conclusions -Several trace elements in quartz (Ti, Ge, Al, Li, P, Fe) feature a particular behaviour during the differentiation of the Kleivan granitic melt. Their concentration in quartz is primarily buffered by the composition of the evolving granitic melts. Therefore, they are potentially good tracers of petrogenetic processes. -In comparison to earlier studies concerned with low T, P granitic pegmatiteforming melts, trace element composition in high T and P quartz is also strongly dependent on the differentiation process of the Kleivan granite. 26
90 -The buffering of trace elements in quartz by specific cumulate phases is clearly demonstrated in the current study. Apatite buffers the phosphorus content of the melt and quartz, whereas pyroxene, hornblende and biotite control the concentration of lithium in the melt and quartz during the early stages of differentiation of the Kleivan granite. -During formation of the Kleivan granite, Al-in-quartz is predominantly controlled by the melt composition and increases during the evolution from metaluminous to peraluminous compositions. Contrary to previous studies, it is clear that the concentration of Al in quartz is increasing with falling temperatures. -The temperature range of quartz crystallisation mostly depends on P and the H 2 O activity of the system. During solidification of the Kleivan granite at 5 kbar, quartz crystallised between 800 C (4.6 wt.% H 2 O in the melt) and 645 C (10.1 wt.% H 2 O in the melt). -Ti and Ge contents in quartz (and the Ge/Ti ratio) follow the temperature decrease during differentiation of the Kleivan melt and therefore may be used as a potential geothermometer for differentiating granitic igneous systems. Acknowledgements The first author would like to thank the researchers at the Norwegian geological Survey of Norway (NGU), who gave valuable support during long days of analyses at the LA-ICP-MS facility at NGU, and the laboratory personnel at the Norwegian University of Science and Technology (NTNU) in Trondheim for their help during preparation of the samples and XRF analyses. I am also indebted to the Norwegian Research Council and the Department of Geology and Mineral engineering (IGB, NTNU) that generously funded this study. 27
91 References Ansom S. and Lagache M. (1991). Experimental study of lithium-rich granitic pegmatites: Part I. petalite + albite+ quartz equilibrium. American Mineralogist. Vol 76, pp Baker J.M., Robinson P.T. (1983). EPR of a new defect in natural quartz: possibly O 2. Solid State Comm. Vol 48, pp Balitsky V. S., Makhina I. B., Emelchenko A.G., et al., (1996). Experimental noe izuchenie usloviy obrazovaniya kristallov Rozovogo fosforosoderzhaschego kvarca I prichiny ego redkoy vstrechaemosti v prirode. Geokhimiya. Vol 11, pp (Russian). Beck W. R. (1949). Crystallographic inversions of the aluminium orthophosphate polymorphs and their relation to silica. J. Am. Ceram. Soc. Vol 32, pp Bogaerts M., Scaillet B., Liégeois J. P., Vander Auwera J. (2003). Petrology and geochemistry of the Lyngdal granodiorite (Southern Norway) and the role of fractional crystallisation in the genesis of Proterozoic ferro-potassic A-type granites. Precambrian Research. Vol 124, pp Brouard S., Breton C., Girardet C. (1995). Small alkali metal cluster on (001) quartz surface: adsorption and diffusion. Journal of molecular structure (theochem). Vol 334, pp Burnham C.W. (1979). The importance of volatile constituents. In H.S. Yoder, Ed., The evolution of igneous rocks: Fiftieth anniversary perspectives, pp Princeton University Press, Princeton, New Jersey. 28
92 Dall Agnoll R., Scaillet B., Pichavant M. (1999). An experimental study of a lower Proterozoic A-type granite from the eastern Amazonian craton, Brazil. Journal of Petrology. Vol 40, pp Dennen W., Blackburn W., Quesada A. (1970). Aluminum in quartz as a geothermometer. Contrib. Mineral. Petrol. Vol 27, pp Duchesne J.C., Michot J (1984). The Rogaland intrusive masses: Introduction. In Maijer and Padgett (eds.) The geology of southernmost Norway. Geol. Surv. Norway Spec. Publ. Vol 1, pp Ebadi A. and Johannes W. (1991). Experimental investigation of composition and beginning of melting in the system NaAlSi 3 O 8 - KAlSi 3 O 8 -SiO 2 -H 2 O-CO 2. Contrib. Mineral. Petrol. Vol 106, pp Flem B., Larsen R.B., Grimstvedt A. (2002). The use of inductively coupled plasma mass spectrometry with laser ablation for the analysis of trace elements in quartz. Chem Geol. Vol 182, pp Friebele E.J., Griscom D.L., Stapelbroek M., Weeks R.A. (1979). Fundamental defect centers in glass: the peroxy radical in irradiated, high-purity, fused silica. Phys. Rev. Lett. Vol 42, Griscom D.L. (1985). Defect structure of glasses: some outstanding questions in regard to vitreous silica. J. Non-Cryst Sol. Vol 73, pp Götze J., Plötze M. (1997). Investigation of trace-element distribution in detrital quartz by Electron Paramagnetic Resonance (EPR). Eur. J. Miner. Vol 9, pp Götze J., Plötze M., Habermann D. (2001). Origin, spectral characteristics and practical applications of the catodoluminescence (CL) of quartz- a review. Mineralogy and Petrology. Vol. 71, pp
93 Götze J., Plötze M., Graupner T., Hallbauer D.K., Bray C.J. (2004). Trace element incorporation into quartz: A combined study by ICP-MS, electron spin resonance, cathodoluminescence, capillary ion analysis, and gas chromatography. Geochimica & Cosmochimica Acta. Vol. 68, No. 18, pp Halliburton L.E, jani M.G., Bossoli R.B. (1984). Electron spin resonance and optical studies of oxygen vacancy centers in quartz. Nucl. Instr. Meth. Phys. Res. Vol B1, pp Holland T. and Blundy J. (1994). Non-ideal interactions in calcic amphiboles and their bearing on amphibole-plagioclase thermometry. Contrib. Mineral. Petrol. Vol 116, pp Holtz F., Pichavant M., Barbey P., Johannes W. (1992). Effects of H 2 O on liquidus phase relations in the haplogranite system at 2 and 5 kbar. The American Mineralogist. Vol 77, pp Huttenlocher H. F. (1935). Kristallstruktur des Aluminum-orthophosphates. Z. Kristallog., 90A, pp Jacamon F., Larsen R.B. (in review). The Kleivan granite zonation: The result of close system isobaric differentiation of a H 2 O-rich charnockitic melt at high P and T. Jani M.G., Bossoli R.B., Halliburton L.E. (1983). Further characterization of the E 1 center in crystalline SiO 2. Phys. rev. Vol B27, pp Johannes W., Holtz F. (1996). Petrogenesis and Experimental Petrology of Granitic Rocks. Minerals and Rocks. Springer-Verlag Berlin Heildelberg. 335 pp. Kerrick D.M., Jacobs G.K. (1981). A modified Redlich-Kwong equation for H 2 O, CO 2 and H 2 O-CO 2 mixtures. American Journal of Science. Vol 281, pp
94 Lagache M. and Ansom S. (1991). Experimental study of lithium-rich granitic pegmatites: Part II. Spodumene + albite + quartz equilibrium. The American Mineralogist. Vol 76, pp Larsen R.B. (2002). The distribution of Rare-Earth Elements in K-feldspars as an indicator of petrogenetic processes in granitic pegmatites: Examples from two pegmatite fields in southern Norway. Canadian mineralogist. Vol 40, pp Larsen R.B., Polvé M., Juve G., Poitrasson F. (1998). Composition of volatiles and structural admixtures in quartz in granitic pegmatites, Evje-Iveland, South Norway (ext. absta.). Bull. Geological Survey Norway. Vol 433, pp Larsen R.B., Polvé M., Juve G. (2000). Granitic pegmatite quartz from Evje-Iveland: trace element chemistry and implications for high purity quartz formation. Bull. Geological Survey Norway. Vol 436, pp Larsen R.B., Henderson H., Ihlen P.M., Jacamon F. (2004). Distribution and petrogenetic behaviour of trace elements in granitic pegmatite quartz from granite from South Norway. Contrib. Mineral. Petrol. Vol 147, pp Larsen R.B., Ihlen P.M., Jacamon F., Müller A., Sørensen B.E. (2005). Igneous refinement of quartz-raw materials. Geological Society of America Abstracts with Programs. Vol. 37, No. 7, pp Maschmeyer D. and Lehmann G. (1983). A trapped hole-center causing rose coloration of natural quartz. Z. Kristallog. Vol 163, pp Mackey J. H. (1963). An EPR study of impurity related colour centres in aluminiumdoped quartz. J. Chem. Phys. Vol 39, pp
95 Maijer C. (1987). The metamorphic envelope of the Rogaland intrusive complex. In: Maijer C, Padget P (eds). The geology of southernmost Norway: an excursion guide. Norsk Geologisk Undersøkelse Spec Publ. Vol 1, pp Moiseev B.M. (1985). Natural radiation processes in minerals (in Russ.). Nedra, Moscow. Monecke T., Kempe U., Götze J. (2002). Genetic significance of the trace element content in metamorphic and hydrothermal quartz: a reconnaissance study. Earth and Planetary Science Letters. 202, pp Müller A., Kronz A., Breiter K. (2002a). Trace elements and growth patterns in quartz: a fingerprint of the evolution of the subvolcanic Podlesí Granite System (Krušné hory Mts., Czech Republic). Bull. Czech Geol. Survey. Vol 77, No 2, pp Müller A., Lennox P., Trzebski R. (2002b). Cathodoluminescence and microstructural evidence for crystallisation and deformation processes of granites in the Eastern Lachlan Fold Belt (SE Australia). Contrib Mineral Petrol. Vol 143, pp Müller A., René M., Behr H.-J., Kronz A. (2003a). Trace elements and cathodoluminescence of igneous quartz in topaz granites from the Hub Stock (Slavkovský Les Mts., Czech Republic). Mineralogy and Petrology. Vol 79, pp Müller A., Wiedenbeck M., Van den Kerkhof A.M., Kronz A., Simon K. (2003b). Trace elements in quartz; a combined electron microprobe, secondary ion mass spectrometry, laser-ablation ICP-MS, and cathodoluminescence study. European Journal of Mineralogy. Vol 15, pp Naney M. T. (1983). Phase equilibria of rock-forming ferromagnesian silicates in granitic systems. American Journal of Science. Vol 283, pp
96 Nockolds S.R., Allen R. (1953). The geochemistry of some igneous rock series. Geochimica & Cosmochimica Acta, Vol. 4, pp Nockolds S.R., Allen R. (1954). The geochemistry of some igneous rock series. Part II. Geochimica & Cosmochimica Acta, Vol. 5, pp Nockolds S.R., Allen R. (1956). The geochemistry of some igneous rock series. Part III. Geochimica & Cosmochimica Acta, Vol. 9, pp Pasteels P., Demaiffe D., Michot, J. (1979). U-Pb and Rb-Sr geochronology of the eastern part of the South Rogaland igneous complex, South Norway. Lithos. Vol 12, pp Perry E.C. (1963). Aluminium substitution in quartz, a study in geothermometry. Ph. D. Thesis. Massachussetts Institute of Technology. Petersen J.S. (1980). The zoned Kleivan granite -an end member of the anorthosite suite in southwest Norway. Lithos. Vol 13, pp Rossman G.R. (1994). Colored varieties of the silica minerals. Reviews in Mineralogy. Vol 29, pp Shanon R. D. (1976). Revised effective ionic radii and systematic studies of interatomic distances in halides and chalcogenides. Acta Cryst, A32, pp Shaw D.M., Sturchio M.C. (1992). Boron-lithium relationships in ryolites and associated thermal waters of young silicic calderas, with comments on incompatible element behaviour. Geochimica et Cosmochimica Acta. Vol. 56, pp
97 Schärer U., Wilmart E., Duchesne J. C. (1996). The short duration and anarogenic character of anorthosite magmatism: U-Pb dating of the Rogaland complex, Norway. Earth Planet Sci. Lett. Vol 139, pp Shand S.J. (1947). Eruptive rocks, their genesis, composition, classification, and their relation to ore deposits, with a chapter on meteorites. 3 rd ed. London: Thomas Murby. 488 pp. Vander Auwera J., Bogaerts M., Liegeois J.P., Demaiffe D., Wilmart E., Bolle O., Duchesne J.C. (2003). Derivation of the Ga ferro-potassic A-type granitoids of southern Norway by extreme differentiation from basic magmas. Precambrian Research. Vol 124, pp Van der Kerkhof A.M., Kronz A., Simon K., Scherer T. (2004). Fluid-controlled quartz recovery in granulite as revealed by cathodoluminescence and trace element analysis (Bamble sector, Norway). Contrib. Mineral. Petrol. Vol 146, pp Weil J.A. (1984). A review of electron spin spectroscopy and its application to the study of paramagnetic defects in crystalline quartz. Phys. Chem. Minerals. Vol 10, pp Weil J.A. (1993). A review of the EPR spectroscopy of the point defects in α-quartz: the decade In: Helms CR, Deal BE (eds) Physics and chemistry of SiO 2 and the Si-SiO 2 interface 2. Plenum Press, New York, pp Whitney J. A. (1975). The effects of pressure, temperature and X H2O on phase assemblage in four synthetic rock compositions. Journal of Geology. Vol 83, pp Whitney J. A. (1988). The origin of granite: The role and source of water in the evolution of granitic magmas. Geological Society of America Bulletin. Vol 100, pp
98 Appendix 1 Whole rock XRF analyses Px-1 Px-2 Px-3 Px-4 Px-5 Px-6 Px-7 Hbl-1 Hbl-2 Hbl-3 Hbl-4 Hbl-5 Bi-1 Bi-2 Bi-3 Bi-4 Bi-5 Apl UTM North UTM East Ge/Ti (qz, wt.) SiO 2 (wt.%) TiO Al 2 O Fe 2 O MnO MgO CaO Na 2 O K 2 O P 2 O LOI SUM ASI (mol) CaO/K 2 O (mol) FeOt/MgO (mol) ,95* TE (ppm) Zr Ba Sr Rb Pb Rb/Sr Y Zn Cu Co Cr V Th (-) falling below the limit of detection; (*) wt.% MgO<detection limit ( 100ppm) and set arbitrarily to 50 ppm ASI: aluminium saturation index; TE: trace elements.
99 Appendix 2a LA-ICP-MS data. Trace elements in quartz. All concentrations in ppm. n analysis sample ref. UTM-North UTM-East Li Al P Ti Fe Ge n analyse sample ref. UTM-North UTM-East Li Al P Ti Fe Ge 1 Px-1-a Px-5-e Px-1-b Px-5-f Px-1-c Px-6-a Px-1-d Px-6-b Px-1-e Px-6-c Px-2-a Px-6-d Px-2-b Px-6-e Px-2-c Px-6-f Px-2-d Px-6-g Px-2-e Px-7-a Px-2-f Px-7-b Px-3-a Px-7-c Px-3-b Px-7-d Px-3-c Px-7-e Px-3-d Px-7-f Px-3-e Px-7-g Px-3-f Px-7-h Px-3-g Px-7-i Px-3-h Px-7-j Px-3-i Hbl-1-a Px-3-j Hbl-1-b Px-4-a Hbl-1-c Px-4-b Hbl-1-d Px-4-c Hbl-1-e Px-4-d Hbl-1-f Px-4-e Hbl-2-a Px-4-f Hbl-2-b Px-5-a Hbl-2-c Px-5-b Hbl-2-d Px-5-c Hbl-2-e Px-5-d Hbl-3-a (-) either not analysed (Fe) or falling below the limit of detection.
100 Appendix 2b LA-ICP-MS data. Trace elements in quartz. All concentrations in ppm. n analyse sample ref. UTM-North UTM-East Li Al P Ti Fe Ge n analyse sample ref. UTM-North UTM-East Li Al P Ti Fe Ge 63 Hbl-3-b Bi-2-c Hbl-3-c Bi-2-d Hbl-3-d Bi-2-e Hbl-3-e Bi-2-f Hbl-3-f Bi-2-g Hbl-4-a Bi-2-h Hbl-4-b Bi-2-i Hbl-4-c Bi-3-a Hbl-4-d Bi-3-b Hbl-4-e Bi-3-c Hbl-4-f Bi-3-d Hbl-4-g Bi-4-a Hbl-4-h Bi-4-b Hbl-4-i Bi-4-c Hbl-4-j Bi-4-d Hbl-5-a Bi-4-e Hbl-5-b Bi-4-f Hbl-5-c Bi-4-g Hbl-5-d Bi-5-a Hbl-5-e Bi-5-b Hbl-5-f Bi-5-c Hbl-5-g Bi-5-d Hbl-5-h Bi-5-e Bi-1-a Apl-a Bi-1-b Apl-b Bi-1-c Apl-c Bi-1-d Apl-d Bi-1-e Apl-e Bi-1-f Apl-f Bi-2-a Apl-g Bi-2-b (-) either not analysed (Fe) or falling below the limit of detection.
101
102 The Kleivan granite zonation: The result of close system isobaric differentiation of an anomalously H 2 O-rich charnockitic melt at high P and T Francois Jacamon Department of Geology and Mineral Ressources Engineering, Norwegian University of Science and Technology (NTNU), N-7491 Trondheim, Norway (francois.jacamon@geo.ntnu.no) Rune Berg Larsen Department of Geology and Mineral Ressources Engineering, Norwegian University of Science and Technology (NTNU), N-7491 Trondheim, Norway (rune.larsen@geo.ntnu.no) Abstract The Kleivan granite shows a spectacular and rare gradual zonation from charnockitic-granite through hornblende-granite to biotite- and aplite-granites. The distribution of the H 2 O-CO 2 fluid inclusions in matrix quartz throughout the intrusion (Konnerup-Madsen, 1977) suggests the evolution of an originally CO 2 -rich vapour towards H 2 O-rich compositions. Assuming isobaric close-system evolution, the knowledge of the vapour and modal composition allow for recalculating the H 2 O and CO 2 dissolved in the melt at any stage of differentiation. The volatile content in the melt varies from 4.6 wt.% H 2 O, 2400 ppm CO 2 in the parent magma (ini.melt), through 5.8 wt.% H 2 O, 2500 ppm CO 2 at the pyroxene-/hornblende-granite transition (res.melt1), to 10.1 wt.% H 2 O, 200 ppm CO 2 at the hornblende-/biotite-granite transition (res.melt2). At 5 kbar and fo 2 QFM the T and H 2 O concentration in the melt phase diagram for the Kleivan granite may be derived from relevant experimental data depicting the cooling path of the successively more fractionated granite types. Restricted heat loss, high P and T and anomalously high H 2 O contents in the melt promote low viscosities (η 10 5 poise) during melt differentiation hence maintaining convection in the magma chamber. Convective motions enhance crystal transport towards the periphery and bottom of the chamber. Gravitational settling cannot explain the Kleivan zonation because the viscosity is too high even in these conditions. Downwards transport of refractory 1
103 crystals in the high velocity channels of the boundary layer, together with rising of melting points with pressure, favour accumulation of crystals at the bottom of the reservoir. Finally, the Kleivan zonation is the result of fractionation of refractory crystal-laden slurries from the hot convecting magma that settle at the base of the magma chamber in an upwards series of layers with gradually more evolved granitic compositions. Introduction In the Rogaland Igneous Province (RIP) of Southern Norway, massive anorogenic magmatism following the emplacement of the anorthositic rocks of the area generated numerous intrusions composing a charnockite (hyperstene) series. Monzonorite (jotunite), mangerite, quartz mangerite and charnockite granite are the main members of this rock suite and show characteristic geochemical features with high Fe/Fe+Mg, K 2 O/SiO 2 ratios, as well as high Ti and P contents. The proximal Kleivan granitic body, which is located further to the East features the same geochemical character and probably belongs to the charnockite series of the RIP (Petersen, 1980a). Major, trace and REE element evolution trends favour fractional crystallisation as the process responsible for the extreme differentiation of this granite (Petersen, 1980a, 1980b). The aim of this study is to demonstrate that the remarkable gradual zonation observed in the Kleivan granite from pyroxene- (charnockitic-) granite through hornblende-granite to biotite- and aplite-granite was caused by isobaric closed system differentiation of a H 2 O-rich melt at high T and P. This work is primarily based on new estimates of the H 2 O content in the progressively more differentiated melts of the Kleivan intrusion. Thermodynamic modelling of H 2 O-CO 2 fluids in equilibrium with granitic melts reveals that the original H 2 O content in the Kleivan parental melt ranges between 3.7 to 5.6 wt.%, which is much higher than previously estimated by Konnerup- Madsen (1979). This high H 2 O content in the melt is in agreement with recent studies of A-type magmas, whose H 2 O content varies from 2 to 6.5 wt.% (Clemens et al., 1986; Dall Agnol, 1999; King et al., 1997; Holtz et al., 2001; Klimm et al., 2003). Given this knowledge, the evolution of the H 2 O content during differentiation of the Kleivan melts allows us to determine the cooling path of the magmatic system by using petrographic observations and relevant experimental data. 2

.")
.")
104 Regional geology Fig 1: The Rogaland intrusive complex. Eg-Og, Egersund-Ogna Anorthosite; H-H, Håland-Helleren twin anorthosites; Å-S, Åna-Sira Anorthosite; E-R, Eia-Rekefjord intrusion; BKSK, Bjerkreim-Sokndal layered intrusion; QMG, Quartz-mangerite units above the BKSK intrusion; Apo, Apophysis intrusion; F, Farsund charnockite; K, Kleivan granite. L, Lyngdal granodiorite (HBG rock suite). Partially redrawn and modified from Duchesne and Michot (1984). The Rogaland-Vest Agder sector is the westernmost segment of the Precambrian basement of south Norway separated from the Telemark terrane to the east by the Mandal-Ustaoset fault zone and by the Norwegian Caledonides to the north. The basement is composed of banded granitic, migmatitic and augen gneisses related to the Sveconorwegian orogeny (Maijer, 1987). Numerous late to post-tectonic plutons intruded the Precambrian basement and can be divided into two main rock suites. One suite is the 930 Ma Anorthosite-Mangerite-Charnockite (AMCG) association of the Rogaland Igneous Province (Pasteels et al., 1979; Schärer et al., 1996). The other rock suite comprises a series of A-type hornblende- biotite-bearing granitoids (HBG) forming a north-south trending belt extending along the Mandal-Ustaoset line (Vander Auwera et al, 2003). These two suites are petrogenetically distinct and were generated by partial melting and differentiation of different sources: respectively a lower crustal anhydrous, gabbronoritic source for the AMCG rock series and a hydrous undepleted to 3
105 slightly depleted potassic mafic source for the HBG granitoids (Vander Auwera et al, 2003). The Kleivan body is located at the south eastern part of the Rogaland Igneous Province (Fig 1) and is separated from the Farsund charnockite by the large Lyngdal granodiorite body, which belongs to the HBG rock suite (Bogaerts et al., 2003; Vander Auwera et al., 2003). The Kleivan granite was first studied by Konnerup-Madsen (1977, 1979) and Petersen (1980a, 1980b) and represents together with the Farsund charnockite the felsic end-members of the AMCG suite of the Rogaland Igneous Province. The Kleivan granite experienced a rare magmatic differentiation characterised by the successive crystallisation of four distinctive granite types distinguished by their mafic minerals assemblage. A charnockitic (hypersthene-bearing) granite crystallised first in the north-western part of the intrusion, was followed by a hornblende-granite, subsequently a biotite-granite and finally a fine grained biotite-bearing aplite associated with pods of granitic pegmatite (Fig 2). Petrography of the Kleivan granite Pyroxene-granite (Px-g) This charnockitic granite is the most primitive rock in the Kleivan intrusion and is located in the north westernmost part of the massif. The mafic mineral assemblage comprises Fe-rich orthopyroxenes (charnockite granite), calcium-rich hornblendes (ferro-hastingsite) and opaque minerals (ilmenite/ti-magnetite). Clinopyroxene, apatite, zircon and calcite comprise the accessory mineral assemblage. Mafic minerals usually occur as crystals clusters, in which smaller grains of poikilitic apatite and zircon are unevenly distributed (Fig 3). Rare subhedral calcite grains are believed to be primary magmatic. The felsic assemblage consists of plagioclase (andesine), perthitic alkalifeldspars and quartz. The Px-granite has a modal Kfs/Plag ratio of about 1.2, with a Q: A: P ratio of 26:40:34 (Petersen, 1980). Hornblende-granite (Hbl-g) This type of granite typically occupies the central and north-eastern part of the pluton (Fig 2), with a transitional composition between the primitive pyroxene-granite and the more evolved biotite-granite in the southern part. The mafic assemblage comprises coarse-grained hornblende (hastingsite) and accessory biotite. Pyroxene is 4


106 absent and opaque minerals, apatite and zircon are less abundant. Allanite becomes prominent southwards. Hornblende disappear southwards at the expense of biotite, the rock showing a transitional assemblage of amphibole and biotite intergrowths. The feldspars are composed of more sodic plagioclases (oligoclase, An 26 ) and perthitic alkali-felspars. The hornblende-granite has a modal Kfs/Plag ratio of about 1.8, with a Q: A: P ratio of 28:46:26 (Petersen, 1980). The zoned Kleivan granite Fig 2: Geological map of the Kleivan granite with sample localities. The dotted lines mark the borders between different granite types defined by Petersen (1980). The solid arrow trending NNW-S from (charnockitic) pyroxene-granite to aplite-granite represents the differentiation trend throughout the Kleivan intrusion. 5

 occupies the northen part and features a brown pleochroism,")

.")
107 Biotite-granite (Bi-g) The biotite-granite occupies the southern part of the Kleivan intrusion. The modal proportion of biotite in the rock decreases progressively southwards, finally making up a few percents of the modal composition in the most evolved part. Based on the biotite pleochroism, two types of biotite-granites are defined. Biotite in the biotite1- granite (Fig 1, samples Bi-1, Bi-2) occupies the northen part and features a brown pleochroism, whereas in the southern part, biotite in the biotite2-granite (samples Bi-3, Bi-4, Bi-5) shows green pleochroism. The Bi-granite has a modal Kfs/Plag ratio of 2.7 with a Q:A:P ratio of 33:49:18, the feldspars being plagioclase (oligoclase An 18 ) and perthitic microcline (Petersen, 1980). Fig 3: Typical cluster of mafic minerals occurring in the pyroxene-granite composed of orthopyroxene (Opx), hornblende (Hbl), Ti-magnetite/ilmenite (Mag/Ilm), Apatite (Ap) and Zircon (Zr). Picture taken in polarized transmitted light. 6
108 Aplite-granite (Apl-g) The aplite-granite is located in the southernmost part of the Kleivan intrusion and defines the contact of the pluton towards the country rock gneisses. Accessory garnets and sillimanite were found in the aplite-granite. Sillimanite, not previously reported in this intrusion, occurs as spherulitic aggregates of euhedral slender fibers, hence is interpreted as a primary igneous phase. Finally, granitic pegmatites occur as pods and sheets intermingled with the aplite-granite and are particularly abundant in the roof pendant of the intrusion. Altogether, the zone that was denoted aplite-granite by Petersen (1980) is rather a zone that varies between aplitic, granitic and pegmatitic domains. The charnockite series of the upper part of the Bjerkreim- Sokndal intrusion New data are now available on the related charnockitic rocks of the uppermost part of the Bjerkreim-Sokndal (BKSK) intrusion, since the pioneering work of Konnerup-Madsen (1977, 1979) and Petersen (1980a, 1980b) on the Kleivan granite (Duchesne and Wilmart, 1997; Wilson and Overgaard, 2005; and references therein). Although their origin and petrogenesis is still subject to debate, a petrogenetic link by fractional crystallisation, plus assimilation of leucogranitic material, has been established between jotunitic and mangeritic liquids and the most evolved charnockites of the BKSK intrusion. On the basis of major elements, two distinctive series of intermixed intermediate to acidic liquids may be distinguished. The first one, called the main liquid line of descent (LLD) is derived from a jotunitic source and comprises jotunites (55 wt.% SiO 2 ), two-pyroxene quartz mangerites (63 wt.% SiO 2 ) and amphibole (hornblende) charnockites (71wt.% SiO 2 ). The second one, called the olivine-bearing acidic rock trend (OT) encompasses mangerites (58 wt.% SiO 2 ), quartz mangerites (64 wt.% SiO 2 ) and olivine charnockites (68 wt.% SiO 2 ) and starts with mangeritic melts. Rocks from the LLD suite can be distinguished from those of the OT series by higher TiO 2, P 2 O 5 and MgO and Sr contents (Duchesne and Wilmart, 1997). 7
109 Fig 4: a-e) Harker diagrams for selected bulk major elements. f) ASI (Aluminium Saturation Index) vs SiO 2 (wt.%). LLD and OT refer to the main liquid line of descent and the olivine-bearing acidic rock trend of the Bjerkreim-Sokndal intrusion, respectively (see text). Pyr, pyroxene-granite; Hbl, hornblende-granite; Bi, biotitegranite; Apl, aplite-granite; J, jotunite; PQM, two-pyroxene quartz mangerite; AC, amphibole charnockite; M, mangerite; OQM, olivine quartz mangerite; OC, olivine charnockite. Major elements in the two LLD and OT suites in BKSK and in the Kleivan granite series have been compared on Fig 4. The pyroxene-granite, which is the most primitive rock of the Kleivan intrusion contains about 66 wt.% SiO 2 and ranges between quartz mangeritic and charnockitic compositions of the BKSK intrusion. The hornblende-granite (71 wt.% SiO 2 ) has about the same silica content as the BKSK charnockites, whereas the biotite- and aplite- granites are the most silica-rich rocks (76 8
110 wt.% SiO 2 ). In the TiO 2, P 2 O 5, MgO and FeOt Harker diagrams (Fig 4a, 4b, 4c, 4d), the Kleivan granite series plots in continuation of the LLD and OL trends of the BKSK intrusions towards higher silica contents. CaO is slighty higher in the Kleivan pyroxenegranite but is similar to levels found in the BKSK intrusions for compositions richer in SiO 2. The Kleivan granite series has similar FeOt contents as the BKSK intrusions and intermediate MgO between the LLD and OT. The Kleivan pyroxene-granite has a metaluminous character equivalent to the BKSK charnockites (ASI 0.9), but the more evolved rocks of the Kleivan serie tend to more peraluminous trends (ASI>1.0). Similar petrography and major elements geochemistry between the primitive rocks of the Kleivan granite (pyroxene- and hornblende-granites) and the most evolved charnockitic rocks (quartz mangerites and charnockites) of the uppermost part of the BKSK intrusion suggest similar magmatic P, T, X, fo 2 conditions. Further changes in the P, T, X, fo 2 conditions prevailing during the last stages of differentiation of the Kleivan granite towards biotite- and aplite- granites will be discussed later in this paper. Temperature estimates in the Kleivan granite Pyroxene geothermometry Primary orthopyroxene accompanied with rare Ca-rich clinopyroxene (augite) were identified in the Kleivan pyroxene-granite. Some grains were analysed by EPMA (Appendix 1) in order to estimate the temperature of formation of these phases by using the geothermometer of Lindsley and Andersen (1983). Orthopyroxene is low in the wollastonite end member (Wo 2 wt.%), whereas clinopyroxene contains more than 40 wt.% Wo, corresponding to temperatures around T= C for iron-rich compositions at P=5 kbar. Similar low temperatures have been observed by Rietmeijer (1984) and Willmart and Duchesne (1987) in charnockitic rocks of the upper part of the BKSK intrusions for subsolidus requilibrated pyroxenes. However, higher magmatic temperatures around T= C were measured for pigeonites (Wilmart and Duchesne, 1987). Although probably similar to the magmatic temperatures of pyroxene formation in the BKSK charnockitic rocks, such temperatures cannot be obtained for the Kleivan granite due to extensive subsolidus requilibration between ortho- and clinopyroxenes. 9
111 Plagioclase-hornblende equilibrium temperature The formation temperature of the Kleivan pyroxene- and hornblende- granites was calculated using the geothermobarometer of Holland and Blundy (1994). This geothermobarometer is based on the Al IV content of amphiboles coexisting with plagioclases in silica oversaturated rocks. Its temperature dependence relies principally on the (Na -1 ) A (AlSi -1 ) T1 edenite exchange vector in amphiboles. The pressure required for the use of the geothermometer was estimated using the Al-in-hornblende geobarometer of Johnson and Ruthenford (1989) discussed before. Nevertheless, some precautions should be taken concerning the accuracy of this thermometer, as it also depends on the oxygen fugacity of the system. The uncertainty on the temperature estimate (±40 C) may be larger in the case of low fo 2, iron-rich amphiboles with oxidation states different from those of the calibration set, like those in the charnockitic rocks of this study (Holland and Blundy, 1994; Anderson and Smith 1995). Temperatures calculated with the geothermobarometer of Holland and Blundy (1994) range between 750 and 780 C with an average temperature of 760 C (±40 C), which corresponds to the average temperature of formation of the hornblende-bearing granite, i.e. the Px- and Hbl-granites in the northern part of the Kleivan intrusion. f O2 during differentiation of the intrusion Granites characterised by high whole rock XFe=Fe/Fe+Mg,(mol) and similar high XFe, low Fe 3+ /Fe total hastingsite amphiboles are typical of low oxygen fugacity crystallisation conditions (Anderson and Smith, 1995). In the Kleivan pyroxene- and hornblende-granite, XFe 0.85 in the whole rock, whereas XFe and Fe 3+ /Fe total in hastingsitic hornblende averages 0.84 and 0.15, respectively (Appendix 1). These values are similar to those measured in the Enchanted rocks batholith in the Llano uplift of central Texas, which formed at f O2 below the QFM buffer (Anderson and Smith, 1995). Duschesne (1972) determined an approximate temperature of T=750 C-800 C and a f O2 around (i.e slightly below the QFM buffer at T=750 C-800 C) for the quartz mangerites composing the upper part of the BKSK intrusion by using the T=F(f O2 ) thermometer of Buddington and Lindsley (1964) based on ilmenite and magnetite compositions at equilibrium conditions. Wilmart et al. (1991) suggested similar conditions, T=780 C±20 C and f O2 =10-15 (i.e. close to QFM buffer at T=780 C±20 C) by application of the Andersen and Lindsley (1985) Ti-magnetite/ilmenite geothermeter and oxygen barometer to the quartz mangerite of the BKSK intrusion. These 10
112 considerations suggest that f O2 was likely around the QFM buffer during emplacement of the primitive part of the Kleivan granite. Fluids present during formation of the Kleivan granite CO 2 -rich, CO 2 -H 2 O and H 2 O fluid inclusions have been reported in quartz of the Kleivan granite (Konnerud-Madsen, 1977, 1979). H 2 O inclusions most likely represent fluids present at a post-magmatic stage of fracturing and healing and seem not to be related to the primary cooling history of the Kleivan granite. On the contrary, there is a close association of CO 2 -rich and CO 2 -H 2 O inclusions and the presence of pyroxene and/or hornblende in the granite. From north to south, which is roughly the differentiation trend of the Kleivan body, a gradual decrease of the number of CO 2 inclusions and appearance of CO 2 -H 2 O inclusions is observed parallel to the evolution from pyroxene- to hornblende-granite. At the transition between hornblende-and biotitegranite, CO 2 -bearing inclusions disappear and only H 2 O inclusions are present in the biotite-granite (Fig 5). CO 2 -bearing inclusions are supposed to represent the earliest fluids trapped in quartz, at a stage before complete crystallisation of the magma (Konnerup-Madsen, 1977, 1979). The abundance of CO 2 -rich inclusions in the primitive charnockitic granite and the occasional presence of calcite grains in some of the samples, support the probable magmatic origin of carbon in the rock. CO 2 of magmatic origin is also observed in the earliest fluid inclusions in quartz of quartz mangerite and charnockite samples from the Bjerkreim-Sokndal massif (Wilmart et al., 1991) in the Rogaland Igneous Province. The pressure and temperature calculated in this study by geobarothermometry are consistent with the P, T estimated from fluid inclusion compositions (Konnerup- Madsen, 1977, 1979), in which the isochores for two coexisting magmatic CO 2 -rich and CO 2 -H 2 O fluids in quartz intersect at conditions of final solidification around P=5-6 kbar and T=700 C to 800 C. To explain the origin of formation of CO 2 -rich and CO 2 - H 2 O fluids in the Kleivan granite, Konnerud-Madsen (1979) suggests a dehydration process by leakage of hydrogen from the CO 2 -H 2 O inclusions, which led to the formation of CO 2 -rich inclusions. He also suggests the more likely replacement of pyroxene by amphibole as the dehydration reaction responsible for the CO 2 enrichment in some fluid inclusions. Besides, the presence of these two distinctive fluid compositions may also represent a fluid evolution by compositional changes of a single CO 2 fluid towards H 2 O-rich compositions. 11
113 Fig 5: Distribution of fluid inclusions within the Kleivan pyroxene-, hornblende-, and biotite-granites (Konnerup-Madsen, 1977). See text for explanations. Evolution of the melt water content during differentiation The following calculations and discussion is entirely based on the composition of the isolated CO 2 -H 2 O fluid inclusions trapped in quartz belonging to the Kleivan pyroxene- and hornblende-granite that are assumed to have magmatic origin. These inclusions show rather consistent characteristics and are composed of 76±9 mole % H 2 O, 22±9 mole% CO 2 and the possible presence of less than 2 mole % CH 4 ±CO (Konnerup-Madsen, 1977, 1979). 12
114 H 2 O-CO 2 solubility in silicate melt - vapour systems The system composition (melt + vapour) regarding the H 2 O and CO 2 components, neglecting the CH 4 /CO component of the vapour, can be calculated with VOLATILECALC (algorithm written in Visual Basic for Excel, Newman & Lowenstern, 2002), a silicate melt-h 2 O-CO 2 solution model, which is based primarily on the thermodynamic model initially developed by Silver and Stolper (1985) and applied to rhyolite by Silver (1988). The calculate vapour isopleths option allows the user to estimate the melt composition (wt.% H 2 O and ppm CO 2 dissolved in the melt) for a specified pressure, temperature and vapour compositions (wt.% H 2 O and ppm CO 2 in the vapour). For the Kleivan hornblende-granite, at P=5kbar and T=760 C and for a vapour composition X H2O =76±9 (mol) and X CO2 =24±9 (mol), about 10.1±1.0 wt.% H 2 O and 1100±400 ppm CO 2 are dissolved in the melt at equilibrium conditions. VOLATILECALC solubility calculations are based on the solubility experimental data of Blank et al. (1993) estimated for pressures up to 3kbar. Therefore caution is recommended in using the model at high pressure, as the solubility of H 2 O in silicate melts for pressures >3kbars is not known precisely. The discrepancies from extrapolation of low pressure results to higher pressures come from the variations with 0, melt pressure of the molar volume of H 2 O in the melt ( V ), which is supposed to be independent of pressure in the equation describing the equilibrium of H 2 O between the melt and the vapour (Silver and Stolper, 1985; Silver, 1988). H 2 O fugacities in the vapour were calculated according to the modified Redlich-Kwong equations of Kerrick and Jacobs (1981). CO 2 solubility calculations are based on experimental work by Blank et al. (1993). Both H 2 O and CO 2 are assumed to dissolve in the melt independently from each other s concentration. H 2O At P=5kbar and T=800 C for a composition close to the minimum composition in the haplogranite system, the solubility of H 2 O in the melt is around 10 wt.% (Holtz et al., 1992). Therefore we may assume from the previous calculations that the melt becomes saturated in water at a stage close to the transition between hornblende-and biotite-granite during differentiation of the Kleivan granite. From that stage, second boiling of the melt might be responsible for the total disappearance of CO 2 in the vapor by strong dilution with a H 2 O-rich fluid. Fluid circulation will also be enhanced by the important amounts of fluid exsolving from the melt that will favour the mobilisation and escape of CO 2, which is more volatile than H 2 O (due to its bigger molar volume). 13
115 Mass balance relations and differentiation models In rocks series developed by fractional crystallisation, least squares petrographic mixing calculations using the average compositions of the fractionated crystal phases and of the parent and daughter rocks gives an estimate of the weight fraction of the cumulates F (or the residual melt fraction, 1-F) assuming the following relation between them: wt.% = Fwt.% + (1 F) wt.% (1) parent i cumulate i res. melt i Petersen (1980a) used equation (1), based on the average major elements compositions of the pyroxene-, hornblende-, and biotite-granites, to estimate the weight and composition of the successive cumulate fractions extracted from the evolving melt to produce the differentiation pattern of the Kleivan melt. Petersen assumed that the parental melt had a charnockitic composition equivalent to the average pyroxenegranite. Successive fractionation of about F0=10 wt.% of a noritic cumulate, F1=20 wt.% of a monzonitic cumulate, and F2=30 wt.% of a granitic cumulate is necessary for the melt to evolve from charnockitic to aplitic composition. However, this model assumes cumulates of noritic and monzonitic composition, although such cumulate types are absent in the otherwise well exposed Kleivan rocks. Therefore, the restitic material extracted from the differentiating melt should rather be considered to be the four granite types composing the Kleivan body, successively fractionating to produce more evolved and water rich residual melts. This would explain why the layering is so hard to identify in the field. Although the successive granite types can be distinguished by distinctive mafic minerals, no sharp transition, cryptic or modal layering is present. Given the weight fractions of each successive fractionated granite type, the weight proportions of hydrous minerals in each granite and the H 2 O content of the hydrous phases, then the H 2 O content in the melt at any stage of the differentiation may be calculated. The calculations use mass balance equations for a closed system, assuming that the H 2 O content in the residual melt equals the parent H 2 O content substracted from H 2 O fixed by hydrous phases. In the case of the Kleivan granite, the following relation may be formulated to calculate the parent H 2 O content. init Pyr g Hbl g Bio g Apl g wt.% H 2 O = F0 wt.% H 2O + F1 wt.% H 2O + F2wt.% H 2O + F3 wt.% H 2O (2) 14
116 where F0, F1, F2, F3 are the weight fractions of pyroxene- (Pyr-), hornblende- (Hbl-), biotite- (Bio-), and aplite- (Apl-) granite (g) respectively and j wt H 2O.% is the weight percent of H 2 O in rock type j. Mass balance considerations can also be expressed for each of the four stages of magmatic differentiation in terms of parent-residual melt relationships as follow: wt.% = (3) par. melt fract. g res. melt H 2 O Fwt.% H 2O + (1 F) wt.% H 2O where the H 2 O contained in the parent melt (par.melt) is distributed amongst the hydrous phases of the fractionated granite (fract.g) and the residual melt (res.melt). Equation (3) applied to the two first evolutionary stages of the Kleivan melt gives: wt.% wt.% par. melt Pyr g res. melt1 H 2 O = F0 wt.% H 2O + (1 F0 ) wt.% H 2O res. melt1 Hbl g res. melt 2 H 2 O = F1 wt.% H 2O + (1 F1 ) wt.% H 2O (4) (5) where res.melt1 and res.melt2 correspond to the residual melt after fractionation of the pyroxene- and hornblende-granites, respectively. Accordingly, it is then possible to calculate the H 2 O content in res.melt1 and par.melt knowing the H 2 O content in res. melt 2 res.melt2 ( wt.% = ). H 2 O ± Volume fractions of the different granite types The principal source of error in the following calculations comes from the volume estimates of each granite type constituting the Kleivan body that are based on field observations. The exact boundary between different Kleivan granite types cannot be precisely defined geographically given the gradual compositional evolution from one granite type to the other throughout the whole Kleivan body. However, surface transitional contours can be outlined by estimating the modal proportions of the main ferromagnesian phases in the rock. Petersen (1980) defined six domains corresponding to different granite types, by looking at the modal proportions of pyroxene, hornblende and biotite in the granite (Fig 2). When compared to the topography, most of the layer contacts are perpendicular to the contour lines indicating that the layering is near vertical and that the magma chamber has been tilted to an almost horizontal position during exhumation of the Kleivan body. Post magmatic deformation is probably responsible for the bend of the northern primitive part of the pluton relative to the 15
117 average north-south trending line of the intrusion. Accordingly, the actual outcrop would approximately represent a vertical cross section through the Kleivan magma chamber. A line of differentiation from primitive charnockitic to evolved aplitic composition can be drawn perpendicular to the successive contours separating the different granite types, its length roughly corresponding to the original height of the magma chamber. Assuming this configuration, the relative volume proportions of the different Kleivan granite types can be assessed from the relative areas of the granites as outlined on the geological map of Petersen (1980). As a rough estimate, we may assume that the magma chamber at the time of crystallisation was a 7km high and 3km wide box composed of 21% of pyroxene-granite, 43% of hornblende-granite, 34% of biotitegranite and 2% of aplite-granite, in volume proportions. Melt water contents calculations Average modal compositions of the pyroxene- and hornblende- granites have been estimated by Petersen (1980) from petrographic observations of a large collection of samples. The total amount of pyroxene plus hornblende averages 8.0±3.6wt.% in the pyroxene-granite and that of hornblende and biotite 5.1±2.0wt.% in the hornblendegranite (Petersen, 1980). Complementary observations of the samples of this study reveal that hornblende represents about 50±10% (50±10% X 8.0±3.6 wt.% 4.0±2.2 wt.%) out of the total hornblende + pyroxene content in the pyroxene-granite, whereas around 80±10% (80±10% X 5.1±2.0 wt.% 4.1±1.7 wt.%) of hornblende composes the total hornblende + biotite amount in the hornblende-granite (Appendix 2). EPMA analysis of amphibole and biotite allow for calculating the H 2 O content of amphibole and biotite by knowing the F and Cl content in these minerals (Tindle and Webb, 1994). Hornblende and biotite contain about 1.6 wt.% H 2 O and 3.6 wt.% H 2 O, respectively (Appendix 1) and their H 2 O content is calculated by multiplying the wt.% of hornblende and biotite in the rock by and 0.036, respectively. The results of the calculations of the H 2 O content in the residual melt1 (res.melt1) and parent melt (par.melt) are summarized in Table 1. Minimum and maximum melt H 2 O contents have been estimated by considering the following uncertainties on the different input parameters: F 0 =0.21±10%, F 1 =0.43±10%, Pyr g Hbl g Hbl g 1.8< wt.% =4<7.0, 2.2< wt.% =4.1<6.4, 0.3< wt.% =1.0<2.1, Hbl wt =10.6±10%.. 2.% res melt H 2O Hbl Bio 16
118 F 0 F 1 wt.% Pyr g Hbl wt.% Hbl g Hbl wt.% Hbl g Bio wt. 2.% res melt H 2O wt. 1.% res melt H 2O wt.% par. melt H 2O average min max Table 1: Results of calculation of the H 2 O content in the residual melt1 (res.melt1) and in the parent melt (par.melt). Average values (average) are calculated from the average value of the input parameters. Uncertainties are given by the minimum (min) and maximum (max) values. The pyroxene- and hornblende-granite volume fractions (F 0, F 1 ), the H 2 O content in residual melt2 ( wt. 2.% res melt H 2O ) and the amount of hydrous phases in the granites Pyr, Hbl g ( wt.% ) in that order are the most important factors influencing the H 2 O content Hbl, Bio calculations. From the above calculations, it can be inferred that the residual melt1 at the transition between the pyroxene- and hornblende- granite contained about 5.8±1 wt.% H 2 O and that the H 2 O content in the initial Kleivan forming melt was about 4.6±1 wt.%. Evolution of the H 2 O-CO 2 composition in the melt + vapour system Variations of the H 2 O (wt.%), CO 2 (ppm) content in the melt as well as the H 2 O- CO 2 composition (XH 2 O) of the immiscible fluid in equilibrium with the Kleivan melt are depicted on Fig 6. The CO 2 (ppm) content in the melt decreases from about 2500 ppm to 200 ppm, while the water content in the melt increases from 4.6 wt.% in the par.melt to 10.1 wt.% in res.melt2 when water saturation of the melt is obtained. Consequently, the H 2 O content in the fluid in equilibrium with the melt will also increase and its composition will vary from X H2O =0.29, to X H2O =0.39 and to X H2O =0.76, respectively in the par.melt, res.melt1 and res.melt2. If we consider the likely evolution towards lower pressure at the time of formation of the biotite- and aplite-granites, this fluid will be even richer in water. Indeed, assuming that the pressure at emplacement is around 4 kbar, which corresponds to a difference of vertical thickness in the magma chamber of around 4.4 km for a granitic melt with a density of 2300 kg/m 3, the fluid becomes almost pure H 2 O (X H2O =0.96 at T=700 C), which is in agreement with 17
119 Konnerup-Madsen (1977, 1979) fluid inclusions observations in this part of the intrusion. Fig 6: Evolution of the H 2 O-CO 2 distribution between melt and vapour during differentiation of the Kleivan magma. Dotted lines represents 5 kbar isobars at T=700 C, 800 C, 900 C, the dot and dash line marks the 4 kbar isobar at T=700 C. Data were acquired with VOLATILECALC (Newman and Lowenstern, 2002). Cooling path during differentiation of the Kleivan granite Assuming a constant pressure of 5 kbar, an oxygen fugacity at the QFM level and closed system magmatic differentiation during crystallisation of the Kleivan granite, melt we may attempt to define the cooling path of the differentiating melt in a T- wt.% H 2 diagram by using petrographic and petrological observations and relevant experimental data obtained for similar P, fo 2, X conditions. Several experimental studies have been done with granitic compositions in equilibrium with a H 2 O-CO 2 fluid at both water undersaturated and water saturated conditions at P 5 kbar and varying fo 2. Thus, Whitney (1975, 1988) and Naney (1983) studied granitic to tonalitic compositions at P=2kbar and P=8kbar at oxidizing conditions (fo 2 NNO buffer) in equilibrium with a pure H 2 O fluid at saturated and undersaturated conditions. Clemens and Wall (1981) studied the phase relations for a peraluminous (S-type) granite at P=5kbar, fo 2 in the QFM to QFM-0.5 range at water undersaturated conditions (H 2 O-CO 2 fluid, between 2 and 9 wt.% H 2 O in the melt), and Scaillet et al. (1995) studied the Manaslu biotite- O 18
120 bearing and the Gangotri tourmaline-bearing peraluminous leucogranites at P=4kbar, fo 2 around QFM-0.5 and water undersaturated conditions (H 2 O-CO 2 fluid, between 2 and 10 wt.% H 2 O in the melt). Finally, Dall Agnol et al. (1999) determined the phase relations for the A-type Jamon hornblende biotite monzogranite at P=3kbar and water undersaturated conditions (H 2 O-CO 2 fluid, between 2 and 8 wt.% H 2 O in the melt) for two different fo 2 at QFM-0.5 and NNO+2.5. Each of the four factors P, wt.% 2, fo 2 and dry composition controls the final melt/mineral assemblage at equilibrium in the system at a defined T. The H 2 O solubility in a silicate melt is mostly dependent on the pressure of the system and roughly varies from 4 to 13 wt.% H 2 O with increasing pressure from 1 to 8 kbar at T=800 C for a composition (Qz 28 Ab 38 Or 34 ) close to the eutectics or thermal minima in the haplogranitic H 2 O-Qz-Or-Ab system (Holtz et al., 1995). The fo 2 and dry composition determine the stability of different crystalline phases in equilibrium with the melt at defined P, T and wt.% H 2 O in the melt. melt H O Phase diagram for the Kleivan granite The A-type Jamon hornblende biotite monzogranite (adamellite-charnockite) has a composition intermediate between the Kleivan pyroxene- and hornblende- granites (See in Dall Agnol, 1999). However, the average iron-magnesium ratio in the pyroxenehornblende Kleivan granite (X Fe =0.85, mol) is slightly higher than that of the experimental glass derived from the Jamon hornblende biotite monzogranite (X Fe =0.75,mol). This, as well as the pressure difference between the two granites ( 3 and 5 kbar for the Jamon and Kleivan granites, respectively) might cause small thermal discrepancies in evaluating the stability domains of crystalline phases. Still, phase relations for the Kleivan granite can be assessed relatively confidently from the phase relations established for the Jamon granite composition by Dall Agnol (1999) at fo 2 =QFM

121 Fig 7: Kleivan phase stability diagram T vs. (wt.% H 2 O in the melt) at P=5kbar and fo 2 =QFM-0.5. Blue arrows indicate the cooling paths of the pyroxene (Pyr)-, hornblende (Hbl)-, biotite (Bi)- and aplite (Apl)-granites stable at higher H 2 O contents in the melt and lower temperatures, respectively. The different stability domains of the granites are marked by isopleths corresponding to the H 2 O content in the melt calculated for the par.melt, res.melt1 and res.melt2. See text for explanations about the diagram construction. The hypothetical phase stability diagram for the Kleivan granite, which is further discussed below is represented on Fig 7. At 5kbar, the solidus and water saturation curves were determined as a function of T and wt.% 2 from experimental results obtained on the haplogranitic (Qz-Or-Ab) system with various H 2 O activities (Holtz et al., 1992, 1995). Most of the Kleivan samples plot in the low thermal valley close to the cotectic curve separating quartz from alkali feldspars in the haplogranitic system, regardless of the H 2 O content of the melt (Fig 6 in Jacamon and Larsen, in review). Therefore, we may consider quartz and alkali-feldspars to be cotectic phases, hence crystallising at the same interval of temperature. The liquidus curve for the cotectic quartz-alkali feldspar assemblage was determined from the Kleivan granite melt H O 20
122 compositions projected to the haplogranitic system for various H 2 O contents in the melt. A more thorough discussion about quartz formation temperatures in the Kleivan granite is addressed by Jacamon and Larsen (in review). The stability domains for hornblende and orthopyroxene are larger at 8 kbar than at 2 kbar in the experiments of Naney (1983). In the Jamon granite at fo 2 =QFM-0.5, hornblende is only stable for H 2 O content in the melt >4 wt.% and the thermal stability of hornblende is only slightly melt dependent on the H 2 O content in the melt between 4 and 8 wt.% H 2 O. For wt.% H 2O >4, hornblende is stable from T 800 C down to the solidus temperature (Fig 3b in Dall Agnol et al.,1999). From these observations, we extended the upper thermal limit of hornblende to T=850 C and maintained the lower thermal limit defined by the solidus curve for the Kleivan granite at P=5kbar. We infer that hornblende is stable at H 2 O contents in the melt of 4 to 10 wt.%, i.e. up to vapor saturation conditions. On the other hand, the stability domain of orthopyroxene at 3 kbar for the Jamon granite (Dall Agnol et al.,1999) extends for H 2 O content of the melt of 5 wt.% (or even below) and 8 wt.% (vapor saturation curve) at T>750 C (Fig 3b in Dall Agnol et al.,1999). At 5kbar, we may assume the lower thermal limit of orthopyroxene to be roughly the same as the one at 3 kbar extending the solidus curve at T=750 C (5 wt.% H 2 O in the melt) to the vapor saturation curve at T=850 C (10.5wt.% H 2 O in the melt). The position of the biotite saturation curve is not particularly pressure dependent at 2 to 8 kbar and biotite is usually stable from T= C to the solidus of the system. In some experiments, the upper thermal limit of the biotite stability domain is relatively constant and seems to be only slightly dependent of the H 2 O content of the melt (Naney, 1983; Clemens et al., 1981; Scaillet et al., Manaslu leucogranite, 1995). Other experiments show that biotite is only stable at high temperatures for low H 2 O contents of the melt (Scaillet et al., Gangotri leucogranite, 1995; Dall Agnol et al., 1999). For the Kleivan granite, we maintain the biotite saturation curve estimated for the Jamon granite, which extends from T=880 C for 2 wt.% H 2 O in the melt down to T=730 C at vapor saturation conditions. We suppose the saturation curve of clinopyroxene to be similar for the Kleivan and the Jamon granite (Dall Agnol et al., 1999) and extended it to the vapor saturation curve at 5kbar. The plagioclase saturation curve has been drawn from plagioclase compositions in the pyroxene- (X An =32-35), hornblende- (X An 26) and biotite- (X An =15-18) granites determined by Petersen (1980a, 1980b) according to the plagioclase stability diagram in Fig 4a of Dall Agnol et al. (1999). The liquidus curve for the primitive Kleivan granite may be estimated from apatite and zircon saturation temperatures. Large euhedral grains of apatite, zircon, and oxide minerals form clusters of mafic minerals together with orthopyroxene, amphibole and biotite. They are usually 21
123 randomly distributed in poikilitic grains of orthopyroxene and hornblende suggesting the early crystallisation of these phases. In the Jamon granite, the saturation temperature for apatite and zircon was 850 C and 800 C respectively (Dall Agnol et al., 1999). In quartz mangerite and amphibole charnockite samples of the BKSK intrusion, zircon and apatite saturation were obtained at temperatures around 900 C (Duchesne and Wilmart, 1997). According to these data and petrographic observations, it is likely that apatite, zircon and ilmenite/magnetite represent the liquidus mineral assemblage in the Kleivan parent melt, and we may assume that beginning of crystallisation started around 900 C. At the transition between pyroxene- and hornblende-granites, most apatite, zircon, oxide minerals and pyroxene have already crystallised and hornblende represents the main liquidus phase in the residual melt. Therefore an arbitral liquidus temperature around 840 C for residual melt1 (5.8 wt.% H 2 O in the melt) may be established. At the transition between hornblende- and biotite-granite at water saturation conditions, biotite is the main mafic phase composing only a few wt.% of the granite composition. The granitic melt is chiefly composed of Qz+Or+Ab and the liquidus temperature can be determined from liquidus phase relations in the haplogranite system at 5 kbar, ah 2 O=1 (Holtz et al., 1992). Liquidus phase relations for the Kleivan granite in the haplogranite system at ah 2 O=0.4, ah 2 O=0.6 and ah 2 O=1 are discussed in details by Jacamon and Larsen (in review). The liquidus temperature at the hornblende-/biotite-granite transition averages 700 C. The aplite-granite, which has a composition close to the eutectic composition of the haplogranite system at water saturation conditions, suggests formation at even lower temperatures i.e. 650 C. Sequence of crystallisation Fig 8 illustrates the mineral sequence of crystallisation in the Kleivan granites series as a function of decreasing temperature deduced from the experimental phase relations and petrographical observations. Liquidus minerals, which are most abundant in the pyroxene-granite are apatite, oxides, pyroxene and calcic plagioclase (X An =32-35) and began to form at 900 C. At lower temperatures and higher water contents in the melt, hornblende became the dominant ferromagnesian phase in the hornblende-granite at the expense of pyroxene. Hornblende is overtaken by biotite when the melt becomes saturated in water around 700 C. This transition from hornblende to biotite may be the result of an increase of the fo 2 due to both the progressive disappearance of ilmenite/magnetite and the abundance of H 2 O in the system at that stage of differentiation. Indeed, in the case of the Jamon granite study (Dall Agnol et al., 1999), 22


124 hornblende is not stable anymore at water saturated conditions for temperatures T<700 C, when the fo 2 increases from the NNO-1.5 (QFM-.5) to the NNO+2.5 buffer. Quartz and alkali feldspar terminate the sequence of crystallisation. They begin to crystallise around 800 C in the most primitive granite and around 650 C in the most evolved aplite-granite (Jacamon and Larsen, in review). Fig 8: Sequence of crystallization for the Kleivan granite. Mineral abbreviations: Ilm, ilmenite; Mag, magnetite; Zr, zircon; Ap, apatite; Opx, orthopyroxene; Cpx, clinopyroxene; Plg, plagioclase; Hbl, hornblende; Bio, biotite; Qz, quartz; Kfs, alkali feldspar. Melt differentiation and granite fractionation Given that the Kleivan parental magma consist of a homogeneous H 2 O-rich granitic melt that was emplaced at 5kbar and 900 C, the petrological parameters responsible for the gradual zonation produced during cooling and solidification may be approximated. The parameters under considerations include viscosity, density, gravitational settling of crystalline phases, and magma convection. 23
125 Melt viscosity The viscosity of hydrous haplogranitic melts has been experimentally studied by Schulze et al. (1996). Temperature and the H 2 O content of the melt are by far the most important parameters. Both increasing the temperature and H 2 O content of the melt significantly decreases the viscosity of a haplogranitic melt. Schulze et al. (1996) established empirical equations allowing for the calculation of the viscosity of a haplogranitic melt at different P, T and H 2 O conditions. Fig 9 shows variations in the viscosity (η) of the Kleivan magma as a function of T and the H 2 O content. The viscosity of the evolving Kleivan magma is roughly constant around 10 5 poise (10 poise =1 Pa.s) throughout the solidification process, in that the H 2 O enrichment in the melt compensate for the effects of decreasing the temperature during melt differentiation from the parent stage (T=900 C, 4.6 wt.% H 2 O in the melt) to biotite-granite formation (T=700 C, 10.1 wt.% H 2 O in the melt). However, the viscosity strongly depends on the crystal/melt ratio and the inherent rheological constraints of the melt and increases several orders of magnitude once crystallisation begins. This effect is discussed later. Fig 9: Evolution of the viscosity (η) of the Kleivan magma during differentiation (solid arrow connecting stars). The dashed curves represent the variation of the log η as a function of the water content in the Qz 38 Ab 38 Or 34 haplogranitic melt at fixed temperature. Data are extrapolated from Schulze et al. (1996) assuming an Arrhenian expression of the viscosity. 24
126 Melt density The knowledge of the partial molar volumes, thermal expansion and compressibility coefficients of all oxide components is required to calculate the density of hydrous granitic melts (equation and data in Lange and Carmichael, 1990). Temperature has little influence on the density of hydrous melts at a given H 2 O content, whereas melt density increases with increasing pressure. However, the molar volume of water has the most important effect on the density of granitic melts, especially at H 2 O- rich conditions. The partial molar volume of water highly depends on the speciation of water in the melt, which itself depends on the dry composition of the granitic melt (Silver and Stolper, 1985; Silver et al., 1990). The partial molar volume of water (VH 2 O) is about cm 3 /mol for the Qz 28 Ab 38 Or 34 haplogranite melt (Holtz et al., 1995). At 5 kbar, the density of the Kleivan granitic melt averages 2300 kg/m 3, assuming a composition close to that of the Qz 28 Ab 38 Or 34 haplogranite melt, between 4 and 10 wt.% H 2 O in the melt, and VH 2 O =11 cm 3 /mol. Gravitational settling The rate at which a crystal sinks or floats depends on the difference between the buoyant force caused by the density contrast between the crystal and the magma ( Δ ρ = l ρ s ρ ) and the viscous drag of the liquid of definite viscosity (η) on the crystal. The settling velocity (Vs) resulting from these two counteracting forces is given by the Stokes law: Vs = dz / dt = 2gΔρr 9η 2 where g is the acceleration of gravity, and r is the radius of a spherical crystal. This law is only valid for laminar flows with Reynolds numbers <1, which is usually the case for most geological cases. If we apply the Stokes law to find out how far the cm-large (r=0.005m) refractory mafic mineral clusters with an average density of ρ 4000 kg/m 3 might have sunk in the residual melt of density ρ 2300 kg/m 3 and viscosity η =10 5 poise (=10 4 Pa.s), we obtain a settling velocity around Vs =300 m/year. This is a significant settling velocity and only a few tens years are sufficient for the ferromagnesian clusters to sink to the floor of the 7000 m high Kleivan magma chamber. However, the Stokes law is only relevant for fluids with a Newtonian 25
127 behaviour. It does not account for the likely deviation towards pseudoplastic or Bingham behaviour imparting a yield strength to the melt that needs to be overcome before settling occurs. McBirney and Noyes (1979) noticed that cooling magmas become non-newtonian liquids once they have reached their crystallisation range gaining a significant yield strength that increases with falling temperature, especially at the time of pyroxene and plagioclase crystallisation. Therefore crystals would need to grow larger before they begin to sink, and gravitational settling is restricted to high temperature melts with a Newtonian behaviour and containing a low fraction of suspended crystals. Magma convection Along the vertical country rock contact of a magmatic chamber, the heat loss creates a temperature gradient across a thermal boundary layer developed between the hot inner magma and the colder country rock. As the melt contracts at low temperature, a density gradient will form in the thermal boundary layer in response to the temperature gradient, with denser liquids located towards the contact. The system becomes gravitationally instable and the dense magma near the margin sinks, while the hotter magma in the centre rises, thus creating a convection cell. In order to assess the vertical velocity of the sinking melt in the thermal boundary layer, the effect on melt viscosity of temperature and of the advance of crystallisation must be considered. The increase of crystal density in the magma will impart a yield strength to the magma that will curb the offset of convection. Spera et al. (1982) calculated the velocity profile in the thermal boundary layer of a silicic magma chamber whose temperature is maintained constant by the intrusion of mafic magma at its base. They used a rheological law of the form: η = η exp [ a( T T )] where η and T represent the viscosity of the melt at liquidus temperature and the liquidus temperature of the melt, respectively. The rheological parameter a is a sensitivity factor of η on temperature, which is a complicated function of the crystal/melt ratio, the size and the distribution of crystals. Furthermore, it depends on the cooling rate, the melt composition and the local deformation rate (references in Spera et al., 1982). For a wet rhyolitic melt containing 3.5 wt.% H 2 O with η =10 6 poise and a =0.06, Spera et al. (1982) calculated a maximum vertical velocity of about Vc =12 km/year in a 20m wide boundary layer. Within the boundary layer, the region of 26
128 downwelling flow is displaced meters away from the contact due the high viscosity of the magma close to the wall. While η increases during cooling and advance of crystallisation in the magma chamber, the thickness of the boundary layer increases and the vertical velocity decreases. For a magma viscosity η =10 9 poise, the boundary layer becomes 90m wide and the vertical velocity drops to 0.5 km/year (Spera et al., 1982). Important for the Kleivan melt, the downward convecting velocity of the magma caused by the thermal difference between the intruded magma and its host rock is orders of magnitude greater than the rate at which crystals will sink in a silicic magma by gravitational settling. Accordingly, crystals will be pulled towards the bottom of the magma chamber rather than passive gravitational sinking. If a horizontal layer with the thickness d is considered, with bottom and top surfaces at constant temperature of T1 and T2, and T1>T2, the ratio of the buoyancy force driving convection to the viscous force resisting fluid movement is given by the dimensionless thermal Rayleigh number: Ra = ρgα( T1 T 2) d η K T 3 where ρ is the density of the melt, g is the acceleration of gravity, is the coefficient of thermal expansion (K -1 ), K T is the thermal diffusivity (m 2 s -1 ), and η is the viscosityof the melt. Convection is initiated within the magma layer when Ra is above a critical value (Ra c ) around 10 3 depending on the specific boundary conditions (Huppert and Sparks, 1984). Provided a magma chamber with a large dimension, even a high viscosity dry rhyolitic melt (η Poise) will convect. In the 7000 m high Kleivan magma chamber filled with a parent melt having a density ρ 2300 kg/m 3 and a viscosity η =10 5 poise, and using g =9.81 ms -2, = K -1, K T =10-6 m 2 s -1, the Rayleigh number would be Ra (T1-T2). Consequently, with only a fraction of a degree difference in temperature between the top and the base of the Kleivan melt reservoir, the Rayleigh number would exceed the critical value and convection would occur. Therefore, if convection is vigorous enough in the magma chamber, like it is suggested by the high Rayleigh number of the Kleivan system (Ra >>Ra c 10 3 ), we may assume that the temperature is roughly uniform throughout the convective body. 27
129 Formation of the Kleivan granite Because of the high viscosity of granitic melts, it is unlikely that gravitational settling is the responsible process for the mineralogical zonation observed throughout the Kleivan granite. High water contents in the melt are insufficient to balance the increase of the viscosity and yield strength of the melt at the beginning of crystallisation. The maximum settling velocity (Vs 300m/year) calculated for a liquid Newtonian melt is still much lower than the velocity of convective motions within the thermal boundary layer that develop at the margins of the magma chamber (Vc =12 km/year). On the contrary, large scale convection inside the magma chamber can explain the mobility and redistribution of refractory crystals towards outer parts of the convecting system, where the velocity is highest. Therefore, newly formed crystals can be rapidly transported to the bottom of the chamber inside the high velocity channels of the thermal boundary layer. Furthermore, the melting point of most minerals rises with increasing pressure implying that crystallisation will essentially take place near the base of the reservoir in regions of greater pressure and will progress from base to top in the magma chamber. The accumulation at the bottom of the chamber of both allochthonous crystals transported in downwelling flows and autochthonous crystals generates more and more viscous melt + suspended crystals slurries at the base of the convecting magma. The resulting gradient of viscosity towards the bottom of the magma chamber is also enhanced by the upwards exsolution of immiscible volatiles in the hot, light, melt with further cooling and melt differentiation. While solidification progresses at the bottom of the convecting magma, the crystal-rich viscous material resists the forces of convection until the rheological critical melt fraction (RCMF) is attained, beyond which convection ceases. The RCMF, below which the mush of melt + suspended crystals becomes gravitationally stable, is estimated to be between 25 and 40% (Arzi, 1978; Van der Molen and Paterson, 1979). With further cooling and upwards crystallisation, convection becomes restricted to higher levels in the magma reservoir. The volume and vigour of the convecting body will be progressively reduced, until convection terminates once the last fraction of melt reaches the RCMF. For the solidifying Kleivan granitic magma, we may assume that the RCMF of the melt will be attained roughly when quartz and alkali feldspar begin to crystallise as these two minerals constitute at least 60% of the normative composition. Therefore, for a defined P and H 2 O content in the melt, the liquidus temperature of the Qz +Akfs cotective curve will approximately represent the temperature at the border between the hot convecting magma and the immobile slurry of melt + crystals (Fig 10). 28


130 Fig 10: sequence of formation of the Kleivan granite with progressive cooling in the magma chamber. Dotted lines represent the borders between the different granite types. Red curves define the thermal boundary layer (not at scale) forming along margins and separating the hot convecting magma in the core from the viscous fractionated material accumulating at the bottom and margins of the reservoir. 29
PETROGENESIS OF A SERIES OF MAFIC SHEETS WITHIN THE VINALHAVEN PLUTON, VINALHAVEN ISLAND, MAINE
 PETROGENESIS OF A SERIES OF MAFIC SHEETS WITHIN THE VINALHAVEN PLUTON, VINALHAVEN ISLAND, MAINE DANIEL HAWKINS Western Kentucky University Research Advisor: Andrew Wulff INTRODUCTION Round Point, in the
Chapter - IV PETROGRAPHY. Petrographic studies are an integral part of any structural or petrological studies in
 Chapter - IV PETROGRAPHY 4.1. Introduction Petrographic studies are an integral part of any structural or petrological studies in identifying the mineral assemblages, assigning nomenclature and identifying
Igneous and Metamorphic Rock Forming Minerals. Department of Geology Mr. Victor Tibane SGM 210_2013
 Igneous and Metamorphic Rock Forming Minerals Department of Geology Mr. Victor Tibane 1 SGM 210_2013 Grotzinger Jordan Understanding Earth Sixth Edition Chapter 4: IGNEOUS ROCKS Solids from Melts 2011
Igneous petrology EOSC 321
 Igneous petrology EOSC 321 Laboratory 2: Determination of plagioclase composition. Mafic and intermediate plutonic rocks Learning Goals. After this Lab, you should be able: Determine plagioclase composition
Earth Science 232 Petrography
 Earth Science 232 Petrography Course notes by Shaun Frape and Alec Blyth Winter 2002 1 Petrology - Introduction Some Definitions Petra Greek for rock Logos Greek for disclosure or explanation Petrology
QUARTZ AND GARNET CHEMISTRY OF SOUTH NORWEGIAN PEGMATITES AND ITS IMPLICATIONS FOR PEGMATITE GENESIS
 QUARTZ AND GARNET CHEMISTRY OF SOUTH NORWEGIAN PEGMATITES AND ITS IMPLICATIONS Axel Müller 1 Peter M. Ihlen 1 Rune B. Larsen 2 John Spratt 3 Reimar Seltmann 3 1 Geological Survey of Norway, 7491 Trondheim,
This work follows the international standard nomenclature (IUGS) in naming the
 in naming the") CHAPTER FIVE: PETROGRAPHY This work follows the international standard nomenclature (IUGS) in naming the different Platreef rock types. It should be noted that new lithologies not described in chapter
CHAPTER FIVE: PETROGRAPHY This work follows the international standard nomenclature (IUGS) in naming the different Platreef rock types. It should be noted that new lithologies not described in chapter
GLY 155 Introduction to Physical Geology, W. Altermann. Grotzinger Jordan. Understanding Earth. Sixth Edition
 Grotzinger Jordan Understanding Earth Sixth Edition Chapter 4: IGNEOUS ROCKS Solids from Melts 2011 by W. H. Freeman and Company Chapter 4: Igneous Rocks: Solids from Melts 1 About Igneous Rocks Igneous
Lorence G. Collins. July 9, 1997
 1 ISSN 1526-5757 20. FAILURE OF THE EXSOLUTION SILICA-PUMP MODEL FOR THE ORIGIN OF MYRMEKITE: EXAMINATION OF K-FELDSPAR CRYSTALS IN THE SHARPNERS POND TONALITE, MASSACHUSETTS, USA Introduction Lorence
Imagine the first rock and the cycles that it has been through.
 A rock is a naturally formed, consolidated material usually composed of grains of one or more minerals The rock cycle shows how one type of rocky material gets transformed into another The Rock Cycle Representation
Essentials of Geology, 11e
 Essentials of Geology, 11e Igneous Rocks and Intrusive Activity Chapter 3 Instructor Jennifer Barson Spokane Falls Community College Geology 101 Stanley Hatfield Southwestern Illinois College Characteristics
Engineering Geology ECIV 2204
 Engineering Geology ECIV 2204 Instructor : Dr. Jehad Hamad 2017-2016 Chapter (3) Igneous Rocks Chapter 3: Rocks: Materials of the Solid Earth Igneous Rocks Chapter 3: Rocks: Materials of the Solid Earth
Block: Igneous Rocks. From this list, select the terms which answer the following questions.
 Geology 12 Name: Mix and Match: Igneous Rocks Refer to the following list. Block: porphyritic volatiles mafic glassy magma mixing concordant discontinuous reaction series igneous vesicular partial melting
Mechanisms of metamorphism and metasomatism on the local mineral scale : The role of dissolution-reprecipitation during mineral re-equilibration
 Chapter 5 Mechanisms of metamorphism and metasomatism on the local mineral scale : The role of dissolution-reprecipitation during mineral re-equilibration Andrew Putnis & Håkon Austrheim Equilibration
Fluorine and Chlorine in Alkaline Rocks and A-type Granites
 Fluorine and Chlorine in Alkaline Rocks and A-type Granites Using the fluorine and chlorine content of Amphibole, Apatite and Biotite to monitor magma halogen content Chilwa Province, Malawi, and Carboniferous
9/4/2015. Feldspars White, pink, variable Clays White perfect Quartz Colourless, white, red, None
 ENGINEERING GEOLOGY Chapter 1.0: Introduction to engineering geology Chapter 2.0: Rock classification Igneous rocks Sedimentary rocks Metamorphic rocks Chapter 3.0: Weathering & soils Chapter 4.0: Geological
Feldspars. Structure. The feldspars are by far the most abundant group of minerals and are found in igneous, metamorphic and many sedimentary rocks.
 Feldspars The feldspars are by far the most abundant group of minerals and are found in igneous, metamorphic and many sedimentary rocks. Structure Felsdpars are framework silicates where each silica tetrahedra
TWO COMPONENT (BINARY) PHASE DIAGRAMS. Experimental Determination of 2-Component Phase Diagrams
 PHASE DIAGRAMS. Experimental Determination of 2-Component Phase Diagrams") Page 1 of 12 EENS 211 Earth Materials Tulane University Prof. Stephen A. Nelson TWO COMPONENT (BINARY) PHASE DIAGRAMS This document last updated on 08-Oct-2003 Experimental Determination of 2-Component
Page 1 of 12 EENS 211 Earth Materials Tulane University Prof. Stephen A. Nelson TWO COMPONENT (BINARY) PHASE DIAGRAMS This document last updated on 08-Oct-2003 Experimental Determination of 2-Component
Igneous Rock Classification, Processes and Identification Physical Geology GEOL 100
 Igneous Rock Classification, Processes and Identification Physical Geology GEOL 100 Ray Rector - Instructor Major Concepts 1) Igneous rocks form directly from the crystallization of a magma or lava 2)
Mildly peraluminous high-silica granites in the central part of the Oslo graben. In: Andersen T. (1996): Eurogranites-1996, Field Guide
: Eurogranites-1996, Field Guide") Mildly peraluminous high-silica granites in the central part of the Oslo graben. In: Andersen T. (1996): Eurogranites-1996, Field Guide R.G. Trønnes (largely from Trønnes and Brandon, 1992) Introduction
Mildly peraluminous high-silica granites in the central part of the Oslo graben. In: Andersen T. (1996): Eurogranites-1996, Field Guide R.G. Trønnes (largely from Trønnes and Brandon, 1992) Introduction
23/9/2013 ENGINEERING GEOLOGY. Chapter 2: Rock classification:
 ENGINEERING GEOLOGY Chapter 2: Rock classification: ENGINEERING GEOLOGY Chapter 1.0: Introduction to engineering geology Chapter 2.0: Rock classification Igneous rocks Sedimentary rocks Metamorphic rocks
EESC 4701: Igneous and Metamorphic Petrology IGNEOUS ROCK CLASSIFICATION LAB 2 HANDOUT
 EESC 4701: Igneous and Metamorphic Petrology IGNEOUS ROCK CLASSIFICATION LAB 2 HANDOUT Sources: University of Washington, Texas A&M University, University of Southern Alabama What is an igneous rock (a
Name Class Date STUDY GUIDE FOR CONTENT MASTERY
 Igneous Rocks What are igneous rocks? In your textbook, read about the nature of igneous rocks. Use each of the terms below just once to complete the following statements. extrusive igneous rock intrusive
Textures of Igneous Rocks
 Page 1 of 6 EENS 212 Prof. Stephen A. Nelson Petrology Tulane University This document last updated on 12-Feb-2004 Introduction to Igneous Rocks An igneous rock is any crystalline or glassy rock that forms
Petrogenetic Constraints at Mount Rainier Volcano, Washington
 Petrogenetic Constraints at Mount Rainier Volcano, Washington S. C. Kuehn and P. R. Hooper, Department of Geology, Washington State University, Pullman, WA A. E. Eggers and C. Kerrick, Department of Geology,
EARTH SCIENCE. Geology, the Environment and the Universe. Chapter 5: Igneous Rocks
 EARTH SCIENCE Geology, the Environment and the Universe Chapter 5: Igneous Rocks CHAPTER 5 Igneous Rocks Section 5.1 What are igneous rocks? Section 5.2 Classification of Igneous Rocks Click a hyperlink
Plate tectonics, rock cycle
 Dikes, Antarctica Rock Cycle Plate tectonics, rock cycle The Rock Cycle A rock is a naturally formed, consolidated material usually composed of grains of one or more minerals The rock cycle shows how one
Chapter IV MINERAL CHEMISTRY
 Chapter IV MINERAL CHEMISTRY Chapter-IV MINERAL CHEMISTRY 4.1 INTRODUCTION In this chapter, chemical analyses of different minerals present in various rocks of Mashhad granitoid plutons have been presented.
2. REPLACEMENT OF PRIMARY PLAGIOCLASE BY SECONDARY K-FELDSPAR AND MYRMEKITE
 1 ISSN 1526-5757 2. REPLACEMENT OF PRIMARY PLAGIOCLASE BY SECONDARY K-FELDSPAR AND MYRMEKITE Lorence G. Collins email: lorencec@sysmatrix.net November 21, 1996; revised February 17, 1997 The following
MACRORYTHMIC GABBRO TO GRANITE CYCLES OF CLAM COVE VINALHAVEN INTRUSION, MAINE
 MACRORYTHMIC GABBRO TO GRANITE CYCLES OF CLAM COVE VINALHAVEN INTRUSION, MAINE NICK CUBA Amherst College Sponsor: Peter Crowley INTRODUCTION The rocks of the layered gabbro-diorite unit of the Silurian
Metcalf and Buck. GSA Data Repository
 GSA Data Repository 2015035 Metcalf and Buck Figure DR1. Secondary ionization mass-spectrometry U-Pb zircon geochronology plots for data collected on two samples of Wilson Ridge plutonic rocks. Data presented
Breeding et al., Data Repository Material Figure DR1. Athens. Study Area
 Breeding, Ague, and Brocker 1 Figure DR1 21 o 24 Greece o A 38 o Athens Tinos 37 o Syros Attic-Cycladic Blueschist Belt Syros Kampos B Study Area Ermoupoli N Vari Unit Cycladic HP-LT Unit Marble horizons
Name Class Date STUDY GUIDE FOR CONTENT MASTERY
 Igneous Rocks What are igneous rocks? In your textbook, read about the nature of igneous rocks. Use each of the terms below just once to complete the following statements. extrusive igneous rock intrusive
About Earth Materials
 Grotzinger Jordan Understanding Earth Sixth Edition Chapter 3: EARTH MATERIALS Minerals and Rocks 2011 by W. H. Freeman and Company About Earth Materials All Earth materials are composed of atoms bound
Lab 4 - Identification of Igneous Rocks
 Lab 4 - Identification of Igneous Rocks Page - Introduction A rock is a substance made up of one or more different minerals. Thus an essential part of rock identification is the ability to correctly recognize
Lecture 6 - Igneous Rocks and Volcanoes
 Lecture 6 - Igneous Rocks and Volcanoes Learning objectives Understand and be able to predict where and why magma will be forming at different tectonic settings Understand the factors controlling magma
Classification of Igneous Rocks
 Classification of Igneous Rocks Textures: Glassy- no crystals formed Aphanitic- crystals too small to see by eye Phaneritic- can see the constituent minerals Fine grained- < 1 mm diameter Medium grained-
Textural Terms in Igneous Petrology
 Textural Terms in Igneous Petrology Adcumulate - Cumulus crystals continue to grow and displace the intercumulus liquid. Example: Opx adcumulate texture with minor interstitial chromite and plagioclase
Exam I. 1. (10 points) Give the following optical properties for the minerals listed below.
 Give the following optical properties for the minerals listed below.") GLY306 Petrology Exam I 1. (10 points) Give the following optical properties for the minerals listed below. Color/pleochroism Extinction angle Cleavage angle Twining Refractive index Hornblende Plagioclase
GLY306 Petrology Exam I 1. (10 points) Give the following optical properties for the minerals listed below. Color/pleochroism Extinction angle Cleavage angle Twining Refractive index Hornblende Plagioclase
GEOL 2312 Igneous and Metamorphic Petrology Spring 2016 Score / 58. Midterm 1 Chapters 1-10
 GEOL 2312 Igneous and Metamorphic Petrology Name KEY Spring 2016 Score / 58 Midterm 1 Chapters 1-10 1) Name two things that petrologists want to know about magmas (1 pt) Formation, source, composition,
The granites of the Mykle region in the southern part of the Oslo igneous province, Norway
 NGU-BULL 441, 2003 - PAGE 17 The granites of the Mykle region in the southern part of the Oslo igneous province, Norway Bonin, B. & Sørensen, H. 2003: The granites of the Mykle region in the southern part
PLATE TECTONICS, VOLCANISM AND IGNEOUS ROCKS
 PLATE TECTONICS, VOLCANISM AND IGNEOUS ROCKS PLATE TECTONICS TO IGNEOUS ROCKS Internal Heat Seafloor Spreading/Plate Tectonics Volcanism Plate Boundary Intra-plate (hot spot) Divergent Convergent Igneous
GEOLOGY. Subject : GEOLOGY (For under graduate student.) Paper No. : Paper 02 Introduction to Geology 02
 Paper No. : Paper 02 Introduction to Geology 02") GEOLOGY Subject : GEOLOGY (For under graduate student.) Paper No. : Paper 02 Introduction to Geology 02 Topic No. & Title : 37 Magma Bowen Series (Part 01) Academic Script What is Igneous Petrology? Igneous
GEOLOGY Subject : GEOLOGY (For under graduate student.) Paper No. : Paper 02 Introduction to Geology 02 Topic No. & Title : 37 Magma Bowen Series (Part 01) Academic Script What is Igneous Petrology? Igneous
FIELD AND MICROSTRUCTURAL ANALYSIS OF A DIKE SWARM AND A DEFORMED COMPOSITE DIKE IN THE VINALHAVEN INTRUSIVE COMPLEX, MAINE
 FIELD AND MICROSTRUCTURAL ANALYSIS OF A DIKE SWARM AND A DEFORMED COMPOSITE DIKE IN THE VINALHAVEN INTRUSIVE COMPLEX, MAINE OWEN MCKENNA Bowdoin College Sponsor: Rachel Beane INTRODUCTION The Vinalhaven
Research area: Genesis of industrially applicable high purity quartz in igneous and metamorphic environments
 Research area: Genesis of industrially applicable high purity quartz in igneous and metamorphic environments Supervisors: Rune B. Larsen, Objective Our primary goal is to study the element exchange processes
Uniaxial Minerals Descriptions
 Uniaxial Minerals Descriptions Look at 6 uniaxial minerals Quartz Nepheline Calcite Apatite Tourmaline Zircon Examine composition, relief, colour, form, cleavage, twinning, birefringence, occurrence Quartz
Chapter 4 8/27/2013. Igneous Rocks. and Intrusive Igneous Activity. Introduction. The Properties and Behavior of Magma and Lava
 Introduction Chapter 4 Igneous rocks form by the cooling of magma (or lava). Large parts of the continents and all the oceanic crust are composed of. and Intrusive Igneous Activity The Properties and Behavior
Lab 3 - Identification of Igneous Rocks
 Lab 3 - Identification of Igneous Rocks Page - 1 Introduction A rock is a substance made up of one or more different minerals. Thus an essential part of rock identification is the ability to correctly
Classification and Origin of Granites. A Multi-faceted Question
 Classification and Origin of Granites A Multi-faceted Question What is a granite? IUGS classification Based on Modal Mineralogy Plutonic rock with less than 90% mafic minerals Alkali Granite Granite Quartz
A Rock is a solid aggregate of minerals.
 Quartz A Rock is a solid aggregate of minerals. Orthoclase Feldspar Plagioclase Feldspar Biotite Four different minerals are obvious in this piece of Granite. The average automobile contains: Minerals
Chapter 4 Rocks & Igneous Rocks
 Chapter 4 Rocks & Igneous Rocks Rock Definition A naturally occurring consolidated mixture of one or more minerals e.g, marble, granite, sandstone, limestone Rock Definition Must naturally occur in nature,
FACTS FOR DIAMOND OCCURRENCE IN KIMBERLITES
 KIMBERLITES Kimberlite is an ultrabasic olivine-rich igneous rock called peridotite. Peridotites occur at great depths in the earth in a layer called the mantle (100-135 miles below the surface). At this
PETROGENESIS OF A GRANITE XENOLITH IN THE 1.1 GA MIDCONTINENT RIFT AT SILVER BAY, MN
 PETROGEESIS OF A GRAITE XEOLITH I THE 1.1 GA MIDCOTIET RIFT AT SILVER BAY, M ATALIE JUDA Macalester College Sponsor: Karl Wirth ITRODUCTIO Much of the study of the orth American 1.1 Ga Keweenawan Midcontinent
GSA Data Repository: Three styles of diamond resorption in a single kimberlite
 GSA Data Repository 2017286 Fedortchouk et al., 2017, Three styles of diamond resorption in a single kimberlite: Effects of volcanic degassing and assimilation: Geology, doi:10.1130/g39066.1. 1 2 3 4 5
IGNEOUS ROCKS. SECTION 5.1 What are igneous rocks?
 Date Period Name IGNEOUS ROCKS SECTION.1 What are igneous rocks? In your textbook, read about the nature of igneous rocks. Use each of the terms below just once to complete the following statements. basaltic
Geochemical controls on high-grade grade gold mineralisation at the Junction lode-gold deposit, Kambalda, WA
 Geochemical controls on high-grade grade gold mineralisation at the Junction lode-gold deposit, Kambalda, WA Kate Moran Geology Honours 2003 Supervisors Steffen Hagemann (UWA, pmd*crc) Peter Neumayr (UWA,
Lithology: Olivine-rich gabbro medium grained Observer: Texture: granular Ave. grain size: medium grained [345] Shape Habit Comments
![Lithology: Olivine-rich gabbro medium grained Observer: Texture: granular Ave. grain size: medium grained [345] Shape Habit Comments](/thumbs/93/113706868.jpg "Lithology: Olivine-rich gabbro medium grained Observer: Texture: granular Ave. grain size: medium grained [345] Shape Habit Comments") THIN SECTION LABEL ID: 179-1105A-1R-2-W 88/91-TSB-TSS Piece no.: #02 TS no.: Igneous Medium-grained olivine gabbronorite; plagioclase chadacryst within orthopyroxene oikocryst; rims of olivine and clinopyroxene
THIN SECTION LABEL ID: 179-1105A-1R-2-W 88/91-TSB-TSS Piece no.: #02 TS no.: Igneous Medium-grained olivine gabbronorite; plagioclase chadacryst within orthopyroxene oikocryst; rims of olivine and clinopyroxene
The Rock Cycle The Rock Cycle illustrates the origin of igneous, sedimentary and metamorphic rocks
 The Rock Cycle The Rock Cycle illustrates the origin of igneous, sedimentary and metamorphic rocks Igneous rocks form as molten magma or lava cools and solidifies. Magma is completely or partly molten
Interpreting Phase Diagrams
 Interpreting Phase Diagrams Understanding chemical reactions requires that we know something about how materials behave as the temperature and pressure change. For a single component (like quartz or ice)
Hadean diamonds in zircon from Jack Hills, Western Australia
 Hadean diamonds in zircon from Jack Hills, Western Australia Martina Menneken 1, Alexander A. Nemchin 2, Thorsten Geisler 1, Robert T. Pidgeon 2 & Simon A. Wilde 2 1 Institut fur Mineralogie, WestfalischeWilhelms-Universitat,
Igneous petrology EOSC 321 Laboratory 1: Ultramafic plutonic and volcanic rocks
 1 Igneous petrology EOSC 321 Laboratory 1: Ultramafic plutonic and volcanic rocks Material Needed: a) Microscope, b) Glossary of rock names and textures (see Pages 24-25 and 43 of Winter); c) Lab1 Manual
DIFFERENTIATION OF MAGMAS BY FRACTIONAL CRYSTALLIZATION THE M&M MAGMA CHAMBER
 Geol 2312 Igneous and Metamorphic Petrology Spring 2009 Name DIFFERENTIATION OF MAGMAS BY FRACTIONAL CRYSTALLIZATION THE M&M MAGMA CHAMBER Objective: This exercise is intended to improve understanding
Rocks: Materials of the Solid Earth
 1 Rocks: Materials of the Solid Earth Presentation modified from: Instructor Resource Center on CD-ROM, Foundations of Earth Science,, 4 th Edition, Lutgens/Tarbuck, Rock Cycle Igneous Rocks Today 2 Rock
WAMUNYU EDWARD MUREITHI I13/2358/2007
 WAMUNYU EDWARD MUREITHI I13/2358/2007 Olkaria geothermal area is situated south of Lake Naivasha on the floor of the southern segment of the Kenya rift. The geology of the Olkaria Geothermal area is subdivided
Earth Science 11: Minerals
 lname: Date: Earth Science 11: Minerals Purpose: Text Pages: I can identify and classify minerals using their physical and chemical properties 90-111 *This is recommended reading! Matter and Atoms (5.1)
24. MAGMATIC RESORPTION VERSUS SUBSOLIDUS METASOMATISM --- TWO DIFFERENT STYLES OF K- FELDSPAR REPLACEMENT OF PLAGIOCLASE
 1 ISSN 1526-5757 24. MAGMATIC RESORPTION VERSUS SUBSOLIDUS METASOMATISM --- TWO DIFFERENT STYLES OF K- FELDSPAR REPLACEMENT OF PLAGIOCLASE Lorence G. Collins email: lorencec@sysmatrix.net October 17, 1997
The 3 types of rocks:
 Igneous Rocks and Intrusive Igneous Activity The 3 types of rocks:! Sedimentary! Igneous! Metamorphic Marble 1 10/7/15 SEDIMENTARY ROCKS Come from rocks sediments (rock fragments, sand, silt, etc.) Fossils
GY303 Igneous & Metamorphic Petrology. Lecture 7: Magma Sources and Tectonic Environments
 GY303 Igneous & Metamorphic Petrology Lecture 7: Magma Sources and Tectonic Environments Factors controlling Magma production Source rock composition Amount of fluids, especially H 2 O Pressure (Depth)
EPS 50 Lab 2: Igneous Rocks Grotzinger and Jordan, Chapter 4
 Name: EPS 50 Lab 2: Igneous Rocks Grotzinger and Jordan, Chapter 4 Introduction In the previous lab, we learned about mineral characteristics, properties and identities as well as the three basic rock
LAB 9: ULTRAMAFIC ROCKS, CUMULATES AND MELT SOURCES
 Geology 316 (Petrology) (03/26/2012) Name LAB 9: ULTRAMAFIC ROCKS, CUMULATES AND MELT SOURCES INTRODUCTION Ultramafic rocks are igneous rocks containing less than 10% felsic minerals (quartz + feldspars
predictive mineral discovery*cooperative Research Centre A legacy for mineral exploration science Mineral Systems Q3 Fluid reservoirs
 Mineral Systems Q3 Fluid reservoirs 1 Key Parameter Mineral System Exploration is reflected in scale-dependent translation A. Gradient in hydraulic potential B. Permeability C. Solubility sensitivity to
Igneous Rocks. Sedimentary Rocks. Metamorphic Rocks
 Name: Date: Igneous Rocks Igneous rocks form from the solidification of magma either below (intrusive igneous rocks) or above (extrusive igneous rocks) the Earth s surface. For example, the igneous rock
7. K-DIFFERENTIATION BY MAGMATIC AND METASOMATIC PROCESSES
 1 ISSN 1526-5757 7. K-DIFFERENTIATION BY MAGMATIC AND METASOMATIC PROCESSES Lorence G. Collins email: lorencec@sysmatrix.net February 3, 1997 The granitic crust began to form about 2.5 billion years ago
Supplementary Table 1.
 Supplementary Table 1. Compositional groups, typical sample numbers and location with their bulk compositional, mineralogical and petrographic characteristics at different metamorphic grades. Metamorphic
10/20/2015. How is magma different from lava? Magma is molten rock below the Earth s surface. Lava is magma that flows out onto Earth s surface.
 Chapter 5 What are igneous rocks? How do they form? Igneous rocks are rocks that form when molten material cools and crystallizes. Molten material can be either magma or lava. How is magma different from
Unit 2 Exam: Rocks & Minerals
 Name: Date: 1. Base your answer(s) to the following question(s) on the 2001 edition of the Earth Science Reference Tables, the map and cross section below, and your knowledge of Earth science. The shaded
The Nature of Igneous Rocks
 The Nature of Igneous Rocks Form from Magma Hot, partially molten mixture of solid liquid and gas Mineral crystals form in the magma making a crystal slush Gases - H 2 O, CO 2, etc. - are dissolved in
PHY120AExam questions 0.5 points each; 19 True/False, 31 Multiple Choice
 1 PHY120AExam 1 2018 50 questions 0.5 points each; 19 True/False, 31 Multiple Choice True/False Indicate whether the statement is true or false. F 1. The distribution of volcanoes is random.. F 2. The
PETROGENESIS OF ENCLAVES WITHIN THE PEGGY S COVE MONZOGRANITE, SOUTHERN NOVA SCOTIA, CANADA
 PETROGENESIS OF ENCLAVES WITHIN THE PEGGY S COVE MONZOGRANITE, SOUTHERN NOVA SCOTIA, CANADA HINA IMTIAZ Trinity University Research Advisor: Dr. Benjamin Surpless INTRODUCTION The Canadian province of
Student Name: College: Grade:
 Student Name: College: Grade: Physical Geology Laboratory IGNEOUS MINERALS AND ROCKS IDENTIFICATION - INTRODUCTION & PURPOSE: In this lab you will learn to identify igneous rocks in hand samples from their
Objectives of this Lab. Introduction. The Petrographic Microscope
 Geological Sciences 101 Lab #9 Introduction to Petrology Objectives of this Lab 1. Understand how the minerals and textures of rocks reflect the processes by which they were formed. 2. Understand how rocks
V. B. NAUMOV 1, V. A. KOVALENKER 2 and V. L. RUSINOV 2
 CHEMICAL COMPOSITION, TRACE ELEMENTS, AND VOLATILE COMPONENTS OF MELTS: EVIDENCE FROM INCLUSIONS IN THE MINERALS OF NEOVOLCANITES FROM THE CENTRAL AND EASTERN SLOVAKIA V. B. NAUMOV 1, V. A. KOVALENKER
Rocks and the Rock Cycle notes from the textbook, integrated with original contributions
 Rocks and the Rock Cycle notes from the textbook, integrated with original contributions Alessandro Grippo, Ph.D. Gneiss (a metamorphic rock) from Catalina Island, California Alessandro Grippo review Rocks
Lecture 3 Rocks and the Rock Cycle Dr. Shwan Omar
 Rocks A naturally occurring aggregate of one or more minerals (e.g., granite), or a body of non-crystalline material (e.g., obsidian glass), or of solid organic material (e.g., coal). Rock Cycle A sequence
Laboratory 7: Alkaline rocks
 Laboratory 7: Alkaline rocks Learning Goals. After this Lab, you should be able: Identify the key rock-forming minerals in alkaline rocks Identify textures of alkaline rocks in thin sections Name alkaline
12. MYRMEKITE IN THE SANTA ROSA MYLONITE ZONE, PALM SPRINGS, CALIFORNIA
 1 ISSN 1526-5757 12. MYRMEKITE IN THE SANTA ROSA MYLONITE ZONE, PALM SPRINGS, CALIFORNIA Lorence G. Collins email: lorencec@sysmatrix.net February 15, 1997 Introduction Myrmekite, containing tiny quartz
How 2 nd half labs will work
 How 2 nd half labs will work Continue to use your mineral identification skills Learn to describe, classify, interpret rock hand samples: Igneous sedimentary metamorphic volcanic plutonic (1 week) (1 wk)
High-T T heating stage: : application for igneous petrogenesis and mantle processes - melt inclusions as key tools -
 High-T T heating stage: : application for igneous petrogenesis and mantle processes - melt inclusions as key tools - SZABÓ, Csaba Lithosphere Fluid Research Lab (LRG), Department of Petrology and Geochemistry,
A Brief Review of the Geology of Monhegan Island, Maine
 Maine Geologic Facts and Localities April, 2010 A Brief Review of the Geology of Monhegan Island, Maine 43 45 58.95 N, 69 18 47.45 W Text by R. G. Marvinney, Department of Agriculture, Conservation & Forestry
Igneous petrology EOSC 321
 Igneous petrology EOSC 321 Laboratory 5: Conoscopy. Felsic plutonic rocks Learning Goals. After this Lab, you should be able: Use conoscopic obervations to determine the uniaxial or biaxial character of
Soil Mechanics/Geotechnical Engineering I Prof. Dilip Kumar Baidya Department of Civil Engineering Indian Institute of Technology, Kharagpur
 Soil Mechanics/Geotechnical Engineering I Prof. Dilip Kumar Baidya Department of Civil Engineering Indian Institute of Technology, Kharagpur Lecture - 01 Rock Cycle Good morning. I welcome you to this
42. A study of intergrowth textures and their possible origins in the Alvand plutonic complex, Hamadan, Iran
 1 ISSN 1526-5757 42. A study of intergrowth textures and their possible origins in the Alvand plutonic complex, Hamadan, Iran Abstract Ali A. Sepahi and Lorence G. Collins April 5, 2002 Various types of
High-T heating stage: application for igneous petrogenesis and mantle processes - melt inclusions as key tools -
 High-T heating stage: application for igneous petrogenesis and mantle processes - melt inclusions as key tools - SZABÓ, Csaba Lithosphere Fluid Research Lab (LRG), Department of Petrology and Geochemistry,
Name Class Date. In your textbook, read about the nature of igneous rocks. Use each of the terms below just once to complete the following statements.
 CHAPTER 5 Igneous Rocks SECTION 5.1 What are igneous rocks? In your textbook, read about the nature of igneous rocks. Use each of the terms below just once to complete the following statements. basaltic
Appendix 11. Geology. of the. I60 area
 Appendix 11 Geology of the I60 area 1. Locality The locality of the I60 area is as follows; Northwestern corner; UTM_EW 530513, UTM_NS 7345741 Southwestern corner; UTM_EW 530418, UTM_NS 7301454 Northeastern
Carbonatites to Alkali Granites Petrogenetic Insights from the Chilwa and Monteregian Hills-White Mountain Igneous Provinces
 Carbonatites to Alkali Granites Petrogenetic Insights from the Chilwa and Monteregian Hills-White Mountain Igneous Provinces G. Nelson Eby Department of Environmental, Earth, & Atmospheric Sciences University
Metamorphic Petrology GLY 262 Lecture 3: An introduction to metamorphism (II)
") Metamorphic Petrology GLY 262 Lecture 3: An introduction to metamorphism (II) Metamorphic processes Metamorphism is very complex and involves a large number of chemical and physical processes occurring
Metamorphic Petrology GLY 262 Lecture 3: An introduction to metamorphism (II) Metamorphic processes Metamorphism is very complex and involves a large number of chemical and physical processes occurring
Igneous Rocks. Definition of Igneous Rocks. Igneous rocks form from cooling and crystallization of molten rock- magma
 Igneous Rocks Definition of Igneous Rocks Igneous rocks form from cooling and crystallization of molten rock- magma Magma molten rock within the Earth Lava molten rock on the Earth s s surface Igneous
Lecture part 60% Tests: 1st: Topic 1-3 (20%) 2nd: Topic 4-9 (20%) 3rd: Topic (20%) Final: all
 2nd: Topic 4-9 (20%) 3rd: Topic (20%) Final: all") Igneous and metamorphic petrology 1. Fundamentals 2. Classification 3. Thermodynamics and kinetics Igneous 4. Silicate melts and fluids 5. Crystal melt equilibria 6. Chemical dynamics of melts and crystals
Igneous and metamorphic petrology 1. Fundamentals 2. Classification 3. Thermodynamics and kinetics Igneous 4. Silicate melts and fluids 5. Crystal melt equilibria 6. Chemical dynamics of melts and crystals
Evolution of the Earth
 Evolution of the Earth http://static.newworldencyclopedia.org/f/fe/geologic_clock.jpg Evolution of the Earth Solar system, 4.6 byr Collapse of a nebula Star forms as gravity concentrates material at center