Analysing changes in features and landscapes:
|
|
|
- Elijah Rich
- 5 years ago
- Views:
Transcription
1 Analysing changes in features and landscapes: This activity will guide you through the process of map regression in an urban area. Map regression is the study of a sequence of maps to reveal changes in individual features and the landscapes you can find them in. It s a useful way for archaeologists to study changes in the landscape maps can act as a historical record and can help provide information on potential archaeological sites. Maps not only show these landscape changes and potentially when these changes happened, they can also show what features are important to map makers at that time. For example, Thomson s 1832 map focuses on the main features and places of importance of an area, whereas the Ordnance Survey maps give a lot of detail on individual field boundaries. Both of these aspects of the maps are associated with historical events at that time. One thing you need to try and remember is who created the map. A map maker will have a purpose for producing that particular map and it s important that you understand why the map is being made and who the main audience was. Sometimes a map maker will not show a feature because it s not important to the map s purpose. For example, if a map is being made to show safe harbour areas, upland agricultural areas are not relevant. However, even though the upland agricultural areas aren t shown on the map doesn t mean they didn t exist! In this activity, you will also learn how to choose the right information from historic maps which are relevant to what you re researching and how to record and present your findings. To guide you through the process of map regression there are three case studies: rural (online) urban (PDF) industrial (PDF) Work through the urban case study on the following pages. 1

2 Step 1: What question do you want to answer? Before you start looking at historical maps, it s a good idea to identify what information you need to find out. You should start by asking these questions: Why are you looking at these maps? What question is it that you want to answer? Starting with a question will help you stay focused while looking at a series of historic maps and it will help you identify what aspects of the map you need to pay attention to. Your question could be when did Dundee Bleachworks go out of use? or perhaps you even want to start with a more general question, like how has this landscape changed within the last 200 years? Case Study - Dundee Bleachworks A local history group have been researching the former bleachworks industry along the Dighty River in Dundee. They are particularly interested in one site called Dundee Bleachworks as they believe parts of it still survives. They want to find out more about the Bleachworks and the development of the general area. The group would like to answer How has the site of Dundee Bleachworks developed? What features might still survive today? 2


3 Step 2: Choose the limits of your study area? Although it might be interesting to find out as much as possible about your local area, it will be easier to answer your main question by setting a study area boundary. Your study area boundary should include the features you are interested in and some useful landmark points such as buildings prominent natural features or place names. Although we have used a historical map here, you might find it easier starting with a modern map on which you can trace your study area boundary. Case Study - Dundee Bleachworks For their study area, the group have chosen to include the bleachworks together with some associated features like the drying grounds and bleaching green. By including these features, the group believe it will answer their main questions. The study area will also help them work out what maps they need. 3

4 Step 3: Identify your landscape reference points? Identify two to three fixed landscape reference points which will help pinpoint your location as you make your way through the historical maps. Be careful not to pick obvious reference points though! For example, a supermarket from the 1990s is not going to be found on the same spot in the 1850s! It s also important to have consistent reference points because maps can be so different that sometimes it s easy to get lost within one map sheet! Historical maps can often show different scales or use different symbols to show the same feature so using a place name or a burn can sometimes help you accurately identify your study area. Choose reference points that have not changed very much over time. Case Study - Dundee Bleachworks The group have chosen two reference points which they believe have been consistent over the last two hundred years. They have included as one reference point a placename which they believe will help them look for the general area on earlier maps. They also know that the road was once the Kings Road and therefore will appear on earlier maps. Therefore, as their fixed reference points, the group has chosen the road and the placename Longhaugh. 4
5 Step 4: Select the maps which will tell you what you need to know? Go back to your original question and think about which map sources will help you. Consider the scale of the map (is it detailed enough?), the date of the map (will the features appear on an early map?) why are they producing the map? And finally the source of the map (will a naval chart tell you about a land-based limekiln?) Look at every map here which shows your study area not all of them are going to be useful. You might want to narrow down your list of maps to those that will be the most help in answering your original question. Case Study - Dundee Bleachworks The group are keen to understand how the Bleachworks have progressed over time. Map 1 Thomson doesn t show the Dundee Bleachworks, but it does give further information on the surrounding area. Map 2 Ordnance Survey 1st Edition map one of the first detailed maps available of the area Map 3 Ordnance Survey 1903 edition map which shows the development of the site Map 4 Ordnance Survey 1957 this map the start of the change in land use within the later 20th century 5

6 6


7 7
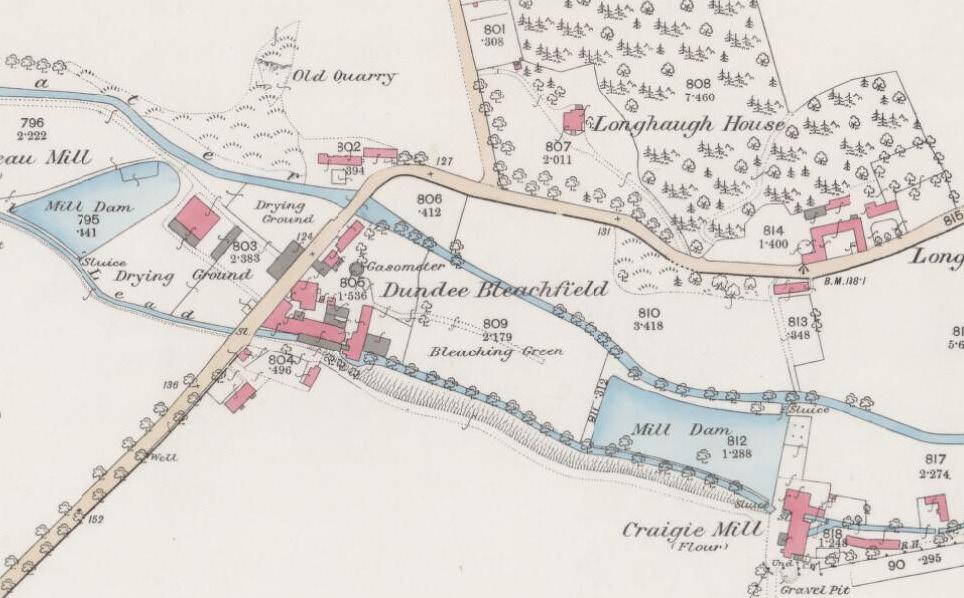
8 Step 5: Start your map regression Now that you have selected your maps, you can look at them one by one and start identifying any landscape changes. Think about the skills you learned in other areas of this step-by-step guide and use them here to help you. What changes can you identify between the different maps and how can they answer you original question? What features are shown, what features are no longer shown? Why might a feature no longer be there? Was it built- over by another feature or was it no longer important? Case Study - Dundee Bleachworks Site Map 1 Thomson 1832 Map 2 Ordnance Survey 1st map 1865 Map3 Ordnance Survey 1903 Map 4 Ordnance Survey 1957 Dundee Bleachworks While the Dundee Bleachworks is not shown, the Longhaugh Estate is annotated and other mills are shown in the general area. A collection of buildings are named as Dundee Bleachworks. A Bleaching green and a drying area, as well as a Gasmeter are also depicted. The collection of buildings shown on the previous map has now been combined into one big building. A row of terraced housing has been built to the south. The drying ground and the bleaching green have extended to the south. While this is a different scale to the other maps, it shows that the main building relating to the bleachworks is still upstanding. The map also shows that the area is beginning to be re-developed as housing. 8
9 Step 6: Recording your map regression and gathering your results To continue your understanding of map regression, it s important that you make a thorough and accurate record of your work. This will save you time later on! You might find it helpful to create a gazetteer, or list of the changes you have seen for each feature on the map you are interested in. Remember to always keep a detailed record of the map reference so you can refer back to it at any point. Important things to record include : The title of map The author of the map Scale of the map The date the map was surveyed The date of publication Here are some suggested ways to reference your map John Thomson, Northern Part of Argyllshire, 2¾ inches to the mile, ca. 1:170,000, published Ordnance Survey, Argyllshire XV, 6 inch to the mile (1:10,560), surveyed 1782, published You might just be looking at your study area for fun so you may not be looking to produce a report of your map regression, but if you are, think about how you might reference the maps within your text. It s important to be consistent in your descriptions, to be accurate with dates and provide detailed but clear descriptions of the landscape changes. Think about how someone who might read your research at a later stage will interpret your work. 9
10 Case Study - Dundee Bleachworks The group have now finished their map regression exercise and found that there was good map coverage of their study area. They believe that the site was built sometime in the early 19th century. Thomson s 1832 map does not depict the bleachworks, however the Ordnance Survey 1865 map does. The expansion of the site (depicted on 1903 map) suggests that production had increased in later part of the 19th century. The 1957 map shows how Dundee is beginning to develop post-war with large expansion of housing. Although the group could not find out what features are still upstanding, they now have a better idea of where to look for surviving features. The group will now look at further information (such as aerial photography and historical records) to enhance the data they have collected from the map regression. See the go further section for links to some of the resources the group went on to look at. 10
Section 29: What s an Inverse?
 Section 29: What s an Inverse? Our investigations in the last section showed that all of the matrix operations had an identity element. The identity element for addition is, for obvious reasons, called
What is a map? Understanding your map needs
 What is a map? A map is simply a drawing or picture of a landscape or location. Maps usually show the landscape as it would be seen from above, looking directly down. As well as showing the landscape of
Solving with Absolute Value
 Solving with Absolute Value Who knew two little lines could cause so much trouble? Ask someone to solve the equation 3x 2 = 7 and they ll say No problem! Add just two little lines, and ask them to solve
Touring Around the Islands of Atlantic Canada
 Lesson Overview Touring Around the Islands of Atlantic Canada In this lesson, students will examine the history and heritage of the islands of Atlantic Canada and examine their similarities and differences.
STUDY GUIDE. Exploring Geography. Chapter 1, Section 1. Terms to Know DRAWING FROM EXPERIENCE ORGANIZING YOUR THOUGHTS
 For use with textbook pages 19 22. Exploring Geography Terms to Know location A specific place on the earth (page 20) absolute location The exact spot at which a place is found on the globe (page 20) hemisphere
Lesson 5: Trees. Tell your child that today he is going to learn about trees. Ask him what he knows about trees and how people are dependent on trees.
 Dirt and Plants -> 5: Trees Lesson 5: Trees Getting Started? Big Ideas P How are people dependent on plants? & Facts and Definitions P Evergreen trees do not change colors in the fall and winter. P Deciduous
Introducing GIS analysis
 1 Introducing GIS analysis GIS analysis lets you see patterns and relationships in your geographic data. The results of your analysis will give you insight into a place, help you focus your actions, or
Note that we are looking at the true mean, μ, not y. The problem for us is that we need to find the endpoints of our interval (a, b).
.") Confidence Intervals 1) What are confidence intervals? Simply, an interval for which we have a certain confidence. For example, we are 90% certain that an interval contains the true value of something
Confidence Intervals 1) What are confidence intervals? Simply, an interval for which we have a certain confidence. For example, we are 90% certain that an interval contains the true value of something
Regression, part II. I. What does it all mean? A) Notice that so far all we ve done is math.
 Notice that so far all we ve done is math.") Regression, part II I. What does it all mean? A) Notice that so far all we ve done is math. 1) One can calculate the Least Squares Regression Line for anything, regardless of any assumptions. 2) But, if
Regression, part II I. What does it all mean? A) Notice that so far all we ve done is math. 1) One can calculate the Least Squares Regression Line for anything, regardless of any assumptions. 2) But, if
The maps in this resource can be freely modified and reproduced in the classroom only.
 Teacher's Notes In this activity, students work collaboratively to explore sections of old and new maps. By closely examining these documents, students learn to see maps as more than just tools for locating
Module 2, Investigation 4: Log 1 Our coasts
 Module 2, Investigation 4: Log 1 Our coasts The coast is where the ocean meets land. Coastlines are always changing their shape. They are being worn away in some places and built up in others. Coasts can
F o l l o w i n g t h e F a l l i n g Meteorite
 Teachersʼ Guide F o l l o w i n g t h e F a l l i n g Meteorite Follow the falling Meteorite - Teachersʼ Guide - 2 Follow the Falling Meteorite Background Triangulation is a geometric technique for locating
Draft exercise for share fair at Bozeman workshop only. This exercise is not ready for distribution. Please send helpful suggestions to
 Draft exercise for share fair at Bozeman workshop only. This exercise is not ready for distribution. Please send helpful suggestions to foleyd@plu.edu Figure list 1. Trailer photograph 2. Location map
Cross-Cutting Relationships Cross-Cutting and Sequencing Lab Earth Science Essentials-Advanced by Russ Colson
 Cross-Cutting Relationships Cross-Cutting and Sequencing Lab Earth Science Essentials-Advanced by Russ Colson Introduction: It isn't possible to bring all of outdoors into the classroom, and stratigraphic
Historical Mapping Legends
 Historical Mapping Legends Ordnance Survey County Series and Ordnance Survey Plan Ordnance Survey Plan, dditional SIMs and Supply of Unpublished Survey Information and 1:1,250 Large-Scale National Grid
Where, on Earth, are you?
 Where, on Earth, are you? We all live on a big planet called Earth, of course. But where on Earth? And if you want to go to a different spot on Earth other than the spot you are in, how do you know which
Landmarks Paula Owens 5 7 years
 Landmarks Paula Owens Geography teaching resource 5 7 years This is one of a series of teaching resources for use with Digimap for Schools. For more details about this service, visit http://digimapforschools.edina.ac.uk
GUIDED NOTES 2.5 QUADRATIC EQUATIONS
 GUIDED NOTES 5 QUADRATIC EQUATIONS LEARNING OBJECTIVES In this section, you will: Solve quadratic equations by factoring. Solve quadratic equations by the square root property. Solve quadratic equations
Math Fundamentals for Statistics I (Math 52) Unit 7: Connections (Graphs, Equations and Inequalities)
 Unit 7: Connections (Graphs, Equations and Inequalities)") Math Fundamentals for Statistics I (Math 52) Unit 7: Connections (Graphs, Equations and Inequalities) By Scott Fallstrom and Brent Pickett The How and Whys Guys This work is licensed under a Creative Commons
Math Fundamentals for Statistics I (Math 52) Unit 7: Connections (Graphs, Equations and Inequalities) By Scott Fallstrom and Brent Pickett The How and Whys Guys This work is licensed under a Creative Commons
Map reading made easy
 Map reading made easy 1 1. What is a map? A map is simply a drawing or picture (in 2-D) of a landscape or area of a country (in 3-D). It could be anything from a sketch map for a visitor to find your school
Confidence intervals
 Confidence intervals We now want to take what we ve learned about sampling distributions and standard errors and construct confidence intervals. What are confidence intervals? Simply an interval for which
1/28/16. EGM101 Skills Toolbox. Map types. Political Physical Topographic Climate Resource Road. Thematic maps (use one of the above as backdrop)
") EGM101 Skills Toolbox Map types Political Physical Topographic Climate Resource Road Thematic maps (use one of the above as backdrop) Map Types Deriving information from maps Hydrographic Geological Soils
EGM101 Skills Toolbox Map types Political Physical Topographic Climate Resource Road Thematic maps (use one of the above as backdrop) Map Types Deriving information from maps Hydrographic Geological Soils
UNST 232 Mentor Section Assignment 5 Historical Climate Data
 UNST 232 Mentor Section Assignment 5 Historical Climate Data 1 introduction Informally, we can define climate as the typical weather experienced in a particular region. More rigorously, it is the statistical
Atomic Theory. Introducing the Atomic Theory:
 Atomic Theory Chemistry is the science of matter. Matter is made up of things called atoms, elements, and molecules. But have you ever wondered if atoms and molecules are real? Would you be surprised to
Math101, Sections 2 and 3, Spring 2008 Review Sheet for Exam #2:
 Math101, Sections 2 and 3, Spring 2008 Review Sheet for Exam #2: 03 17 08 3 All about lines 3.1 The Rectangular Coordinate System Know how to plot points in the rectangular coordinate system. Know the
Alex s Guide to Word Problems and Linear Equations Following Glencoe Algebra 1
 Alex s Guide to Word Problems and Linear Equations Following Glencoe Algebra 1 What is a linear equation? It sounds fancy, but linear equation means the same thing as a line. In other words, it s an equation
Structures of Life. Investigation 2: Growing Further. Big Question: 3 rd Science Notebook. Name:
 3 rd Science Notebook Structures of Life Investigation 2: Growing Further Name: Big Question: What are the structures and functions of a seedling and how are they important to the plant s survival? 1 Alignment
Determinants of 2 2 Matrices
 Determinants In section 4, we discussed inverses of matrices, and in particular asked an important question: How can we tell whether or not a particular square matrix A has an inverse? We will be able
Big Bang, Black Holes, No Math
 ASTR/PHYS 109 Dr. David Toback Lecture 5 1 Prep For Today (is now due) L5 Reading: No new reading Unit 2 reading assigned at the end of class Pre-Lecture Reading Questions: Unit 1: Grades have been posted
ASTROVENTURE Extend Lesson Concept Activities
 Extend Lesson Concept: Carbon dioxide and water vapor are greenhouse gases that absorb energy radiated from Earth s surface and release some of it back towards the Earth, increasing the surface temperature.
Using Microsoft Excel
 Using Microsoft Excel Objective: Students will gain familiarity with using Excel to record data, display data properly, use built-in formulae to do calculations, and plot and fit data with linear functions.
NAME: DATE: Leaving Certificate GEOGRAPHY: Maps and aerial photographs. Maps and Aerial Photographs
 NAME: DATE: Leaving Certificate Geography Maps and Aerial Photographs Please see Teachers Notes for explanations, additional activities, and tips and suggestions. Learning Support Vocabulary, key terms
Section 8. North American Biomes. What Do You See? Think About It. Investigate. Learning Outcomes
 Section 8 North American Biomes What Do You See? Learning Outcomes In this section, you will Define the major biomes of North America and identify your community s biome. Understand that organisms on land
Lesson Topic: Maps of New England
 1 Lesson Topic: Maps of New England Essential Question: How and why have maps of New England changed over time? Grade: 3 Standard/s: Common Core State Standards CCSS.ELA-LITERACY.RI.3.9 Compare and contrast
Free Ebooks World Regions In Global Context: Peoples, Places, And Environments (6th Edition)
") Free Ebooks World Regions In Global Context: Peoples, Places, And Environments (6th Edition) For courses in world regional geography. Conceptual Exploration of World Regions and the Myriad Issues Critical
Free Ebooks World Regions In Global Context: Peoples, Places, And Environments (6th Edition) For courses in world regional geography. Conceptual Exploration of World Regions and the Myriad Issues Critical
Astronomy 102 Math Review
 Astronomy 102 Math Review 2003-August-06 Prof. Robert Knop r.knop@vanderbilt.edu) For Astronomy 102, you will not need to do any math beyond the high-school alegbra that is part of the admissions requirements
Student Instruction Sheet: Unit 3, Lesson 3. Solving Quadratic Relations
 Student Instruction Sheet: Unit 3, Lesson 3 Solving Quadratic Relations Suggested Time: 75 minutes What s important in this lesson: In this lesson, you will learn how to solve a variety of quadratic relations.
Stat 20 Midterm 1 Review
 Stat 20 Midterm Review February 7, 2007 This handout is intended to be a comprehensive study guide for the first Stat 20 midterm exam. I have tried to cover all the course material in a way that targets
Basic Math Problems Unit 1
 Basic Math Problems Unit 1 Name Period Using fractions: When you are using fractions in science, we need to convert them into decimals. You can do this by dividing the top number by the bottom number.
Math 31 Lesson Plan. Day 5: Intro to Groups. Elizabeth Gillaspy. September 28, 2011
 Math 31 Lesson Plan Day 5: Intro to Groups Elizabeth Gillaspy September 28, 2011 Supplies needed: Sign in sheet Goals for students: Students will: Improve the clarity of their proof-writing. Gain confidence
Reasoning: Odd one out
 Reasoning: Odd one out Learning objective To use mathematical reasoning to identify the odd one out in a list of mathematical statements. Links to year 6 problem solving and reasoning pupil target sheet
Urban Foundations. Early American Cities. Early American Cities. Early American Cities. Cities in America to 1945
 Urban Foundations Cities in America to 1945 Early American Cities The design of early American cities was highly influenced by European traditions The roots of many of these traditions can in turn be traced
LECTURE 15: SIMPLE LINEAR REGRESSION I
 David Youngberg BSAD 20 Montgomery College LECTURE 5: SIMPLE LINEAR REGRESSION I I. From Correlation to Regression a. Recall last class when we discussed two basic types of correlation (positive and negative).
Unit 9.2 Introduction to Geography
 Unit 9.2 Introduction to Geography Name: Period: This activity has been modified from the Stanford History Education Group from the original found here. 1 What does it mean to think like a geographer?
Unit 1, Lesson 2. What is geographic inquiry?
 What is geographic inquiry? Unit 1, Lesson 2 Understanding the way in which social scientists investigate problems will help you conduct your own investigations about problems or issues facing your community
Introduction to Measurements of Physical Quantities
 1 Goal Introduction to Measurements of Physical Quantities Content Discussion and Activities PHYS 104L The goal of this week s activities is to provide a foundational understanding regarding measurements
Math 31 Lesson Plan. Day 2: Sets; Binary Operations. Elizabeth Gillaspy. September 23, 2011
 Math 31 Lesson Plan Day 2: Sets; Binary Operations Elizabeth Gillaspy September 23, 2011 Supplies needed: 30 worksheets. Scratch paper? Sign in sheet Goals for myself: Tell them what you re going to tell
Activity Title: It s Either Very Hot or Very Cold Up There!
 Grades 3-5 Teacher Pages Activity Title: It s Either Very Hot or Very Cold Up There! Activity Objective(s): In this activity, and the follow-up activity next week, teams will design and conduct experiments
Avalon Marshes Landscape
 Avalon Marshes Landscape Mapping the Marshes KS2 & KS3 Outline The Avalon Marshes is a unique and interesting landscape and this set of resources is designed to help Description pupils interact with the
Quadratic Equations Part I
 Quadratic Equations Part I Before proceeding with this section we should note that the topic of solving quadratic equations will be covered in two sections. This is done for the benefit of those viewing
Too Close for Comfort
 Too Close for Comfort Overview South Carolina consists of urban, suburban, and rural communities. Students will utilize maps to label and describe the different land use classifications. Connection to
Historical Mapping Legends
 Historical Mapping Legends Ordnance Survey County Series and Ordnance Survey Plan Ordnance Survey Plan, dditional SIMs and Supply of Unpublished Survey Information and 1:1,250 Large-Scale National Grid
HADRIANS WALL NEWCASTLE UNIVERSITY
 HADRIANS WALL NEWCASTLE UNIVERSITY WEEK 3 FRONTIER COMMUNITIES: LIFE IN THE NORTHERN FRONTIER LATE 1ST-EARLY 3RD CENTURY EXPLORING MAGNETOMETRY Archaeologists use a number of methods and types of information
15-424/ Recitation 1 First-Order Logic, Syntax and Semantics, and Differential Equations Notes by: Brandon Bohrer
 15-424/15-624 Recitation 1 First-Order Logic, Syntax and Semantics, and Differential Equations Notes by: Brandon Bohrer (bbohrer@cs.cmu.edu) 1 Agenda Admin Everyone should have access to both Piazza and
Modern Physics notes Paul Fendley Lecture 1
 Modern Physics notes Paul Fendley fendley@virginia.edu Lecture 1 What is Modern Physics? Topics in this Class Books Their Authors Feynman 1.1 What is Modern Physics? This class is usually called modern
ED 357/358 - FIELD EXPERIENCE - LD & EI LESSON DESIGN & DELIVERY LESSON PLAN #4
 ED 357/358 - FIELD EXPERIENCE - LD & EI LESSON DESIGN & DELIVERY LESSON PLAN #4 Your Name: Sarah Lidgard School: Bentheim Elementary School Lesson: Telling Time Length: approx. 50 minutes Cooperating Teacher:
Activity 3.2: Effigy Mounds
 3 Wisconsin s First People : Effigy Mounds Teacher Materials Background Information to Share Most effigy mound sites are found in Wisconsin, and most are within the southern half of the state. A few sites
Linear Regression. Linear Regression. Linear Regression. Did You Mean Association Or Correlation?
 Did You Mean Association Or Correlation? AP Statistics Chapter 8 Be careful not to use the word correlation when you really mean association. Often times people will incorrectly use the word correlation
ARTSCIENCE MUSEUM PRESENTS. RICHARD FEYNMAN S CURIOUS LIFE 20 October March 2019 ACTIVITY SHEET
 ARTSCIENCE MUSEUM PRESENTS RICHARD FEYNMAN S CURIOUS LIFE 20 October 2018 3 March 2019 ACTIVITY SHEET INTRODUCTION ArtScience Museum is dedicated to the exploration of the interconnection between art,
Section 2.7 Solving Linear Inequalities
 Section.7 Solving Linear Inequalities Objectives In this section, you will learn to: To successfully complete this section, you need to understand: Add and multiply an inequality. Solving equations (.1,.,
Lab 21. Forecasting Extreme Weather: When and Under What Atmospheric Conditions Are Tornadoes Likely to Develop in the Oklahoma City Area?
 Forecasting Extreme Weather When and Under What Atmospheric Conditions Are Tornadoes Likely to Develop in the Oklahoma City Area? Lab Handout Lab 21. Forecasting Extreme Weather: When and Under What Atmospheric
WEEK 1 THE BIBLE BIG IDEA WELCOME TIME DISCUSSION TIME TEACHING TIME PLAY TIME PRESCHOOL LESSON OUTLINE THIS WEEK AT A GLANCE
 WEEK 1 PRESCHOOL LESSON OUTLINE BIG IDEA Jesus cares about us when we are sick. THE BIBLE Jesus Heals the Leper: Luke 5:12-15 THIS WEEK AT A GLANCE WELCOME TIME ACTIVITY Play-Doh Unbelievable Scenes ACTIVITY
Exo-planets. Introduction. Detection Methods. Teacher s Notes. Radial Velocity or Doppler Method. 1. Download these notes at
 1. Introduction An exoplanet, or an extrasolar planet, is a planet which orbits any star other than our Sun so one which is not within our Solar System. As far back as the 16th century, the existence of
base 2 4 The EXPONENT tells you how many times to write the base as a factor. Evaluate the following expressions in standard notation.
 EXPONENTIALS Exponential is a number written with an exponent. The rules for exponents make computing with very large or very small numbers easier. Students will come across exponentials in geometric sequences
What on Earth is Geography? Using the Five Themes of Geography to Study the Continent of Asia.
 What on Earth is Geography? Using the Five Themes of Geography to Study the Continent of Asia. Name Date Essential questions: 1. How can we study the geography of our Earth? a. What are the five themes
Intermediate Logic. Natural Deduction for TFL
 Intermediate Logic Lecture Two Natural Deduction for TFL Rob Trueman rob.trueman@york.ac.uk University of York The Trouble with Truth Tables Natural Deduction for TFL The Trouble with Truth Tables The
Map reading made easy
 Map reading made easy 1. What is a map? A map is simply a drawing or picture (in 2-D) of a landscape or area of a country (in 3-D). It could be anything from a sketch map for a visitor to find your school
MITOCW R11. Double Pendulum System
 MITOCW R11. Double Pendulum System The following content is provided under a Creative Commons license. Your support will help MIT OpenCourseWare continue to offer high quality educational resources for
Alliance Created State Giant Traveling Map Lesson
 Title: Comparing Arizona s Temperatures Recommended Grades: 4 th 5 th Time Needed: 30 minutes Objectives: Students will: Compare and contrast the geographic features of Arizona by researching seasonal
Lab 1. EXCEL plus some basic concepts such as scientific notation, order of magnitude, logarithms, and unit conversions
 COMPUTER LAB 1 EARTH SYSTEMS SCIENCE I PG250 Fall 2010 Hunter College Lab 1. EXCEL plus some basic concepts such as scientific notation, order of magnitude, logarithms, and unit conversions Low Impact
Overlay Analysis II: Using Zonal and Extract Tools to Transfer Raster Values in ArcMap
 Overlay Analysis II: Using Zonal and Extract Tools to Transfer Raster Values in ArcMap Created by Patrick Florance and Jonathan Gale, Edited by Catherine Ressijac on March 26, 2018 If you have raster data
Middle School. Assessment Focus: Strand 2 Developing a Geographic Perspective. Geography Content Standard Location, Movement, and Connection
 MS05 Michigan Geographic Alliance(1996) Geography Sample Item Middle School Assessment Focus: Strand 2 Developing a Geographic Perspective Geography Content Standard Location, Movement, and Connection
Solve Systems of Equations Algebraically
 Part 1: Introduction Solve Systems of Equations Algebraically Develop Skills and Strategies CCSS 8.EE.C.8b You know that solutions to systems of linear equations can be shown in graphs. Now you will learn
Map reading made easy
 Map reading made easy Maps can be great fun and they can lead you to all sorts of discoveries. They can help you get to know an area really well, because they pinpoint interesting places that are often
Teacher Edition. Goldilocks. Baby Bear. and the Three Bears. alphakids. Goes for a Walk. Retold by Jenny Feely. Illustrated by Peter Paul Bajer
 Teacher Edition Goldilocks Baby Bear and the Three Bears Goes for a Walk Retold by Jenny Feely alphakids Illustrated by Peter Paul Bajer Published edition Eleanor Curtain Publishing 2004 First published
Atoms with More than One Electron
 Fun with the Periodic Table Activity 6 Atoms with More than One Electron GOALS In this activity you will: View the spectra of various materials. Graphically analyze patterns in the amounts of energy required
Chapter 1 Learning Guide Thinking Geographically
 Chapter 1 Learning Guide Thinking Geographically Key Issue 1 How Do Geographers Address Where Things Are? Pgs. 2 13 1. Define map: 2. Define cartography: Maps 3. Give an example of early mapmaking and
Honors Math 2 Unit 5 Exponential Functions. *Quiz* Common Logs Solving for Exponents Review and Practice
 Honors Math 2 Unit 5 Exponential Functions Notes and Activities Name: Date: Pd: Unit Objectives: Objectives: N-RN.2 Rewrite expressions involving radicals and rational exponents using the properties of
Final Review Sheet. B = (1, 1 + 3x, 1 + x 2 ) then 2 + 3x + 6x 2
 then 2 + 3x + 6x 2") Final Review Sheet The final will cover Sections Chapters 1,2,3 and 4, as well as sections 5.1-5.4, 6.1-6.2 and 7.1-7.3 from chapters 5,6 and 7. This is essentially all material covered this term. Watch
Final Review Sheet The final will cover Sections Chapters 1,2,3 and 4, as well as sections 5.1-5.4, 6.1-6.2 and 7.1-7.3 from chapters 5,6 and 7. This is essentially all material covered this term. Watch
Opening. Monster Guard. Grades 1-3. Teacher s Guide
 Teacher s Guide PLEASE NOTE: Students must complete the Initiation section of the Monster Guard app before they begin this activity, in order to gain access to the Earthquake training mission. Opening
GAP CLOSING. Algebraic Expressions. Intermediate / Senior Facilitator s Guide
 GAP CLOSING Algebraic Expressions Intermediate / Senior Facilitator s Guide Topic 6 Algebraic Expressions Diagnostic...5 Administer the diagnostic...5 Using diagnostic results to personalize interventions...5
The Ancient World. Chapter 1 The Beginnings of Human Society. What historical accomplishments is each civilization known for?
 Chapter 1 The Beginnings of Human Society Chapter 1-Guiding Questions: What historical accomplishments is each civilization known for? How did physical geography affect the growth of ancient civilizations
Learning Target : Describe the purposes and uses of different types of maps.
 Learning Target : Describe the purposes and uses of different types of maps. Directions: 1. Below, place a where you think you are located. 2. In which continent are you located? 3. In which country are
AP Physics 1 Summer Assignment
 AP Physics 1 Summer Assignment Gaithersburg High School Mr. Schultz Welcome to AP Physics 1! This is a college level physics course that is fun, interesting and challenging on a level you ve not yet experienced.
Introductory Lessons for Buds, Leaves and Global Warming JoAnn Mossman Gr. 7 Life Science Overlook Middle School Ashburnham-Westminster Regional
 Harvard LTER Schoolyard Program ------------------------------------------------------- Teacher Developed Lessons and Documents that integrate Harvard Forest Schoolyard Ecology Themes into curriculum.
Lesson Objectives. Core Content Objectives. Language Arts Objectives
 Evergreen Trees 9 Lesson Objectives Core Content Objectives Students will: Explain that evergreen trees are one type of plant that stays green all year and does not become dormant in the winter Compare
Field Trip to Tempe Butte
 Synopsis Field Trip to Tempe Butte So far you have been identifying rocks and mapping their locations without actually going there. Now it is your chance to put it all together and see real rocks out in
Introduction This is a puzzle station lesson with three puzzles: Skydivers Problem, Cheryl s Birthday Problem and Fun Problems & Paradoxes
 Introduction This is a puzzle station lesson with three puzzles: Skydivers Problem, Cheryl s Birthday Problem and Fun Problems & Paradoxes Resources Calculators, pens and paper is all that is needed as
ONE M² INFRASTRUCTURE FOR ONE M² FLOOR SPACE?!
 ONE M² INFRASTRUCTURE FOR ONE M² FLOOR SPACE?! Clemens Deilmann Karin Gruhler Jörg Hennersdorf Summary The resource consumption for urban infrastructure should not be omitted when looking for sustainable
Lesson 32. The Grain of Wheat. John 12:20-26
 L i f e o f C h r i s t from the gospel of J o h n Lesson 32 The Grain of Wheat John 12:20-26 Mission Arlington Mission Metroplex Curriculum 2010 Created for use with young, unchurched learners Adaptable
Warm Up. Fourth Grade Released Test Question: 1) Which of the following has the greatest value? 2) Write the following numbers in expanded form: 25:
 Which of the following has the greatest value? 2) Write the following numbers in expanded form: 25:") Warm Up Fourth Grade Released Test Question: 1) Which of the following has the greatest value? A 12.1 B 0.97 C 4.23 D 5.08 Challenge: Plot these numbers on an open number line. 2) Write the following numbers
Warm Up Fourth Grade Released Test Question: 1) Which of the following has the greatest value? A 12.1 B 0.97 C 4.23 D 5.08 Challenge: Plot these numbers on an open number line. 2) Write the following numbers
Unit 1, Lesson 3 What Tools and Technologies Do Geographers Use?
 Unit 1, Lesson 3 What Tools and Technologies Do Geographers Use? Geographers use a variety of tools and technologies in investigating geographic questions. Maps and globes both represent the earth, but
MAT224 Practice Exercises - Week 7.5 Fall Comments
 MAT224 Practice Exercises - Week 75 Fall 27 Comments The purpose of this practice exercise set is to give a review of the midterm material via easy proof questions You can read it as a summary and you
Lesson Title: Then and Now: How Society Alters Topography and Vegetation
 Lesson Title: Then and Now: How Society Alters Topography and Vegetation Lesson Author: Rodney Collins (rwcollins@lf.k12.de.us) Lesson Description: This lesson is a comparative study in which students
Big Bang, Black Holes, No Math
 ASTR/PHYS 109 Dr. David Toback Lectures 2 & 3 1 Prep For Today (is now due) L3 Reading (If you haven t already): Required: BBBHNM: Chapter 1-4 Recommended: (BHOT: Chap. 1-3, SHU: Chap. 1-2, TOE: Chap.
Notes on the Z-transform, part 4 1
 Notes on the Z-transform, part 4 5 December 2002 Solving difference equations At the end of note 3 we saw how to solve a difference equation using Z-transforms. Here is a similar example, solve x k+2 6x
Descriptive Statistics (And a little bit on rounding and significant digits)
") Descriptive Statistics (And a little bit on rounding and significant digits) Now that we know what our data look like, we d like to be able to describe it numerically. In other words, how can we represent
Descriptive Statistics (And a little bit on rounding and significant digits) Now that we know what our data look like, we d like to be able to describe it numerically. In other words, how can we represent
An introduction to plotting data
 An introduction to plotting data Eric D. Black California Institute of Technology v2.0 1 Introduction Plotting data is one of the essential skills every scientist must have. We use it on a near-daily basis
Solving Equations by Adding and Subtracting
 SECTION 2.1 Solving Equations by Adding and Subtracting 2.1 OBJECTIVES 1. Determine whether a given number is a solution for an equation 2. Use the addition property to solve equations 3. Determine whether
Please bring the task to your first physics lesson and hand it to the teacher.
 Pre-enrolment task for 2014 entry Physics Why do I need to complete a pre-enrolment task? This bridging pack serves a number of purposes. It gives you practice in some of the important skills you will