Spatial Dynamics of Chinese Manufacturing Industries: Comparative Advantage versus New Economic Geography
|
|
|
- Lewis Nelson
- 5 years ago
- Views:
Transcription
1 Applied Economics and Finance Vol. 4, No. 3; May 2017 ISSN E-ISSN Published by Redfame Publishing URL: Spatial Dynamics of Chinese Manufacturing Industries: Comparative Advantage versus New Economic Geography Fei Wang 1, Qiliang Mao 2 1 School of Public Policy and Management, Tsinghua University, Beijing, P.R.China 2 School of Urban Economics and Public Administration, Capital University of Economics and Business, Beijing, P.R.China Correspondence: Qiliang Mao, Room 222, Bona Building, Capital University of Economics and Business, 121, Zhangjia Road, Huaxiang, Fengtai District, Beijing, , P.R.China. Received: February 6, 2017 Accepted: March 5, 2017 Available online: March 14, 2017 doi: /aef.v4i URL: This work was supported by China Postdoctoral Science Foundation under Grant [No.2015M581051], National Natural Science Foundation of China under Grant [No ]. Abstract This paper analyzes the evolving spatial distribution of manufacturing industries in China. Besides, we explore the substantial determinants by adopting a spatial panel model. The spatial pattern of Chinese manufacturing industries has changed significantly, which is featured by obvious trend of labor intensive industries and some of capital and tech intensive ones in Eastern China spread to Central and Western China. Generally, spatial dynamics of industries present an order to a certain degree. Central China has been the main region where industries spread to, and relative large range of sectors is involved. We test the determinants in terms of comparative advantage and new economic geography. It turns out that the factors driving industry spatial dynamics is not the enlarging regional cost differences of production factors but endogenous agglomeration externalities. Specifically, more and more fierce competition of local firms in same sector has become one of the principal reasons cause spatial relocation. More congestion happens in labor intensive industries compared to technology intensive industries and capital intensive industries. The findings of this study indicate that comparative advantage theory and new economic geography will be suitable in different spatial scape of economic issues. Geographic evolution of industries in one country is less determined by changing regional comparative advantage differences but the endogenous effect of varying agglomeration externalities. Keywords: spatial dynamics, new economic geography, comparative advantage, manufacturing industries 1. Introduction Since the reform and opening up, China s regional economic pattern is generally featured by imbalance in development, however, problems such as rise in cost, sharp reduction in cultivated land, energy predicament and environmental pollutions occur in East in recent years. Besides, economic growth is also affected by weak external demands. Advantages in industrial development in Eastern and Western areas seem to gradually change and on the other hand, Central and Western areas expect to change backward situation through rapid economic growth. Industrial transfer from East to West and changes in spatial pattern of industry are increasingly focused. Though international development history provides a lot of beneficial experiences, research on evolving rules of China s spatial pattern of industry is important since China is a large developing country with imbalanced regional economic levels. Recently, there are two main theories interpreting industrial location and changing spatial distribution of industries: one is neo-classical trade theory (or traditional trade theory) theoretically based on comparative advantages and the other is new economic geography theoretically based on increasing returns and imperfect competition (Davis et al.,1999) 1. The 1 Some scholars also believe that besides the comparative advantage theory and new economic geography theory, we shall also add the new trade theory (Haaland et al.,1999); however, with considerations given to the fact that it is 30
2 Neo-classical trade theory, with comparative advantage theory by Ricardo and factor endowment theory by Heckscher-Ohlin, holds that industry location is determined by exogenous variables such as regional factor endowment, geographical location and technological level, and special distribution of industries depends on distribution of exogenous variables in regions, i.e., on first nature. Regional factor endowment and changes in comparative advantages lead to corresponding reconfiguration for regional industrial structures. New economic geography, however, holds that industrial location is a endogenous result of spatial economic system, i.e., determined by second nature, emphasizing on impacts of imperfect market competition, product differentiation, scale economy and accumulative cycle mechanism on industrial distribution. Analysis from New economic geography shows that the core of changes in spatial pattern of industries lies in industrial agglomeration, that the process of spatial evolution of economic activities may be described as Bell-Shaped Curve, and that reduction in trade costs leads to geographical concentration of manufacturing industries and forms core-periphery pattern. Industrial agglomeration to an extent will generate congestion costs in agglomeration area such as price of non-tradable staying high, rising land rent and environmental pollutions. Wage gap between the core and peripheral areas will continue to enlarge and centrifugal force giving rise to industrial dispersion will increase, forcing some industries leaving core area for new areas. In this mechanism, industries more sensitive to wages, with weaker industrial relativity and slightly dependent on industrial aggregation will be the pioneer to leave agglomeration area (Fujita et al., 1999). Numerous studies show that after China has experienced long-term imbalanced development since the reform and opening up, industrial dispersing toward Central and Western areas is increasingly obvious and new changes are appearing in spatial pattern of industries. He and Pan (2011) also pointed that agglomeration degree of China s manufacturing industry entered into inflection point in He and Liu (2012) found both quantity and scale of industries transferring from eastern areas to Central and Western areas were continuously expanding since However, differences lie in recent research viewpoints on characteristics of evolving industrial spatial pattern. Many researches, through normative analysis, hold that industries in the east are supposed to transfer since comparative advantages for labor-intensive industries in the east gradually vanish due to rising labor costs, which is also supported by lots of scholars through empirical research. Wang and Wei (2007) found geographic concentration degree of labor-intensive industries during period 1995 to 2003 tended to take the lead in declining. He and Wang (2012) found it obvious for some labor-intensive industries to transfer from Coastal areas to Central areas. But researches of those such as Feng (2010) argued that industrial spatial transfer occurred in resource-dependent industries and resource-intensive industries instead of typical labor-intensive industries. Similar disputes also exist in understanding of factors influencing changes in industrial location. The most representative opinion holds that industrial transfer may owe to changes in comparative advantages in Eastern and Western areas where labor cost weighs, however, disputes still exist in whether this on earth is a sufficient condition or only an essential condition resulting in industrial transfer. Researches of those like Cai et al. (2009) found Central areas had been equipped with advantages in labor cost while Western areas potential advantages in labor cost, which was also proved by researches of Zhang and Liang (2010). But many scholars point out that comparative advantages are insufficient as a sufficient condition of changes in industrial location. Those such as Luo (2003), Guo and Zhang (2009) hold free spatial mobility of labor force and enormous surplus labor in Central and Western areas result in low elasticity of labor supply and impede transfer of labor-intensive industries from developed regions to less developed ones. Since barrier to regional flow of domestic labor force and its cost appear smaller than those of regional flow of capital, it is quite easier to form one-way flow featured by labor accommodated to capital so that capital in developed regions may be integrated with cheap labor force in less developed regions not necessarily through trans-regional investment. Trans-regional flow of labor force changes inter-regional element structure, prominently weakening impacts of enrichment or paucity of labor force on domestic comparative advantages (Liu and Du, 2010), which, held by Li and Peng (2010), somewhat explains Chinese Leontief Paradox. However, why the East still attracts a large number of economic activities now given that comparative advantages on production factors have vanished? Many researches, proceeding from new economic geography, argue that regional location advantages of foreign trade, market potential and agglomeration economies in the East are important centripetal force of industrial distribution. Globalization has with no doubt affected distribution of domestic industries. Ge (2006) and Huang (2011) holds that foreign trade and foreign direct investment force industries comparatively strongly dependent on export or foreign capital gathering in the East with easier access to international market, which forms imbalanced industrial distribution between the coastal and inland areas. Huge market potential in the east also becomes a prominent factor influencing industrial distribution. Liu and Zhao (2010) have verified markets of intermediate goods and final products make up motives of different selections of corporate locations from different aspects. Industrial agglomeration may bring about multiple positive effects, which will offset negative effects from consistent with the theoretical basis of the new economic geography, the Paper has adopted the classification of other scholars to include it into the new economic geography. 31
3 rising costs on production factors and prevent enterprises in the East from transferring to Central and Western areas. Good industrial foundation has been laid in Eastern areas taking lead in development, a mass of industrial clusters established through various relevant forms and efficient collaborative network of production formed, conductive to raising trading efficiency and granting enterprises external scale economy. Lu and Tao (2007) steadily support positive impacts of positive agglomeration externality such as knowledge spillovers, information spillovers, labor market growth, and sharing of input factors on industrial agglomeration. Li and Peng (2010) pointed out that industries with larger investment and longer industrial chain tend to develop in regions with solid industrial foundation and higher level of urbanization and will, once gathering toward a certain area, drive development of other industries and encourage multiple industries to gather in this area. Liu and Zhang (2010) also found that variables such as regional specialization and industrial diversity had apparently positive influence on the number of enterprises expected into this area. In fact, quite a few researches have realized that present evolving spatial pattern of China s industries is an endogenous result of agglomeration of existing economic activities. Industrial agglomeration does not always bring about positive impacts on development, and negative ones gradually appear when the agglomeration degree continues to increase. Changes in industrial location cannot owe merely to rising factor cost. He and Pan (2010) show that agglomeration of some industries in a city going beyond a certain extent will harm future industrial growth, indicating existence of crowding effect. Tang et al. (2010) found that obvious crowding of production factors occurred in the Southeast coastal areas due to over agglomeration in some manufacturing industries. Wang (2010) pointed out that crowding effect of industrial agglomeration, accompanying increase in costs on labor, land, energy and environment, owes to inter-industry and intra-industry enterprise competition which is one of the sources, and plays an important role in transfer of real estate industries from Guangdong to Jiangxi, Hunan and Sichuan. Zhou and Zhu (2013) found that after 2003, disciplinary role of crowding effect of employment and enterprise density becomes more and more prominent as economic agglomeration degree increases. Impacts of crowding effect on different industries are differently featured. Yan and Qiao (2010) found that crowding effect of employment has appeared in agglomeration of China s low-skill intensive or labor-intensive industries, while He and Wang (2012) held that labor-intensive industries are susceptible to negative effects of crowding effect. However, mechanism for changes in spatial pattern of Chinese industries is not fully understood recently. Despite of general characteristics of changes in industrial spatial pattern clearly indicated, strict empirical analysis is absent in proving contribution of changes in comparative advantages to varying locations of these industries, so is corresponding research in description from the perspective of dynamics of agglomeration externalities. There is a reason to believe that changes in industrial spatial pattern subject to composite influencing mechanism and that industrial transfer may correspond to changes in comparative advantages, which in fact owes to agglomeration externality. The essence of such misunderstanding or dispute lies in difference in understanding of endogenous mechanism of increase in factor cost. As a result, an overall analysis of factors influencing evolution of industrial spatial pattern is quite indispensable. Indeed, both Neo-classical trade theory and New economic geography explain industrial location with adaptation of different spatial scale. Davis and Weinstein (1996, 1999) compared researches into Japanese industrial spatial structure and those into member countries of OECD, indicating that agglomeration advantages lead domestic production structure and interregional division but comparative advantages lead international ones. Domestic interregional trade cost falls far below international one, while mobility of domestic interregional factors is obviously stronger than that of international one. Strong interregional factor mobility may weaken impacts from innate comparative advantages; nevertheless, impacts of new economic geography factors represented by market and agglomeration economies become stronger (Davis and Weinstein, 1999). Thus, we cannot simply and mechanically apply theory of comparative advantages to analysis of Chinese industrial spatial pattern, instead, agglomeration economies must be a main factor for consideration. In addition, recent researches either analyze main industries of changes in spatial distribution or main factors influencing location changes, but neither of the two deeply analyzes differences in mechanism influencing changes in industrial locations, which are emphasized on by this paper in analysis. In terms of research methods, despite most researches adopt econometrics, but ignore spatial autocorrelation. As a matter of fact, on one hand, regional input-output, technological and knowledge diffusion, flow of factors and overflow in other regions will bring about spatial interaction to regional industrial development; on the other hand, since spatial data based on administrative division is used in analysis and border of administrative region is often different from that of actual functional zone, measuring errors in adjacent administrative regions may associate with each other (He and Zhang, 2006). Both of the two may result in spatial correlation existing in regional industrial development. Therefore, this paper adopts spatial panel model and makes an improvement in ignorance by previous models of spatial autocorrelation so as to enhance strictness of empirical analysis. This paper will be arranged as follows: the second part mainly describes main characteristics of changes in China s economic spatial pattern since the reform and opening up, analyzes new trends in changes in the 21 st century and then discusses in details spatial-temporal characteristics and industry characteristics of evolution of spatial pattern from the 32
4 perspective of manufacturing industry; the third part will put forward spatial panel models for factors influencing changes in spatial pattern of manufacturing industry and the fourth part will make a detailed analysis of estimations; the final part will make a conclusion to the whole text and come up with implication and corresponding policies. 2. Measurement and Data 2.1 Getis-Ord Gi* Statistics The Getis-Ord G* statistics is used to determine whether or not there are spatial relationships in the data. The Getis-Ord G* analysis is able to detect if there are statistically significant clusters of a given phenomenon. This statistic identifies hot spots, or concentrations in spatial distributions in which areal units and their neighbors have similar values of a given phenomenon. G * i Z G * i n WX j1 ij n j1 X j j i * i G E G Var G * * i where X j is the observed value of X at location j, W ij is a symmetric one/zero spatial weight matrix with ones for all links defined as being neighbored to each other, and with zeros for not adjacent links. E(G i ) is expected value of G i, and Var(G i ) is variation of G i. Z(G i ) is standardized value of G i. A large positive Z(G i ) implies that large values of X j (values above the mean X j ) are adjacent to point i (hot spots). A large negative Z(G i ) means that small values of X j are adjacent to point i (cold spots). 2.2 Industrial Locational Gini Coefficient Industrial locational Gini is a common measure of geographical concentration, which is proposed by Krugman(1991) first. Many researches such as He et al.(2007), Wen(2004) had adopted this methodology to measure uneven distribution of manufacturing industries in term of different spatial unit. A Gini coefficient for each industry i is calculated as follows: n n 1 G s s i 2 ij ik 2nsi k1 j1 where S ij is the share of industry i in area j, S ik is the share of industry i in area k, n is the number of regions and S i is the mean of shares. The industry Gini coefficient is equal to twice the area between a 45-degree line and a Lorenz curve. For each industry i, the Lorenz curve is derived by ranking S ij in descending order and plotting its cumulative on the vertical axis against the cumulative of the number of regions on the horizontal axis (with each interval having the same width, equal to 1/n). The closer the distribution of industry i reaches to a uniform distribution, the smaller the index will be. If an industry is equally distributed across all regions the index will equal zero. An index close to one suggests that an industry is entirely concentrated in a region (Wen, 2004). 2.3 Inter-regional Shifts Our method for calculating interregional shifts in industrial employment is from Fuchs (1962). The index of redistribution of industries is based on the regional comparative gain or loss of an individual industry, which is defined as follows: E RGrowth E E E k i, k i, k i, k t tt 0 t t0 k t0 where E i,k t0 is the level of employment in industry k=1,,n for region i in the initial year t 0 and E i,k t is the k k corresponding level at the end of a given period. E t0 and E t are the national levels of employment in industry k in the first and final years, respectively. According to this definition, locational change is not the physical movement of an industry from one region to another, but the difference between the actual level of an industry in a region at the end of the period and what the level would have been if the region had grown at the national rate. If a region grows faster than 33
5 the whole nation, E t i,k E t0 k i,k E t Ek t 0 > 0, then that region has experienced a comparative gain. If the region grows slower, the difference between the actual level and the hypothetical level is a comparative loss (Bao et al. 2012). 2.4 Data This paper discovers the fact of spatial distribution of manufacturing industries in China from 2001 to Due to lagged variables, data used in empirical test is only from 2003 to 2010, which is all from Annual Survey of Industrial Firms dataset, which is conducted by National Bureau of Statistics (NBS) in China. This dataset contains all state-owned enterprises (SOEs) and nonstate-owned enterprises with annual sales of more than 500 million Yuan. The dataset provides detailed information on firms' identification, operations and performance, including location, industry code, and employment. Regional GDP (in constant price in 2001), population, and areas are from China Statistical Yearbook for regional economy for corresponding years. Highway mileage among regions is from electronic edition of China Traffic Map. The paper only discuss segmented industry of manufacturing, excluding mining and public utilities industries like logging, power, gas, due to these industries highly rely on local natural resource or local demand. Government regulatory industry is also excluded like tobacco processing industry, as they are not classified as footloose industry. The paper includes 27 sub-industries of manufacturing, according to industry classification of industrial census and economic census, using double-digit industry caliber. The geographical unit of analysis is prefecture-level-and-above area. This paper only studies the situation of mainland China, Hong Kong, Macau and Taiwan is not included. During 2001 to 2010, the only change of administrative division at prefectural level in China is that Zhongwei in Ningxia Autonomous Region is taken away of Guyuan city and Wuzhong city in 2004, and name changing for other area like Simao in Yunnan province is renamed by Puer, Hezhou distinct in Guangxi province is changed to Hezhou city. Therefore Zhongwei, Guyuan and Wuzhong are combined together for consistence which covers little area of whole China; it can be predicted to affect less for empirics. Beijing, Tianjin and Shanghai are taken as prefectural level area for equally small areas. In total, the data is from 337 prefectural level units. 3. Evidence for Spatial Dynamics of Manufacturing Industries 3.1 Changes in General Economic Spatial Pattern It can be seen from Figure 1(a) that in the early era of reform and opening-up, especially from the 1990s to early 21 st century, economic activities presents such a polarized agglomeration toward the coastal China that GDP in Eastern, Southern and Northern coastal China takes up an increasingly large proportion in nationwide one; however, since around 2005, proportion of GDP in coastal areas has gradually dropped while that in the Midstream of the Yellow River and Yangtze River, Southwest and Northeast has gradually increased, indicating economic growth of the inland has already been faster than that of coastal areas. Figure 1(b) shows that industrial development has also experienced similar spatial transfer and the proportion of industrial added value in inland regions mainly including the Midstream of the Yellow River and the Yangtze River and the southwest started to gradually increase before 2005, which is an indicator of earlier dispersal of industrial activities from coastal areas toward inland. In general, approximately since 2005, industrial dispersal from coastal areas to inland has been more and more obvious and economic growth in the Midstream of the Yellow River and the Yangtze River, Southwest and Northeast near coastal areas is even more rapid, while growth in the Northwest suffers difficulty in speeding up. It is necessary to make an investigation into changes in hot spots in order to more intuitively express evolving spatial pattern of industrial growth. This paper takes growth speed of industrial added value in constant prices as an indicator to figure out spatial correlation index(getis-ord Gi* ) in various regional units during and respectively, visualizes the space by GIS software and creates a spatial evolution diagram of hot spots with industrial growth in China by dividing regional Gi* statistics into 6 categories from high to low. The distribution of hot spots during the two periods shows that these spots with industrial growth have transferred from coastal areas to inland (figure 2). During , hot spots other than Inner Mongolia concentrated in coastal areas but have basically transferred to Central, Western and Northeastern areas since


")


")
")


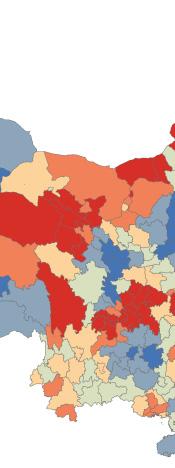


6 Applied Economics and Finance Vol. 4, No. 3; 2017 (a) GDP (b) industrial value added Figure 1. Variation of proportion of eight regions 2 economic scale to national economic scale (a) (b) Figure 2. Evolving spatial pattern of industrial growth in hotspo areas of China 2 The economic regionalization scheme proposed in the report of Strategy and Development (2005) issued by the State Council Development Research Center. Policy over Regional Harmonious 35
7 3.2 Evolving Spatial Distribution of Manufacture Industries Next, we are to use the approach of Fuchs (1962) to further analyze the spatial shift characteristics of different industries. The Table 1, is calculated by using the inter-regional shifts statistic of Section 2.3, shows that the change tendency of industrial spatial distribution in and was vastly different. From 2001 to 2004, the overall industrial growth rate in the East was rapid and the industrial spatial distribution still reflected the polarized development tendency; to be specific, among the 27 manufacture sectors, the growth rate for 24 of them was higher than the national average rate and only the growth rate of Foods Production, Timber Processing, Bamboo, Cane, Palm Fiber & Straw Products, as well as Petroleum Processing, Coking Products, Gas Production & Supply was lower than the national average rate, which demonstrated that these several sectors held the tendency to be spread from East to other regions; regarding to other regions, the growth rate for most of sectors was lower than the national average rate; moreover, in the Central region, only the growth rate of Petroleum Processing, Coking Products, Gas Production & Supply, Raw Chemical Materials and Chemical Products, as well as Medical & Pharmaceutical Products was higher than the national average rate; in the western region, only the growth rate of Beverage Production, Timber Processing, Bamboo, Cane, Palm Fiber & Straw Products, Petroleum Processing, Coking Products, Gas Production & Supply, Raw Chemical Materials & Chemical Products, as well as Chemical Fibers was higher than the national average rate; in the Northeast, only the growth rate of Food Processing, Timber Processing, Bamboo, Cane, Palm Fiber & Straw Products, as well as Chemical Fibers was higher than the national average rate. The results show that the regional industrial distribution changes during this period was mainly manifested on the few sectors and there were just only a few sectors spread from the eastern region to the central and western regions. However, from 2005 to 2010, the obvious changes took place on the industrial spatial distribution and the industrial spatial dispersion from eastern region to the central and western regions became the main tendency. Regarding to the eastern region, the growth rate for most sectors (18 of the 27 manufacture sectors) had been lower than the national average; meanwhile, the industrial categories were almost extended to every kind of sectors; in addition to the previous Food Production, Timber Processing, Bamboo, Cane, Palm Fiber & Straw Products, as well as other few light industry sectors, now industrial categories were almost extended most of the light industry sectors, including Garments & Other Fiber Products, Furniture Manufacturing, etc; moreover, the spatial dispersion phenomenon had also taken place on many heavy industry sectors, including Nonmetal Mineral Products, Metal Products, Machinery & Equipment Manufacturing, etc; furthermore, the growth rate of the relatively high-technology industry, including Electric Equipment & Machinery, Electronic & Telecommunications, etc was also lower than the national average; therefore, it can be known that at the present stage, the sectors spread from the eastern region to the central and western regions was not only confined to a comparatively single industrial category: actually, it was involved with the typical labor-intensive industries, as well as the capital-intensive and technology-intensive industries, including both of the light industrial sectors and the heavy industry sectors. From the changes in other regions, it can be known that the central region was the major industry spread destinations and the growth rate for most sectors (23 of the 27 manufacture sectors) was higher than the national average; relatively speaking, the growth rate for only 12 sectors in the western region and only 15 sectors in the northeastern region respectively was higher than the national average. The industrial dispersion showed a certain space order and it seemed that the central region nearer to the eastern region held more development advantages. From the industry characteristics, it can be known that the central region was involved with the more comprehensive sectors and it almost included all the transferred industries; meanwhile, the industry sectors undertaken by the western and northeastern regions were relatively unitary: to be specific, the western region was mainly involved with the light industry sectors, including Food Production, Leather, Furs, Down & Related Products, etc, as well as some heavy industry sectors, including Chemical Fibers, Rubber Products, etc; meanwhile, in addition to the industry sectors holding a relatively rapid development speed in the western region, the northeastrn region also witnessed an improved regional agglomeration degree for the relatively high-technology industry sectors, such as Electric Equipment & Machinery, Instruments, Meters, Cultural & Official Machinery, etc. 36
8 Table 1. Inter-regional shifts of manufacturing industries ( ) sectors East Central West Northeast East Central West Northeast Food Processing Food Production Beverage Production Textile Industry Garments & Other Fiber Products Leather, Furs, Down & Related Products Timber Processing, Bamboo, Cane, Palm Fiber & Straw Products Furniture Manufacturing Papermaking & Paper Products Printing & Record Pressing Stationery, Educational & Sports Goods Petroleum Processing, Coking Products, Gas Production & Supply Raw Chemical Materials & Chemical Products Medical & Pharmaceutical Products Chemical Fibers Rubber Products Plastic Products Nonmetal Mineral Products Smelting & Pressing of Ferrous Metals Smelting & Pressing of Nonferrous Metals Metal Products Machinery & Equipment Manufacturing Special Equipment Manufacturing Transportation Equipment Manufacturing Electric Equipment & Machinery Electronic & Telecommunications Instruments, Meters, Cultural & Official Machinery Empirics for Mechanism of Evolving Industrial Spatial Pattern 4.1 Theoretical Framework and Econometric Model According to the industrial growth models put forward by Glaeser et al.(1992) as well as Henderson et al. (1995), it can be known that the marginal productivity of the competitive manufacturer is equal to the wage; the relational model of 37
9 the industrial growth is just as shown in the Equation (1): A t refers to the factors affecting the production efficiency during the period of t while w refers to the wage, which indicates the marginal productivity of the labor input. The higher the marginal productivity in a region, the more the new productive forces will be attracted and then the employment scale in this region will be gradually increased; on the contrary, if the industrial marginal productivity in a region is reduced, the productive forces will be shifted out and it will lead to the gradual reduction of the industry scale, which thus will be manifested as the change of the manufacture s spatial pattern within the region. Therefore, the model designed by the Paper will take the regional employment scale of each industry as the explained variable to represent the constitutional unit of the manufacture s spatial pattern and then the changes of the employment scale in different regions will reflect the changes of the pattern. The logarithmic form of the model s Cobb Douglas production function is as shown in Equation (2). The main purpose of this paper is to carry out a systematic analysis over the factors influencing the evolution of the industrial spatial pattern in China over recent years, especially to distinguish the difference between the two mechanisms, that is, comparative advantage and new economic geography. From the perspective of the theory of comparative advantage, the labor cost shall be the most important factor and the low labor cost is conducive to attract the industrial distribution. According to the theory of new economic geography, the market potential and industrial linkage shall be the important factors affecting the industrial location. In the region, any industry will bring about the occurrence of the agglomeration process through a dual identity of the manufacturer and consumer of the product, that is: the region possessing the industry sectors with a relatively large scale usually will provide various kinds of intermediate products, which means the production of the downstream industry has a lower cost; on the contrary, the region possessing a large production scale for finished products will also provide huge market for the manufacturers of the intermediate product. Meanwhile, agglomeration economy of the economic activities is also an important factor affecting the industrial distribution. Due to the existence of the localization economy, the industry generally will choose the region with the agglomeration of the similar industry; on the other hand, due to the existence of the urbanization economy, the industry generally will be gathered in the urbanized area with the agglomeration of a variety of industries. Actually, the mutual agglomeration of the enterprises holding a forward and backward linkage will improve the production efficiency; on the other hand, through the technology diffusion, knowledge spillover and other means, it will be conductive to improve the production efficiency of the enterprises associated with each other through mutual agglomeration. However, the excessive industrial agglomeration in a region will drive up the prices of labor, capital, resources and other productive factors and it hence will lead to the crowding effect and reduce the profitability of enterprises; therefore, it is necessary to promote the enterprises to choose a location with less competitors so as to prevent the further agglomeration of industry in space. Therefore, upon the basis of Equation (2), we further extend (Equation (3)) the factor (A t ) affecting the production efficiency and then introduce the factors of new economic geography, that is, market potential (MP), urbanization economy (UE), localization economy (LE) and congestion effect (CG): specifically, the latter three are different performances of agglomeration externality. Actually, the economic activities are not only affected by the invisible hand of market, but also shall be subject to the regulation of the visible hand of government; therefore, the model is added with the government s industrial policies to be other control variables (OC). Eventually, the design of the model divides the influencing factors into four aspects: firstly, it is the influence of the regional scale, which will be measured by market potential and population size; secondly, it is the change of the factor cost, which will be measured by Labor cost; thirdly, it is the externality of the agglomeration, which will be measured by agglomeration economy and congestion effect; fourthly, it is the influence of other regional characteristics, which will be mainly measured by government s industrial policies. To be specific, the market potential and agglomeration externality will be used to illustrate the industrial location change predicted by the new economic geography; the labor cost will be used to illustrate the industrial location change predicted by the theory of comparative advantage. Furthermore, the influence of regional characteristics on the industrial location shall go through a certain period of time so that the explanatory variable is determined as the variable with two years lagged; finally, the setup for the extended basic model is as shown in Equation (4): A F N w (1) ' t t t N w A ln ln ln (2) t t t N w MP UE LE CG OC ln ln G,,,, (3) t t t t t t t 38
10 ln( N ) ln( pop ) ln( MP ) ln( wage ) ln( LE ) ln( UE ) t t2 t 2 t 2 t 2 t 2 ik 1 i 2 i 3 i 1 ik 2 i ln( CG ) POLICY t2 t2 3 i 1 k where N ik t shows the number of workers in the ith region in the kth industry during the tth period. α, β and γ are regression parameters, and ε represents an error term. pop refers to population in each region; wage represents the cost paid to labor. Due to lack of regional wage data, we choose regional GDP per capita instead. Normally, expecting income is higher in a region with higher GDP per capita, which means it will cost more to hire a worker. MP refers market potentials. In the spirit of the Harris (1954) concept, we have computed the following market potential measure as equation (5). This definition takes account of each country s own economic size and area as well as of its distance from other markets (in terms of GDP). Besides its size, one expects the accessibility of a region from others to be another critical determinant of firms and workers locational decisions (Combes et al. 2008). 1 E j j E i MPi, i j (5) N ij i 2 / 1/2 i Areai 3 Where i and j denote regions, N is the number of countries in the sample, E i is the GDP in region i, and δ stands for geographical distance. Bilateral distances δ ij are defined as the distances between capital cities. Intra-regional distances δ i are computed as one third of the radius of a circle with the same area as the region in question. In our specification, the impact of localization economies (LE) is assumed to be captured by the initial employment level. If the coefficient of ln(le) is significantly positive, geographical concentration of industry increases over time. Note that if large base period employment partly captures congestion specific to the particular industry (e.g., decreased availability of favored land and required labor), β 1 can be negative even if the localization economies are present. UE stands for a proxy for the urbanization economies or the extent of the diversification of manufacturing industries in a prefecture, which is measured by equation (6). That is, the diversification is measured by 1 minus the Herfindahl index of concentration of the jth manufacturing industry in the ith prefecture. 1 / 2 ij i (6) UE N N As a measure of congestion, we used the economic density in terms of GDP per area (CONG). If the major motives for locating new establishments in less developed areas are to avoid the congestion and to seek cheap land and labor, the coefficients of this variable (i.e., β 2 ) will be negative. We added one more explanatory variable to control for the effect of other characteristics of the prefecture, which may be related to industrial development. We used locational industrial policy dummy to control for the effects of government behaviors. It is 1 if the industry belongs to key domains proposed by the eleventh five-year plan and the twelfth five-year plan, whereas, it is 0 if doesn t. 4.2 Spatial Panel Model Actually, the existence of the spatial autocorrelation in the regional industrial development is an influencing factor, which cannot be neglected; if the original model is applied directly to carry out the estimation with this kind of spatial autocorrelation neglected, the errors for the estimation results might be caused. In fact, through the computation over the Global Moran I 3 of the manufacture s sectors(table 2), it can be found out that each sector holds an obvious spatial autocorrelation so that it is necessary to take advantage of the spatial econometric model to modify the original model. The spatial effects demonstrated by the spatial correlation can be illustrated by two models: when the spatial dependency between the variables is crucial to the model and there is the spatial autocorrelation, it will be suitable to use the spatial lag model (SLM); when the model error term is related to the space data, it is necessary to use the spatial error model (SEM). The spatial lag model (SLM) is to introduce the spatial lag variables of the industry scale for each region into the model 3 The calculation method of Global Moran I has been clearly defined and to simplify the article content, the calculation method of the index is omitted. 39 (4)
11 so as to illustrate that a region s industrial rise and decline might be directly associated with the industry changes of the surrounding areas and within the whole system; the original model is transformed into Equation (7): the spatial lag t dependent variable W ln( N ik ) is an endogenous variable, which reflects the impact exerted by the space distance on the regional industrial development, while ε is a random error vector in normal distribution. ln( N ) ln( pop ) ln( MP ) ln( wage ) ln( LE ) ln( UE ) t t2 t2 t2 t2 t2 ik 1 i 2 i 3 i 1 ik 2 i ln( CG ) POLICY W ln( N ) t2 t2 t 3 i 1 k ik 2 ~ N(0, ) The spatial error model (SEM) is to embody the spatial autocorrelation of the industrial scale among the regions through the change of the error term; the original model is transformed into Equation (8): is a random error term vector, is the spatial error coefficient of the dependent variable vector and a random error vector in normal distribution. t t2 t2 t2 t2 t2 ln( Nik ) 1 ln( popi ) 2 ln( MPi ) 3 ln( wagei ) 1 ln( LEik ) 2 ln( UEi ) (8) ln( CG ) POLICY t2 t2 3 i 1 k W (7) 2 ~ N(0, ) The spatial weight matrix W in the spatial panel model is no longer the N*N square matrix based on the cross sectional data (N refers to the individual number of the cross section) but a (N*T)*(N*T): W W W The non-diagonal elements in the matrix W are all 0 while each element on the diagonal line is a 337*337 square matrix (the regions analyzed by the Paper are 337 in total), W 2003 = =W This Paper has chosen the most commonly used simple binary weight matrix and the followed decision rule is the Rook contiguity, which is: when two regions share a same border will be regarded as being adjacent. The setup mode of the Matrix W is shown as follows: the elements on the main diagonal line are 0: if region i is adjacent to region j, and then Wij will be 0, or it will be 0. Through the line standardized processing, W uses every element to divide the sum of elements on the line so as to make the sum of elements for each line equal to (9) 40
12 Table 2. Global Moran's I of Manufacturing Industries sectors Global Moran's I sectors Global Moran's I Food Processing *** Chemical Fibers *** Food Production *** Rubber Products *** Beverage Production *** Plastic Products *** Textile Industry *** Nonmetal Mineral Products *** Garments & Other Fiber Products *** Smelting & Pressing of Ferrous Metals *** Leather, Furs, Down & Related Products *** Smelting & Pressing of Nonferrous Metals *** Timber Processing, Bamboo, Cane, Palm Fiber & Straw Products ** Metal Products *** Furniture Manufacturing *** Machinery & Equipment Manufacturing *** Papermaking & Paper Products *** Special Equipment Manufacturing *** Printing & Record Pressing *** Transportation Equipment Manufacturing *** Stationery, Educational & Sports Goods *** Electric Equipment & Machinery *** Petroleum Processing, Coking Products, & Gas Production & Supply *** Electronic & Telecommunications *** Raw Chemical Materials & Chemical Products *** Instruments, Meters, Cultural & Official Machinery *** Medical & Pharmaceutical Products *** Note: * = significant at 10% level; ** = significant at 5%;*** = significant at 1%. 4.4 Results and Analysis As for the above two models, if the ordinary least squares(ols) is still adopted for the estimation, the coefficient estimation value might be deviated or invalid; therefore, usually, the maximum likelihood(ml) method will be adopted to estimate the parameters of spatial lag model (SLM) and spatial error model (SEM). In general, when the spatial econometric model is selected, the following three aspects will be mainly observed: maximum likelihood estimator, as well as inspection status for LM-Error and LM-Lag. The spatial panel program will firstly carry out the OLS estimation over the model and then it will put forward the judgment criterion according to Anselin(1988) and then choose the corresponding spatial econometric model to carry out the maximum likelihood estimation, the results of which are as shown in Table 3 and Table 4. Because there are numerous industries, the paper does not to analyze them one by one and12 industries have been selected roughly according to the difference of the industrial characteristics to carry out the econometric analysis. Overall, the significant negative does not take place on the estimation value of the wage variable among all the investigated industries; on the contrary, the significant positive takes place on the seven industries, which demonstrates that the increase of the labor cost is not an influencing factor promoting the change of the industrial spatial distribution; and the explanatory variables of the new economic geography over the industrial location change have shown the significance in most industries; and the explanatory variables of the new economic geography over the industrial location change have shown the significance in most industries: it also verifies that, compared with the comparative advantage, the new economic geography is able to better explain the judgment over the industrial distribution among the domestic regions and it also demonstrates that the endogenous mechanism for the evolving agglomeration of the economic activities is the real cause leading to the changes of the industrial spatial distribution in China; the market potential and agglomeration economy reduces the impact exerted by the increase of the factor-input costs while the congestion effect caused by the agglomeration sifts out the industry weak in competitiveness and drives the changes of the industrial distribution; the increase of the factor-input costs is an important manifestation of the congestion effect and it definitely will reduce the attraction of the regional enterprise layout; however, the fundamental cause leading to the industrial location change is not the factor cost itself and, just like a kind of symbiosis, it can only embody the influence together with other factors. From the perspective of different industries, the factors influencing the spatial distribution change have a certain difference. The estimation value for the market potential coefficient and that for the localization economy variable coefficient in Food Production, as well as Garments & Other Fiber Products are significantly positive and negative respectively, which demonstrates that the market potential shall be the main agglomeration force for the industrial 41
13 spatial distribution while the intensified competition among the same industry caused by the over high industrial spatial agglomeration degree shall be the main diffusive force; as for the Beverage Production, the estimation value both for the market potential coefficient and the wage coefficient is significantly positive, which demonstrates that this industry tends to be close to the market and the region characterized with a higher development level; the estimation coefficient for the wage variable in the Printing & Record Pressing is significantly positive, which demonstrates that the demand over this industry is higher in the region characterized with a higher economic development level, while the estimation coefficient both for the localization economy and congestion effect is significantly negative, which demonstrates that, on the one hand, the intensified competition among the same industry in a region will lead to the deterioration of the survival environment, and, on the other hand, the Printing Industry is more vulnerable to the negative effects of other economic activities so that the industrial spatial diffusion will be caused; the coefficient estimation values for the market potential, wage level, urbanization economy and localization economy in the Raw Chemical Materials and Chemical Products are all significantly positive, which demonstrate that, in addition to the fact that this industry tends to be close to the market and be distributed in the region characterized with high economic development level, the industrial diversity and the agglomeration of the same industry shall be the important centripetal force for its location selection; moreover, no obvious negative effect has taken place on the explanatory variable, which demonstrates that at present there is no a consistent cause leading to the spatial diffusion of this industry; as for Medical & Pharmaceutical Products, the estimation values for the market potential and wage level coefficients are significantly positive, which demonstrate that this industry needs to be close to the market and the region characterized with a higher economic development level will hold more capacity to develop the Medical & Pharmaceutical Products; meanwhile, just like the Raw Chemical Materials and Chemical Products, there is no an obvious explanatory variable to illustrate the cause leading to the change of the industrial diffusion; as for Smelting & Pressing of Ferrous Metals and Smelting & Pressing of Nonferrous Metals, the estimation value for the market potential coefficient is significantly positive while that for the localization economy variable coefficient is significantly negative, which jointly demonstrate that getting close to the market shall be the centripetal force to drive the industrial agglomeration while the competition among the same industry shall be the centrifugal force to drive the industrial spatial dispersion; however, what is the difference falls on the fact that the urbanization economy in the Smelting & Pressing of Ferrous Metals takes on a significant negative effect while that in the Smelting and Pressing of Non-ferrous Metals takes on a significant positive effect, which demonstrate that the development of the regional industrial diversity, to some extent, will exert a crowding-out effect on the Smelting and Pressing of Ferrous Metals while that will be conductive to improving the development environment of the Smelting and Pressing of Non-ferrous Metals; in the equipment manufacturing industry, two sectors, that is, Machinery & Equipment Manufacturing and Transportation Equipment Manufacturing, have been selected; as for the two sectors, the market potential is the centripetal force promoting the regional industrial agglomeration and they all tend to be distributed to the region characterized with a higher economic development level; however, as for the former, the economy localization has an obvious positive effect while as for the latter, it shows obvious negative effect, which demonstrate that the regional competition among the same industry for the manufacture of transportation equipment has deteriorated industrial development environment while the manufacture of general-purpose equipment prefers to the development mode with the agglomeration of the same industry. However, as for the Transportation Equipment Manufacturing, both of the urbanization economy and the regional economy density show an obvious positive effect, which demonstrate that active regional economy and high industrial diversity are conducive to enhance the attraction on this industry. As for the Electric Equipment & Machinery, the market potential is a significant centripetal force while the urbanization economy shows an obvious centrifugal force, which demonstrate that the industry is affected by the negative competition in the industrial diversified development; in Electronic & Telecommunications, what is special falls on the fact that the market potential does not show a significant effect, which might be credited to the cause that from the start to now, this industry has always been relatively centrally distributed in the coastal region, where the market potential is also relatively higher so that the market potential will not be an obvious factor influencing the industrial location; however, from the perspective of the factors influencing the industrial spatial distribution, the localization economy shows an obvious negative effect: actually, the regional excessive agglomeration of the same industry deteriorates the development environment, which promotes the industry to carry out the location adjustment, while the economic density shows an obvious positive effect, which demonstrates that the enhancement of the regional economic activities is conducive to the development of the industry. In conclusion, the main factor causing spatial dispersion for most industries is the regional fierce competition among the same industry; since the reform and opening up, many industries in the eastern coastal region has formed many industrial clusters: the scale of the sub-sectors of some manufacturing industries in a certain city or even county often occupies most of the country's market share and even occupies a large proportion in the world. Based on the analysis of this paper, the form for the high-degree agglomeration of the same industry in a region has caused a strong negative effect and the localization economy conductive to the industrial development has gradually faded away, which has even becomes one of the main causes promoting the industrial spatial dispersion. In addition, most of the estimation 42
Comparative Advantage, Scale Economy and Regional Specialization: An Empirical Analysis Based on China s Industries. Zheng LU
 Comparative Advantage, Scale Economy and Regional Specialization: An Empical Analysis Based on China s Industries Zheng LU Xiang DENG School of Economics, Sichuan University, Chengdu, China Abstract: Current
Comparative Advantage, Scale Economy and Regional Specialization:An Empirical Analysis on China s Industries
 Sichuan University From the SelectedWorks of Zheng Lu (Chinese: 路征 ) September, 01 Comparative Advantage, Scale Economy and Regional Specialization:An Empical Analysis on China s Industries Zheng Lu Xiang
10. Empirical Study of Regional Innovation Capability and Economic Convergence in China
 10. Empirical Study of Regional Innovation Capability and Economic Convergence in China Chaofeng Yang, Zhiyun Zhao and Zhijuan Zhang Introduction Given the correlation of economic activities between regions
Empirical Study on the Relationship between Chemical Industry Agglomeration and Regional Economic Growth in Anhui Province
 1477 A publication of CHEMICAL ENGINEERING TRANSACTIONS VOL. 62, 2017 Guest Editors: Fei Song, Haibo Wang, Fang He Copyright 2017, AIDIC Servizi S.r.l. ISBN 978-88-95608-60-0; ISSN 2283-9216 The Italian
Analysis of Spatial-Temporal Characteristics and Pattern Evolution of Fishery Geographic Agglomeration in China
 2016 International Conference on Education, Management Science and Economics (ICEMSE-16) Analysis of Spatial-Temporal Characteristics and Pattern Evolution of Fishery Geographic Agglomeration in China
A Spatial Econometric Approach to Model the Growth of Tourism Flows to China Cities
 April 15, 2010 AAG 2010 Conference, Washington DC A Spatial Econometric Approach to Model the Growth of Tourism Flows to China Cities Yang Yang University of Florida Kevin. K.F. Wong The Hong Kong Polytechnic
The challenge of globalization for Finland and its regions: The new economic geography perspective
 The challenge of globalization for Finland and its regions: The new economic geography perspective Prepared within the framework of study Finland in the Global Economy, Prime Minister s Office, Helsinki
Analysis for Regional Differences and Influence Factor of Rural Income in China
 Modern Economy, 2012, 3, 578-583 http://dx.doi.org/10.4236/me.2012.35076 Published Online September 2012 (http://www.scirp.org/journal/me) Analysis for Regional Differences and Influence Factor of Rural
The Contribution Rate of Thrice Industrial Agglomeration to Industrial Growth in Ningxia The Calculate Based on Cobb-Douglas Function.
 International Conference on Economics, Social Science, Arts, Education and Management Engineering (ESSAEME 2015) The Contribution Rate of Thrice Industrial Agglomeration to Industrial Growth in Ningxia
Selected Papers from the 2 nd World Forum on China Studies (Abstracts) Panel 12 Shanghai's Development in Multi-scaled Perspectives
 Panel 12 Shanghai's Development in Multi-scaled Perspectives") Shanghai Academy of Social Sciences World Forum on China Studies Selected Papers from the 2 nd World Forum on China Studies (Abstracts) Panel 12 Shanghai's Development in Multi-scaled Perspectives Contents:
Shanghai Academy of Social Sciences World Forum on China Studies Selected Papers from the 2 nd World Forum on China Studies (Abstracts) Panel 12 Shanghai's Development in Multi-scaled Perspectives Contents:
LOCATIONAL PREFERENCES OF FDI FIRMS IN TURKEY
 LOCATIONAL PREFERENCES OF FDI FIRMS IN TURKEY Prof. Dr. Lale BERKÖZ Assist. Prof. Dr.S. SenceTÜRK I.T.U. Faculty of Architecture Istanbul/TURKEY E-mail: lberkoz@itu.edu.tr INTRODUCTION Foreign direct investment
Financial Development and Economic Growth in Henan Province Based on Spatial Econometric Model
 International Journal of Contemporary Mathematical Sciences Vol. 12, 2017, no. 5, 209-216 HIKARI Ltd, www.m-hikari.com https://doi.org/10.12988/ijcms.2017.7727 Financial Development and Economic Growth
A Spatial Statistical Analysis on Intra-Country Economy in Chongqing From Inputs Point of View
 Management Science and Engineering Vol. 8, No. 4, 2014, pp. 1-7 DOI: 10.3968/6127 ISSN 1913-0341 [Print] ISSN 1913-035X [Online] www.cscanada.net www.cscanada.org A Spatial Statistical Analysis on Intra-Country
The Agglomeration Characteristics of Blue Economic Zone of Shandong Peninsula. Fuhui Jing 1, a, Lina Chang 2,b,Hong Wang3,c
 3rd International Conference on Education, Management, Arts, Economics and Social Science (ICEMAESS 2015) The Agglomeration Characteristics of Blue Economic Zone of Shandong Peninsula Fuhui Jing 1, a,
Comprehensive Evaluation of Social Benefits of Mineral Resources Development in Ordos Basin
 Studies in Sociology of Science Vol. 4, No. 1, 2013, pp. 25-29 DOI:10.3968/j.sss.1923018420130401.2909 ISSN 1923-0176 [Print] ISSN 1923-0184 [Online] www.cscanada.net www.cscanada.org Comprehensive Evaluation
The Regional Economic New Territory: the Features and the Engine of Economic Development in Inner Mongolia
 The Regional Economic New Territory: the Features and the Engine of Economic Development in Inner Mongolia ZHAO Xiuli, GUO Xueli School of Economics, Inner Mongolia Finance and Economics College, China,
A Study on Differences of China s Regional Economic Development Level Based on Cluster Analysis
 MATEC Web of Conferences 22, 0 5 022 ( 2015) DOI: 10.1051/ matec conf / 201 5 220 5 022 C Owned by the authors, published by EDP Sciences, 2015 A Study on Differences of China s Regional Economic Development
Chapter 4. Explanation of the Model. Satoru Kumagai Inter-disciplinary Studies, IDE-JETRO, Japan
 Chapter 4 Explanation of the Model Satoru Kumagai Inter-disciplinary Studies, IDE-JETRO, Japan Toshitaka Gokan Inter-disciplinary Studies, IDE-JETRO, Japan Ikumo Isono Bangkok Research Center, IDE-JETRO,
IDE Research Bulletin
 http://www.ide.go.jp IDE Research Bulletin Research Summary based on papers prepared for publication in academic journals with the aim of contributing to the academia Empirical studies on industrial clusters
Analysis of the Tourism Locations of Chinese Provinces and Autonomous Regions: An Analysis Based on Cities
 Chinese Journal of Urban and Environmental Studies Vol. 2, No. 1 (2014) 1450004 (9 pages) World Scientific Publishing Company DOI: 10.1142/S2345748114500043 Analysis of the Tourism Locations of Chinese
Variance Analysis of Regional Per Capita Income Based on Principal Component Analysis and Cluster Analysis
 0 rd International Conference on Social Science (ICSS 0) ISBN: --0-0- Variance Analysis of Regional Per Capita Income Based on Principal Component Analysis and Cluster Analysis Yun HU,*, Ruo-Yu WANG, Ping-Ping
Trade and Direct Investment across the Taiwan Strait
 Trade and Direct Investment across the Taiwan Strait - An Empirical Analysis of Taiwan and China s Accession into the WTO Ji Chou Chung-Hua Institution for Economic Research Shiu-Tung Wang National Taiwan
Spatial Aspects of Trade Liberalization in Colombia: A General Equilibrium Approach. Eduardo Haddad Jaime Bonet Geoffrey Hewings Fernando Perobelli
 Spatial Aspects of Trade Liberalization in Colombia: A General Equilibrium Approach Eduardo Haddad Jaime Bonet Geoffrey Hewings Fernando Perobelli Outline Motivation The CEER model Simulation results Final
Excessive Agglomeration and Labor Crowding Effect: An Empirical Study of China s Manufacturing Industry
 American International Journal of Humanities and Social Science Vol. No. ; April 06 Excessive Agglomeration and Labor Crowding Effect: An Empirical Study of China s Manufacturing Industry Yanling Xi School
A Numerical Simulation Analysis of (Hukou) Labour Mobility Restrictions in China
 Labour Mobility Restrictions in China") A Numerical Simulation Analysis of (Hukou) Labour Mobility Restrictions in China John Whalley Department of Economics, The University of Western Ontario and Shunming Zhang Department of Finance, School
A Numerical Simulation Analysis of (Hukou) Labour Mobility Restrictions in China John Whalley Department of Economics, The University of Western Ontario and Shunming Zhang Department of Finance, School
Correlation Analysis between Agglomeration Effect of Producer Service and Manufacture Labor Productivity in China
 American Journal of Industrial and Business Management, 2015, 5, 1-10 Published Online January 2015 in SciRes. http://www.scirp.org/journal/ajibm http://dx.doi.org/10.4236/ajibm.2015.51001 Correlation
Do Economic Reforms Accelerate Urban Growth? The Case of China
 Do Economic Reforms Accelerate Urban Growth? The Case of China Gordon Anderson* and Ying Ge** Abstract This paper examines the determinants of city growth in China. We provide evidence that economic reforms
Does agglomeration explain regional income inequalities?
 Does agglomeration explain regional income inequalities? Karen Helene Midelfart Norwegian School of Economics and Business Administration and CEPR August 31, 2004 First draft Abstract This paper seeks
Location Patterns of Manufacturing Industries in Tunisia
 Location Patterns of Manufacturing Industries in Tunisia Wided Mattoussi WIDER development conference: Think development Think WIDER Parallel session Made in Africa Motivation Firms enjoy positive externalities
CARPATHIAN JOURNAL OF FOOD SCIENCE AND TECHNOLOGY
 CARPATHIAN JOURNAL OF FOOD SCIENCE AND TECHNOLOGY journal homepage: http://chimie-biologie.ubm.ro/carpathian_journal/index.html EMPIRICAL STUDY ON CHINA DAIRY INDUSTRIAL CLUSTER AND INFLUENCE FACTORS-BASED
THE CURRENT TRADE SITUATION AND DETERMINANTS OF SINO-AUSTRALIA INTRA- INDUSTRY TRADE
 THE CURRENT TRADE SITUATION AND DETERMINANTS OF SINO-AUSTRALIA INTRA- INDUSTRY TRADE Lijun Jia Maoguo Wu SHU-UTS SILC Business School, Shanghai University, China Abstract Economic globalization has promoted
SPATIAL ANALYSIS OF POPULATION DATA BASED ON GEOGRAPHIC INFORMATION SYSTEM
 SPATIAL ANALYSIS OF POPULATION DATA BASED ON GEOGRAPHIC INFORMATION SYSTEM Liu, D. Chinese Academy of Surveying and Mapping, 16 Beitaiping Road, Beijing 100039, China. E-mail: liudq@casm.ac.cn ABSTRACT
Paul Krugman s New Economic Geography: past, present and future. J.-F. Thisse CORE-UCLouvain (Belgium)
") Paul Krugman s New Economic Geography: past, present and future J.-F. Thisse CORE-UCLouvain (Belgium) Economic geography seeks to explain the riddle of unequal spatial development (at different spatial
Paul Krugman s New Economic Geography: past, present and future J.-F. Thisse CORE-UCLouvain (Belgium) Economic geography seeks to explain the riddle of unequal spatial development (at different spatial
Impact on Demand for Water upon Entering WTO -A Taiwan Case Study
 Impact on Demand for Water upon Entering WTO -A Taiwan Case Study C.E. Chou, S.H. Hsu, P.C. Li and C.M. Tseng 5 th Conference on Global Economic Analysis June 5 7, 2002 Water Resources in Taiwan Unevenly
Is India s manufacturing sector moving out of cities? Ejaz Ghani ICRIER-HUDCO Seminar on Urbanization and the Competitiveness of Cities May 17, 2012
 Is India s manufacturing sector moving out of cities? Ejaz Ghani ICRIER-HUDCO Seminar on Urbanization and the Competitiveness of Cities May 17, 2012 An Outline Nearly two billion people are expected to
The Impact of Tianjin-Baoding Intercity Railway on the Traffic Pattern of the Jing-Jin-Ji Urban Agglomeration QI Lei1,a*,GUO Jing2
 3rd International Conference on Management, Education Technology and Sports Science (METSS 2016) The Impact of Tianjin-Baoding Intercity Railway on the Traffic Pattern of the Jing-Jin-Ji Urban Agglomeration
Urban Economics City Size
 Urban Economics City Size Utility and City Size Question: Why do cities differ in size and scope? While NYC has a population of more 18 million, the smallest urban area in the U.S. has only 13,000. A well
EXPLORATORY SPATIAL DATA ANALYSIS OF BUILDING ENERGY IN URBAN ENVIRONMENTS. Food Machinery and Equipment, Tianjin , China
 EXPLORATORY SPATIAL DATA ANALYSIS OF BUILDING ENERGY IN URBAN ENVIRONMENTS Wei Tian 1,2, Lai Wei 1,2, Pieter de Wilde 3, Song Yang 1,2, QingXin Meng 1 1 College of Mechanical Engineering, Tianjin University
Study on Spatial Structure Dynamic Evolution of Tourism Economic Zone along Wuhan-Guangzhou HSR
 Open Access Library Journal 2017, Volume 4, e4045 ISSN Online: 2333-9721 ISSN Print: 2333-9705 Study on Spatial Structure Dynamic Evolution of Tourism Economic Zone along Wuhan-Guangzhou HSR Chun Liu 1,2
Seaport Status, Access, and Regional Development in Indonesia
 Seaport Status, Access, and Regional Development in Indonesia Muhammad Halley Yudhistira Yusuf Sofiyandi Institute for Economic and Social Research (LPEM), Faculty of Economics and Business, University
External Backward Linkage and External Forward Linkage. in Asian International Input-Output Table
 Prepared for the 20 th INFORUM World Conference in Firenze, Italy External Backward Linkage and External Forward Linkage in Asian International Input-Output Table Toshiaki Hasegawa Faculty of Economics
A study on the design and analysis of the assessment system of China s financial ecological environment
 Available online www.jocpr.com Journal of Chemical and Pharmaceutical Research, 2014, 6(7):898-902 Research Article ISSN : 0975-7384 CODEN(USA) : JCPRC5 A study on the design and analysis of the assessment
A Study of Hotel Performance Under Urbanization in China
 A Study of Hotel Performance Under Urbanization in China Jian Ming LUO, Faculty of International Tourism and Management, City University of Macau, Macao. E-mail: kennyluo@cityu.mo Abstract This paper studied
Lecture 9: Location Effects, Economic Geography and Regional Policy
 Lecture 9: Location Effects, Economic Geography and Regional Policy G. Di Bartolomeo Index, EU-25 = 100 < 30 30-50 50-75 75-100 100-125 >= 125 Canarias (E) Guadeloupe Martinique RÈunion (F) (F) (F) Guyane
PubPol 201. Module 3: International Trade Policy. Class 4 Outline. Class 4 Outline. Class 4 China Shock
 PubPol 201 Module 3: International Trade Policy Class 4 China s growth The The ADH analysis Other sources Class 4 Outline Lecture 4: China 2 China s growth The The ADH analysis Other sources Class 4 Outline
Analysis on Competitiveness of Regional Central Cities:
 Int. Statistical Inst.: Proc. 58th World Statistical Congress, 2011, Dublin (Session IPS031) p.476 Analysis on Competitiveness of Regional Central Cities: the case of Yangtze River Delta Xiaolin Pang,
Evaluation Method on Geological Deposit Potential Value
 Evaluation Method on Geological Deposit Potential Value Zhihong Zhang & Wei Huang School of Accounting, Shandong Economic University, Jinan 250014, Shandong, China Ning Xu Aluminum Corporation of China
Research on the Influence Factors of Urban-Rural Income Disparity Based on the Data of Shandong Province
 International Journal of Managerial Studies and Research (IJMSR) Volume 4, Issue 7, July 2016, PP 22-27 ISSN 2349-0330 (Print) & ISSN 2349-0349 (Online) http://dx.doi.org/10.20431/2349-0349.0407003 www.arcjournals.org
A Case Study of Regional Dynamics of China 中国区域动态案例研究
 A Case Study of Regional Dynamics of China 中国区域动态案例研究 Shuming Bao Spatial Data Center & China Data Center University of Michigan 1:00 PM - 2:00 PM, Tue, Feb 6, 2018 EST USA A Case Study of Regional Dynamics
Chapter 10: Location effects, economic geography and regional policy
 Chapter 10: Location effects, economic geography and regional policy the Community shall aim at reducing disparities between the levels of development of the various regions and the backwardness of the
A Study on Trade of Complementarity among Xinjiang and Its Neighboring Countries
 A Study on Trade of Complementarity among injiang and Its Neighboring Countries inshu Gong School of Economics & Trade, Shihezi University Shihezi 832003, China Tel: 86-993-205-8996 E-mail: gxsjm10@sohu.com
Do bigger cities contribute to economic growth in surrounding areas? Evidence from county-level data in China
 Do bigger cities contribute to economic growth in surrounding areas? Evidence from county-level data in China Yan Liu School of Economics, Fudan University Xingfeng Wang China Academy of Urban Planning
Journal of Asian Business Strategy ON THE RELATIONSHIP BETWEEN FOREIGN TRADE AND REGIONAL DISPARITY IN CHINA IN THE POST-REFORM ERA
 2016 Asian Economic and Social Society. All rights reserved ISSN (P): 2309-8295, ISSN (E): 2225-4226 Volume 6, Issue 3, 2016, pp. 50-62 Journal of Asian Business Strategy http://aessweb.com/journal-detail.php?id=5006
R E SEARCH HIGHLIGHTS
 Canada Research Chair in Urban Change and Adaptation R E SEARCH HIGHLIGHTS Research Highlight No.8 November 2006 THE IMPACT OF ECONOMIC RESTRUCTURING ON INNER CITY WINNIPEG Introduction This research highlight
Geography and Growth: The New Economic Geography (NEG) Perspective
 Perspective") Geography and Growth: The New Economic Geography (NEG) Perspective Harry Garretsen DIMETIC Summer School, 30-6-2009, Pecs Nice timing for this lecture.. Right after Ron Boschma s lecture: is there life
Geography and Growth: The New Economic Geography (NEG) Perspective Harry Garretsen DIMETIC Summer School, 30-6-2009, Pecs Nice timing for this lecture.. Right after Ron Boschma s lecture: is there life
CHIOT: Estimating Historical Input-output Tables of China
 CHIOT: Estimating Historical Input-output Tables of China Chen LIN a,, Lei SHI b, Qian WEI a a The Center for Economic Research, Shandong University b State Environmental Protection Key Laboratory of Eco-industry,
Measuring Agglomeration Economies The Agglomeration Index:
 Measuring Agglomeration Economies The Agglomeration Index: A Regional Classification Based on Agglomeration Economies J. P. Han Dieperink and Peter Nijkamp Free University, The Netherlands* Urban agglomerations
Does the Expansion of Urban Construction Land Promote Regional Economic Growth in China? Evidence from 108 Cities in the Yangtze River Economic Belt
 sustainability Article Does the Expansion of Urban Construction Land Promote Regional Economic Growth in China? Evidence from 108 Cities in the Yangtze River Economic Belt Hualin Xie 1, Zhenhong Zhu 1,
Grey Correlational Analysis on Structure of Inbound. Tourism Industry of Xinjiang Province
 3rd International Conference on Education, Management and Computing Technology (ICEMCT 2016) Grey Correlational Analysis on Structure of Inbound Tourism Industry of Xinjiang Province Pingxin Han 1, Xiaoling
Global activity distribution patterns of top international Chinese contractors Chuan Chen1, a, Hongjiang Li1, b and Igor Martek2, c
 International Conference on Management Science and Innovative Education (MSIE 2015) Global activity distribution patterns of top international Chinese contractors Chuan Chen1, a, Hongjiang Li1, b and Igor
The Impact of Urbanization and Factor Inputs on China s Economic Growth A Spatial Econometrics Approach
 Economic Management Journal December 2018, Volume 7 Issue 2, PP. 145-154 The Impact of Urbanization and Factor Inputs on China s Economic Growth A Spatial Econometrics Approach Yajie Bai SHU-UTS SILC Business
Economic Geography of the Long Island Region
 Geography of Data Economic Geography of the Long Island Region Copyright 2011 AFG 1 The geography of economic activity requires: - the gathering of spatial data - the location of data geographically -
YANNICK LANG Visiting Student
 THE STUDENT ECONOMIC REVIEWVOL. XXVIII EXPLAINING BILATERAL TRADE FLOWS IN IRELAND USING A GRAVITY MODEL: EMPIRICAL EVIDENCE FROM 2001-2011 YANNICK LANG Visiting Student The concept of equilibrium was
Specialization versus spatial concentration: Which approach better defines the impact of economic integration? The case of the Romania s regions
 Specialization versus spatial concentration: Which approach better defines the impact of economic integration? The case of the Romania s regions Ceapraz Lucian, University of Burgundy, France The Strength
Study on the Comprehensive Evaluation of the Economic Development Levels of Prefecture-Level Cities in Shandong Province
 International Journal of Economic Theory and Application 08; 5(): -8 http://www.aascit.org/journal/ijeta ISSN: 375-98X Study on the Comprehensive Evaluation of the Economic Development Levels of Prefecture-Level
GIS SUPPORTED ANALYSIS ON CITY GATHERING IN CHINA. Ren Fuhu
 GIS SUPPORTED ANALYSIS ON CITY GATHERING IN CHINA Ren Fuhu Murai Laboratory Institute of Industrial Science, University of Tokyo 7-22-1, Roppongi, Minato-ku, Tokyo 106, JAPAN ABSTRACT: Urbanization is
Opportunities and challenges of HCMC in the process of development
 Opportunities and challenges of HCMC in the process of development Lê Văn Thành HIDS HCMC, Sept. 16-17, 2009 Contents The city starting point Achievement and difficulties Development perspective and goals
Analysis of Impact of Urban Agglomeration Planning of Middle and Lower Yangtze River on International Trade Development in Central China.
 International Conference on Education, Management and Computing Technology (ICEMCT 2015) Analysis of Impact of Urban Agglomeration Planning of Middle and Lower Yangtze River on International Trade Development
An Empirical Analysis of RMB Exchange Rate changes impact on PPI of China
 2nd International Conference on Economics, Management Engineering and Education Technology (ICEMEET 206) An Empirical Analysis of RMB Exchange Rate changes impact on PPI of China Chao Li, a and Yonghua
Route of Urbanisation in China from an International Perspective
 18 The Route of Urbanisation in China from an International Perspective Xiaolu Wang 1 Introduction This chapter examines China s urban development strategy from an international perspective. There are
Grade 7 Social Studies
 Standard 1: History Students will examine the major movements, events, and figures that contributed to the development of nations in modern Africa, Asia, and the Southwest Pacific from acient civilizations
Why has globalisation brought such large increases in exports to some countries and not to others?
 by Stephen Redding and Anthony Venables Why has globalisation brought such large increases in exports to some countries and not to others? Stephen Redding and Anthony Venables look at the way internal
Modeling firms locational choice
 Modeling firms locational choice Giulio Bottazzi DIMETIC School Pécs, 05 July 2010 Agglomeration derive from some form of externality. Drivers of agglomeration can be of two types: pecuniary and non-pecuniary.
Implementation Performance Evaluation on Land Use Planning: A Case of Chengdu, China
 Cross-Cultural Communication Vol. 8, No. 4, 2012, pp. 34-38 DOI:10.3968/j.ccc.1923670020120804.1020 ISSN 1712-8358[Print] ISSN 1923-6700[Online] www.cscanada.net www.cscanada.org Implementation Performance
Options and Implications of Free Trade Arrangements in Asia. Jun Ma, Deutsche Bank AG Zhi Wang, ERS, USDA June 2002
 Options and Implications of Free Trade Arrangements in Asia Jun Ma, Deutsche Bank AG Zhi Wang, ERS, USDA June 2002 Content Our CGE Model China s WTO entry implies smaller world market shares for some ASEAN
MEASUREMENT OF RANDOMNESS OF MANUFACTURING INDUSTRIES IN INDIA
 CHAPTER 3 MEASUREMENT OF RANDOMNESS OF MANUFACTURING INDUSTRIES IN INDIA As pointed out in the introductory chapter, one of the objectives of this study is to measure the factor orientations of various
CHAPTER 3 METHODOLOGY
 CHAPTER 3 METHODOLOGY 3.1 Regional Economic Growth Theory 3.1.1 Point-axis progressive diffusion theory The point-axis progressive diffusion theory was first proposed by Poland's Salumba and Malius, who
Regional Innovation Policy in Taiwan and South Korea: Impact of Science Parks on Firm-Productivity. Ian Sheldon
 Regional Innovation Policy in Taiwan and South Korea: Impact of Science Parks on Firm-Productivity Ian Sheldon Presentation to East Asian Studies Interdisciplinary Graduate Seminar Ohio State University,
Article Internet Access, Spillover and Regional Development in China
 Article Internet Access, Spillover and Regional Development in China Juan Lin 1, Zhou Yu 2, *, Yehua Dennis Wei 3 and Mingfeng Wang 1 1 Center for Modern Chinese City Studies, East China Normal University,
Linking Proximity to Secondary Cities vs Mega Cities, Agricultural Performance, & Nonfarm Employment of Rural Households in China
 Public Disclosure Authorized Public Disclosure Authorized Public Disclosure Authorized Linking Proximity to Secondary Cities vs Mega Cities, Agricultural Performance, & Nonfarm Employment of Rural Households
Capital, Institutions and Urban Growth Systems
 Capital, Institutions and Urban Growth Systems Robert Huggins Centre for Economic Geography, School of Planning and Geography, Cardiff University Divergent Cities Conference, University of Cambridge, Cambridge
Road & Railway Network Density Dataset at 1 km over the Belt and Road and Surround Region
 Journal of Global Change Data & Discovery. 2017, 1(4): 402-407 DOI:10.3974/geodp.2017.04.03 www.geodoi.ac.cn 2017 GCdataPR Global Change Research Data Publishing & Repository Road & Railway Network Density
Evaluation of the sophistication of Chinese industries using the information-geometric decomposition approach
 Evaluation of the sophistication of Chinese industries using the information-geometric decomposition approach Research Fellow, Research Division, Economic Research Institute for Northeast Asia Takanori
Modern Urban and Regional Economics
 Modern Urban and Regional Economics SECOND EDITION Philip McCann OXFORD UNIVERSITY PRESS Contents List of figures List of tables Introduction xii xiv xvii Part I Urban and Regional Economic Models and
THE APPLICATION OF GREY SYSTEM THEORY TO EXCHANGE RATE PREDICTION IN THE POST-CRISIS ERA
 International Journal of Innovative Management, Information & Production ISME Internationalc20 ISSN 285-5439 Volume 2, Number 2, December 20 PP. 83-89 THE APPLICATION OF GREY SYSTEM THEORY TO EXCHANGE
Cities in Bad Shape: Urban Geometry in India
 Cities in Bad Shape: Urban Geometry in India Mariaflavia Harari MIT IGC Cities Research Group Conference 21 May 2015 Introduction Why Study City Shape A wide range of factors determine intra-urban commuting
THEORIES OF GLOBAL INTERCONNECTIONS. APWH Unit 6 Part to Present
 THEORIES OF GLOBAL INTERCONNECTIONS APWH Unit 6 Part 4 1900 to Present Myth of Isolation Truly isolated cultures have never existed 1000s of years, human groups have been in contact with each other (ex.
Analysis of China s Haze Days in the Winter Half-Year and the Climatic Background during
 ADVANCES IN CLIMATE CHANGE RESEARCH 5(1): 1-6, 2014 www.climatechange.cn DOI: 10.3724/SP.J.1248.2014.001 CHANGES IN CLIMATE SYSTEM Analysis of China s Haze Days in the Winter Half-Year and the Climatic
Trends and Determinants of China s Industrial Agglomeration
 MPRA Munich Personal RePEc Archive Trends and Determinants of China s Industrial Agglomeration Jiangyong Lu and Zhigang Tao Tsinghua University, University of Hong Kong November 2007 Online at http://mpra.ub.uni-muenchen.de/6597/
Global Value Chain Participation and Current Account Imbalances
 Global Value Chain Participation and Current Account Imbalances Johannes Brumm University of Zurich Georgios Georgiadis European Central Bank Johannes Gräb European Central Bank Fabian Trottner Princeton
The TransPacific agreement A good thing for VietNam?
 The TransPacific agreement A good thing for VietNam? Jean Louis Brillet, France For presentation at the LINK 2014 Conference New York, 22nd 24th October, 2014 Advertisement!!! The model uses EViews The
UNIVERSITY OF NAIROBI COLLEGE OF HUMANITIES AND SOCIAL SCIENCES FACULTY OF ARTS & SCHOOL OF PHYSICAL SCIENCES
 UNIVERSITY OF NAIROBI COLLEGE OF HUMANITIES AND SOCIAL SCIENCES FACULTY OF ARTS & SCHOOL OF PHYSICAL SCIENCES Department of Geography and Environmental Studies TEACHING MODULE CGP/SGP 321: ECONOMIC GEOGRAPHY
Trade Challenges Facing LLDCs: How the ITT-LLDCs could respond to these issues
 Trade Challenges Facing LLDCs: How the ITT-LLDCs could respond to these issues By Mr. Odbayar Erdenetsogt, Interim Director of the ITT for LLDCs Date: June 2, 2014 International Workshop on WTO Agreement
Spillovers from economic development: an interregional perspective
 Spillovers from economic development: an interregional perspective Geoffrey J.D. Hewings Regional Economics Applications Laboratory University of Illinois hewings@illinois.edu www.real.uiuc.edu Outline
Chin. Geogra. Sci Vol. 27 No. 3 pp Springer Science Press
 Chin. Geogra. Sci. 2017 Vol. 27 No. 3 pp. 456 470 Springer Science Press doi: 10.1007/s11769-017-0877-7 www.springerlink.com/content/1002-0063 Industrial Agglomeration Externalities, City Size, and Regional
Estimating Trade in a Regional Input-Output Table
 Estimating Trade in a Regional Input-Output Table Johannes Bröcker & Johannes Burmeister September 3, 2015 1/24 Outline Introduction Theoretical Framework Prerequisites CHARM GRETA Empirical Test Finland
A Simplified Travel Demand Modeling Framework: in the Context of a Developing Country City
 A Simplified Travel Demand Modeling Framework: in the Context of a Developing Country City Samiul Hasan Ph.D. student, Department of Civil and Environmental Engineering, Massachusetts Institute of Technology,
Drivers of economic growth and investment attractiveness of Russian regions. Tatarstan, Russian Federation. Russian Federation
 Drivers of economic growth and investment attractiveness of Russian regions M.V. Kramin 1, L.N. Safiullin 2, T.V. Kramin 1, A.V. Timiryasova 1 1 Institute of Economics, Management and Law (Kazan), Moskovskaya
Urban Services Growth in China: The Effect of Demand Factors
 International Journal of Economics and Finance; Vol. 7, No. 8; 2015 ISSN 1916-971X E-ISSN 1916-9728 Published by Canadian Center of Science and Education Urban Services Growth in China: The Effect of Demand
Team Production and the Allocation of Creativity across Global and Local Sectors
 RIETI Discussion Paper Series 15-E-111 Team Production and the Allocation of Creativity across Global and Local Sectors NAGAMACHI Kohei Kagawa University The Research Institute of Economy, Trade and Industry