THE USE OF EPSILON CONVEX AREA FOR ATTRIBUTING BENDS ALONG A CARTOGRAPHIC LINE
|
|
|
- Lisa Boone
- 5 years ago
- Views:
Transcription
1 THE USE OF EPSILON CONVEX AREA FOR ATTRIBUTING BENDS ALONG A CARTOGRAPHIC LINE Vasilis Mitropoulos, Androniki Xydia, Byron Nakos, Vasilis Vescoukis School of Rural & Surveying Engineering, National Technical University of Athens ABSTRACT In this paper a method for detecting bends along cartographic lines is introduced. The method is based on the concept of epsilon-convex areas. By rolling iteratively circles of gradually decreasing sizes of diameter epsilon along the line, several bends are formed. The generated bends are represented in hierarchically structured trees and their attributes (size and shape) are calculated. The proposed method is implemented on Peristera Island coastline as a case study, digitised from a paper map of scale 1:50K. The results are compared and discussed with manually generalised coastlines of Peristera Island, digitised from maps of several smaller scales, i.e. 1:100K, 1:250K, 1:500K and 1:1M. Although the present research approaches the problem at a preliminary stage, promising results have been produced. INTRODUCTION Line generalisation may be considered as one of the most complex processes in the cartographic procedure due to its dependence on factors like the level of simplification, the purpose of the map and the character of the cartographic line. Cartographers ought to take into account all these factors in order to accomplish effectively any simplification task. Trying to suit the above factors, cartographers follow a holistic procedure when generalising manually a line. They examine the line globally as well as locally. The aim is the estimation of how the retention or the removal of each characteristic of the line can reflect to the neighbour location as well as to the whole line globally. This procedure takes place continuously and iteratively as line simplification proceeds. Another characteristic of manual line simplification is the subjectivity of the procedure. Cartographers use personal logical and aesthetic criteria to form the generalised line. Nevertheless, studies have shown that there is a general principle that defines the way someone selects the positions that shape a generalised line. Marino (1979) curried out an empirical study in order to investigate how map users select positions which shape generalised lines. She presented six lines to a group of individuals (several of them were cartographers), and she asked them to select a set of points (positions), which they considered to be necessary and sufficient to retain the character of the line. The analysis of the results showed that the great majority of the points selected was located in lines high slope change areas. With minor deviations, cartographers and non-cartographers chose the same positions. The results of Marino s study testify Attneave s concepts about visual perception. Attneave (1954) pointed out that each location of a drawn object contains (and conveys to map-readers) an amount of information. The greater amount of information is concentrated along the contours of a drawn object, and especially at these locations where contours direction changes most rapidly. He concluded that these locations are able to characterise the shape of an object and he distinguished them from the rest that considered redundant. Based on this concept, cartographers consider that locations along a line at which its direction changes rapidly, are significant for the retention of the form and shape of the line, and so they must be retained after a simplification procedure. In computer cartography, several research activities have the aim to formulate automated approaches on the problem of line simplification. A significant difference between analogue and digital cartography is the mode of representation of spatial features. In digital environment, cartographic lines are usually represented in vector structure - i.e. a discrete number of vertices connected by vectors. This way of line representation does not express the continuous character of real world objects. Cartographic lines (rivers, coastlines, etc) are continuous phenomena, each one having characteristic/individual physical and geometrical attributes, such as consecution, curvature, etc. In computer environment these attributes do not exist. Thus, cartographers ought to search for alternative methods of line analysis. They have to modulate their research to discrete representations. Most of line simplification algorithms that have been developed focus on the retention or the elimination of vertices constituting digital lines. The greatest part of them uses geometric criteria in order to select the points that shape the generalised line. Their structure is based on the retention of points located on high slope change parts of the line; that is algorithms function is based on Attneave s theory. Among these algorithms, the most well known is the one proposed by Douglas and Peucker (1973).
2 The validity of these algorithms is a discussion topic for cartographers, mainly for three reasons. Firstly, the structure of each algorithm is based on specific geometric criteria and limitations set by users. Thus, they are not always efficient to operate well to all lines or to the different shaped parts of a specific line. Each line is encountered as an integral entity; its geometry is analysed globally according to the principles of each algorithm. In addition, cartographic lines (or parts of them) do not change in the same way during a simplification process. Depending on their geomorphological nature and character, lines behave differently to scale changes. Buttenfield (1989) states that linear features can be divided in two categories: those that their structure changes with scale (scale-dependent) and those that do not change (scaleinvariant). Finally, having as functional principle the detection of high slope change positions of a line, several algorithms do not select points located in its smooth parts (silent points), which may be necessary for the line s shape retention (Dutton 1999). Nowadays, it is a challenge for cartographers to create a total system that will simulate the manual line simplification process. This system will examine and analyse the shape and the geometry of a line in global, as well as in local level. It will segment the line on the basis of common attributes (sinuosity, homogeneity, etc) and will apply in each part an appropriate line simplification algorithm using constant or different tolerances or different algorithms suitable for each part of the line. In addition, the choice of the above generalisation operators will depend on the level of simplification and the rate of scale reduction. Based on this concept, Dutton (1999, p. 36) points out that by segmenting line features to be more homogenous, then applying appropriate algorithms and parameters to each regime individually, simplification results can always be improved. Having as background the above research directions and the concept of simulation of manual line simplification, two related research topics arise. Ways of line segmentation must be found and line analysis must take place locally as well as globally. In this context, it would be sounder for cartographers to examine sections and not isolate points on a line. The main objection of regarding points as the minor element of a line and using them for line s analysis is that it is difficult to take into account their local significance. Every point is strongly associated with its neighbours. Thus, the retention or not of a point may affect the significance of its predecessor or following points. And that may affect the final shape and the aesthetic and geographic validity of the generalised line. On the contrary, rule based defined parts on a line (e.g. bends) approach better its physical formation, regarding the geometrical analysis. By examining line parts, the assessment of the local importance is sounder, since their geometrical attributes can be calculated (even an approximation of them) and their topological relevance can be rated. Plazanet et al (1995) presented some rules for the characterisation of linear features. They defined objective criteria like sinuosity, homogeneity, density, and complexity, in different levels of perception (global, intermediate and local) that they used to describe the shape of a line. Based on these criteria, they proposed a method of segmentation of linear features. Finally, the geometrical attributes of the line pieces were calculated. In this way, Plazanet et al (1995) segmented and characterised a line in order to be properly analysed for a total system to administrate it. In this context, Wang and Müller (1998) proposed a simplification algorithm, which is based on the detection of the bends of a line. Geometric principles were used for bends definition. Specifically, Wang and Müller defined that a bend is that part of a line which contains a number of subsequent vertices, with the inflection angles of all vertices included in the bend being either positive or negative and the inflection of the bend s two end vertices being in opposite signs. (Wang and Müller 1998, p. 5) The attributes (size and shape) of each bend were calculated and the context with its neighbour bends was defined. The retained bends that shaped the resultant line, as well as, their final form were composed after the application of elimination, combination, and exaggeration operators. Considering that the creation and the analysis of bends along a cartographic line is an important procedure for generalisation, a new method of detecting bends is introduced in the present paper. The method is based on the concept of epsilon convex areas introduced by Perkal (1966a), for bends definition. The aim is the formation of bends along a line on the basis of a common measure and the computation of their attributes. The method may be useful in the process of designing a total method of line generalisation, since one of its preconditions is the knowledge of quantitative means that characterise cartographic lines. THE METHOD Definition of Epsilon Non-Convex Bends and Their Tree Representation Perkal (1966a) introduced the concept of epsilon convex areas in his effort to create a method of measurement of linear features length. The formation and the implementation of his research concern analogue lines, that thier manner of structure is not known. Perkal defined that an epsilon convex area of a line is the collection of all points on the plane not more than epsilon distant from the line. Theoretically, an epsilon convex area is created when a circle of diameter
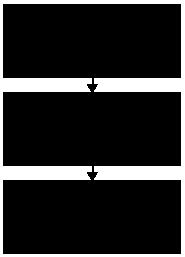
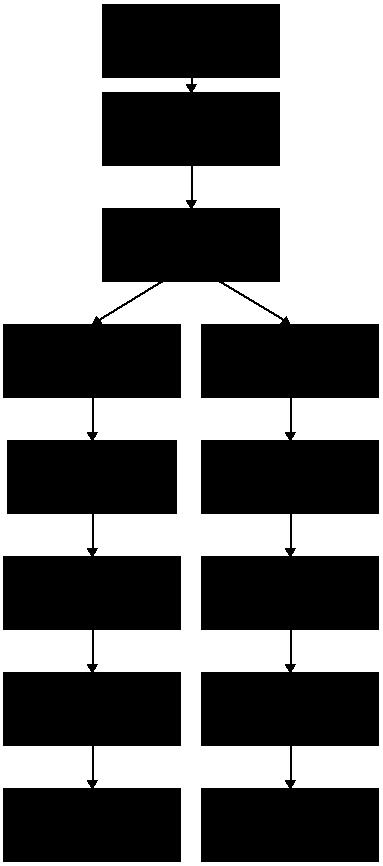
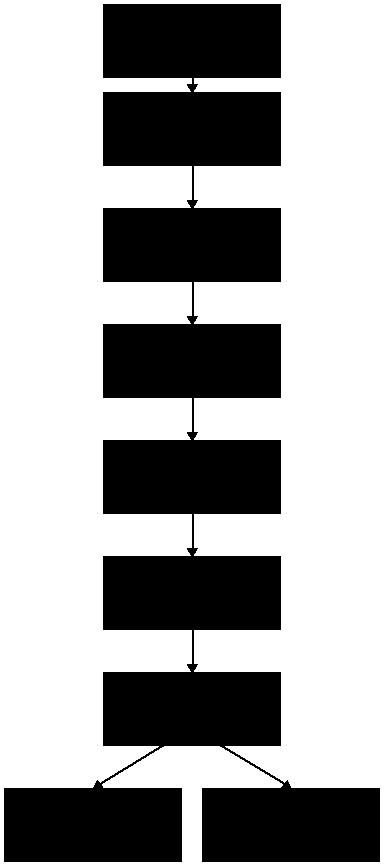
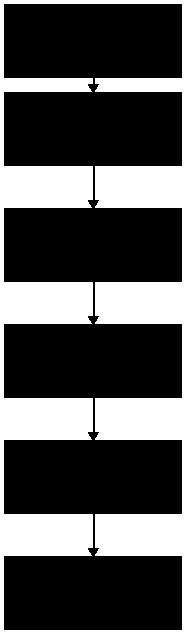
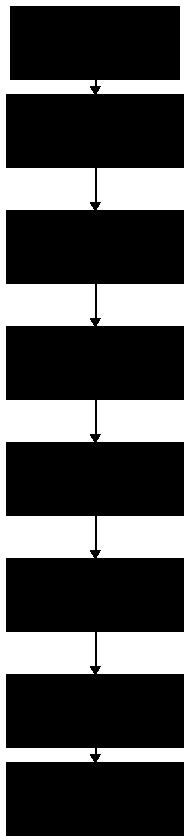
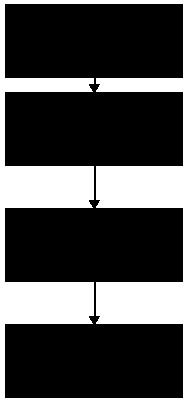
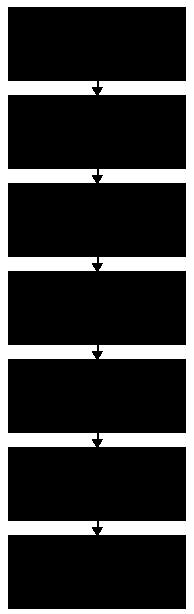
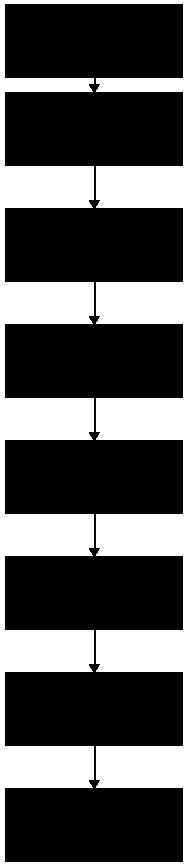
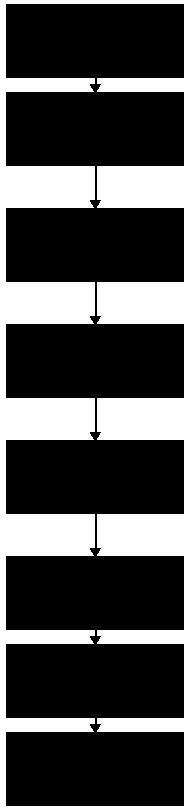
3 epsilon rolls on both sides of a line. Its width depends on the size of epsilon. Based on this concept, he divided the lines (or parts of the lines) to epsilon convex and epsilon non-convex areas. A line is epsilon convex if a circle of diameter epsilon could fit on both sides of the arc (Perkal, 1966a, p. 9). On the contrary, if an interruption exists between circle and line, this part of the line is epsilon non-convex. An outgrowth of the epsilon convexity concept is a region generalisation technique (called epsilon generalisation), proposed by Perkal (1966b). Perkal considered two regions created by a close line, the internal (D) and the external (D ). A circle of diameter epsilon roles separately on the inner and outer side of the line. The set of all points having the property that they are contained within circles of diameter epsilon, which can be completely included in the region D, is called an epsilon generalisation of the region D (Perkal, 1966b, p. 4). The same procedure takes place to the region D. In other words, Perkal s method detects and retains the epsilon convexes of the line. The epsilon non-convexes are removed and replaced by the part of the circle that connects the intersection points. Based on Perkal s concept Christensen (1999) proposed a line simplification technique. Applying Perkal s rolling circle, he broke the line to epsilon convex and epsilon non-convex sections. The edges of the epsilon non-convex were connected with medial-axes arcs, and finally joined with the retained epsilon convex sections, so as the simplified line to be formed. In the present paper, the concept of epsilon convexity is used for the detection of bends along cartographic lines. We will call bends the epsilon non-convex sections of the line. Theoretically, the proposed epsilon non-convex bends are created by a similar to Perkal procedure. A circle of diameter epsilon roles on both sides of a line, creating epsilon convexes and epsilon non-convexes parts of the line. The method is implemented in each line by applying iteratively graduated decreasing levels of diameter epsilon, from a maximum to a minimum value. In this way, each epsilon nonconvex bend created by a higher size of epsilon contains epsilon non-convex bends created by smaller sizes of epsilon (sub-bends), or conversely, each epsilon non-convex bend created by a small size of epsilon belongs to an epsilon nonconvex bend created by a bigger size of epsilon. Thus, there is a direct topological relation between the bends and their sub-bends, which can be transformed to a graph of hierarchically structured trees. The introduced tree structure uses one level for each circle diameter. If the original bend is a simple curved part of the line and the rolling circle diameter relatively short, then the whole bend is represented by a single tree node. This is the case in Figure 1(A & B). Each time the diameter is decreased, one single bend is discovered, since no curved parts of the line exist. In this trivial case, the tree constructed by levels associated to decreasing diameters, is a linear linked list. If the original bend has details that cannot be seen using a large rolling circle diameter, then as the diameter decreases, those detailed sub-bends are revealed. In this case, if N is the number of bends that are generated at a specific level, the node that represents the original bend becomes the parent of N nodes, and these nodes represent the generated sub-bends. This is shown in Figure 1C. When the rolling circle diameter is small enough the two sub-bends of Figure 1C will be discovered. The corresponding tree structure is shown in Figure 1D. This procedure of decreasing the diameter - creating a new tree level with the visible bends is repeated until no further bend details can be detected, which means that all nodes of the last tree level are expanded as linear linked lists. Of course, the selection of the circle diameter determines the detail that will be detected at each specific diameter level. Figure 1E shows a more complex line along with the corresponding tree structure in Figure 1F. It is worth Figure 1. An example of bends tree structure noting in Figure 1 (E & F) that if we number node 1 as tree level 0 then tree level 1 corresponds to the detection of two sub-bends 1a and 1b. For the next diameter decrease, nothing is detected below node 1a, while two sub-bends are exposed at 1b. Nothing is exposed by the next decrease of diameter at both sub-bends, while the last one, exposes sub-bends 1a.1a and 1a.1b. It is obvious that the shape and the characteristics of the tree depend on the diameters selected. Implementation of Perkal s Technique in Computer
4 Figure 2. Implementation of Perkal s technique using a GIS software package way the whole procedure is implemented inside the GIS software package. In computer environment, the implementation of Perkal s analytical procedure is accomplished using the ArcGIS v.9.0 software package ( ESRI). The rolling circle process is obtained by the buffering operation supported by the specific software. A buffer zone is created around each side of a line. The bandwidth of the buffer is equal to the half of the Perkal s circle diameter (epsilon). Then, a new buffer zone of width half of epsilon is created around the boundaries of the initial buffer zone. The inner boundaries of the new buffer zone intersect line in some positions. The bends shaped between two subsequent intersection points are the epsilon non-convex parts of the line. It is worth mention that the described method is a satisfactory approximation of Perkal s technique. The second applied buffer simulates the rolling circle and the intersection between buffer and line corresponds to the tangent points of circle and line, as mentioned in Perkal s (1966a) study. The same procedure is iteratively repeated over different levels of decreasing epsilon in order to detect sub-bends inside each bend and to construct their topological structure. The process is obtained by the identity operation supported by the software package. Finally, by connecting the two end points of a bend a closed polygon is formed. The resultant polygons are used for the computation of the epsilon non-convex bends quantitative attributes. Since several generated polygons are not visually observed, as being very small in size and narrow in shape, they are eliminated. All calculations are made using ArcGIS platform s environment. Figure 2 illustrates graphically the Quantitative Attributes of the epsilon Non-Convex Bends The quantitative attributes of the epsilon non-convex bends are the diameter (epsilon), size, and shape index. The size of diameter is common for all bends during each application. The shape index and the size of the created bends depend on it. For the computation of the size and shape index values that characterise each epsilon non-convex bend, the closed polygon created from the base-line and the bend is used. The size of an epsilon non-convex bend is defined as the area (A) of the polygon. The bends shape can be described by a numerical expression. In this paper the shape index is determined by the ratio between the perimeter (L) of the polygon and the square root of its area (A): k = L/ A. The shape index k is dimensionless and independent of size of any areal entity. Nakos (2004) pointed out that the smallest value of k corresponds to a circle, which is considered as a perfect shape. For rounded shapes the value of k increases slightly and takes high values on narrow and elongated shapes. Generally, the shape index k increases as the shape becomes more narrow and elongated. CASE STUDY The proposed method was implemented on the coastline of Peristera Island, a coastline characterised by high degree of complexity and shape irregularities. The coastline was digitised from a paper map of scale 1:50K. The average step of digitisation was approximately 0.1mm on the map (5m on the ground). Further on, the method is applied on Peristera Island coastline, presented on four smaller scale maps (1:100K, 1:250K, 1:500K, and 1:1M). The aim is the comparison of the results yielded from the method s application on manually generalised maps. The average step of digitisation was also approximately 0.1mm on the map for all generalised coastlines (i.e. 10m, 25m, 50m, and 100m on the ground, respectively). The raw data were cleaned up from duplicate vertices, spikes, or switchbacks after a weeding process and they were smoothed in order to produce a working data set, as it is suggested by Jenks (1981). The method was implemented on each coastline by applying iteratively eight decreasing sizes of diameter epsilon (1,400m, 1,200m, 1,000m, 800m, 600m, 400m, 200m, and 100m on the ground). The coastline s extent on scale 1:50K is taken into account for the choice of the epsilon sizes. Using the maximum diameter (1400m), the theoretical rolling

5 circle adjoins the large bays of the coastline. Moreover, the epsilon non-convex bends created by rolling circles of diameter lower than 100m are not visible or referable. In the paper only the results of applying the method on the outer side of the coastlines are presented and discussed. The epsilon non-convex bends created by the implementation of the method on the five versions of the coastline are filtered in order to eliminate those bends that cannot be visually observed. The filtering is accomplished by using the bends average depth as criterion. The average depth (D) of a bend is determined as the ratio between the area (A) of the polygon related to the bend and the length of the base-line (BL) that connects the two end points of the bend: D = A/BL. The eliminated bends are characterised by average depth less than a threshold value. In order to estimate a threshold, the width of a digital line and the visual separation limit must be considered. By assuming that a coastline is presented on a map with a line of 0.1mm Figure 3. Selection of threshold for bends filtering width, and that the visual separation limit is 0.2mm (Rouleau 1984), 0.3mm is set as an appropriate threshold value (see Figure 3). By applying the filtering process a great number of small but noisy bends are eliminated. DISCUSSION Analysis of Bends Attributes The assessment of the results is based on ranges: the change of the number of bends and the attributes of the bends in the different levels of epsilon in a specific scale and their change according to scale for a specific level of diameter epsilon. The values of size have been divided into eighteen classes according to the frequency of appearance. Respectively, the values of shape k have been divided into four classes on the basis of their frequency of appearance: (a) k<5, (b) 5 k<6, (c) 6 k<7 and (d) k 8. The bends that correspond to the lower classes are more rounded than those bends corresponding to higher classes that are more elongated and narrow. By observing the number of epsilon non-convex bends created in the five versions of the coastline, it is evident that as the scale increases, more bends are generated. In larger scales the coastline is represented in more detail and their shape is more complex. Thus, the rolling circles intersect the line in more positions, creating higher number of bends. On the contrary, the generalised versions of the coastline presented in small scales are smoother. As a result, the number of curved parts along the lines is smaller, and so the epsilon non-convex bends become fewer. In addition, the number of epsilon non-convex bends created by each diameter is assessed. In scale 1:50K, it is observed that applying rolling circles of diameters between 800m-200m on the ground the higher number of bends is created. This happens because these specific rolling circles have the appropriate size to enter inside the large curved parts of the line and detect smaller curved sections that they contain them. The large epsilon sized rolling circles mainly detect the large curved parts of the line and these of low diameters do not create epsilon non-convexes. In the coastline presented at scale 1:100K, the number of bends created by diameters between 1400m-400m on the ground is almost the same. This flattering of the bends number, in regard to the previous scale, is the result of the smoother shape of the generalised line. A part of middle sized bends presented in scale 1:50K does not exist. Thus, the rolling circles of moderate diameters detect fewer bends. In addition, the number of bends corresponding to low levels of epsilon is fairly small. That is because the rolling circles do not create epsilon non-convexes. The same situation appears in the rest versions of the coastline. The only difference is that as scale decreases, rolling circles of higher diameter create the greatest number of bends. For example, in the coastline presented in scale 1:100K, the greatest number of bends is created by rolling circles of diameters bigger than 600m on the ground, where this limit appears at the level of epsilon=1000m in the coastline of scale 1:1M. This situation also has to do with the smoother shape of the generalised versions of the line, as mentioned above. For each scale, the way by which the epsilon non-convex bends change in size for the eight levels of epsilon is analysed. In general, the bends created by rolling circles of diameter epsilon=1400m on the ground are the widest. As the size of diameter is reducing, the size of bends decreases. This way of change in size is prospective, since as the level of epsilon decreases the created bends are smaller. In the versions of the coastline presented in scales 1:50K, 1:100K, and 1:250K, the number of bends that corresponds to high levels of epsilon, is almost uniformly distributed in the
6 middle and in high classes of size. By decreasing the size of diameter, the size of most bends belongs to the middle and lower classes. In the versions of the coastline presented at scales 1:500K and 1:1M, the size of bends belongs to the middle and mainly to the high classes, for the high levels of epsilon, having a trend to be accumulated in the middle classes as the level of epsilon decreases. In both cases, it is observed that the size of bends increases as scale decreases. The variation of bends size between large and small scales appears as long as the generalised versions of the coastline are smoother and less complex. In general, the size of the epsilon non-convex bends decreases as the level of epsilon decreases and the scale increases. The shape index k variations of the epsilon non-convex bends generated by each level of epsilon, in the five versions of the coastline are examined. In the coastline presented at scale 1:50K, the k values of the bends created by rolling circles of high levels of epsilon (1400m-600m on the ground) dispread to all shape classes. In the versions of the coastline at scales 1:100K and 1:250K, these bends k values tend to be accumulated in the two first classes, while at scale 1:500K and 1:1M, the majority of them belongs to the first shape class. This way of k change makes evident that the epsilon non-convex bends created by rolling circles of high diameters become more rounded as scale decreases. That can be explained by the fact that the form of the simplified versions of the coastline presented in small scales is smoother. The k values of the bends created by rolling circles of low levels of epsilon change in a similar way according to scale. That is, as scale decreases the shape index k tends to be accumulated in the first shape classes. However, it is observed that the majority of the k values is concentrated in the first classes, even in the versions of the coastline presented at large scales. For example, in the initial coastline (scale 1:50K), most k values belong to the first two classes. Generally, by decreasing the size of diameter, the shape index k tends to be accumulated in the first classes. This change of k shows that the bends created by high sizes of diameter epsilon are more elongated or spiky than the bends created by small sizes of diameter, which are more rounded. In general, the shape of the epsilon non-convex bends tends to be more rounded as scale and level of epsilon decreases. Analysis of Hierarchically Tree-Structured Bends The hierarchical structured trees at all scale levels of Peristera Island coastline are generated. Each tree represents an epsilon non -convex bend created by the rolling circle of maximum diameter and the sub-bends created by the smaller sizes of epsilon that are contained in it. Figure 4, illustrates the trees produced by the application of the method in the five versions of the coastline under study. Each node of a tree corresponds to an epsilon non-convex bend. The upper nodes depict the bends created by the rolling circle of size epsilon=1400m and each one below, hierarchically, its subbends. In each node, the level of epsilon and the quantitative attributes of the bends are recorded. Figure 5 illustrates the coastline of Peristera Island at scale 1:50K, as well as, the bends generated by applying the rolling circle of epsilon=1400m. Interpreting Figure 4, it is evident that the trees present significant differences among each other. There are one-column trees, trees that have two or more branches, trees that end to different levels of epsilon. In addition, the trees branches start and end in various levels of epsilon and some of them have symmetrical structure while others not. By comparing the hierarchical structured trees of scale 1:50K with the coastline, as it is presented in Figure 5, it is observed, that there is a direct relation between the shape and the size of the bends and the formation of the corresponding trees. In general, the structure of each tree depicts effectively the form of the epsilon non-convex bend. Furthermore, it is observed that bends having a wide base-line in relation to their depth and small size (i.e. bends with IDs: 2, 19, 5 & 6) correspond to one-column trees that do not end to low levels of epsilon. One-column trees that extend to all levels of epsilon correspond to moderate in size and smoothed bends with wide base-line (i.e. bends with IDs: 22 or 31). The existence of branches implies irregularity, while their symmetry depicts the form of the irregularity. For example, the bend with ID: 14 is divided in two small sub-bends (see Figures 4 & 5). These sub-bends are detected at the level of epsilon=800m on the ground. Thus, the tree is divided in two branches at this level of epsilon. Moreover, since the bends are smooth and have almost the same size, the branches are symmetrical and end at the same level of epsilon. By comparing the non-symmetrically structured trees (Figure 4) with the related bends (Figure 5), it is evident that they correspond to large in size and irregular bends (i.e. bends with IDs: 11, 16 & 25). As it is shown in Figure 4, the tree of the bend with ID: 25, at the level of epsilon=1000m on the ground is divided into three branches. The first branch depicts a small in size and smooth sub-bend and ends at the level of epsilon=400m on the ground. The second one corresponds to a smooth, big sized and rather deep sub-bend. Thus, it ends at level of epsilon=200m on the ground. The third branch depicts a big sized and complex sub-bend that contains smaller sub-bends. These sub-bends are depicted by two new branches on the tree, appearing at the level of epsilon=600m on the ground. In the same way, at the level of epsilon=400m, the one of the two branches is divided into two new branches that correspond to smaller irregularities of


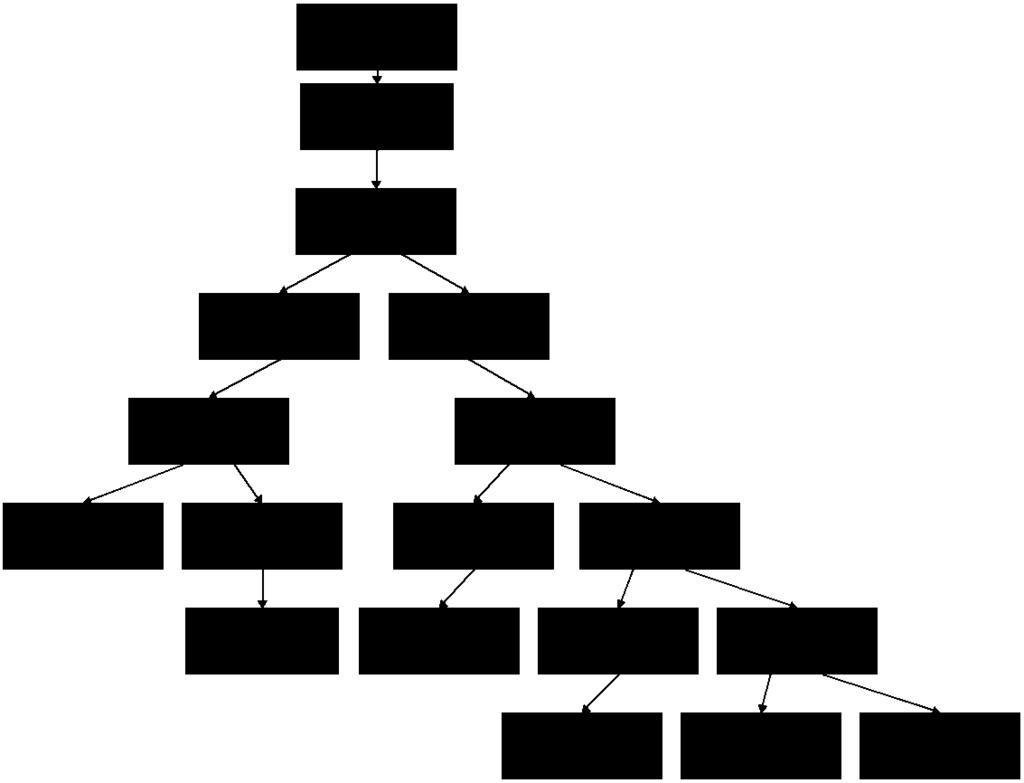
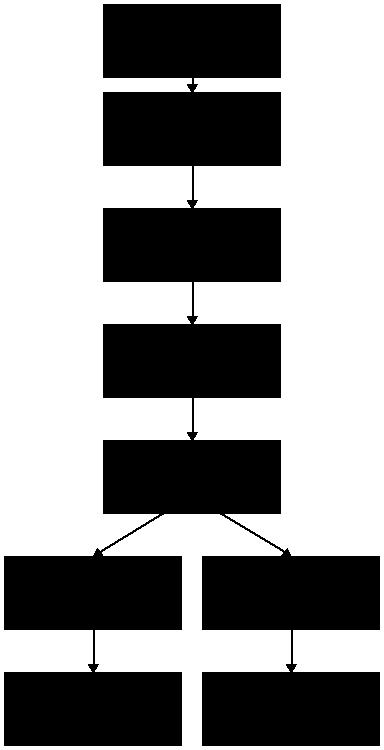
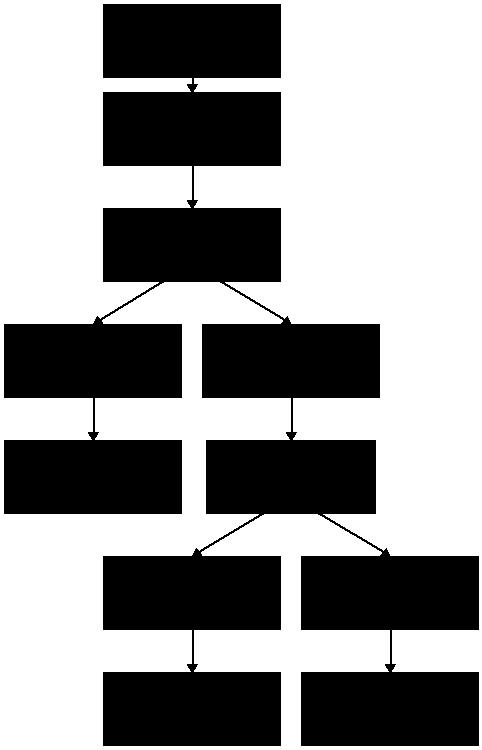
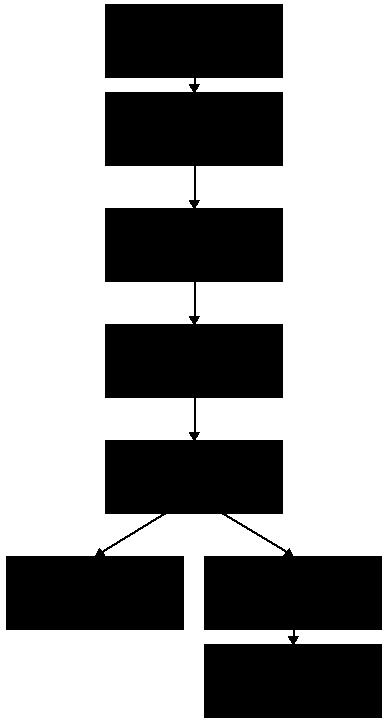
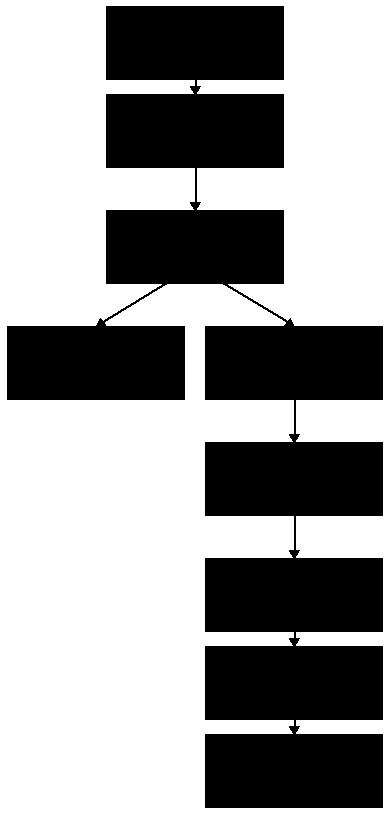
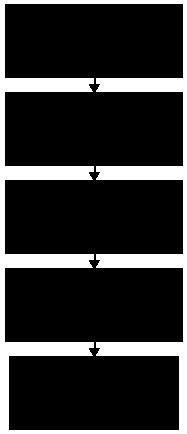
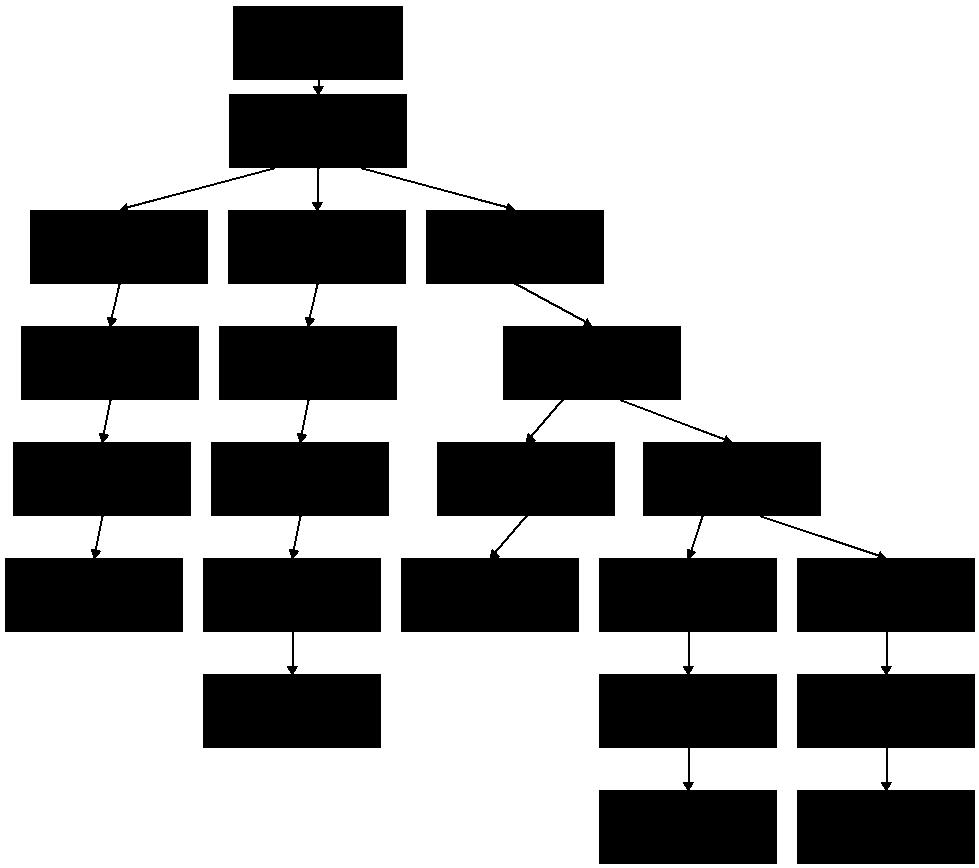
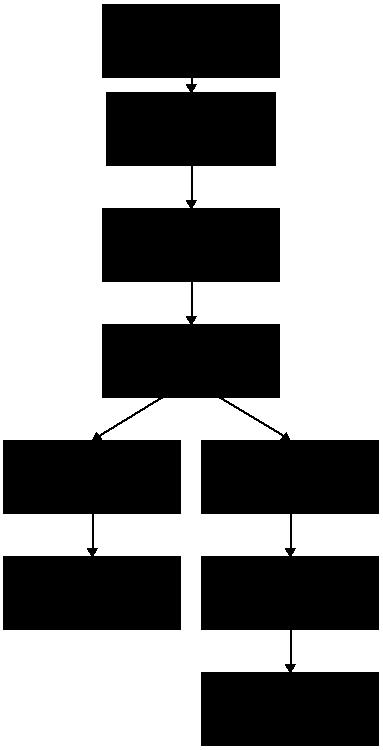
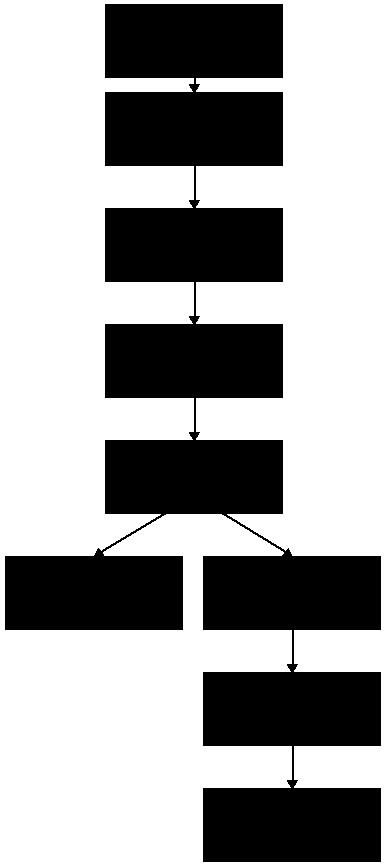
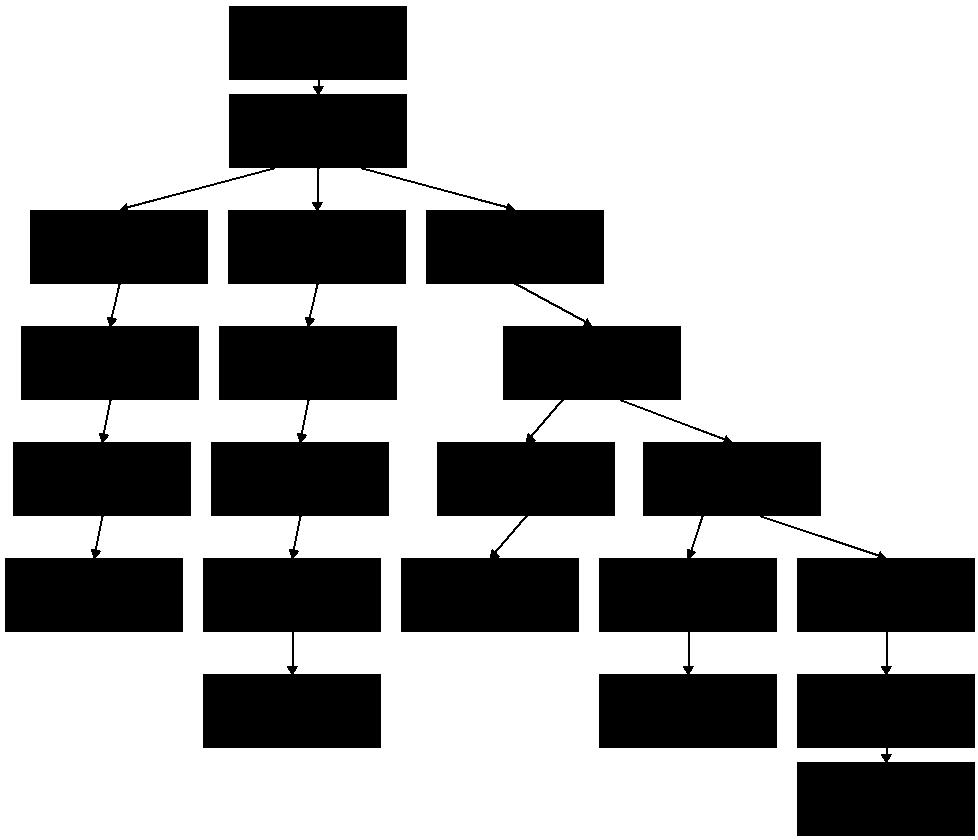
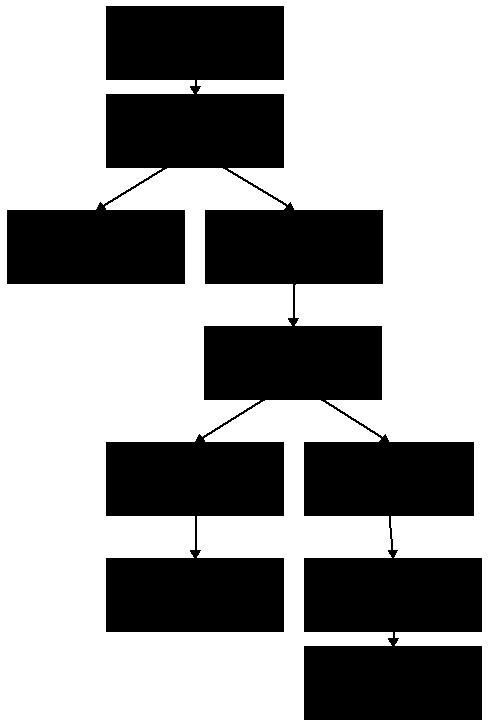
7 the coastline. It becomes obvious that, the level of epsilon at which a tree may branch, as well as, the last level of epsilon of each branch, depends on the form of the irregularities, the size, and the shape of the initial bend. Therefore, by observing the structure of a tree, as well as, the recorded bend s attributes, the character of the line may be predicted Bend_ID Scale 1:50,000 Scale 1:100,000 Scale 1:250,000 Scale 1:500,000 Scale 1:1,000, Bend_ID Scale 1:50,000 Scale 1:100,000 Scale 1:250,000 Scale 1:500,000 Scale 1:1,000, Bend_ID Scale 1:50,000 Scale 1:100,000 Scale 1:250,000 Scale 1:500,000 Scale 1:1,000,000 Figure 4. The hierarchically structured trees of the generated epsilon non-convex bends
8 Figure 5. Peristera Island coastline and the generated epsilon nonconvex bends with the rolling circle of the highest diameter (the numbering of the bends corresponds to Bend_IDs of Figure 3) In Figure 4, it is clearly shown how many and which epsilon non -convex bends are retained as scale decreases. In scale 1:50K thirty-one bends are created, while their number flows to twenty-three in scale 1:100K, seventeen in scale 1:250K, seven in scale 1:500K and just four in scale 1:1M. As mentioned in the previous section (Analysis of Bends Attributes), that happens as long as lines become smoother and less complex as the degree of generalisation increases. By analyzing which non epsilon non-convex bends retained as scale decreases, it is observed that one-column trees that do not have nodes in all levels of epsilon (like bends with IDs: 2, 9, 10, 19 or 23) are created only in scale 1:50K. These trees depict small in size and short in depth bends. On the contrary, one-column or branched trees that have boxes in all (or even in most) levels of epsilon in scale 1:50K are retained in some levels of simplification. In general, the retention of the trees depends on the attributes or on a combination of the attributes of the corresponding bends. For example, the two-branched tree that depicts the bend with ID: 14, appears only in scale 1:100K, mainly because its size is small. On the contrary, the less complex, but more large and deeper bend with ID: 18, is retained in all levels of simplification. It is worth to be mentioned that the interpretation of the trees related to different simplification levels of the same line provides useful information about the character of the line. Thus, someone can analyse a specific bend at a specific scale, as well as, understand how its shape changes according to the level of simplification. A representative example is the case of bend with ID: 25. The bend in scale 1:50K is large in size and complex in shape, creating a tree of several branches as the level of epsilon decreases. It is observed that the tree in scale 1:100K has almost the same structure. That means that the complexity remains in the simplified line. The difference is that the size of the bends is smaller. The tree corresponding to the coastline of 1:250K is significantly different in structure. A great part of the branches presented in the initial bend are resolved. In addition, the remained branches are not detected in the lower levels of epsilon due to the smoother representation of the line. It is interesting that by analysing the tree, it is observed that the retained bends are those with the biggest size and the deeper depth. In reality, these branches depict deep bays of the coastline. The tree corresponding to the coastline presented in scale 1:500K has only one column. This one-column part of the tree depicts the deepest bay of the line. All the other irregularities of the initial coastline do not exist. In scale 1:1M the same bay is depicted only in the first two levels of epsilon, a fact that can be explained by the smooth shape of the line. The way trees are transformed in various scales may offer interesting information about the significance of each part of the line under study. The proposed method during the case study is applied on an original and on four versions of the
9 same line after simplification. By producing the hierarchically structured trees of the generated bends, we can easily observe the various irregularities of different parts of the line at each scale level. The bends corresponding to trees that retained in various scales or have nodes in various levels of epsilon, are candidate to contain line s critical parts. By analysing both the bends attributes and the structure of the trees, we may result to a quantitative expression of the character of the line. Obviously, this final remark needs further consideration and extended research. CONCLUDING REMARKS Considering that the analysis of cartographic lines in separated sections of uniform characteristics is a useful research topic in line generalisation, a method of producing and attributing bends is proposed. The concept of epsilon nonconvex bends is theoretically defined and implemented in computer environment for any cartographic line. Each bend is characterised by quantitative attributes (i.e. size, and shape) and the implemented diameter. By applying the method iteratively over gradually decreasing diameters, interior bends are created into the bends of each previous level. The results of the case study show that the size of the bends decreases and their shape becomes more rounded as the level of epsilon decreases. As the scale reduces, the number and the size of the bends decrease, while their shape becomes more rounded. The fact that the bends of each level of epsilon are topologically enclosed to the bends of each previous level implies the capability to visualise the generalisation procedure through hierarchically structured trees. The hierarchical structured trees may be considered as an effective tool for the analysis of cartographic lines, since they depict each bend, its attributes and its topological relation with the rest bends. Thus, these graphs of trees may assist to a direct observation of the bends behaviour in regard to the level of epsilon or to the scale of representation. Based on above, important results about the significance of each part of the line for the whole line may yield. Further work is in progress to define quantitative measures for the hierarchical structured trees of bends and further exploit their potential. ACKNOWLEDGMENTS The research has been supported by the Senator Committee of Basic Research, Programme Protagoras, R.C. No 65/1404 of the National Technical University of Athens. REFERENCES Attneave, F Some Informational Aspects of Visual Perception. Psychological Review, 61(3): Buttenfield, B Scale-Dependence and Self-Similarity in Cartographic Lines. Cartographica, 26(1): Christensen, A.H Cartographic Line Generalization with Waterlines and Medial-Axes. Cartography and Geographic Information Systems, 26(1): Douglas, D.H, and T.K. Peucker Algorithms for the Reduction of the Number of Points Required to Represent a Digitized Line or Its Caricature. The Canadian Cartographer, 10(2): Dutton, G Scale, Sinuosity and Point Selection in Digital Line Generalization. Cartography and Geographic Information Science, 26(1): Jenks, G.F Lines, Computers, and Human Frailties. Annals of the Association of American Geographers, 71(1): Marino, J.S Identification of Characteristic Points Along Naturally Occurring Lines / An Empirical Study. The Canadian Cartographer, 16(1): Nakos, B The SP-Displacement Measure for Assessing Line Simplification. Spatial Science, 49(1): Perkal, J., 1966a. On the Length of Empirical Curves. Discussion Paper 10. Department of Geography, University of Michigan, Ann Arbor, Michigan. Perkal, J., 1966b. An Attempt at Objective Generalization. Discussion Paper 10. Department of Geography, University of Michigan, Ann Arbor, Michigan. Plazanet, C., Affholder, J-G., Fritsch, E., The Importance of Geometric Modelling in Linear Feature Generalization. Cartography and Geographic Information Systems, 22(4): Rouleau, B., Theory of Cartographic Expression and Design. In Basic Cartography for Students and Technicians, (Vol.1), International Cartographic Association, Hampshire, pp Wang, Z., and Müller, J.-C Line Generalization Based on Analysis of Shape Characteristics. Cartography and Geographic Information Systems, 25(1): 3-15.
10 A BIOGRAPHY OF THE PRESENTING AUTHOR Vasilis Mitropoulos born in 1977, studied Rural & Surveying Engineering at the National Technical University of Athens and obtained the Diploma degree in Surveying Engineering in He is Ph.D candidate in Cartography at the same University. His area of research is related to analytical cartography and map generalisation. Address: 9, Heroon Polytechniou Str. Zographos, GR Greece
A methodology on natural occurring lines segmentation and generalization
 A methodology on natural occurring lines segmentation and generalization Vasilis Mitropoulos, Byron Nakos mitrovas@hotmail.com bnakos@central.ntua.gr School of Rural & Surveying Engineering National Technical
A TRANSITION FROM SIMPLIFICATION TO GENERALISATION OF NATURAL OCCURRING LINES
 11 th ICA Workshop on Generalisation and Multiple Representation, 20 21 June 2008, Montpellier, France A TRANSITION FROM SIMPLIFICATION TO GENERALISATION OF NATURAL OCCURRING LINES Byron Nakos 1, Julien
COMPARISON OF MANUAL VERSUS DIGITAL LINE SIMPLIFICATION. Byron Nakos
 COMPARISON OF MANUAL VERSUS DIGITAL LINE SIMPLIFICATION Byron Nakos Cartography Laboratory, Department of Rural and Surveying Engineering National Technical University of Athens 9, Heroon Polytechniou
Measuring locations of critical points along cartographic lines with eye movements
 Measuring locations of critical points along cartographic lines with eye movements Theodora Bargiota, Vasilis Mitropoulos, Vassilios Krassanakis, Byron Nakos School of Rural & Surveying Engineering, National
Design and Development of a Large Scale Archaeological Information System A Pilot Study for the City of Sparti
 INTERNATIONAL SYMPOSIUM ON APPLICATION OF GEODETIC AND INFORMATION TECHNOLOGIES IN THE PHYSICAL PLANNING OF TERRITORIES Sofia, 09 10 November, 2000 Design and Development of a Large Scale Archaeological
Line generalization: least square with double tolerance
 Line generalization: least square with double tolerance J. Jaafar Department of Surveying Se. & Geomatics Faculty of Architecture, Planning & Surveying Universiti Teknologi MARA, Shah Alam, Malaysia Abstract
Line Simplification. Bin Jiang
 Line Simplification Bin Jiang Department of Technology and Built Environment, Division of GIScience University of Gävle, SE-801 76 Gävle, Sweden Email: bin.jiang@hig.se (Draft: July 2013, Revision: March,
PIECE BY PIECE: A METHOD OF CARTOGRAPHIC LINE GENERALIZATION USING REGULAR HEXAGONAL TESSELLATION
 PIECE BY PIECE: A METHOD OF CARTOGRAPHIC LINE GENERALIZATION USING REGULAR HEXAGONAL TESSELLATION P. Raposo Department of Geography, The Pennsylvania State University. University Park, Pennsylvania - paulo.raposo@psu.edu
Children s Understanding of Generalisation Transformations
 Children s Understanding of Generalisation Transformations V. Filippakopoulou, B. Nakos, E. Michaelidou Cartography Laboratory, Faculty of Rural and Surveying Engineering National Technical University
Proceedings - AutoCarto Columbus, Ohio, USA - September 16-18, 2012
 Automated Metric Assessment of Line Simplification in Humid Landscapes Lawrence V. Stanislawski 1, Paulo Raposo 2, Michael Howard 1, and Barbara P. Buttenfield 3 1 Center for Excellence in Geospatial Information
A CARTOGRAPHIC DATA MODEL FOR BETTER GEOGRAPHICAL VISUALIZATION BASED ON KNOWLEDGE
 A CARTOGRAPHIC DATA MODEL FOR BETTER GEOGRAPHICAL VISUALIZATION BASED ON KNOWLEDGE Yang MEI a, *, Lin LI a a School Of Resource And Environmental Science, Wuhan University,129 Luoyu Road, Wuhan 430079,
Ladder versus star: Comparing two approaches for generalizing hydrologic flowline data across multiple scales. Kevin Ross
 Ladder versus star: Comparing two approaches for generalizing hydrologic flowline data across multiple scales Kevin Ross kevin.ross@psu.edu Paper for Seminar in Cartography: Multiscale Hydrography GEOG
Exploring representational issues in the visualisation of geographical phenomenon over large changes in scale.
 Institute of Geography Online Paper Series: GEO-017 Exploring representational issues in the visualisation of geographical phenomenon over large changes in scale. William Mackaness & Omair Chaudhry Institute
GENERALIZATION OF DIGITAL TOPOGRAPHIC MAP USING HYBRID LINE SIMPLIFICATION
 GENERALIZATION OF DIGITAL TOPOGRAPHIC MAP USING HYBRID LINE SIMPLIFICATION Woojin Park, Ph.D. Student Kiyun Yu, Associate Professor Department of Civil and Environmental Engineering Seoul National University
Lecture 10 Mapping Quantities: Dot Density Maps
 Lecture 10 Mapping Quantities: Dot Density Maps Introduction Creating maps of features based on quantity are some of the most common and important types of maps. In order to create maps that show quantity
THE CREATION OF A DIGITAL CARTOGRAPHIC DATABASE FOR LOCATOR MAPSl
 THE CREATION OF A DIGITAL CARTOGRAPHIC DATABASE FOR LOCATOR MAPSl Karen A. Mulcahy Hunter College ABSTRACT. This paper reports on the procedures and problems associated with the development ofa digital
Visualize and interactively design weight matrices
 Visualize and interactively design weight matrices Angelos Mimis *1 1 Department of Economic and Regional Development, Panteion University of Athens, Greece Tel.: +30 6936670414 October 29, 2014 Summary
Geo-spatial Analysis for Prediction of River Floods
 Geo-spatial Analysis for Prediction of River Floods Abstract. Due to the serious climate change, severe weather conditions constantly change the environment s phenomena. Floods turned out to be one of
AN ATTEMPT TO AUTOMATED GENERALIZATION OF BUILDINGS AND SETTLEMENT AREAS IN TOPOGRAPHIC MAPS
 AN ATTEMPT TO AUTOMATED GENERALIZATION OF BUILDINGS AND SETTLEMENT AREAS IN TOPOGRAPHIC MAPS M. Basaraner * and M. Selcuk Yildiz Technical University (YTU), Department of Geodetic and Photogrammetric Engineering,
An Information Model for Maps: Towards Cartographic Production from GIS Databases
 An Information Model for s: Towards Cartographic Production from GIS Databases Aileen Buckley, Ph.D. and Charlie Frye Senior Cartographic Researchers, ESRI Barbara Buttenfield, Ph.D. Professor, University
Hennig, B.D. and Dorling, D. (2014) Mapping Inequalities in London, Bulletin of the Society of Cartographers, 47, 1&2,
 Mapping Inequalities in London, Bulletin of the Society of Cartographers, 47, 1&2,") Hennig, B.D. and Dorling, D. (2014) Mapping Inequalities in London, Bulletin of the Society of Cartographers, 47, 1&2, 21-28. Pre- publication draft without figures Mapping London using cartograms The
Hennig, B.D. and Dorling, D. (2014) Mapping Inequalities in London, Bulletin of the Society of Cartographers, 47, 1&2, 21-28. Pre- publication draft without figures Mapping London using cartograms The
Cell-based Model For GIS Generalization
 Cell-based Model For GIS Generalization Bo Li, Graeme G. Wilkinson & Souheil Khaddaj School of Computing & Information Systems Kingston University Penrhyn Road, Kingston upon Thames Surrey, KT1 2EE UK
Research on Object-Oriented Geographical Data Model in GIS
 Research on Object-Oriented Geographical Data Model in GIS Wang Qingshan, Wang Jiayao, Zhou Haiyan, Li Bin Institute of Information Engineering University 66 Longhai Road, ZhengZhou 450052, P.R.China Abstract
Chapter 3: The Derivative in Graphing and Applications
 Chapter 3: The Derivative in Graphing and Applications Summary: The main purpose of this chapter is to use the derivative as a tool to assist in the graphing of functions and for solving optimization problems.
STRUCTURAL KNOWLEDGE TO SUPPORT THE GENERALIZATION OF A COASTLINE
 POSTER SESSIONS 279 STRUCTURAL KNOWLEDGE TO SUPPORT THE GENERALIZATION OF A COASTLINE Abstract Sven Arve Saga Statens kartverk (Norwegian Mapping Authority) N-3500 H nefoss, NORWAY e-mail: sven-arve.saga@skripost.md.telemax.no
KEYWORDS: census maps, map scale, inset maps, feature density analysis, batch mapping. Introduction
 Automated Detection and Delineation of Inset Maps William G. Thompson ABSTRACT: In order to create a useful map, the cartographer must select a scale at which the map reader can distinguish all features
ASSESSMENT OF DATA ACQUISITION ERROR FOR LINEAR FEATURES
 ASSESSMENT OF DATA ACQUISITION ERROR FOR LINEAR FEATURES Lysandros TSOULOS, Andriani SKOPELITI Faculty of Rural and Surveying Engineering - Cartography Laboratory National Technical University of Athens
Development of a Cartographic Expert System
 Development of a Cartographic Expert System Research Team Lysandros Tsoulos, Associate Professor, NTUA Constantinos Stefanakis, Dipl. Eng, M.App.Sci., PhD 1. Introduction Cartographic design and production
A GENERALIZATION OF CONTOUR LINE BASED ON THE EXTRACTION AND ANALYSIS OF DRAINAGE SYSTEM
 A GENERALIZATION OF CONTOUR LINE BASED ON THE EXTRACTION AND ANALYSIS OF DRAINAGE SYSTEM Tinghua Ai School of Resource and Environment Sciences Wuhan University, 430072, China, tinghua_ai@tom.com Commission
The Development of Research on Automated Geographical Informational Generalization in China
 The Development of Research on Automated Geographical Informational Generalization in China Wu Fang, Wang Jiayao, Deng Hongyan, Qian Haizhong Department of Cartography, Zhengzhou Institute of Surveying
A cartographic approach of the process of map symbolization on gvsig software
 A cartographic approach of the process of map symbolization on gvsig software Vassilios Krassanakis Dipl. Eng., PhD Cand. NTUA krasvas@mail.ntua.gr http://users.ntua.gr/krasvas Vasilis Mitropoulos Dipl.
Watershed Modeling With DEMs
 Watershed Modeling With DEMs Lesson 6 6-1 Objectives Use DEMs for watershed delineation. Explain the relationship between DEMs and feature objects. Use WMS to compute geometric basin data from a delineated
software, just as word processors or databases are. GIS was originally developed and cartographic capabilities have been augmented by analysis tools.
 1. INTRODUCTION 1.1Background A GIS is a Geographic Information System, a software package for creating, viewing, and analyzing geographic information or spatial data. GIS is a class of software, just
Chapter 2 Direct Current Circuits
 Chapter 2 Direct Current Circuits 2.1 Introduction Nowadays, our lives are increasingly dependent upon the availability of devices that make extensive use of electric circuits. The knowledge of the electrical
Georelational Vector Data Model
 Georelational Vector Data Model Contents Georelational Data Model Representation of Simple Features Topology Non-topological Vector Data Data Models for Composite Features Geo-relational Looking at a paper
GIS (GEOGRAPHIC INFORMATION SYSTEMS)
") GIS (GEOGRAPHIC INFORMATION SYSTEMS) 1 1. DEFINITION SYSTEM Any organised assembly of resources and procedures united and regulated by interaction or interdependence to complete a set of specific functions.
GIS (GEOGRAPHIC INFORMATION SYSTEMS) 1 1. DEFINITION SYSTEM Any organised assembly of resources and procedures united and regulated by interaction or interdependence to complete a set of specific functions.
Imago: open-source toolkit for 2D chemical structure image recognition
 Imago: open-source toolkit for 2D chemical structure image recognition Viktor Smolov *, Fedor Zentsev and Mikhail Rybalkin GGA Software Services LLC Abstract Different chemical databases contain molecule
NR402 GIS Applications in Natural Resources
 NR402 GIS Applications in Natural Resources Lesson 1 Introduction to GIS Eva Strand, University of Idaho Map of the Pacific Northwest from http://www.or.blm.gov/gis/ Welcome to NR402 GIS Applications in
Version 1.1 GIS Syllabus
 GEOGRAPHIC INFORMATION SYSTEMS CERTIFICATION Version 1.1 GIS Syllabus Endorsed 1 Version 1 January 2007 GIS Certification Programme 1. Target The GIS certification is aimed at: Those who wish to demonstrate
Exploring the map reading process with eye movement analysis
 Exploring the map reading process with eye movement analysis Vassilios Krassanakis School of Rural & Surveying Engineering, National Technical University of Athens 9, Heroon Polytechniou Str., Zographos,
Map automatic scale reduction by means of mathematical morphology
 Map automatic scale reduction by means of mathematical morphology Luiz Alberto Vieira Dias 1 Júlio Cesar Lima d Alge 2 Fernando Augusto Mitsuo Ii 2 Sílvia Shizue Ii 2 National Institute for Space Research
GIS Generalization Dr. Zakaria Yehia Ahmed GIS Consultant Ain Shams University Tel: Mobile:
 GIS Generalization Dr. Zakaria Yehia Ahmed GIS Consultant Ain Shams University Tel: 24534976 Mobile: 01223384254 zyehia2005@yahoo.com Abstract GIS Generalization makes data less-detailed and less-complex
INTELLIGENT GENERALISATION OF URBAN ROAD NETWORKS. Alistair Edwardes and William Mackaness
 INTELLIGENT GENERALISATION OF URBAN ROAD NETWORKS Alistair Edwardes and William Mackaness Department of Geography, University of Edinburgh, Drummond Street, EDINBURGH EH8 9XP, Scotland, U.K. Tel. 0131
PROANA A USEFUL SOFTWARE FOR TERRAIN ANALYSIS AND GEOENVIRONMENTAL APPLICATIONS STUDY CASE ON THE GEODYNAMIC EVOLUTION OF ARGOLIS PENINSULA, GREECE.
 PROANA A USEFUL SOFTWARE FOR TERRAIN ANALYSIS AND GEOENVIRONMENTAL APPLICATIONS STUDY CASE ON THE GEODYNAMIC EVOLUTION OF ARGOLIS PENINSULA, GREECE. Spyridoula Vassilopoulou * Institute of Cartography
A grid model for the design, coordination and dimensional optimization in architecture
 A grid model for the design, coordination and dimensional optimization in architecture D.Léonard 1 and O. Malcurat 2 C.R.A.I. (Centre de Recherche en Architecture et Ingénierie) School of Architecture
Applied Cartography and Introduction to GIS GEOG 2017 EL. Lecture-2 Chapters 3 and 4
 Applied Cartography and Introduction to GIS GEOG 2017 EL Lecture-2 Chapters 3 and 4 Vector Data Modeling To prepare spatial data for computer processing: Use x,y coordinates to represent spatial features
GIS Data Structure: Raster vs. Vector RS & GIS XXIII
 Subject Paper No and Title Module No and Title Module Tag Geology Remote Sensing and GIS GIS Data Structure: Raster vs. Vector RS & GIS XXIII Principal Investigator Co-Principal Investigator Co-Principal
Generalized map production: Italian experiences
 Generalized map production: Italian experiences FIG Working Week 2012 Knowing to manage the territory, protect the environment, evaluate the cultural heritage Rome, Italy, 6-10 May 2012 Gabriele GARNERO,
Topic Contents. Factoring Methods. Unit 3: Factoring Methods. Finding the square root of a number
 Topic Contents Factoring Methods Unit 3 The smallest divisor of an integer The GCD of two numbers Generating prime numbers Computing prime factors of an integer Generating pseudo random numbers Raising
Cartography and Geovisualization. Chapters 12 and 13 of your textbook
 Cartography and Geovisualization Chapters 12 and 13 of your textbook Why cartography? Maps are the principle means of displaying spatial data Exploration: visualization, leading to conceptualization of
GEO-DATA INPUT AND CONVERSION. Christos G. Karydas,, Dr. Lab of Remote Sensing and GIS Director: Prof. N. Silleos
 Christos G. Karydas,, Dr. xkarydas@agro.auth.gr http://users.auth.gr/xkarydas Lab of Remote Sensing and GIS Director: Prof. N. Silleos School of Agriculture Aristotle University of Thessaloniki, GR 1 0.
Topic 9: Proportional Symbol Mapping Chapter 9: Chang Chapter 8: Dent
 Geography 38/42:286 GIS 1 Topic 9: Proportional Symbol Mapping Chapter 9: Chang Chapter 8: Dent 1 What is a Proportional Symbol Map? Depicts spatial variations in value or magnitude Using proportionally
Geographers Perspectives on the World
 What is Geography? Geography is not just about city and country names Geography is not just about population and growth Geography is not just about rivers and mountains Geography is a broad field that
Quality and Coverage of Data Sources
 Quality and Coverage of Data Sources Objectives Selecting an appropriate source for each item of information to be stored in the GIS database is very important for GIS Data Capture. Selection of quality
Keith C. Clarke Department of Geologyand Geography Hunter College-CUNY 695 Park Avenue New York, NY 10021,USA
 DISTORTION ON THE INTERRUPTED MODIFIED COLLIGNON PROJECTION Keith C. Clarke Department of Geologyand Geography Hunter College-CUNY 695 Park Avenue New York, NY 10021,USA and Karen A. Mulcahy Earth and
AUTOMATING GENERALIZATION TOOLS AND MODELS
 AUTOMATING GENERALIZATION TOOLS AND MODELS Dan Lee and Paul Hardy ESRI, Inc. 380 New York St., Redlands CA 92373, USA Telephone: (909) 793-2853; Fax: (909) 793-5953 E-mail: dlee@esri.com; phardy@esri.com
Geographic Information Systems (GIS) in Environmental Studies ENVS Winter 2003 Session III
 in Environmental Studies ENVS Winter 2003 Session III") Geographic Information Systems (GIS) in Environmental Studies ENVS 6189 3.0 Winter 2003 Session III John Sorrell York University sorrell@yorku.ca Session Purpose: To discuss the various concepts of space,
Geographic Information Systems (GIS) in Environmental Studies ENVS 6189 3.0 Winter 2003 Session III John Sorrell York University sorrell@yorku.ca Session Purpose: To discuss the various concepts of space,
A NEW SET THEORY FOR ANALYSIS
 Article A NEW SET THEORY FOR ANALYSIS Juan Pablo Ramírez 0000-0002-4912-2952 Abstract: We present the real number system as a generalization of the natural numbers. First, we prove the co-finite topology,
Volume vs. Diameter. Teacher Lab Discussion. Overview. Picture, Data Table, and Graph
 5 6 7 Middle olume Length/olume vs. Diameter, Investigation page 1 of olume vs. Diameter Teacher Lab Discussion Overview Figure 1 In this experiment we investigate the relationship between the diameter
Large scale road network generalization for vario-scale map
 Large scale road network generalization for vario-scale map Radan Šuba 1, Martijn Meijers 1 and Peter van Oosterom 1 Abstract The classical approach for road network generalization consists of producing
Digital Image Processing COSC 6380/4393
 Digital Image Processing COSC 6380/4393 Lecture 7 Sept 11 th, 2018 Pranav Mantini Slides from Dr. Shishir K Shah and Frank (Qingzhong) Liu Today Review Binary Image Processing Opening and Closing Skeletonization
Using ArcGIS for Hydrology and Watershed Analysis:
 Using ArcGIS 10.2.2 for Hydrology and Watershed Analysis: A guide for running hydrologic analysis using elevation and a suite of ArcGIS tools Anna Nakae Feb. 10, 2015 Introduction Hydrology and watershed
Grade 8 Mathematics MCA Item Sampler Teacher Guide
 Grade 8 Mathematics MCA Item Sampler Teacher Guide Overview of Item Samplers Item samplers are one type of student resource provided to help students and educators prepare for test administration. While
Introduction to GIS I
 Introduction to GIS Introduction How to answer geographical questions such as follows: What is the population of a particular city? What are the characteristics of the soils in a particular land parcel?
Chapter 1: Logic systems
 Chapter 1: Logic systems 1: Logic gates Learning Objectives: At the end of this topic you should be able to: identify the symbols and truth tables for the following logic gates: NOT AND NAND OR NOR XOR
Application of Topology to Complex Object Identification. Eliseo CLEMENTINI University of L Aquila
 Application of Topology to Complex Object Identification Eliseo CLEMENTINI University of L Aquila Agenda Recognition of complex objects in ortophotos Some use cases Complex objects definition An ontology
Overview key concepts and terms (based on the textbook Chang 2006 and the practical manual)
") Introduction Geo-information Science (GRS-10306) Overview key concepts and terms (based on the textbook 2006 and the practical manual) Introduction Chapter 1 Geographic information system (GIS) Geographically
Introduction Geo-information Science (GRS-10306) Overview key concepts and terms (based on the textbook 2006 and the practical manual) Introduction Chapter 1 Geographic information system (GIS) Geographically
A STUDY ON INCREMENTAL OBJECT-ORIENTED MODEL AND ITS SUPPORTING ENVIRONMENT FOR CARTOGRAPHIC GENERALIZATION IN MULTI-SCALE SPATIAL DATABASE
 A STUDY ON INCREMENTAL OBJECT-ORIENTED MODEL AND ITS SUPPORTING ENVIRONMENT FOR CARTOGRAPHIC GENERALIZATION IN MULTI-SCALE SPATIAL DATABASE Fan Wu Lina Dang Xiuqin Lu Weiming Su School of Resource & Environment
GRE Quantitative Reasoning Practice Questions
 GRE Quantitative Reasoning Practice Questions y O x 7. The figure above shows the graph of the function f in the xy-plane. What is the value of f (f( ))? A B C 0 D E Explanation Note that to find f (f(
Understanding Geographic Information System GIS
 Understanding Geographic Information System GIS What do we know about GIS? G eographic I nformation Maps Data S ystem Computerized What do we know about maps? Types of Maps (Familiar Examples) Street Maps
IB Physics STUDENT GUIDE 13 and Processing (DCP)
") IB Physics STUDENT GUIDE 13 Chapter Data collection and PROCESSING (DCP) Aspect 1 Aspect Aspect 3 Levels/marks Recording raw data Processing raw data Presenting processed data Complete/ Partial/1 Not at
IB Physics STUDENT GUIDE 13 Chapter Data collection and PROCESSING (DCP) Aspect 1 Aspect Aspect 3 Levels/marks Recording raw data Processing raw data Presenting processed data Complete/ Partial/1 Not at
JUNCTION MODELING IN VEHICLE NAVIGATION MAPS AND MULTIPLE REPRESENTATIONS
 JUNCTION MODELING IN VEHICLE NAVIGATION MAPS AND MULTIPLE REPRESENTATIONS A. O. Dogru a and N. N. Ulugtekin a a ITU, Civil Engineering Faculty, 34469 Maslak Istanbul, Turkey - (dogruahm, ulugtek)@itu.edu.tr
A CONTINUOUS TRANSFORMATION USEFUL FOR DISTRICTING 1. W. R. Tobler Department of Geography University of Michigan Ann Arbor, Michigan 48104
 A CONTINUOUS TRANSFORMATION USEFUL FOR DISTRICTING 1 W. R. Tobler Department of Geography University of Michigan Ann Arbor, Michigan 48104 Abstract: Imagine that one could stretch a geographical map so
Introduction to Computer Graphics (Lecture No 07) Ellipse and Other Curves
 Ellipse and Other Curves") Introduction to Computer Graphics (Lecture No 07) Ellipse and Other Curves 7.1 Ellipse An ellipse is a curve that is the locus of all points in the plane the sum of whose distances r1 and r from two fixed
Introduction to Computer Graphics (Lecture No 07) Ellipse and Other Curves 7.1 Ellipse An ellipse is a curve that is the locus of all points in the plane the sum of whose distances r1 and r from two fixed
ArcGIS Tools for Professional Cartography
 ArcGIS Tools for Professional Cartography By Makram Murad-al-shaikh M.S. Cartography Senior instructor ESRI Educational Services ICC - A Coruña - Spain, 9-16 July, 2005 Overview Overview of the ArcGIS
Assisted cartographic generalization: Can we learn from classical maps?
 Assisted cartographic generalization: Can we learn from classical maps? Vaclav Talhofer *, Libuse Sokolova ** * University of Defence, Department of Military Geography and Meteorology, Brno, the Czech
Implementing Visual Analytics Methods for Massive Collections of Movement Data
 Implementing Visual Analytics Methods for Massive Collections of Movement Data G. Andrienko, N. Andrienko Fraunhofer Institute Intelligent Analysis and Information Systems Schloss Birlinghoven, D-53754
GEOGRAPHIC INFORMATION SYSTEMS Session 8
 GEOGRAPHIC INFORMATION SYSTEMS Session 8 Introduction Geography underpins all activities associated with a census Census geography is essential to plan and manage fieldwork as well as to report results
UNDER REVIEW. Abstract
 UNDER REVIEW Getting To Know ArcGIS Desktop By: Ormsby, Napoleon, Burke, Groessl, and Bowden, (2010). Format: (Softcover, 592 pp. ISBN: 9781589482609) Publisher: Redlands, California: ESRI Press Abstract
![)UDQFR54XHQWLQ(DQG'tD]'HOJDGR&](/thumbs/95/125846872.jpg ")UDQFR54XHQWLQ(DQG'tD]'HOJDGR&") &21&(37,21$1',03/(0(17$7,212)$1+
&21&(37,21$1',03/(0(17$7,212)$1+ Petrel TIPS&TRICKS from SCM
 Petrel TIPS&TRICKS from SCM Knowledge Worth Sharing Fault Model Quality Control Most Petrel projects are faulted. This means that fault models must be built and then checked for accuracy in almost every
Harmonizing Level of Detail in OpenStreetMap Based Maps
 Harmonizing Level of Detail in OpenStreetMap Based Maps G. Touya 1, M. Baley 1 1 COGIT IGN France, 73 avenue de Paris 94165 Saint-Mandé France Email: guillaume.touya{at}ign.fr 1. Introduction As OpenStreetMap
Fall For each standard, the table below shows the applicable Catchup Math curriculum. Covered in Subject and Chapter Programs
 Catchup Math and the Common Core Standards Fall 2012 The Catchup Math curriculum addresses nearly all the Common Core Mathematics Standards for Grades 6-8 and High School (including most of the optional
Choosing a Suitable Projection for Navigation in the Arctic
 Choosing a Suitable Projection for Navigation in the Arctic Dr. Andriani Skopeliti, Prof. Lysandros Tsoulos Cartography Laboratory, School of Rural and Surveying Engineering, National Technical University
Geometric Algorithms in GIS
 Geometric Algorithms in GIS GIS Software Dr. M. Gavrilova GIS System What is a GIS system? A system containing spatially referenced data that can be analyzed and converted to new information for a specific
Interactions between Levels in an Agent Oriented Model for Generalisation
 Interactions between Levels in an Agent Oriented Model for Generalisation Adrien Maudet Université Paris-Est, IGN, COGIT, Saint-Mandé, France adrien.maudet@ign.fr Abstract. Generalisation is a complex
SPATIAL DATA MINING. Ms. S. Malathi, Lecturer in Computer Applications, KGiSL - IIM
 SPATIAL DATA MINING Ms. S. Malathi, Lecturer in Computer Applications, KGiSL - IIM INTRODUCTION The main difference between data mining in relational DBS and in spatial DBS is that attributes of the neighbors
Research Reflections
 David C. Yang Research Reflections 1 Personal Section Prior to my Intel research project, I had tried to get a research project with several local universities. However, all of my attempts collapsed for
GIS APPLICATIONS IN SOIL SURVEY UPDATES
 GIS APPLICATIONS IN SOIL SURVEY UPDATES ABSTRACT Recent computer hardware and GIS software developments provide new methods that can be used to update existing digital soil surveys. Multi-perspective visualization
Some aspects of the generalization of smallscale digital elevation models
 Some aspects of the generalization of smallscale digital elevation models Zsuzsanna Ungvári*, Renáta Szabó** * PhD Student at Eötvös Loránd University (ELTE), Department of Cartography and Geoinformatics,
Combining Memory and Landmarks with Predictive State Representations
 Combining Memory and Landmarks with Predictive State Representations Michael R. James and Britton Wolfe and Satinder Singh Computer Science and Engineering University of Michigan {mrjames, bdwolfe, baveja}@umich.edu
Mathematics skills framework
 Mathematics skills framework The framework for MYP mathematics outlines four branches of mathematical study. Schools can use the framework for mathematics as a tool for curriculum mapping when designing
Dynamical billiards 1
 Dynamical billiards 1 Vladimir Georgiev, Irena Georgieva, Veneta Nedyalkova 1 Short introduction Dynamical billiard is a dynamical system corresponding to the inertial motion of a point mass within a region
Lecture 2. A Review: Geographic Information Systems & ArcGIS Basics
 Lecture 2 A Review: Geographic Information Systems & ArcGIS Basics GIS Overview Types of Maps Symbolization & Classification Map Elements GIS Data Models Coordinate Systems and Projections Scale Geodatabases
Theory, Concepts and Terminology
 GIS Workshop: Theory, Concepts and Terminology 1 Theory, Concepts and Terminology Suggestion: Have Maptitude with a map open on computer so that we can refer to it for specific menu and interface items.
Simulated Annealing for Constrained Global Optimization
 Monte Carlo Methods for Computation and Optimization Final Presentation Simulated Annealing for Constrained Global Optimization H. Edwin Romeijn & Robert L.Smith (1994) Presented by Ariel Schwartz Objective
PRELIMINARY ANALYSIS OF ACCURACY OF CONTOUR LINES USING POSITIONAL QUALITY CONTROL METHODOLOGIES FOR LINEAR ELEMENTS
 CO-051 PRELIMINARY ANALYSIS OF ACCURACY OF CONTOUR LINES USING POSITIONAL QUALITY CONTROL METHODOLOGIES FOR LINEAR ELEMENTS UREÑA M.A., MOZAS A.T., PÉREZ J.L. Universidad de Jaén, JAÉN, SPAIN ABSTRACT
Geog 469 GIS Workshop. Data Analysis
 Geog 469 GIS Workshop Data Analysis Outline 1. What kinds of need-to-know questions can be addressed using GIS data analysis? 2. What is a typology of GIS operations? 3. What kinds of operations are useful
Improving Map Generalisation of Buildings by Introduction of Urban Context Rules
 Improving Map Generalisation of Buildings by Introduction of Urban Context Rules S. Steiniger 1, P. Taillandier 2 1 University of Zurich, Department of Geography, Winterthurerstrasse 190, CH 8057 Zürich,