Chapter 8 Statistical Quality Control, 7th Edition by Douglas C. Montgomery. Copyright (c) 2013 John Wiley & Sons, Inc.
|
|
|
- Chloe Peters
- 5 years ago
- Views:
Transcription

1 1
2 Learning Objectives Chapter 8 Statistical Quality Control, 7th Edition by Douglas C. Montgomery. 2
3 Process Capability Natural tolerance limits are defined as follows: Chapter 8 Statistical Quality Control, 7th Edition by Douglas C. Montgomery. 3


4 Uses of process capability data: Chapter 8 Statistical Quality Control, 7th Edition by Douglas C. Montgomery. 4
5 Reasons for Poor Process Capability Process may have good potential capability Chapter 8 Statistical Quality Control, 7th Edition by Douglas C. Montgomery. 5

6 6

7 7
8 8
9 Probability Plotting Chapter 8 Statistical Quality Control, 7th Edition by Douglas C. Montgomery. 9

10 The distribution may not be normal; other types of probability plots can be useful in determining the appropriate distribution. Chapter 8 Statistical Quality Control, 7th Edition by Douglas C. Montgomery. 10
11 11
12 12
13 For the hard bake process: Chapter 8 Statistical Quality Control, 7th Edition by Douglas C. Montgomery. 13
14 One-Sided PCR Chapter 8 Statistical Quality Control, 7th Edition by Douglas C. Montgomery. 14

15 Interpretation of the PCR Chapter 8 Statistical Quality Control, 7th Edition by Douglas C. Montgomery. 15
16 Assumptions for Interpretation of Numbers in Table 8.2 Violation of these assumptions can lead to big trouble in using the data in Table 8.2. Chapter 8 Statistical Quality Control, 7th Edition by Douglas C. Montgomery. 16

17 17
18 C p does not take process centering into account It is a measure of potential capability, not actual capability Chapter 8 Statistical Quality Control, 7th Edition by Douglas C. Montgomery. 18
19 A Measure of Actual Capability Chapter 8 Statistical Quality Control, 7th Edition by Douglas C. Montgomery. 19
20 Normality and Process Capability Ratios The assumption of normality is critical to the usual interpretation of these ratios (such as Table 8.2) For non-normal data, options are 1. Transform non-normal data to normal 2. Extend the usual definitions of PCRs to handle non-normal data 3. Modify the definitions of PCRs for general families of distributions Chapter 8 Statistical Quality Control, 7th Edition by Douglas C. Montgomery. 20
21 Other Types of Process Capability Ratios First generation Second generation Third generation Lots of research has been done to develop ratios that overcome some of the problems with the basic ones Not much evidence that these ratios are used to any significant extent in practice Chapter 8 Statistical Quality Control, 7th Edition by Douglas C. Montgomery. 21

22 22
23 23
24 24
25 25

26 26

27 27

28 Process Capability Analysis using Control Charts Chapter 8 Statistical Quality Control, 7th Edition by Douglas C. Montgomery. 28
29 Since LSL = 200 Chapter 8 Statistical Quality Control, 7th Edition by Douglas C. Montgomery. 29

30 30
31 31
32 32
33 33
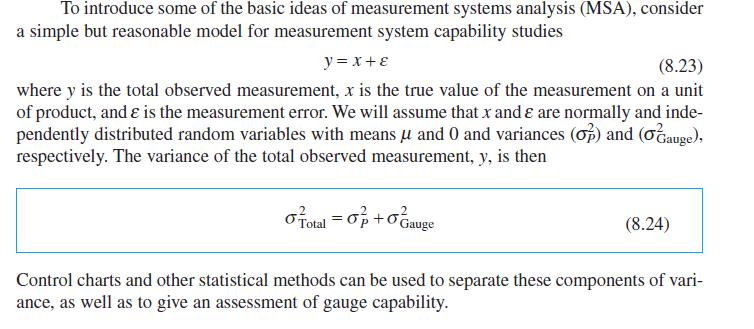
34 7.8 Gauge and Measurement Systems Capability Studies Determine how much of the observed variability is due to the gauge or measurement system Isolate the components of variability in the measurement system Assess whether the gauge is capable (suitable for the intended application) Chapter 8 Statistical Quality Control, 7th Edition by Douglas C. Montgomery. 34
35 35

36 36

37 37
38 The P/T ratio: Chapter 8 Statistical Quality Control, 7th Edition by Douglas C. Montgomery. 38

39 39
40 Estimating the Variance Components Chapter 8 Statistical Quality Control, 7th Edition by Douglas C. Montgomery. 40
41 41
42 The gauge is not capable by this criterion Chapter 8 Statistical Quality Control, 7th Edition by Douglas C. Montgomery. 42
43 Discrimination Ratio Chapter 8 Statistical Quality Control, 7th Edition by Douglas C. Montgomery. 43
44 Accuracy and Precision We have focused only on precision Chapter 8 Statistical Quality Control, 7th Edition by Douglas C. Montgomery. 44

45 Gauge R&R Studies Chapter 8 Statistical Quality Control, 7th Edition by Douglas C. Montgomery. 45
46 Gauge R&R Studies Are Usually Conducted with a Factorial Experiment Chapter 8 Statistical Quality Control, 7th Edition by Douglas C. Montgomery. 46

47 This is a two-factor factorial experiment ANOVA methods are used to analyze the data and yo estimate the variance components Chapter 8 Statistical Quality Control, 7th Edition by Douglas C. Montgomery. 47
48 48
49 49
50 50
51 51
52 Negative estimates of a variance component would lead to filling a reduced model, such as, for example: Chapter 8 Statistical Quality Control, 7th Edition by Douglas C. Montgomery. 52
53 53
54 For this Example Chapter 8 Statistical Quality Control, 7th Edition by Douglas C. Montgomery. 54
55 Other Topics in Gauge R&R Studies Section provides a description of methods to obtain confidence intervals on the variance components and measures of gauge R&R Section presents a new measure of gauge capability, the probabilities of misclassification of parts Rejecting good units (producer s risk) Passing bad units (consumer s risk) Methods for calculating these two probabilities are given Chapter 8 Statistical Quality Control, 7th Edition by Douglas C. Montgomery. 55
56 8.7.5 Attribute Gauge Capability Sometimes the output of a gauge isn t numerical it s just pass/fail Nominal or ordinal data is also common Occurs frequently in service businesses Common situation do operating personnel consistently make the same decisions regarding the units they are inspecting or analyzing Example a bank uses manual underwriting of mortgage loans The underwriter uses information to classify the applicant into one of four categories; decline or category 1, 2, 3 categories 2 & 3 are low-risk and 1 is high risk Compare underwriters performance relative to a consensus evaluation determined by a panel of experts Chapter 8 Statistical Quality Control, 7th Edition by Douglas C. Montgomery. 56

57 Thirty applicants, three underwriters Each underwriter evaluates each application twice The applications are blinded by removing names, SSNs, addresses, and other identifying information Chapter 8 Statistical Quality Control, 7th Edition by Douglas C. Montgomery. 57
58 Attribute Gauge Capability Determine the proportion of time that the underwriter agrees with him/herself this measures repeatability Determine the proportion of time that the underwriter agrees with the correct classification this measures bias Minitab performs the analysis using the attribute agreement analysis routine Chapter 8 Statistical Quality Control, 7th Edition by Douglas C. Montgomery. 58

59 59
60 60

61 61

62 62

63 63

64 64
65 8.8 Setting Specifications on Discrete Components Components interact with other components Complex assemblies Tolerance stack-up problems Linear combinations Nonlinear combinations Chapter 8 Statistical Quality Control, 7th Edition by Douglas C. Montgomery. 65
66 66

67 67


68 68
69 69

70 70
71 71
72 8.9 Estimating the Natural Tolerance Limits of a Process For a normal distribution with unknown mean and variance: Difference between tolerance limits and confidence limits Nonparametric tolerance limits can also be calculated Chapter 8 Statistical Quality Control, 7th Edition by Douglas C. Montgomery. 72

73 73

74 74
75 Learning Objectives Chapter 8 Statistical Quality Control, 7th Edition by Douglas C. Montgomery. 75
Measurement Systems Analysis
 Measurement Systems Analysis Since measurement systems represent a subprocess within a process They are subject to Variation. What could be the source of this variation? Why do Measurements Vary? Possible
Preface Introduction to Statistics and Data Analysis Overview: Statistical Inference, Samples, Populations, and Experimental Design The Role of
 Preface Introduction to Statistics and Data Analysis Overview: Statistical Inference, Samples, Populations, and Experimental Design The Role of Probability Sampling Procedures Collection of Data Measures
Statistical Quality Control, IE 3255 March Homework #6 Due: Fri, April points
 Statistical Quality Control, IE 355 March 30 007 Homework #6 Due: Fri, April 6 007 00 points Use Ecel, Minitab and a word processor to present quality answers to the following statistical process control
CHAPTER 17 CHI-SQUARE AND OTHER NONPARAMETRIC TESTS FROM: PAGANO, R. R. (2007)
") FROM: PAGANO, R. R. (007) I. INTRODUCTION: DISTINCTION BETWEEN PARAMETRIC AND NON-PARAMETRIC TESTS Statistical inference tests are often classified as to whether they are parametric or nonparametric Parameter
FROM: PAGANO, R. R. (007) I. INTRODUCTION: DISTINCTION BETWEEN PARAMETRIC AND NON-PARAMETRIC TESTS Statistical inference tests are often classified as to whether they are parametric or nonparametric Parameter
12.10 (STUDENT CD-ROM TOPIC) CHI-SQUARE GOODNESS- OF-FIT TESTS
 CHI-SQUARE GOODNESS- OF-FIT TESTS") CDR4_BERE601_11_SE_C1QXD 1//08 1:0 PM Page 1 110: (Student CD-ROM Topic) Chi-Square Goodness-of-Fit Tests CD1-1 110 (STUDENT CD-ROM TOPIC) CHI-SQUARE GOODNESS- OF-FIT TESTS In this section, χ goodness-of-fit
CDR4_BERE601_11_SE_C1QXD 1//08 1:0 PM Page 1 110: (Student CD-ROM Topic) Chi-Square Goodness-of-Fit Tests CD1-1 110 (STUDENT CD-ROM TOPIC) CHI-SQUARE GOODNESS- OF-FIT TESTS In this section, χ goodness-of-fit
STATISTICS ( CODE NO. 08 ) PAPER I PART - I
 PAPER I PART - I") STATISTICS ( CODE NO. 08 ) PAPER I PART - I 1. Descriptive Statistics Types of data - Concepts of a Statistical population and sample from a population ; qualitative and quantitative data ; nominal and
STATISTICS ( CODE NO. 08 ) PAPER I PART - I 1. Descriptive Statistics Types of data - Concepts of a Statistical population and sample from a population ; qualitative and quantitative data ; nominal and
Greg Larsen G. A. Larsen Consulting Ops A La Carte
 Greg Larsen G. A. Larsen Consulting Ops A La Carte 2/23/2012 1 Discriminate among products Monitor performance of production process Manufacturing process improvement Specification setting 2/23/2012 2
Process Capability Analysis Using Experiments
 Process Capability Analysis Using Experiments A designed experiment can aid in separating sources of variability in a quality characteristic. Example: bottling soft drinks Suppose the measured syrup content
Basic Business Statistics, 10/e
 Chapter 1 1-1 Basic Business Statistics 11 th Edition Chapter 1 Chi-Square Tests and Nonparametric Tests Basic Business Statistics, 11e 009 Prentice-Hall, Inc. Chap 1-1 Learning Objectives In this chapter,
Learning Objectives 15.1 The Acceptance-Sampling Problem
 Learning Objectives 5. The Acceptance-Sampling Problem Acceptance sampling plan (ASP): ASP is a specific plan that clearly states the rules for sampling and the associated criteria for acceptance or otherwise.
Performance Evaluation and Comparison
 Outline Hong Chang Institute of Computing Technology, Chinese Academy of Sciences Machine Learning Methods (Fall 2012) Outline Outline I 1 Introduction 2 Cross Validation and Resampling 3 Interval Estimation
University of Huddersfield Repository
 University of Huddersfield Repository Ding, Hao, Qi, Qunfen, Scott, Paul J. and Jiang, Xiang An ANOVA method of evaluating the specification uncertainty in roughness measurement Original Citation Ding,
How to do a Gage R&R when you can t do a Gage R&R
 How to do a Gage R&R when you can t do a Gage R&R Thomas Rust Reliability Engineer / Trainer 1 FTC2017 GRR when you can't GRR - Thomas Rust Internal References 2 What are you Measuring 3 Measurement Process
Statistical Quality Control - Stat 3081
 Statistical Quality Control - Stat 3081 Awol S. Department of Statistics College of Computing & Informatics Haramaya University Dire Dawa, Ethiopia March 2015 Introduction Industrial Statistics and Quality
Gage repeatability & reproducibility (R&R) studies are widely used to assess measurement system
 studies are widely used to assess measurement system") QUALITY AND RELIABILITY ENGINEERING INTERNATIONAL Qual. Reliab. Engng. Int. 2008; 24:99 106 Published online 19 June 2007 in Wiley InterScience (www.interscience.wiley.com)..870 Research Some Relationships
QUALITY AND RELIABILITY ENGINEERING INTERNATIONAL Qual. Reliab. Engng. Int. 2008; 24:99 106 Published online 19 June 2007 in Wiley InterScience (www.interscience.wiley.com)..870 Research Some Relationships
Design of Engineering Experiments Part 2 Basic Statistical Concepts Simple comparative experiments
 Design of Engineering Experiments Part 2 Basic Statistical Concepts Simple comparative experiments The hypothesis testing framework The two-sample t-test Checking assumptions, validity Comparing more that
MIL-STD-750 NOTICE 5 METHOD
 MIL-STD-750 *STEADY-STATE THERMAL IMPEDANCE AND TRANSIENT THERMAL IMPEDANCE TESTING OF TRANSISTORS (DELTA BASE EMITTER VOLTAGE METHOD) * 1. Purpose. The purpose of this test is to determine the thermal
How to evaluate credit scorecards - and why using the Gini coefficient has cost you money
 How to evaluate credit scorecards - and why using the Gini coefficient has cost you money David J. Hand Imperial College London Quantitative Financial Risk Management Centre August 2009 QFRMC - Imperial
Statistics Toolbox 6. Apply statistical algorithms and probability models
 Statistics Toolbox 6 Apply statistical algorithms and probability models Statistics Toolbox provides engineers, scientists, researchers, financial analysts, and statisticians with a comprehensive set of
Statistical quality control (SQC)
") Statistical quality control (SQC) The application of statistical techniques to measure and evaluate the quality of a product, service, or process. Two basic categories: I. Statistical process control (SPC):
Statistical quality control (SQC) The application of statistical techniques to measure and evaluate the quality of a product, service, or process. Two basic categories: I. Statistical process control (SPC):
Generalization to Multi-Class and Continuous Responses. STA Data Mining I
 Generalization to Multi-Class and Continuous Responses STA 5703 - Data Mining I 1. Categorical Responses (a) Splitting Criterion Outline Goodness-of-split Criterion Chi-square Tests and Twoing Rule (b)
Parametric versus Nonparametric Statistics-when to use them and which is more powerful? Dr Mahmoud Alhussami
 Parametric versus Nonparametric Statistics-when to use them and which is more powerful? Dr Mahmoud Alhussami Parametric Assumptions The observations must be independent. Dependent variable should be continuous
CHAPTER 9 AVAILABILITY DEMONSTRATION PLANS CONTENTS
 Applied R&M Manual for Defence Systems Part D Supporting Theory CHAPTER 9 AVAILABILITY DEMONSTRATION PLANS CONTENTS 1 INTRODUCTION 2 2 CONCEPTS AND TERMINOLOGY 2 3 STATISTICAL TEST PLANNING 4 4 DEMONSTRATION
STAT 506: Randomized complete block designs
 STAT 506: Randomized complete block designs Timothy Hanson Department of Statistics, University of South Carolina STAT 506: Introduction to Experimental Design 1 / 10 Randomized complete block designs
A hybrid Measurement Systems Analysis and Uncertainty of Measurement Approach for Industrial Measurement in the Light Controlled Factory
 A hybrid Measurement Systems Analysis and Uncertainty of Measurement Approach for Industrial Measurement in the Light Controlled Factory J E Muelaner, A Francis, M Chappell, P G Maropoulos Laboratory for
Analysis of Variance
 Analysis of Variance Chapter 12 McGraw-Hill/Irwin Copyright 2013 by The McGraw-Hill Companies, Inc. All rights reserved. Learning Objectives LO 12-1 List the characteristics of the F distribution and locate
Linear Programming-based Data Mining Techniques And Credit Card Business Intelligence
 Linear Programming-based Data Mining Techniques And Credit Card Business Intelligence Yong Shi the Charles W. and Margre H. Durham Distinguished Professor of Information Technology University of Nebraska,
Contents. Preface to Second Edition Preface to First Edition Abbreviations PART I PRINCIPLES OF STATISTICAL THINKING AND ANALYSIS 1
 Contents Preface to Second Edition Preface to First Edition Abbreviations xv xvii xix PART I PRINCIPLES OF STATISTICAL THINKING AND ANALYSIS 1 1 The Role of Statistical Methods in Modern Industry and Services
Bayesian Decision Theory
 Bayesian Decision Theory Dr. Shuang LIANG School of Software Engineering TongJi University Fall, 2012 Today s Topics Bayesian Decision Theory Bayesian classification for normal distributions Error Probabilities
Decision Support. Dr. Johan Hagelbäck.
 Decision Support Dr. Johan Hagelbäck johan.hagelback@lnu.se http://aiguy.org Decision Support One of the earliest AI problems was decision support The first solution to this problem was expert systems
THE PRINCIPLES AND PRACTICE OF STATISTICS IN BIOLOGICAL RESEARCH. Robert R. SOKAL and F. James ROHLF. State University of New York at Stony Brook
 BIOMETRY THE PRINCIPLES AND PRACTICE OF STATISTICS IN BIOLOGICAL RESEARCH THIRD E D I T I O N Robert R. SOKAL and F. James ROHLF State University of New York at Stony Brook W. H. FREEMAN AND COMPANY New
Using SPSS for One Way Analysis of Variance
 Using SPSS for One Way Analysis of Variance This tutorial will show you how to use SPSS version 12 to perform a one-way, between- subjects analysis of variance and related post-hoc tests. This tutorial
TECH 646 Analysis of Research in Industry and Technology
 TECH 646 Analysis of Research in Industry and Technology PART III The Sources and Collection of data: Measurement, Measurement Scales, Questionnaires & Instruments, Sampling Ch. 14 Sampling Lecture note
Measurement Systems Analysis January 2015 Meeting. Steve Cox
 Measurement Systems Analysis January 2015 Meeting Steve Cox Steve Cox Currently retired 33 Years with 3M Mostly quality related: 37 total in Quality ASQ Certified Quality Engineer Certified Black Belt
Introduction to Statistical Analysis using IBM SPSS Statistics (v24)
") to Statistical Analysis using IBM SPSS Statistics (v24) to Statistical Analysis Using IBM SPSS Statistics is a two day instructor-led classroom course that provides an application-oriented introduction
to Statistical Analysis using IBM SPSS Statistics (v24) to Statistical Analysis Using IBM SPSS Statistics is a two day instructor-led classroom course that provides an application-oriented introduction
Lektion 6. Measurement system! Measurement systems analysis _3 Chapter 7. Statistical process control requires measurement of good quality!
 Lektion 6 007-1-06_3 Chapter 7 Measurement systems analysis Measurement system! Statistical process control requires measurement of good quality! Wrong conclusion about the process due to measurement error!
Test Strategies for Experiments with a Binary Response and Single Stress Factor Best Practice
 Test Strategies for Experiments with a Binary Response and Single Stress Factor Best Practice Authored by: Sarah Burke, PhD Lenny Truett, PhD 15 June 2017 The goal of the STAT COE is to assist in developing
THERMAL IMPEDANCE (RESPONSE) TESTING OF DIODES
 TESTING OF DIODES") METHOD 3101.3 THERMAL IMPEDANCE (RESPONSE) TESTING OF DIODES 1. Purpose. The purpose of this test is to determine the thermal performance of diode devices. This can be done in two ways, steady-state thermal
METHOD 3101.3 THERMAL IMPEDANCE (RESPONSE) TESTING OF DIODES 1. Purpose. The purpose of this test is to determine the thermal performance of diode devices. This can be done in two ways, steady-state thermal
Basic Business Statistics 6 th Edition
 Basic Business Statistics 6 th Edition Chapter 12 Simple Linear Regression Learning Objectives In this chapter, you learn: How to use regression analysis to predict the value of a dependent variable based
16.400/453J Human Factors Engineering. Design of Experiments II
 J Human Factors Engineering Design of Experiments II Review Experiment Design and Descriptive Statistics Research question, independent and dependent variables, histograms, box plots, etc. Inferential
Application of Gauge R&R Methods for Validation of Analytical Methods in the Pharmaceutical Industry
 Application of Gauge R&R Methods for Validation of Analytical Methods in the Pharmaceutical Industry Richard K Burdick Elion Labs QPRC Meetings June 2016 Collaborators David LeBlond, CMC Statistical Consultant
ME 418 Quality in Manufacturing ISE Quality Control and Industrial Statistics CHAPTER 07 ACCEPTANCE SAMPLING PLANS.
 University of Hail College of Engineering ME 418 Quality in Manufacturing ISE 320 - Quality Control and Industrial Statistics CHAPTER 07 ACCEPTANCE SAMPLING PLANS Professor Mohamed Aichouni http://cutt.us/maichouni
ECE521 Lecture7. Logistic Regression
 ECE521 Lecture7 Logistic Regression Outline Review of decision theory Logistic regression A single neuron Multi-class classification 2 Outline Decision theory is conceptually easy and computationally hard
BIOS 6222: Biostatistics II. Outline. Course Presentation. Course Presentation. Review of Basic Concepts. Why Nonparametrics.
 BIOS 6222: Biostatistics II Instructors: Qingzhao Yu Don Mercante Cruz Velasco 1 Outline Course Presentation Review of Basic Concepts Why Nonparametrics The sign test 2 Course Presentation Contents Justification
Intro. ANN & Fuzzy Systems. Lecture 15. Pattern Classification (I): Statistical Formulation
: Statistical Formulation") Lecture 15. Pattern Classification (I): Statistical Formulation Outline Statistical Pattern Recognition Maximum Posterior Probability (MAP) Classifier Maximum Likelihood (ML) Classifier K-Nearest Neighbor
Lecture 15. Pattern Classification (I): Statistical Formulation Outline Statistical Pattern Recognition Maximum Posterior Probability (MAP) Classifier Maximum Likelihood (ML) Classifier K-Nearest Neighbor
Method Validation Characteristics through Statistical Analysis Approaches. Jane Weitzel
 Method Validation Characteristics through Statistical Analysis Approaches Jane Weitzel mljweitzel@msn.com 1:00 to 2:30 Wednesday, Dec. 9 SESSION 6 ANALYTICAL PROCEDURES AND METHOD VALIDATION mljweitzel@msn.com
Chapter 20 : Two factor studies one case per treatment Chapter 21: Randomized complete block designs
 Chapter 20 : Two factor studies one case per treatment Chapter 21: Randomized complete block designs Adapted from Timothy Hanson Department of Statistics, University of South Carolina Stat 705: Data Analysis
1.0 Continuous Distributions. 5.0 Shapes of Distributions. 6.0 The Normal Curve. 7.0 Discrete Distributions. 8.0 Tolerances. 11.
 Chapter 4 Statistics 45 CHAPTER 4 BASIC QUALITY CONCEPTS 1.0 Continuous Distributions.0 Measures of Central Tendency 3.0 Measures of Spread or Dispersion 4.0 Histograms and Frequency Distributions 5.0
Bivariate Relationships Between Variables
 Bivariate Relationships Between Variables BUS 735: Business Decision Making and Research 1 Goals Specific goals: Detect relationships between variables. Be able to prescribe appropriate statistical methods
OHSU OGI Class ECE-580-DOE :Statistical Process Control and Design of Experiments Steve Brainerd Basic Statistics Sample size?
 ECE-580-DOE :Statistical Process Control and Design of Experiments Steve Basic Statistics Sample size? Sample size determination: text section 2-4-2 Page 41 section 3-7 Page 107 Website::http://www.stat.uiowa.edu/~rlenth/Power/
Business Statistics. Lecture 10: Course Review
 Business Statistics Lecture 10: Course Review 1 Descriptive Statistics for Continuous Data Numerical Summaries Location: mean, median Spread or variability: variance, standard deviation, range, percentiles,
Construction of a Tightened-Normal-Tightened Sampling Scheme by Variables Inspection. Abstract
 onstruction of a ightened-ormal-ightened Sampling Scheme by Variables Inspection Alexander A ugroho a,, hien-wei Wu b, and ani Kurniati a a Department of Industrial Management, ational aiwan University
Verification and Validation. CS1538: Introduction to Simulations
 Verification and Validation CS1538: Introduction to Simulations Steps in a Simulation Study Problem & Objective Formulation Model Conceptualization Data Collection Model translation, Verification, Validation
Chapter 8 of Devore , H 1 :
 Chapter 8 of Devore TESTING A STATISTICAL HYPOTHESIS Maghsoodloo A statistical hypothesis is an assumption about the frequency function(s) (i.e., PDF or pdf) of one or more random variables. Stated in
Terminology for Statistical Data
 Terminology for Statistical Data variables - features - attributes observations - cases (consist of multiple values) In a standard data matrix, variables or features correspond to columns observations
A Better Way to Do R&R Studies
 The Evaluating the Measurement Process Approach Last month s column looked at how to fix some of the Problems with Gauge R&R Studies. This month I will show you how to learn more from your gauge R&R data
Statistical Process Control
 Statistical Process Control Outline Statistical Process Control (SPC) Process Capability Acceptance Sampling 2 Learning Objectives When you complete this supplement you should be able to : S6.1 Explain
Finding Relationships Among Variables
 Finding Relationships Among Variables BUS 230: Business and Economic Research and Communication 1 Goals Specific goals: Re-familiarize ourselves with basic statistics ideas: sampling distributions, hypothesis
DESINGING DSP (0, 1) ACCEPTANCE SAMPLING PLANS BASED ON TRUNCATED LIFE TESTS UNDER VARIOUS DISTRIBUTIONS USING MINIMUM ANGLE METHOD
 ACCEPTANCE SAMPLING PLANS BASED ON TRUNCATED LIFE TESTS UNDER VARIOUS DISTRIBUTIONS USING MINIMUM ANGLE METHOD") DESINGING DSP (0, 1) ACCEPTANCE SAMPLING PLANS BASED ON TRUNCATED LIFE TESTS UNDER VARIOUS DISTRIBUTIONS USING MINIMUM ANGLE METHOD A. R. Sudamani Ramaswamy 1, R. Sutharani 2 1 Associate Professor, Department
DESINGING DSP (0, 1) ACCEPTANCE SAMPLING PLANS BASED ON TRUNCATED LIFE TESTS UNDER VARIOUS DISTRIBUTIONS USING MINIMUM ANGLE METHOD A. R. Sudamani Ramaswamy 1, R. Sutharani 2 1 Associate Professor, Department
Basic Business Statistics, 10/e
 Chapter 4 4- Basic Business Statistics th Edition Chapter 4 Introduction to Multiple Regression Basic Business Statistics, e 9 Prentice-Hall, Inc. Chap 4- Learning Objectives In this chapter, you learn:
104 Business Research Methods - MCQs
 104 Business Research Methods - MCQs 1) Process of obtaining a numerical description of the extent to which a person or object possesses some characteristics a) Measurement b) Scaling c) Questionnaire
Part III: Unstructured Data. Lecture timetable. Analysis of data. Data Retrieval: III.1 Unstructured data and data retrieval
 Inf1-DA 2010 20 III: 28 / 89 Part III Unstructured Data Data Retrieval: III.1 Unstructured data and data retrieval Statistical Analysis of Data: III.2 Data scales and summary statistics III.3 Hypothesis
How do we compare the relative performance among competing models?
 How do we compare the relative performance among competing models? 1 Comparing Data Mining Methods Frequent problem: we want to know which of the two learning techniques is better How to reliably say Model
Analysis of Variance. Read Chapter 14 and Sections to review one-way ANOVA.
 Analysis of Variance Read Chapter 14 and Sections 15.1-15.2 to review one-way ANOVA. Design of an experiment the process of planning an experiment to insure that an appropriate analysis is possible. Some
Lecture Slides for INTRODUCTION TO. Machine Learning. ETHEM ALPAYDIN The MIT Press,
 Lecture Slides for INTRODUCTION TO Machine Learning ETHEM ALPAYDIN The MIT Press, 2004 alpaydin@boun.edu.tr http://www.cmpe.boun.edu.tr/~ethem/i2ml CHAPTER 14: Assessing and Comparing Classification Algorithms
TECH 646 Analysis of Research in Industry and Technology
 TECH 646 Analysis of Research in Industry and Technology PART III The Sources and Collection of data: Measurement, Measurement Scales, Questionnaires & Instruments, Ch. 14 Lecture note based on the text
BOOK REVIEW Sampling: Design and Analysis. Sharon L. Lohr. 2nd Edition, International Publication,
 STATISTICS IN TRANSITION-new series, August 2011 223 STATISTICS IN TRANSITION-new series, August 2011 Vol. 12, No. 1, pp. 223 230 BOOK REVIEW Sampling: Design and Analysis. Sharon L. Lohr. 2nd Edition,
White Paper. Moisture Analyzer Routine Testing
 Moisture Analyzer Routine Testing This white paper describes the influences and sources of error which may be present when conducting moisture analyses. It discusses the routine tests which are necessary
Hypothesis Testing. Hypothesis: conjecture, proposition or statement based on published literature, data, or a theory that may or may not be true
 Hypothesis esting Hypothesis: conjecture, proposition or statement based on published literature, data, or a theory that may or may not be true Statistical Hypothesis: conjecture about a population parameter
IE 316 Exam 1 Fall 2012
 IE 316 Exam 1 Fall 2012 I have neither given nor received unauthorized assistance on this exam. Name Signed Date Name Printed 1 20 pts 1. Here are 10 True-False questions worth 2 points each. Write (very
EPAs New MDL Procedure What it Means, Why it Works, and How to Comply
 EPAs New MDL Procedure What it Means, Why it Works, and How to Comply Richard Burrows TestAmerica Inc. 1 A Revision to the Method Detection Limit EPA published a revision to the 40 CFR Part 136 MDL procedure
spc Statistical process control Key Quality characteristic :Forecast Error for demand
 spc Statistical process control Key Quality characteristic :Forecast Error for demand BENEFITS of SPC Monitors and provides feedback for keeping processes in control. Triggers when a problem occurs Differentiates
Report and Manage Post Marketing Changes to an Approved NDA, ANDA and BLA. Jane Weitzel Independent Consultant
 Report and Manage Post Marketing Changes to an Approved NDA, ANDA and BLA Jane Weitzel mljweitzel@msn.com Independent Consultant IVT S Analytical Procedures & Methods Validation December 2016 San Diego
Contents. Acknowledgments. xix
 Table of Preface Acknowledgments page xv xix 1 Introduction 1 The Role of the Computer in Data Analysis 1 Statistics: Descriptive and Inferential 2 Variables and Constants 3 The Measurement of Variables
Predictive Analytics on Accident Data Using Rule Based and Discriminative Classifiers
 Advances in Computational Sciences and Technology ISSN 0973-6107 Volume 10, Number 3 (2017) pp. 461-469 Research India Publications http://www.ripublication.com Predictive Analytics on Accident Data Using
2.830J / 6.780J / ESD.63J Control of Manufacturing Processes (SMA 6303) Spring 2008
 Spring 2008") MIT OpenCourseWare http://ocw.mit.edu 2.830J / 6.780J / ESD.63J Control of Manufacturing Processes (SMA 6303) Spring 2008 For information about citing these materials or our Terms of Use, visit: http://ocw.mit.edu/terms.
MIT OpenCourseWare http://ocw.mit.edu 2.830J / 6.780J / ESD.63J Control of Manufacturing Processes (SMA 6303) Spring 2008 For information about citing these materials or our Terms of Use, visit: http://ocw.mit.edu/terms.
CHAPTER 4 CRITICAL GROWTH SEASONS AND THE CRITICAL INFLOW PERIOD. The numbers of trawl and by bag seine samples collected by year over the study
 CHAPTER 4 CRITICAL GROWTH SEASONS AND THE CRITICAL INFLOW PERIOD The numbers of trawl and by bag seine samples collected by year over the study period are shown in table 4. Over the 18-year study period,
Regression Analysis. BUS 735: Business Decision Making and Research. Learn how to detect relationships between ordinal and categorical variables.
 Regression Analysis BUS 735: Business Decision Making and Research 1 Goals of this section Specific goals Learn how to detect relationships between ordinal and categorical variables. Learn how to estimate
Leverage Sparse Information in Predictive Modeling
 Leverage Sparse Information in Predictive Modeling Liang Xie Countrywide Home Loans, Countrywide Bank, FSB August 29, 2008 Abstract This paper examines an innovative method to leverage information from
Chapter 4. One-sided Process Capability Assessment in the Presence of Gauge Measurement Errors
 hapter One-sided Process apability Assessment in the Presence of Gauge Measurement Errors n the manufacturing industry, many product characteristics are of one-sided specifications The process capability
Lecture Slides. Elementary Statistics. by Mario F. Triola. and the Triola Statistics Series
 Lecture Slides Elementary Statistics Tenth Edition and the Triola Statistics Series by Mario F. Triola Slide 1 Chapter 13 Nonparametric Statistics 13-1 Overview 13-2 Sign Test 13-3 Wilcoxon Signed-Ranks
Learning Theory. Machine Learning CSE546 Carlos Guestrin University of Washington. November 25, Carlos Guestrin
 Learning Theory Machine Learning CSE546 Carlos Guestrin University of Washington November 25, 2013 Carlos Guestrin 2005-2013 1 What now n We have explored many ways of learning from data n But How good
INTRODUCTORY REGRESSION ANALYSIS
 ;»»>? INTRODUCTORY REGRESSION ANALYSIS With Computer Application for Business and Economics Allen Webster Routledge Taylor & Francis Croup NEW YORK AND LONDON TABLE OF CONTENT IN DETAIL INTRODUCTORY REGRESSION
Non-parametric methods
 Eastern Mediterranean University Faculty of Medicine Biostatistics course Non-parametric methods March 4&7, 2016 Instructor: Dr. Nimet İlke Akçay (ilke.cetin@emu.edu.tr) Learning Objectives 1. Distinguish
Learning Classification with Auxiliary Probabilistic Information Quang Nguyen Hamed Valizadegan Milos Hauskrecht
 Learning Classification with Auxiliary Probabilistic Information Quang Nguyen Hamed Valizadegan Milos Hauskrecht Computer Science Department University of Pittsburgh Outline Introduction Learning with
Lecture Slides. Section 13-1 Overview. Elementary Statistics Tenth Edition. Chapter 13 Nonparametric Statistics. by Mario F.
 Lecture Slides Elementary Statistics Tenth Edition and the Triola Statistics Series by Mario F. Triola Slide 1 Chapter 13 Nonparametric Statistics 13-1 Overview 13-2 Sign Test 13-3 Wilcoxon Signed-Ranks
Criteria of Determining the P/T Upper Limits of GR&R in MSA
 Quality & Quantity 8) 4:3 33 Springer 7 DOI.7/s3-6-933-7 Criteria of Determining the P/T Upper Limits of GR&R in MSA K. S. CHEN,C.H.WU and S. C. CHEN Institute of Production System Engineering & Management,
12 Discriminant Analysis
 12 Discriminant Analysis Discriminant analysis is used in situations where the clusters are known a priori. The aim of discriminant analysis is to classify an observation, or several observations, into
Statistical Quality Control In The Production Of Pepsi Drinks
 Statistical Quality Control In The Production Of Pepsi Drins Lasisi K. E and 2 Abdulazeez K. A Mathematical Sciences, Abubaar Tafawa Balewa University, P.M.B.0248, Bauchi, Nigeria 2 Federal College of
CHAPTER 6 A STUDY ON DISC BRAKE SQUEAL USING DESIGN OF EXPERIMENTS
 134 CHAPTER 6 A STUDY ON DISC BRAKE SQUEAL USING DESIGN OF EXPERIMENTS 6.1 INTRODUCTION In spite of the large amount of research work that has been carried out to solve the squeal problem during the last
Variables, distributions, and samples (cont.) Phil 12: Logic and Decision Making Fall 2010 UC San Diego 10/18/2010
 Phil 12: Logic and Decision Making Fall 2010 UC San Diego 10/18/2010") Variables, distributions, and samples (cont.) Phil 12: Logic and Decision Making Fall 2010 UC San Diego 10/18/2010 Review Recording observations - Must extract that which is to be analyzed: coding systems,
Variables, distributions, and samples (cont.) Phil 12: Logic and Decision Making Fall 2010 UC San Diego 10/18/2010 Review Recording observations - Must extract that which is to be analyzed: coding systems,
PAC Learning Introduction to Machine Learning. Matt Gormley Lecture 14 March 5, 2018
 10-601 Introduction to Machine Learning Machine Learning Department School of Computer Science Carnegie Mellon University PAC Learning Matt Gormley Lecture 14 March 5, 2018 1 ML Big Picture Learning Paradigms:
IPC-TM-650 TEST METHODS MANUAL
 ASSOCIATION CONNECTING ELECTRONICS INDUSTRIES 3000 Lakeside Drive, Suite 309S Bannockburn, IL 60015-1249 TEST METHODS MANUAL Number Thermal Stress, Convection Reflow Assembly Simulation Originating Task
Dan Roth 461C, 3401 Walnut
 CIS 519/419 Applied Machine Learning www.seas.upenn.edu/~cis519 Dan Roth danroth@seas.upenn.edu http://www.cis.upenn.edu/~danroth/ 461C, 3401 Walnut Slides were created by Dan Roth (for CIS519/419 at Penn
Methods and Criteria for Model Selection. CS57300 Data Mining Fall Instructor: Bruno Ribeiro
 Methods and Criteria for Model Selection CS57300 Data Mining Fall 2016 Instructor: Bruno Ribeiro Goal } Introduce classifier evaluation criteria } Introduce Bias x Variance duality } Model Assessment }
Algorithm Independent Topics Lecture 6
 Algorithm Independent Topics Lecture 6 Jason Corso SUNY at Buffalo Feb. 23 2009 J. Corso (SUNY at Buffalo) Algorithm Independent Topics Lecture 6 Feb. 23 2009 1 / 45 Introduction Now that we ve built an
Small n, σ known or unknown, underlying nongaussian
 READY GUIDE Summary Tables SUMMARY-1: Methods to compute some confidence intervals Parameter of Interest Conditions 95% CI Proportion (π) Large n, p 0 and p 1 Equation 12.11 Small n, any p Figure 12-4
Introduction to Business Statistics QM 220 Chapter 12
 Department of Quantitative Methods & Information Systems Introduction to Business Statistics QM 220 Chapter 12 Dr. Mohammad Zainal 12.1 The F distribution We already covered this topic in Ch. 10 QM-220,
Glossary for the Triola Statistics Series
 Glossary for the Triola Statistics Series Absolute deviation The measure of variation equal to the sum of the deviations of each value from the mean, divided by the number of values Acceptance sampling