Sampling. Jian Pei School of Computing Science Simon Fraser University
|
|
|
- Delphia Stevens
- 5 years ago
- Views:
Transcription
1 Sampling Jian Pei School of Computing Science Simon Fraser University
2 INTRODUCTION J. Pei: Sampling 2
3 What Is Sampling? Select some part of a population to observe estimate something about the whole population Many applications Important questions about sampling How best to obtain the sample and make observations? Once the sample data are in hand, how best to use them to estimate? J. Pei: Sampling 3
4 Important Factors Sample size Sample selection Observation methods Measurements recorded J. Pei: Sampling 4
5 Experimental Design In experiments one deliberately perturbs some part of a population in order to investigate what the effect of that action is Difference: in sampling, one often wants to observe what the population is like without perturbing or disturbing it J. Pei: Sampling 5
6 Observational Studies One has little or no control over how the observations on the population were obtained Difference: in sampling one has the opportunity to deliberately select the sample J. Pei: Sampling 6
7 A Broader Definition Sampling concerns all aspects of How data are selected, out of all the possibilities that might have been observed Whether the selection process has been under the control of investigations or has been determined by nature or happenstance How to use such data to make inferences about the larger population of interest J. Pei: Sampling 7
8 Basic Sampling Setup The population consists of a known, finite number N of units With each unit is associated a value of a variable of interest (aka the y-value of that unit) The y-value of each unit in the population is regarded as a fixed, if unknown quantity not a random variable The units of the population are identifiable and may be labeled with numbers 1, 2,, N Only a sample of the units are selected and observed J. Pei: Sampling 8
9 Notations The y-values in the population: The y-values in the sample: A precise notation lists the y-values in sample s as The sample mean is J. Pei: Sampling 9
10 Sampling Design The procedure by which the sample of units is selected Assign to each possible sample s the probability P(s) of being selected In practice, the sampling design may be described as a step-by-step procedure for selecting units J. Pei: Sampling 10
11 Example: Simple Random Sampling Sample size n P(s) = n / N Procedure description Select a random number as the first unit label from {1, 2,, N} Select the next unit label at random from the remaining numbers between 1 and N Continue until n distinct sample units are selected J. Pei: Sampling 11
12 Unit Inference The entire sequence of y- values in the population is considered a fixed characteristic or parameter of the population Task: estimate some summary characteristic of the population after observing only the sample Examples: mean, sum, Assess the accuracy or confidence associated with estimates J. Pei: Sampling 12
13 Uncertainty in Estimates If n = N, the population characteristic would be known exactly Uncertainty in estimates is caused by only part of the population is observed J. Pei: Sampling 13
14 Many Possible Samples Different estimates may be derived from different samples If for every possible sample the estimate is quite close to the true value, little uncertainty Otherwise, large uncertainty A major idea in sampling: the variability from sample to sample may be estimated using only one single sample selected J. Pei: Sampling 14
15 Unbiased Estimate The expected value of the estimate over all possible samples that might be selected with the design equals the actual population value A good sampling design should ensure an unbiased estimate without relying on any assumptions about the population Example: simple random sampling provides an unbiased estimate on mean and sum Question: can unequal probability designs obtain unbiased estimates? J. Pei: Sampling 15
16 Sampling Units Some times clear Examples: households, business, hospital patients Some times difficult to access Example: people through telephone directory Sometimes hard to define Example: survey of natural resource or agricultural crop J. Pei: Sampling 16
17 Possible Errors Sampling errors Assumption: the variable of interest is measured on every unit in the sample without error The sampling errors are those in the estimates only because just part of the population is included in the sample Non-sampling errors Nonresponse Errors in measuring or recording the variable of interest J. Pei: Sampling 17
18 Adaptive Sampling The procedure for selecting sites or units to make observations may depend on observed values of the variable of interest Good for surveys of rare, clustered populations To achieve gains in precisions or efficiency compared to conventional designs by taking advantage of observed characteristics of the population J. Pei: Sampling 18
19 Adaptive Sampling Procedure Whenever an observed value of the variable of interest satisfies a given criterion, units in the neighborhood of that unit are added to the sample For a sample s, P(s y) is specified, where y is the set of values of the variable of interest in the population In practice, y can be approximated using the set of values already observed J. Pei: Sampling 19
20 UNDERSTANDING BASIC IDEAS J. Pei: Sampling 20
21 You Have a Coin A coin has probability θ to be head (0 θ 1) θ is a latent variable Let n be the number of trials Let be an outcome of a n-trial sequence For each trail, x = 0 or x = 1 J. Pei: Sampling 21
22 Bernoulli Model Bernoulli model X ~ Ber(θ) When n = 10, there are 1024 possible outcomes A statistic is a function of possible outcomes Summary statistic Given n = 10, Y can have only 11 possible values! J. Pei: Sampling 22
23 Reverse Engineering Inference We observe x but do not know θ In a 10-trial experiment, if we see head 7 times, what can we say about θ? J. Pei: Sampling 23
24 Maximum Likelihood Estimator Find θ that maximizes the likelihood J. Pei: Sampling 24
25 The n-trial Normal Model Each trial follows the normal distribution Population mean μ and population variance σ 2 We write For a sequence of n-trials The possible outcomes follow a normal distribution J. Pei: Sampling 25

26 MLE for the Normal Model J. Pei: Sampling 26
27 (Unit) Fisher Information Define Equivalently, Keep θ fixed, take the expectation with respect to all possible outcomes x is the outcome space of X A measure for the amount of information that is expected within the prototypical trial X about the parameter of interest θ J. Pei: Sampling 27
28 Bernoulli Distribution Plug the Bernoulli distribution into unit Fisher information Replace the integral by a summation since X is discrete in Bernoulli distribution J. Pei: Sampling 28
29 Intuition J. Pei: Sampling 29
30 The Fisher Information Contains The sensitivity of the relationship f(x θ) with respect to the parameter θ expressed by the score function at the true value θ* How this sensitivity at θ* varies over (all possible) outcomes x that a model can generate according to f(x θ*) J. Pei: Sampling 30
31 From a Trial to a Sequence of Trials When there are n iid replications of the prototypical X, I n (θ) = ni(θ) Similarly, I Y (θ) = I n (θ) = ni(θ) J. Pei: Sampling 31
32 Observed (Unit) Fisher Information Replace the expectation by its empirical version Example: if we observed 7 heads out of 10 trials, we have If θ* = 0.7, then I Obs (θ*)=i(θ*) If θ*=0.15, I(0.15)=8, but I Obs (0.15)=31.5 J. Pei: Sampling 32
33 Fisher Information and MLE In practice, we do not know θ* To calculate the observed Fisher information, we replace θ* by the MLE J. Pei: Sampling 33
34 An Interesting Property Since f(x θ) is a density function, Take derivatives on both sides (Cramér-Rao lower bound) Suppose θ is an unknown deterministic parameter which is to be estimated from measurements x, distributed according to some probability density function f(x θ). The variance of any unbiased estimator of θ is then bounded by the reciprocal of the Fisher information J. Pei: Sampling 34
35 SIMPLE RANDOM SAMPLING J. Pei: Sampling 35
36 Simple Random Sampling Also known as random sampling without replacement Select n distinct units from the N units in the population such that every possible combination of n units is equally likely to be selected Procedure At each step, every unit of the population not already selected has the same chance of selection Make a sequence of independent selection from the whole population, each unit having the same probability, discarding repeat selections and continuing until n distinct units are selected J. Pei: Sampling 36
37 Estimating Mean Sample mean is an unbiased estimator of the population mean J. Pei: Sampling 37
38 Rationale Random variable depends on which sample is selected May be either higher or lower than The expected value of, taken over all possible samples, equals is design-unbiased for The probability with respect to which the expectation is evaluated arises from the probability, due to the design, of selecting different samples J. Pei: Sampling 38
39 Variance Sample variance is an unbiased estimator of the finite-population variance Question: why N-1 and n-1 in the above formulae? J. Pei: Sampling 39
40 Variance of The variance of the estimator An unbiased estimator The estimated standard error is in general NOT an unbiased estimator of the actual standard error J. Pei: Sampling 40
41 Rationale The variance estimates are design-unbiased for their population counterparts The actual variance of the estimator depends on the population through the population variance For a given population, a larger sample size n always produces a lower variance for the estimators and J. Pei: Sampling 41
42 Finite-population Correlation Factor (N n)/n = 1 (n/n) When the population is large relative to the sample size, the factor 1, and can be omitted A slight overestimate of the true variance When the sample size n N, the factor 0 Thus, the variance 0 J. Pei: Sampling 42
43 Estimating Sum Population total An unbiased estimator Variance An unbiased estimator J. Pei: Sampling 43
44 Example Suppose N=4 and n=2 A sample {(1, 10), (3, 13)} J. Pei: Sampling 44
45 Example (cont d) There are possible samples Each possible sample takes probability 1/6 to be selected Sample (1, 2) (10, 17) (1, 3) (10, 13) (1, 4) (10, 20) (2, 3) (17, 13) (2, 4) (17, 20) (3, 4) (13, 20) J. Pei: Sampling 45
46 Standard Deviation and Expectation E(s) = 4.01 The sample standard deviation is not unbiased for the population standard d deviation under simple random sampling J. Pei: Sampling 46
47 Variance of The sum, over all possible samples, of the value of times the probability of that sample J. Pei: Sampling 47
48 # Possible Samples The number of combinations of n distinct units from a population of size N is The simple random sampling design assigns to each possible sample s of n distinct units probability J. Pei: Sampling 48
49 Expectation of Sample Mean Expectation, The number of samples that include a unit i is J. Pei: Sampling 49
50 An Alternative Way Define an indicator such that it takes value 1 if unit i is included in the sample and 0 otherwise Then, Each of the is a Bernoulli random variable J. Pei: Sampling 50
51 Variance Since is a Bernoulli random variable, Please complete the rest J. Pei: Sampling 51
52 Random Sampling w. Replacement The n selections are independent Each unit has the same probability to be selected Each possible sequence of n units, distinguishing order of selection and possibly including repeat selections, has equal probability under the design May be convenient in some situations, but inherently less efficient than simple sampling without replacement J. Pei: Sampling 52
53 Estimating Mean The sample mean of the n observations is If a unit is selected multiple times, its y-value is utilized multiple times in the estimator Variance Higher than that of simple random sampling without replacement J. Pei: Sampling 53
54 Bessel's Correction Estimate the variance of a large population using a sample with replacement Sample variance J. Pei: Sampling 54
55 Biased Sample Estimate Considering all possible samples {y i } J. Pei: Sampling 55
56 Unbiased Sample Estimate To correct the bias, Also known as Bessel's Correction J. Pei: Sampling 56
57 Estimator of Variance J. Pei: Sampling 57
58 Effective Sample Size depends on the number of times each unit is selected Two samples containing the same set of distinct units but with different repeat selections in general may produce different estimates Effective sample size: the number of distinct units contained in the sample An unbiased estimator of the population mean The variance of is smaller than that of, but is still larger than that of simple random sampling without replacement J. Pei: Sampling 58
59 Model-based Sampling In the stochastic-population or model-based approach to sampling, the values of the variable of interest, denoted by are considered to be random variables The population model is given by the joint distribution Population values realized represent one outcome of many possible outcomes under the model of population J. Pei: Sampling 59
60 Estimate Population Mean Suppose the population variables are independent, identically distributed random variables from a distribution having a mean and a variance Suppose we have a sample s of n distinct units Sample mean is a random variable and is a model-unbiased estimator of the parameter J. Pei: Sampling 60
61 Assignments Show that in simple random sampling Learn how to conduct simulation in R Can you draw a sample from a population and calculate the mean and variance? Reading Maintaining variance in data streams J. Pei: Sampling 61
62 CONFIDENCE INTERVALS J. Pei: Sampling 62
63 Ideas Can we assess the accuracy of the estimate? Confidence interval Within which one is sufficiently sure that the true population value lies or, equivalently, by placing a bound on the probable error of the estimate A confidence interval procedure uses the data to determine an interval with the property that viewed before the sample is selected the interval has a given high probability of containing the true population value J. Pei: Sampling 63
64 Formulation I: a confidence interval for the population mean : the allowable probability of error A confidence interval procedure should have the property that I varies from sample to sample is unknown but fixed : confidence coefficient I is called the confidence interval J. Pei: Sampling 64
65 Normal Distribution Normal distribution Central limit theorem: for any sequence of independent and identically distributed random variables {X 1, X 2, }with expectation E[X i ] = μ and Var[X i ] = σ 2 <, The random variables converge in distribution to a normal N(0, σ 2 ), where J. Pei: Sampling 65
66 Student s t-distribution When estimating the mean of a normally distributed population where the sample size is small and the population standard deviation is unknown ν is the number of degrees of freedom and Γ is the gamma function. For natural number, Γ(n) = n! J. Pei: Sampling 66


67 Critical Values J. Pei: Sampling 67
68 Method Mean Approximate confidence intervals for the population mean and total can be constructed based on a normal approximation for the distribution of the sample mean under simple random sampling An approximate confidence interval for the population mean is t is the upper point of Student s t distribution with n 1 degrees of freedom J. Pei: Sampling 68
69 Method Sum An approximate confidence interval for the population sum is For sample size larger than 50, the upper point of the standard normal distribution may be used for the value of t J. Pei: Sampling 69
70 General Form If is a normally distributed, unbiased estimator for a population parameter, then a confidence interval for is z is the upper point of the normal distribution J. Pei: Sampling 70
71 Not Normally Distributed Data When the individual observations are not normally distributed, the approximate confidence levels of the usual confidence intervals depend on the approximate normal distribution of the sample mean By the central limit theorem, if are a sequence of iid random variables with finite mean and variance, then the distribution of approaches a standard normal distribution as n gets large When random sampling with replacement is used, the observations are iid J. Pei: Sampling 71
72 Sampling without Replacement : population mean : sample mean of a simple random sample By the finite-population it ti central limit it theorem, the distribution of approaches the standard normal distribution as both n and N n become large J. Pei: Sampling 72
73 SAMPLE SIZE J. Pei: Sampling 73
74 Sample Size Determination To estimate a population parameter with an estimator, let d be a maximum allowable difference and be the allowable probability of error more than d, choose a sample size n such that If is an unbiased, normally distributed estimator of, then has a standard normal distribution J. Pei: Sampling 74
75 Choosing n Let z be the upper point of the standard normal distribution decreases with increasing sample size n Choose n large enough to make J. Pei: Sampling 75
76 Population Mean Sample mean is an unbiased estimator with variance Setting, let When N is large relative to n, J. Pei: Sampling 76
77 Population Sum Setting where Use a sample variance to estimate the population variance J. Pei: Sampling 77
78 Relative Precision If we are interested in That is, Then, J. Pei: Sampling 78
79 ESTIMATING PROPORTIONS AND SUBPOPULATION MEANS J. Pei: Sampling 79
80 Population Proportion Estimation What is the proportion of voters favoring a party? What is the proportion of female customers purchasing this product? The variable of interest is an indicator variable if unit i has the attribute, 0 if not J. Pei: Sampling 80
81 A Baseline Solution The population sum is the number of units with the attribute The population mean is the proportion of units with the attribute A population proportion can be estimated using simple random sampling J. Pei: Sampling 81
82 Can We Do Better? With attribute data, the formulas simplify substantially Exact confidence intervals are possible A sample size sufficient i for a desired d absolute precision may be chosen without any information about population parameters J. Pei: Sampling 82
83 Estimating a Population Proportion Let p be the proportion in the population with the target attribute The finite-population variance is J. Pei: Sampling 83
84 Estimating a Population Proportion Denote by the proportion in the sample with the target attribute The sample variance is J. Pei: Sampling 84
85 Variance The sample proportion is the sample mean of a simple random sample unbiased for the population proportion Variance An unbiased estimator of the variance is J. Pei: Sampling 85
86 Confidence Interval An approximate confidence interval for p based on a normal distribution is t is the upper point of the t distribution with n-1 degrees of freedom The larger the sample size and the closer p is to 0.5, the better the approximation J. Pei: Sampling 86
87 Using Hypergeometric Distribution Based on the exact hypergeometric distribution of the number of units in the sample with the attribute, one may obtain confidence limits Let be the number of units with the attribute in the sample An equivalent situation An urn contains red balls and white balls A random sample of n balls without replacement J. Pei: Sampling 87
88 Using Hypergeometric Distribution Let X be the number of red balls in the sample Given red balls in the urn, the probability that the number of red balls in the sample is j is J. Pei: Sampling 88
89 Using Hypergeometric Distribution For a desired confidence limit for the number of units in the population with the attribute, an upper limit is determined as the number of red balls in the urn giving probability of obtaining or fewer red balls in the sample is approximately equal to half the desired That is, J. Pei: Sampling 89
90 Using Hypergeometric Distribution The lower limit is the number of red balls in the urn giving probability of obtaining or more red balls in the sample is approximately equal to half the desired J. Pei: Sampling 90
91 Confidence Limits Confidence limits for the population p are and If and are chosen in advanced, then should be chosen as the largest natural number such that should be chosen as the smallest natural number such that The coverage probability is at least J. Pei: Sampling 91
92 Sample Size To obtain an estimator having probability at least of being no more than d from the population proportion, the sample size based on the normal approximation is z is the upper point of the normal distribution J. Pei: Sampling 92
93 Simplifications When the finite-population correction can be ignored For computational purposesp The formulas depend on the unknown population proportion p If no estimate of p is available, use p=0.5 as the worst case J. Pei: Sampling 93
94 Example To estimate the proportion of fraud transactions in a company of billions of transactions everyday, how many sample transactions are needed to ensure an estimate within d = 0.05 of the true population with probability 0.95? The finite-population correction factor can be ignored since n << N n = J. Pei: Sampling 94
95 UNEQUAL PROBABILITY SAMPLING J. Pei: Sampling 95
96 Sampling with Unequal Probability Possible reasons Inherent feature of the sampling procedure Imposed deliberately to include more important units with higher probability Cost-driven sampling J. Pei: Sampling 96
97 Sampling with Replacement For i = 1, 2,, N, the i-th unit is drawn with probability p i An unbiased estimator of the population total is J. Pei: Sampling 97
98 Variance and Estimator The variance of the estimator is An unbiased estimator of this variance is J. Pei: Sampling 98
99 An Unbiased Estimator of Mean Variance Estimated variance is An approximate (1 α)100% confidence interval for the population total Known as the Hansen-Hurwitz estimator J. Pei: Sampling 99
100 A Special Case If the selection probabilities p i were proportional to the variables y i, the ratio y i / p i is constant The Hansen-Hurwitz Hurwitz estimator has zero variance The variance is low if the selection probabilities can be set approximately proportional to the y-values J. Pei: Sampling 100
101 Example Given yi pi Using the Hansen-Hurwitz estimator (aka the probability-proportional-to-size (PPS) estimator) J. Pei: Sampling 101
102 Calculating Variance Standard error is J. Pei: Sampling 102
103 Any Design With or without replacement, given probability π i that the i-th unit is included in the sample, for i = 1, 2,, N, an unbiased estimator of the population total (due to Horvitz and Thompson (1992)) v is the effective sample size (the number of distinct units in the sample) The summation is over the distinct units in the sample only J. Pei: Sampling 103
104 Variance Let π ij be the probability that both the i-th and the j-th units are included in the sample The variance of the estimator is An unbiased estimator of this variance is J. Pei: Sampling 104
105 Estimating Mean If all π ij > 0, then an unbiased estimator of the population mean is Variance is Estimated variance An approximate (1 α)100% confidence interval for the population total is J. Pei: Sampling 105
106 A Biased, Conservative Estimator The variance estimator is tedious to compute, and may be negative For the i-th of the v distinct units in the sample, define variable t i = vy i / π i Each t i is an estimate of the population total Their average is the Horvitz-Thompson estimate Sample variance of the t i is The alternative variance estimator is J. Pei: Sampling 106
107 A Generalized Estimator If the variables of interest and the inclusion probabilities are not well related, the Horvitz- Thompson estimator may have a large variance Still unbiased A Generalized estimator Numerator: estimator of total Denominator: estimator of population size N Not unbiased, but the bias tends to be small with increasing sample size J. Pei: Sampling 107
108 Variance and Mean Square Error Estimator of the variance J. Pei: Sampling 108
109 STRATIFIED SAMPLING J. Pei: Sampling 109
110 Stratified Sampling Ideas The population is partitioned into regions or strata A sample is selected within each stratum by some design Key: samples in different strata are selected independently The variance of an estimator for the whole population is the sum of the variances of the estimators for individual strata The Principle of stratification: partition the population so that the units within a stratum are as similar as possible Rationale: The variances within individual strata can be reduced J. Pei: Sampling 110
111 Stratification The population is stratified into L strata y hi : the variable of interest associated with the i-th unit of stratum h N h : the number of units in stratum t h n h : the number of units in the sample of stratum h Population size Total sample size J. Pei: Sampling 111
112 Population Sum and Mean Stratum population sum Total population sum Stratum population mean Overall population mean Stratified random sampling: simple random sampling within each stratum J. Pei: Sampling 112
113 General Estimation Within stratum h, select the sample s h of n h units An unbiased estimator of : the variance of An unbiased estimator of An unbiased estimator of the overall population total Variance An unbiased estimator of the variance J. Pei: Sampling 113
114 Stratified Random Sampling An unbiased estimator of : An unbiased estimator of the population total Variance:, is the finitepopulation variance from stratum h An unbiased estimator: is the sample variance in stratum h J. Pei: Sampling 114
115 Estimating Population Mean The stratified estimator: If the selections in different strata are independent, the variance of the estimator is An unbiased estimator J. Pei: Sampling 115
116 Mean Estimation in Stratified Random Sampling Stratified sample mean (an unbiased estimator) Variance of the estimator An unbiased estimator of the variance J. Pei: Sampling 116
117 Confidence Intervals When all the stratum sample sizes are sufficiently large (at least 30), an approximate 100(1 α)% confidence interval for the population total is where t is the α/2 point of the normal distribution For the mean, the confidence interval is J. Pei: Sampling 117
118 The Stratification Principle Since and, the smaller the σ 2, the more precise the estimators Principle: estimation of the population mean or sum will be most precise if the population is partitioned into strata so that within each stratum, the units are as similar as possible J. Pei: Sampling 118
119 Allocation How to allocate n sample units among the L strata? If each stratum is of the same size, and no prior information about the population, then equal sizes for the strata Proportional allocation: when the strata have different sizes, keep the sampling rate consistent among all strata J. Pei: Sampling 119
120 Optimum Allocation Under stratified random sampling With knowledge about stratum population standard deviation Minimize i i variance Optimum allocation In practice, the stratum population standard deviations may be estimated using sample standard deviation from past data J. Pei: Sampling 120
121 Cost Sensitive Stratified Sampling The cost of sampling in stratum h is c h Total cost Overhead cost c 0 Constrained on total cost c, the variance is minimized when setting the sample size in stratum h proportional to J. Pei: Sampling 121
122 Poststratification Sampling the population (e.g., simple random sampling) Each unit in the sample is assigned to a stratumaccordingtosomeattribute(eg according to some attribute (e.g., age group, location area) Use stratified estimate of some statistics The stratum sample sizes are random variables Expectation J. Pei: Sampling 122
123 Approximation in Poststratification The variance of the stratified estimator is The variance of the stratified estimator is To use poststratification, the relative size N h /N of each stratum is assumed May be estimated using sampling J. Pei: Sampling 123
124 Population Model Assume that the population Y-values are independent random variables, each having a normal distribution The value Y hi for the i-th unit in stratum h has a normal distribution with mean μ h and variance For a stratified sample s using any design within each stratum, the population total is a random variable J. Pei: Sampling 124
125 Predicting T Using Sample Desirable properties Unbiased predictor Minimizing mean square prediction error For a given sample, the best unbiased predictor is Standard stratified sampling estimator A model-unbiased estimator of the mean square prediction error is the standard stratified variance estimator Where is the sample variance within stratum h J. Pei: Sampling 125
126 CLUSTER AND SYSTEMATIC SAMPLING J. Pei: Sampling 126
127 General Framework The population is partitioned into primary units Each primary unit is composed of secondary units When a primary unit is included in the sample, the y-value of every secondary unit within it are observed J. Pei: Sampling 127

128 Systematic Sampling Every primary unit consists of secondary units spaced in some systematic manner throughout the population Example: every 3 rd and 8 th customer entering a store will be chosen as a sample unit J. Pei: Sampling 128


129 Cluster Sampling A primary unit consists of a cluster of secondary units, usually in close proximity to each other J. Pei: Sampling 129
130 Notations N: the number of primary units in the population n: the number of primary units in the sample M i : the number of secondary units in the i-th primary unit M: the total number of secondary units in the population y ij : the value of the variable of interest of the j-th secondary unit in the i-th primary unit y i : the total of the y-values in the i-th primary unit Population total Population mean per primary unit Population mean per secondary unit J. Pei: Sampling 130
131 Simple Random Sampling Primary Units selected by simple random sampling An unbiased estimator of the population total is the sample mean of the primary unit totals The variance of this estimator is where is the finite-population variance of the primary unit totals An unbiased estimator of the variance is where J. Pei: Sampling 131
132 Simple Random Sampling An unbiased estimator of the mean per primary unit The variance of the estimator is An unbiased estimator of the mean per secondary unit is The variance of the estimator is J. Pei: Sampling 132
133 Ratio Estimator If primary unit total y i is highly correlated with primary unit size M i, we can use ratio estimator based on size, which is more efficient The ratio estimator of the population total is, where the sample ratio The population ratio is the mean per secondary unit μ The ratio estimator is not unbiased, but the bias tends to be small with large sample sizes The mean square error may be considerably less than that of the unbiased estimator when y i and M i tend to be proportionally related J. Pei: Sampling 133
134 Approximate Formulae Mean of square error (variance of the ratio estimator) is An estimator is The adjusted estimator for the variance of a ratio estimator is J. Pei: Sampling 134
135 Selection with Unequal Probabilities The primary units may be selected with replacement with draw-by-draw selection probabilities proportional to the sizes of the primary units, that is, p i =M i /M J. Pei: Sampling 135
136 Hansen-Hurwits Estimator Probability-proportional-to-size, PPS Unbiased The variance of the estimator is where An unbiased estimator of the variance is where J. Pei: Sampling 136
137 The Basic Principle To obtain estimators of low variance or mean square error, the population should be partitioned into clusters such that one cluster is similar to another Rationale: all secondary units within a selected primary unit are observed the within primary-unit variance does not enter into the variances of the estimators The ideal primary unit contains the full diversity of the population and is representative J. Pei: Sampling 137
138 Effectiveness The effectiveness of cluster/systematic sampling depends on The variance resulting from using primary units of a given size and shape The cost of sampling such units The variance of selecting n primary units may be compared with a simple random sample of n secondary units The average size of clusters in the population is The expected number of secondary units in a simple random sample of n primary units is J. Pei: Sampling 138
139 Estimate Using Secondary Units For the unbiased estimate of the population total based on a simple random sample of secondary units, let is the finite-population variance for secondary units, and J. Pei: Sampling 139
140 Random Sampling Primary Units Let u be a type of the primary units, such as the size, shape, or arrangement of primary units Consider an unbiased estimator using a random sample of primary units of type u, the variance of the estimator is and J. Pei: Sampling 140
141 Relative Efficiency The relative efficiency of the cluster/systematic sample to the simple random sample of equivalent sample size is The cluster/systematic sampling is efficient if the variance between primary units is small relative to the overall variance σ 2 To estimate the relative efficiency, we cannot use sample variance s 2 as an estimate of σ 2, since the data were not obtained with simple random sampling J. Pei: Sampling 141
142 Estimating Relative Efficiency An unbiased estimate of σ 2 from the simple random cluster sample is is an unbiased estimator of the within-primary-unit variance is an unbiased estimator of the variance between primary unit means The estimated relative efficiency of cluster sampling (simple random sample of n clusters) based on the data from the cluster sample is J. Pei: Sampling 142
143 Assessing Using ρ Define the within-primary-unit correlation coefficient The variance with cluster sampling is ρ = 0: is approximately the same as the variance of a simple random sample of an equal number of secondary units ρ > 0: the simple random sample gives lower variance ρ < 0: the cluster sample gives lower variance J. Pei: Sampling 143
144 MULTISTAGE DESIGNS J. Pei: Sampling 144
145 Multistage Sampling Two-stage sampling Select a sample of primary units Select a sample of secondary units from each of the primary units selected Three-stage sampling: in turn a sample of tertiary units is selected from each selected secondary unit Higher-order multistage designs can be defined similarly J. Pei: Sampling 145
146 Notations N: the number of primary units in the population M i : the number of secondary units in the i-th primary unit y ij : the value of the variable of interest for the j-th secondary unit in the i-th primary unit The total of the y-values in the i-th primary unit is The mean per secondary unit in the i-th primary unit is Population total Population mean per primary unit Total number of secondary units in the population is Population mean per secondary unit J. Pei: Sampling 146
147 Simple Random Sampling A two-stage design with simple random sampling at each stage n primary units are selected at the first stage From the i-th selected primary unit, m i secondary units are selected (i = 1, 2,, n) An unbiased estimator of the total y-value for the i-th primary unit in the sample is where J. Pei: Sampling 147
148 Simple Random Sampling An unbiased estimator of the population total is The variance of the estimator is where is the population variance among primary unit totals For i = 1, 2,, N, is the population variance within the i-th primary unit The first item is the variance that would be obtained if every secondary unit in a selected primary unit were observed The second item is the variance caused by estimating the primary unit values from subsamples of secondary units J. Pei: Sampling 148
149 Estimating the Variance of An unbiased estimator can be obtained by replacing the population variances with sample variances where for i = 1, 2,, n, J. Pei: Sampling 149
150 Estimating Population Means An unbiased estimator of the population mean per primary unit is Variance An unbiased estimator for the mean per secondary unit is Variance J. Pei: Sampling 150
151 Ratio Estimator A ratio estimator of the population total based on the sizes of the primary units is where An approximate mean square error (or variance) for this estimator is where J. Pei: Sampling 151
152 Estimating Population Means Mean per primary unit Variance Mean per secondary unit Variance J. Pei: Sampling 152
153 Selection with PPS Primary units selected with probability proportional to size (PPS) Secondary units are still selected independently using simple random sampling without replacement An unbiased estimator of the population total is where is the sample mean within the i-th primary unit of the sample and The variance is An unbiased estimator is where J. Pei: Sampling 153
154 Any Design with Replacement Primary units are selected with replacement with known draw-by-draw selection probabilities P i Subsampling is conducted independently among different primary units An unbiased estimator of the population total is, where and An unbiased estimator of the variance of this estimator is J. Pei: Sampling 154
155 Why Two-stage Sampling? Easier or less expensive to observe many secondary units in a cluster instead of the same number of secondary units randomly distributed over the population Consider the case all primary units are of the same size J. Pei: Sampling 155
156 Minimum Variance Cost function C = c 0 + c 1 n + c 2 nm For a fixed cost budget C, the minimum value of variance is obtained with subsample size The variance between primary unit means The average within-primary-unit variance If, set The optimal sample size (# primary units) is J. Pei: Sampling 156
157 NETWORK SAMPLING AND LINK-TRACING DESIGNS J. Pei: Sampling 157
158 Motivation Estimate the prevalence of a (rare) disease Use a random sample of medical centers For each center in the sample, observe patients treated in the center Challenge: a patient t may be treated t in multiple l centers Network sampling or multiplicity sampling Sampling in a bi-partite graph: selection units and observational units The multiplicity of an observational unit is the number of selection units that it is connected to J. Pei: Sampling 158
159 Challenge Unequal selection/inclusion probabilities sample mean is not an unbiased estimator of the population mean Observational unit Selection unit Selection unit Selection unit Observational unit Observational unit Observational unit Observational unit Observational unit J. Pei: Sampling 159
160 Population Total Let y i be the value of the variable of interest for the i-th observational unit in a population Can be either an indicator variable or any other type of variable Let N be the number of observational units in the population Population total J. Pei: Sampling 160
161 Population Mean per Selection Unit Let M be the number of selection units in the population Let m i be the multiplicity of the i-th observational unit The population mean per selection unit Sampling design A simple random sample (without replacement) of n selection units is obtained Every observation unit linked to any selection unit is included in the sample J. Pei: Sampling 161
162 Multiplicity Estimator For the i-th observational unit, the draw-bydraw selection probability The probability that one of the m i selection units is selected The multiplicity estimator (unbiased) of the population total For each observational unit, divide the observed y- value by the associated selection probability Include repeating selections An observational unit may be included multiple times even though selection units are sampled without replacement expectation np i J. Pei: Sampling 162
163 Variance and Estimation Define where A j is the set of observational units linked to the j-th selection unit Then, is the sample mean of a simple random sample of size n Variance Where and An unbiased estimator Where J. Pei: Sampling 163
164 Estimating Population Mean Population mean per selection unit An unbiased estimator Variance An unbiased estimator of the variance J. Pei: Sampling 164
165 Horvitz-Thompson Estimator Ideas The probability that the i-th unit is included in the sample is the probability that one or more of the m i selection units to which it is linked is selected Call the set of all observation units having the same linkage configuration a network The population can be divided into K networks Let be the total of the y-values over all the observation units in the k-th network, and the common multiplicity J. Pei: Sampling 165
166 Inclusion Probability The inclusion probability for the k-th network is the inclusion probability for any of the observational units within the network J. Pei: Sampling 166
167 Horvitz-Thompson Estimator Let be the number of distinct networks of observational units included in the sample The Horvitz-Thompson estimator of the population total is An unbiased estimator Not depend on the number of times a unit is selected J. Pei: Sampling 167
168 Variance of the Estimator Let be the number of selection units that are linked to both networks k and l The probability that both networks k and l are included in the sample is Applying the variance formulas for the Horvitz-Thompson estimator J. Pei: Sampling 168
169 Unbiased Estimator of the Variance To estimate the population mean per selection unit, we have J. Pei: Sampling 169
170 ALGORITHMIC TOOLS J. Pei: Sampling 170
171 Reservoir Sampling How to maintain a sample of k units from a sequence of n units or a stream? Assume n >> k, or n is even unknown The sequence/stream cannot be held in main memory in whole Even if n is known, flipping a biased coin of probability k/n being head n times does not guarantee that we can get at least k sample units What is the probability that we get less than k sample units? J. Pei: Sampling 171
172 Idea Take the first k units in the sample We guarantee the sample has k units When a new unit is read, update the sample How can we update the sample to ensure every unit has the correct probability to be sampled? J. Pei: Sampling 172
173 Reading the (k+1)-th Unit When the (k+1)-th unit is read, each unit should have a probability k/(k+1) to be sampled Draw a random number i between 1 and k+1 If i is between 1 and k, replace the i-th unit with the new ((k+1)-th) unit Correctness The (k+1)-th unit has a probability of k/(k+1) to be included in the sample Units 1,, k each has a probability of k/(k+1) to be included in the sample J. Pei: Sampling 173
174 Generalization When the i-th unit (i > k) is read, each unit should have a proability k/i to be sampled Draw a random number j between 1 and i If j is between 1 and k, replace the j-th unit with the new (i-th) unit Correctness The i-th unit has a probability k/i to be included in the sample The probability that each of units 1,, k to be included in the sample is J. Pei: Sampling 174
175 Sticky Sampling Ideas Task: maintain a sample of units and the frequency counts One sample rate cannot handle a potentially infinite stream the sample is also a stream Adjust (decrease) sample rate progressively to handle more and more new data The first t units, take them The next 2t units, sample using rate 0.5 The next 4t items, sample using rate 0.25 How to keep counts from samples of different rates consistent? Adjust counts according to the sampling rate J. Pei: Sampling 175
176 Sticky Sampling Algorithm Maintain a set S of entries (x, f), where x is a unit and f is the estimated count Initially, S is empty, sampling rate r = 1 A unit has a probability bilit 1/r to be sampled/counted If a unit is in S, increment the frequency Otherwise, add a unit (x, 1) into S J. Pei: Sampling 176
177 Sticky Sampling Algorithm Adjust sampling rate to handle more data t = e -1 log(s -1 δ -1 ), δ is the probability of failure First 2t elements, r=1; next 2t elements, r=2, next 4t elements, r=4, Update estimated counts for adjusted sampling rates Diminishing f by a random variable in geometric distribution, After adjustment, f is as if counted with the adjusted sampling rate Frequent items: entries in S where f (s-e)n J. Pei: Sampling 177
178 Sticky Sampling Properties Compute frequent items with error bound e With probability at least 1- δ using at most 2/elog(s -1 δ -1 ) expected number of entries Space complexity is independent of n J. Pei: Sampling 178
179 Lossy Counting Ideas Divide the stream into buckets, maintain a global count of buckets seen so far For any item, if its count is less than the global count of buckets, then its count does not need to be maintained How to divide buckets so that the possible errors are bounded? How to guarantee the number of entries needed to be recorded is also bounded? J. Pei: Sampling 179
180 Lossy Counting Algorithms Divide a stream into buckets of width w= 1/e The current bucket id b= n/w Maintain a set D of entries (x, f, Δ), where Δ is the maximum possible error in f Whenever a new item x arrives, lookup D If x is in D, update f Otherwise, add (e, 1, b-1) into D After a bucket, remove entries where f+δ b At most e -1 log(en) entries in S Practically better than Sticky Sampling J. Pei: Sampling 180
181 SAMPLING MASSIVE NETWORKS Some materials are borrowed from M. Al Hasan, N. K. Ahmed, and J. Neville: Network Sampling: Methods and Applications J. Pei: Sampling 181


182 Massive Networks Everywhere J. Pei: Sampling 182
183 Network Characteristics G(V, E) is a graph, Sometimes labels are considered, that is, G(V, E, Σ, L) Average degree Average clustering co-efficient For a vertex u, the fraction of pairs (v, w) such that v and w are neighbors of u and (v, w) E Diameter: the longest shortest path between a pair of vertices Max k-core: the maximum k-value such that an induced subgraph exists in which every vertex there has a degree of at least k J. Pei: Sampling 183
184 Network Characteristics Degree distribution Hop-plot distribution For d > 0, the fraction of vertex pairs (u, v) such that u and v are within distance at most d Clustering coefficient distribution Distribution of betweenness centrality of vertices Distribution of closeness centrality of vertices Farness of u: the sum of distances from u to all other vertices Closeness centrality: the reciprocal of farness J. Pei: Sampling 184
185 Network Analysis: What? Node and edge properties Correlation between locate structures and features, link or label prediction, node activity prediction, Connectivity and behavior Centrality analysis, community detection, robustness of networks, Local vs. global phenomenon and structures Network motifs, network fingerprints, spamming, J. Pei: Sampling 185
186 Fingerprint Networks J. Pei: Sampling 186
187 Why Is Network Analysis Hard? Costly in time Centrality: O( V E ) Eigenvector computation O( V 3 ) In practice, it is not rare to have billions of nodes Parts of networks may be inaccessible or hidden Evolving networks J. Pei: Sampling 187
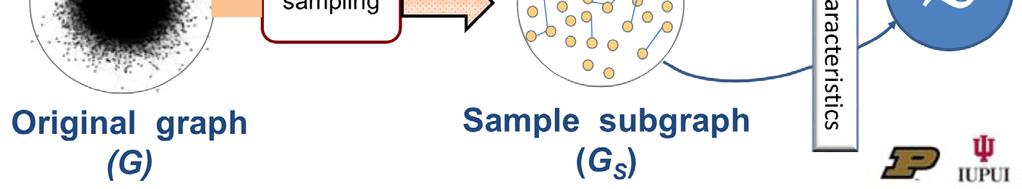
188 Why May Sampling Help? Estimate node and edge properties using samples Average degree, degree distribution, Analyze connectivity and behavior using sample subnetworks Analyze local phenomenon and structures using samples of local substructures J. Pei: Sampling 188
189 Estimate Node/Edge Properties J. Pei: Sampling 189

190 Analyze Connectivity/Behavior J. Pei: Sampling 190
191 Analyze Local Phenomenon/Structure J. Pei: Sampling 191
192 Sampling Social Networks Access Full access vs. restricted access Graph data organization Static ti graph Graph as a data stream Arbitrary edge order Incident edge order (edges incident to a vertex arrive together) Changes as a stream J. Pei: Sampling 192
193 Evaluation Analytical evaluation: unbiased estimator, variance Empirical evaluation Comparing two distributions Kolmogorov-Smirnov (KS) D-statistics: the maximum difference between two cdfs Particularly useful when two distributions have scale mismatch KL-divergence J. Pei: Sampling 193
194 Sampling for Node/Edge Properties Assuming full access to the network Sampling nodes Uniform node sampling random node selection Non-uniform node sampling random degree node sampling, random PageRank node sampling Sampling edges Uniform edge sampling random edge selection Non-uniform edge sampling random node-edge selection J. Pei: Sampling 194
195 Random Node Selection A node is selected uniformly and independently from the set of all nodes Unbiased estimation of many nodal attributes Average degree and degree distribution J. Pei: Sampling 195
196 Random Degree Node Selection The probability of selecting a node is proportional to its degree Proportional to size (PPS) sampling Choose an edge uniformly, and then choose one of its end-points with equal probability The Hansen-Hurwitz estimator can be used J. Pei: Sampling 196
197 Random PageRank Node Sampling The probability of selecting a node is proportional to the PageRank of the node PPS sampling The Hansen-Hurwitz Hurwitz estimator can be used Works better than random degree node selection Details in paper presentation (March 6) J. Pei: Sampling 197
198 Random Edge Selection Uniformly select edges The probability of selecting a vertex is proportional to its degree PPS sampling Vertices selected are not independent both endpoints of an edge in the sample are selected Estimation on edge statistics is unbiased Estimation on nodal statistics biased towards high-degree nodes J. Pei: Sampling 198
199 Random Node-Edge Selection Select a node uniformly, and then select an edge incident to the selected node uniformly The probability of selecting a node u is proportional to Biased estimation Details in paper presentation (March 6) J. Pei: Sampling 199
200 Sampling under Restricted Access Assumptions Connected networks A seed node or a set of seed nodes Neighborhood queries Methods: collect a sample by a series of access to nodes Graph traversal (exploration without replacement): BFS, DFS, Forest Fire, Snowball Sampling, Respondent Driven Sampling Random walk (exploration with replacement): classic random walk, Markov Chain Monte Carlo using Metropolis-Hastings algorithm, random walk with restart, random walk with random jump J. Pei: Sampling 200
201 BFS/DFS Sampling BFS from the seed node(s) Cover a certain radius form the seed node(s) Biased to high-degree nodes Higher degree nodes have a better probability bilit to be selected DFS sampling has the same effect J. Pei: Sampling 201
202 Forest Fire Sampling A randomized version of BFS sampling Every neighbor of the current node is visited with a probability p When p = 1, BFS sampling Similar performance to BFS sampling J. Pei: Sampling 202
203 Snowball Sampling At the current node, n neighbors are selected randomly Only nodes not in the sample will be added to the sample Performance similar to BFS sampling J. Pei: Sampling 203
204 Classic Random Walk Sampling At each iteration, one of the neighbors of the current node is selected The selected node and the neighbors are added to the sample Continue in a DFS manner High-degree nodes have a high probability to be selected A uniform sample of edges! J. Pei: Sampling 204
205 Uniform sampling by Exploration Traversal/walk based sampling methods are biased to high-degree nodes how to fix this bias? Challenges No prior knowledge about the sample space Only the current visiting nodes and neighbors are accessible Methods Random walk with the Metropolis-Hastings correction J. Pei: Sampling 205
206 Metropolis-Hastings Algorithm We want to generate a random variable V taking values {1, 2,, n} according to a target distribution {π i }, where Since n is large, is hard to compute Simulate a Markov chain such that the stationary distribution of the chain coincides with the target distribution Construct a Markov chain {X t t = 0, 1,, n} with proposal distribution Q = (q ij = 1 / deg(i)) J. Pei: Sampling 206
207 Metropolis-Hastings Algorithm For uniform distribution, q ij = 1 / d i and q j = 1 / d j Thus, If d j d i, the choice is accepted, otherwise, with probability d i / d j Every node is selected with a uniform probability 1 / V J. Pei: Sampling 207
208 Sampling from Edge Streams A graph can be accessed as a stream of edges A stream cannot be held in main memory completely Complexity factors Number of sequential passes Space required to store the intermediate states and the output Most methods use reservoir sampling J. Pei: Sampling 208
209 Streaming Uniform Edge Sampling Apply reservoir sampling on edge stream Each edge is selected with a uniform probability Min-wise sampling a uniform sampling method on edge stream A random hash value is drawn independently from the uniform (0, 1) distribution Maintain a sample as the n smallest hash values seen so far Every size-n subset of the stream has the same probability of having the smallest has values J. Pei: Sampling 209
210 Streaming Uniform Node Sampling Sampling nodes directly from the stream? The probability that a node is selected is proportional to the degree of the node not uniform Employ a uniform hash function on node id Use Min-wise sampling J. Pei: Sampling 210

211 Sampling Representative Subnetworks A subnetwork is representative if its structural properties are similar to the full network J. Pei: Sampling 211
POPULATION AND SAMPLE
 1 POPULATION AND SAMPLE Population. A population refers to any collection of specified group of human beings or of non-human entities such as objects, educational institutions, time units, geographical
Conservative variance estimation for sampling designs with zero pairwise inclusion probabilities
 Conservative variance estimation for sampling designs with zero pairwise inclusion probabilities Peter M. Aronow and Cyrus Samii Forthcoming at Survey Methodology Abstract We consider conservative variance
Sampling and Estimation in Network Graphs
 Sampling and Estimation in Network Graphs Gonzalo Mateos Dept. of ECE and Goergen Institute for Data Science University of Rochester gmateosb@ece.rochester.edu http://www.ece.rochester.edu/~gmateosb/ March
CHOOSING THE RIGHT SAMPLING TECHNIQUE FOR YOUR RESEARCH. Awanis Ku Ishak, PhD SBM
 CHOOSING THE RIGHT SAMPLING TECHNIQUE FOR YOUR RESEARCH Awanis Ku Ishak, PhD SBM Sampling The process of selecting a number of individuals for a study in such a way that the individuals represent the larger
Introduction to Survey Data Analysis
 Introduction to Survey Data Analysis JULY 2011 Afsaneh Yazdani Preface Learning from Data Four-step process by which we can learn from data: 1. Defining the Problem 2. Collecting the Data 3. Summarizing
Bayesian Methods for Machine Learning
 Bayesian Methods for Machine Learning CS 584: Big Data Analytics Material adapted from Radford Neal s tutorial (http://ftp.cs.utoronto.ca/pub/radford/bayes-tut.pdf), Zoubin Ghahramni (http://hunch.net/~coms-4771/zoubin_ghahramani_bayesian_learning.pdf),
Sampling from Finite Populations Jill M. Montaquila and Graham Kalton Westat 1600 Research Blvd., Rockville, MD 20850, U.S.A.
 Sampling from Finite Populations Jill M. Montaquila and Graham Kalton Westat 1600 Research Blvd., Rockville, MD 20850, U.S.A. Keywords: Survey sampling, finite populations, simple random sampling, systematic
CSE 417T: Introduction to Machine Learning. Final Review. Henry Chai 12/4/18
 CSE 417T: Introduction to Machine Learning Final Review Henry Chai 12/4/18 Overfitting Overfitting is fitting the training data more than is warranted Fitting noise rather than signal 2 Estimating! "#$
Statistical Inference: Estimation and Confidence Intervals Hypothesis Testing
 Statistical Inference: Estimation and Confidence Intervals Hypothesis Testing 1 In most statistics problems, we assume that the data have been generated from some unknown probability distribution. We desire
Business Statistics: A First Course
 Business Statistics: A First Course 5 th Edition Chapter 7 Sampling and Sampling Distributions Basic Business Statistics, 11e 2009 Prentice-Hall, Inc. Chap 7-1 Learning Objectives In this chapter, you
Computational statistics
 Computational statistics Markov Chain Monte Carlo methods Thierry Denœux March 2017 Thierry Denœux Computational statistics March 2017 1 / 71 Contents of this chapter When a target density f can be evaluated
Lecture 20 : Markov Chains
 CSCI 3560 Probability and Computing Instructor: Bogdan Chlebus Lecture 0 : Markov Chains We consider stochastic processes. A process represents a system that evolves through incremental changes called
Sampling: A Brief Review. Workshop on Respondent-driven Sampling Analyst Software
 Sampling: A Brief Review Workshop on Respondent-driven Sampling Analyst Software 201 1 Purpose To review some of the influences on estimates in design-based inference in classic survey sampling methods
STATS 200: Introduction to Statistical Inference. Lecture 29: Course review
 STATS 200: Introduction to Statistical Inference Lecture 29: Course review Course review We started in Lecture 1 with a fundamental assumption: Data is a realization of a random process. The goal throughout
Conditional Probability
 Conditional Probability Idea have performed a chance experiment but don t know the outcome (ω), but have some partial information (event A) about ω. Question: given this partial information what s the
Learning Objectives for Stat 225
 Learning Objectives for Stat 225 08/20/12 Introduction to Probability: Get some general ideas about probability, and learn how to use sample space to compute the probability of a specific event. Set Theory:
Examine characteristics of a sample and make inferences about the population
 Chapter 11 Introduction to Inferential Analysis Learning Objectives Understand inferential statistics Explain the difference between a population and a sample Explain the difference between parameter and
Lecturer: Dr. Adote Anum, Dept. of Psychology Contact Information:
 Lecturer: Dr. Adote Anum, Dept. of Psychology Contact Information: aanum@ug.edu.gh College of Education School of Continuing and Distance Education 2014/2015 2016/2017 Session Overview In this Session
Simulation. Where real stuff starts
 1 Simulation Where real stuff starts ToC 1. What is a simulation? 2. Accuracy of output 3. Random Number Generators 4. How to sample 5. Monte Carlo 6. Bootstrap 2 1. What is a simulation? 3 What is a simulation?
Quiz 1. Name: Instructions: Closed book, notes, and no electronic devices.
 Quiz 1. Name: Instructions: Closed book, notes, and no electronic devices. 1. What is the difference between a deterministic model and a probabilistic model? (Two or three sentences only). 2. What is the
3. When a researcher wants to identify particular types of cases for in-depth investigation; purpose less to generalize to larger population than to g
 Chapter 7: Qualitative and Quantitative Sampling Introduction Quantitative researchers more concerned with sampling; primary goal to get a representative sample (smaller set of cases a researcher selects
Discrete Distributions
 Discrete Distributions STA 281 Fall 2011 1 Introduction Previously we defined a random variable to be an experiment with numerical outcomes. Often different random variables are related in that they have
Chapter 3: Element sampling design: Part 1
 Chapter 3: Element sampling design: Part 1 Jae-Kwang Kim Fall, 2014 Simple random sampling 1 Simple random sampling 2 SRS with replacement 3 Systematic sampling Kim Ch. 3: Element sampling design: Part
SAMPLING- Method of Psychology. By- Mrs Neelam Rathee, Dept of Psychology. PGGCG-11, Chandigarh.
 By- Mrs Neelam Rathee, Dept of 2 Sampling is that part of statistical practice concerned with the selection of a subset of individual observations within a population of individuals intended to yield some
Test Code: STA/STB (Short Answer Type) 2013 Junior Research Fellowship for Research Course in Statistics
 2013 Junior Research Fellowship for Research Course in Statistics") Test Code: STA/STB (Short Answer Type) 2013 Junior Research Fellowship for Research Course in Statistics The candidates for the research course in Statistics will have to take two shortanswer type tests
Test Code: STA/STB (Short Answer Type) 2013 Junior Research Fellowship for Research Course in Statistics The candidates for the research course in Statistics will have to take two shortanswer type tests
BTRY 4090: Spring 2009 Theory of Statistics
 BTRY 4090: Spring 2009 Theory of Statistics Guozhang Wang September 25, 2010 1 Review of Probability We begin with a real example of using probability to solve computationally intensive (or infeasible)
CS 781 Lecture 9 March 10, 2011 Topics: Local Search and Optimization Metropolis Algorithm Greedy Optimization Hopfield Networks Max Cut Problem Nash
 CS 781 Lecture 9 March 10, 2011 Topics: Local Search and Optimization Metropolis Algorithm Greedy Optimization Hopfield Networks Max Cut Problem Nash Equilibrium Price of Stability Coping With NP-Hardness
STA 4273H: Statistical Machine Learning
 STA 4273H: Statistical Machine Learning Russ Salakhutdinov Department of Computer Science! Department of Statistical Sciences! rsalakhu@cs.toronto.edu! h0p://www.cs.utoronto.ca/~rsalakhu/ Lecture 7 Approximate
A graph contains a set of nodes (vertices) connected by links (edges or arcs)
 connected by links (edges or arcs)") BOLTZMANN MACHINES Generative Models Graphical Models A graph contains a set of nodes (vertices) connected by links (edges or arcs) In a probabilistic graphical model, each node represents a random variable,
BOLTZMANN MACHINES Generative Models Graphical Models A graph contains a set of nodes (vertices) connected by links (edges or arcs) In a probabilistic graphical model, each node represents a random variable,
Fall 2017 STAT 532 Homework Peter Hoff. 1. Let P be a probability measure on a collection of sets A.
 1. Let P be a probability measure on a collection of sets A. (a) For each n N, let H n be a set in A such that H n H n+1. Show that P (H n ) monotonically converges to P ( k=1 H k) as n. (b) For each n
Machine Learning using Bayesian Approaches
 Machine Learning using Bayesian Approaches Sargur N. Srihari University at Buffalo, State University of New York 1 Outline 1. Progress in ML and PR 2. Fully Bayesian Approach 1. Probability theory Bayes
SAMPLING BIOS 662. Michael G. Hudgens, Ph.D. mhudgens :55. BIOS Sampling
 SAMPLIG BIOS 662 Michael G. Hudgens, Ph.D. mhudgens@bios.unc.edu http://www.bios.unc.edu/ mhudgens 2008-11-14 15:55 BIOS 662 1 Sampling Outline Preliminaries Simple random sampling Population mean Population
Theory of Maximum Likelihood Estimation. Konstantin Kashin
 Gov 2001 Section 5: Theory of Maximum Likelihood Estimation Konstantin Kashin February 28, 2013 Outline Introduction Likelihood Examples of MLE Variance of MLE Asymptotic Properties What is Statistical
Bayesian Inference and MCMC
 Bayesian Inference and MCMC Aryan Arbabi Partly based on MCMC slides from CSC412 Fall 2018 1 / 18 Bayesian Inference - Motivation Consider we have a data set D = {x 1,..., x n }. E.g each x i can be the
Fractional Imputation in Survey Sampling: A Comparative Review
 Fractional Imputation in Survey Sampling: A Comparative Review Shu Yang Jae-Kwang Kim Iowa State University Joint Statistical Meetings, August 2015 Outline Introduction Fractional imputation Features Numerical
of being selected and varying such probability across strata under optimal allocation leads to increased accuracy.
 5 Sampling with Unequal Probabilities Simple random sampling and systematic sampling are schemes where every unit in the population has the same chance of being selected We will now consider unequal probability
Engineering Mathematics IV(15MAT41) Module-V : SAMPLING THEORY and STOCHASTIC PROCESS
 Module-V : SAMPLING THEORY and STOCHASTIC PROCESS") Engineering Mathematics IV(15MAT41) Module-V : SAMPLING THEORY and STOCHASTIC PROCESS By Dr. K.S.BASAVARAJAPPA Professor and Head, Department of Mathematics, Bapuji Institute of Engineering and Technology,
Engineering Mathematics IV(15MAT41) Module-V : SAMPLING THEORY and STOCHASTIC PROCESS By Dr. K.S.BASAVARAJAPPA Professor and Head, Department of Mathematics, Bapuji Institute of Engineering and Technology,
Stat 516, Homework 1
 Stat 516, Homework 1 Due date: October 7 1. Consider an urn with n distinct balls numbered 1,..., n. We sample balls from the urn with replacement. Let N be the number of draws until we encounter a ball
Lecture 2: Basic Concepts of Statistical Decision Theory
 EE378A Statistical Signal Processing Lecture 2-03/31/2016 Lecture 2: Basic Concepts of Statistical Decision Theory Lecturer: Jiantao Jiao, Tsachy Weissman Scribe: John Miller and Aran Nayebi In this lecture
Parameter estimation! and! forecasting! Cristiano Porciani! AIfA, Uni-Bonn!
 Parameter estimation! and! forecasting! Cristiano Porciani! AIfA, Uni-Bonn! Questions?! C. Porciani! Estimation & forecasting! 2! Cosmological parameters! A branch of modern cosmological research focuses
ECE-517: Reinforcement Learning in Artificial Intelligence. Lecture 4: Discrete-Time Markov Chains
 ECE-517: Reinforcement Learning in Artificial Intelligence Lecture 4: Discrete-Time Markov Chains September 1, 215 Dr. Itamar Arel College of Engineering Department of Electrical Engineering & Computer
Stochastic Models in Computer Science A Tutorial
 Stochastic Models in Computer Science A Tutorial Dr. Snehanshu Saha Department of Computer Science PESIT BSC, Bengaluru WCI 2015 - August 10 to August 13 1 Introduction 2 Random Variable 3 Introduction
Data Mining Techniques
 Data Mining Techniques CS 622 - Section 2 - Spring 27 Pre-final Review Jan-Willem van de Meent Feedback Feedback https://goo.gl/er7eo8 (also posted on Piazza) Also, please fill out your TRACE evaluations!
Figure Figure
 Figure 4-12. Equal probability of selection with simple random sampling of equal-sized clusters at first stage and simple random sampling of equal number at second stage. The next sampling approach, shown
Sanjay Chaudhuri Department of Statistics and Applied Probability, National University of Singapore
 AN EMPIRICAL LIKELIHOOD BASED ESTIMATOR FOR RESPONDENT DRIVEN SAMPLED DATA Sanjay Chaudhuri Department of Statistics and Applied Probability, National University of Singapore Mark Handcock, Department
Part I. Sampling design. Overview. INFOWO Lecture M6: Sampling design and Experiments. Outline. Sampling design Experiments.
 Overview INFOWO Lecture M6: Sampling design and Experiments Peter de Waal Sampling design Experiments Department of Information and Computing Sciences Faculty of Science, Universiteit Utrecht Lecture 4:
Day 8: Sampling. Daniel J. Mallinson. School of Public Affairs Penn State Harrisburg PADM-HADM 503
 Day 8: Sampling Daniel J. Mallinson School of Public Affairs Penn State Harrisburg mallinson@psu.edu PADM-HADM 503 Mallinson Day 8 October 12, 2017 1 / 46 Road map Why Sample? Sampling terminology Probability
Probability and Probability Distributions. Dr. Mohammed Alahmed
 Probability and Probability Distributions 1 Probability and Probability Distributions Usually we want to do more with data than just describing them! We might want to test certain specific inferences about
Review of Maximum Likelihood Estimators
 Libby MacKinnon CSE 527 notes Lecture 7, October 7, 2007 MLE and EM Review of Maximum Likelihood Estimators MLE is one of many approaches to parameter estimation. The likelihood of independent observations
Bias Variance Trade-off
 Bias Variance Trade-off The mean squared error of an estimator MSE(ˆθ) = E([ˆθ θ] 2 ) Can be re-expressed MSE(ˆθ) = Var(ˆθ) + (B(ˆθ) 2 ) MSE = VAR + BIAS 2 Proof MSE(ˆθ) = E((ˆθ θ) 2 ) = E(([ˆθ E(ˆθ)]
Maximum-Likelihood Estimation: Basic Ideas
 Sociology 740 John Fox Lecture Notes Maximum-Likelihood Estimation: Basic Ideas Copyright 2014 by John Fox Maximum-Likelihood Estimation: Basic Ideas 1 I The method of maximum likelihood provides estimators
Bayesian Networks: Construction, Inference, Learning and Causal Interpretation. Volker Tresp Summer 2016
 Bayesian Networks: Construction, Inference, Learning and Causal Interpretation Volker Tresp Summer 2016 1 Introduction So far we were mostly concerned with supervised learning: we predicted one or several
FCE 3900 EDUCATIONAL RESEARCH LECTURE 8 P O P U L A T I O N A N D S A M P L I N G T E C H N I Q U E
 FCE 3900 EDUCATIONAL RESEARCH LECTURE 8 P O P U L A T I O N A N D S A M P L I N G T E C H N I Q U E OBJECTIVE COURSE Understand the concept of population and sampling in the research. Identify the type
Interval estimation. October 3, Basic ideas CLT and CI CI for a population mean CI for a population proportion CI for a Normal mean
 Interval estimation October 3, 2018 STAT 151 Class 7 Slide 1 Pandemic data Treatment outcome, X, from n = 100 patients in a pandemic: 1 = recovered and 0 = not recovered 1 1 1 0 0 0 1 1 1 0 0 1 0 1 0 0
Now we will define some common sampling plans and discuss their strengths and limitations.
 Now we will define some common sampling plans and discuss their strengths and limitations. 1 For volunteer samples individuals are self selected. Participants decide to include themselves in the study.
Quantitative Introduction ro Risk and Uncertainty in Business Module 5: Hypothesis Testing
 Quantitative Introduction ro Risk and Uncertainty in Business Module 5: Hypothesis Testing M. Vidyasagar Cecil & Ida Green Chair The University of Texas at Dallas Email: M.Vidyasagar@utdallas.edu October
SYA 3300 Research Methods and Lab Summer A, 2000
 May 17, 2000 Sampling Why sample? Types of sampling methods Probability Non-probability Sampling distributions Purposes of Today s Class Define generalizability and its relation to different sampling strategies
Simulation. Where real stuff starts
 Simulation Where real stuff starts March 2019 1 ToC 1. What is a simulation? 2. Accuracy of output 3. Random Number Generators 4. How to sample 5. Monte Carlo 6. Bootstrap 2 1. What is a simulation? 3
BOOK REVIEW Sampling: Design and Analysis. Sharon L. Lohr. 2nd Edition, International Publication,
 STATISTICS IN TRANSITION-new series, August 2011 223 STATISTICS IN TRANSITION-new series, August 2011 Vol. 12, No. 1, pp. 223 230 BOOK REVIEW Sampling: Design and Analysis. Sharon L. Lohr. 2nd Edition,
Survey Sample Methods
 Survey Sample Methods p. 1/54 Survey Sample Methods Evaluators Toolbox Refreshment Abhik Roy & Kristin Hobson abhik.r.roy@wmich.edu & kristin.a.hobson@wmich.edu Western Michigan University AEA Evaluation
ANALYSIS OF SURVEY DATA USING SPSS
 11 ANALYSIS OF SURVEY DATA USING SPSS U.C. Sud Indian Agricultural Statistics Research Institute, New Delhi-110012 11.1 INTRODUCTION SPSS version 13.0 has many additional features over the version 12.0.
Math 494: Mathematical Statistics
 Math 494: Mathematical Statistics Instructor: Jimin Ding jmding@wustl.edu Department of Mathematics Washington University in St. Louis Class materials are available on course website (www.math.wustl.edu/
CS 343: Artificial Intelligence
 CS 343: Artificial Intelligence Bayes Nets: Sampling Prof. Scott Niekum The University of Texas at Austin [These slides based on those of Dan Klein and Pieter Abbeel for CS188 Intro to AI at UC Berkeley.
Statistics: Learning models from data
 DS-GA 1002 Lecture notes 5 October 19, 2015 Statistics: Learning models from data Learning models from data that are assumed to be generated probabilistically from a certain unknown distribution is a crucial
Evaluating Hypotheses
 Evaluating Hypotheses IEEE Expert, October 1996 1 Evaluating Hypotheses Sample error, true error Confidence intervals for observed hypothesis error Estimators Binomial distribution, Normal distribution,
Notes on Markov Networks
 Notes on Markov Networks Lili Mou moull12@sei.pku.edu.cn December, 2014 This note covers basic topics in Markov networks. We mainly talk about the formal definition, Gibbs sampling for inference, and maximum
Answers and expectations
 Answers and expectations For a function f(x) and distribution P(x), the expectation of f with respect to P is The expectation is the average of f, when x is drawn from the probability distribution P E
ECO 513 Fall 2009 C. Sims HIDDEN MARKOV CHAIN MODELS
 ECO 513 Fall 2009 C. Sims HIDDEN MARKOV CHAIN MODELS 1. THE CLASS OF MODELS y t {y s, s < t} p(y t θ t, {y s, s < t}) θ t = θ(s t ) P[S t = i S t 1 = j] = h ij. 2. WHAT S HANDY ABOUT IT Evaluating the
Bootstrap inference for the finite population total under complex sampling designs
 Bootstrap inference for the finite population total under complex sampling designs Zhonglei Wang (Joint work with Dr. Jae Kwang Kim) Center for Survey Statistics and Methodology Iowa State University Jan.
Discrete Distributions
 A simplest example of random experiment is a coin-tossing, formally called Bernoulli trial. It happens to be the case that many useful distributions are built upon this simplest form of experiment, whose
Monte Carlo Methods. Leon Gu CSD, CMU
 Monte Carlo Methods Leon Gu CSD, CMU Approximate Inference EM: y-observed variables; x-hidden variables; θ-parameters; E-step: q(x) = p(x y, θ t 1 ) M-step: θ t = arg max E q(x) [log p(y, x θ)] θ Monte
MATH4427 Notebook 2 Fall Semester 2017/2018
 MATH4427 Notebook 2 Fall Semester 2017/2018 prepared by Professor Jenny Baglivo c Copyright 2009-2018 by Jenny A. Baglivo. All Rights Reserved. 2 MATH4427 Notebook 2 3 2.1 Definitions and Examples...................................
Probability and Inference. POLI 205 Doing Research in Politics. Populations and Samples. Probability. Fall 2015
 Fall 2015 Population versus Sample Population: data for every possible relevant case Sample: a subset of cases that is drawn from an underlying population Inference Parameters and Statistics A parameter
4/26/2017. More algorithms for streams: Each element of data stream is a tuple Given a list of keys S Determine which tuples of stream are in S
 Note to other teachers and users of these slides: We would be delighted if you found this our material useful in giving your own lectures. Feel free to use these slides verbatim, or to modify them to fit
Interpret Standard Deviation. Outlier Rule. Describe the Distribution OR Compare the Distributions. Linear Transformations SOCS. Interpret a z score
 Interpret Standard Deviation Outlier Rule Linear Transformations Describe the Distribution OR Compare the Distributions SOCS Using Normalcdf and Invnorm (Calculator Tips) Interpret a z score What is an
A Tutorial on Learning with Bayesian Networks
 A utorial on Learning with Bayesian Networks David Heckerman Presented by: Krishna V Chengavalli April 21 2003 Outline Introduction Different Approaches Bayesian Networks Learning Probabilities and Structure
Weighting Missing Data Coding and Data Preparation Wrap-up Preview of Next Time. Data Management
 Data Management Department of Political Science and Government Aarhus University November 24, 2014 Data Management Weighting Handling missing data Categorizing missing data types Imputation Summary measures
COMP2610/COMP Information Theory
 COMP2610/COMP6261 - Information Theory Lecture 9: Probabilistic Inequalities Mark Reid and Aditya Menon Research School of Computer Science The Australian National University August 19th, 2014 Mark Reid
Topic 4 Randomized algorithms
 CSE 103: Probability and statistics Winter 010 Topic 4 Randomized algorithms 4.1 Finding percentiles 4.1.1 The mean as a summary statistic Suppose UCSD tracks this year s graduating class in computer science
An-Najah National University Faculty of Engineering Industrial Engineering Department. Course : Quantitative Methods (65211)
") An-Najah National University Faculty of Engineering Industrial Engineering Department Course : Quantitative Methods (65211) Instructor: Eng. Tamer Haddad 2 nd Semester 2009/2010 Chapter 3 Discrete Random
An-Najah National University Faculty of Engineering Industrial Engineering Department Course : Quantitative Methods (65211) Instructor: Eng. Tamer Haddad 2 nd Semester 2009/2010 Chapter 3 Discrete Random
Course: ESO-209 Home Work: 1 Instructor: Debasis Kundu
 Home Work: 1 1. Describe the sample space when a coin is tossed (a) once, (b) three times, (c) n times, (d) an infinite number of times. 2. A coin is tossed until for the first time the same result appear
Random Variables Example:
 Random Variables Example: We roll a fair die 6 times. Suppose we are interested in the number of 5 s in the 6 rolls. Let X = number of 5 s. Then X could be 0, 1, 2, 3, 4, 5, 6. X = 0 corresponds to the
144 IEEE/ACM TRANSACTIONS ON NETWORKING, VOL. 17, NO. 1, FEBRUARY A PDF f (x) is completely monotone if derivatives f of all orders exist
 is completely monotone if derivatives f of all orders exist") 144 IEEE/ACM TRANSACTIONS ON NETWORKING, VOL. 17, NO. 1, FEBRUARY 2009 Node Isolation Model and Age-Based Neighbor Selection in Unstructured P2P Networks Zhongmei Yao, Student Member, IEEE, Xiaoming Wang,
144 IEEE/ACM TRANSACTIONS ON NETWORKING, VOL. 17, NO. 1, FEBRUARY 2009 Node Isolation Model and Age-Based Neighbor Selection in Unstructured P2P Networks Zhongmei Yao, Student Member, IEEE, Xiaoming Wang,
Confidence Intervals for the Sample Mean
 Confidence Intervals for the Sample Mean As we saw before, parameter estimators are themselves random variables. If we are going to make decisions based on these uncertain estimators, we would benefit
Nonresponse weighting adjustment using estimated response probability
 Nonresponse weighting adjustment using estimated response probability Jae-kwang Kim Yonsei University, Seoul, Korea December 26, 2006 Introduction Nonresponse Unit nonresponse Item nonresponse Basic strategy
Module 16. Sampling and Sampling Distributions: Random Sampling, Non Random Sampling
 Module 16 Sampling and Sampling Distributions: Random Sampling, Non Random Sampling Principal Investigator Co-Principal Investigator Paper Coordinator Content Writer Prof. S P Bansal Vice Chancellor Maharaja
A comparison of weighted estimators for the population mean. Ye Yang Weighting in surveys group
 A comparison of weighted estimators for the population mean Ye Yang Weighting in surveys group Motivation Survey sample in which auxiliary variables are known for the population and an outcome variable
A General Overview of Parametric Estimation and Inference Techniques.
 A General Overview of Parametric Estimation and Inference Techniques. Moulinath Banerjee University of Michigan September 11, 2012 The object of statistical inference is to glean information about an underlying
Data Mining and Analysis: Fundamental Concepts and Algorithms
 Data Mining and Analysis: Fundamental Concepts and Algorithms dataminingbook.info Mohammed J. Zaki 1 Wagner Meira Jr. 2 1 Department of Computer Science Rensselaer Polytechnic Institute, Troy, NY, USA
Statistics Canada International Symposium Series - Proceedings Symposium 2004: Innovative Methods for Surveying Difficult-to-reach Populations
 Catalogue no. 11-522-XIE Statistics Canada International Symposium Series - Proceedings Symposium 2004: Innovative Methods for Surveying Difficult-to-reach Populations 2004 Proceedings of Statistics Canada
Discrete probability distributions
 Discrete probability s BSAD 30 Dave Novak Fall 08 Source: Anderson et al., 05 Quantitative Methods for Business th edition some slides are directly from J. Loucks 03 Cengage Learning Covered so far Chapter
L09. PARTICLE FILTERING. NA568 Mobile Robotics: Methods & Algorithms
 L09. PARTICLE FILTERING NA568 Mobile Robotics: Methods & Algorithms Particle Filters Different approach to state estimation Instead of parametric description of state (and uncertainty), use a set of state
Basics of Modern Missing Data Analysis
 Basics of Modern Missing Data Analysis Kyle M. Lang Center for Research Methods and Data Analysis University of Kansas March 8, 2013 Topics to be Covered An introduction to the missing data problem Missing
Model Assisted Survey Sampling
 Carl-Erik Sarndal Jan Wretman Bengt Swensson Model Assisted Survey Sampling Springer Preface v PARTI Principles of Estimation for Finite Populations and Important Sampling Designs CHAPTER 1 Survey Sampling
STAT 6385 Survey of Nonparametric Statistics. Order Statistics, EDF and Censoring
 STAT 6385 Survey of Nonparametric Statistics Order Statistics, EDF and Censoring Quantile Function A quantile (or a percentile) of a distribution is that value of X such that a specific percentage of the
A6523 Signal Modeling, Statistical Inference and Data Mining in Astrophysics Spring
 A6523 Signal Modeling, Statistical Inference and Data Mining in Astrophysics Spring 2015 http://www.astro.cornell.edu/~cordes/a6523 Lecture 23:! Nonlinear least squares!! Notes Modeling2015.pdf on course
MARKOV PROCESSES. Valerio Di Valerio
 MARKOV PROCESSES Valerio Di Valerio Stochastic Process Definition: a stochastic process is a collection of random variables {X(t)} indexed by time t T Each X(t) X is a random variable that satisfy some
TECH 646 Analysis of Research in Industry and Technology
 TECH 646 Analysis of Research in Industry and Technology PART III The Sources and Collection of data: Measurement, Measurement Scales, Questionnaires & Instruments, Ch. 14 Lecture note based on the text
Lecture 5: Sampling Methods
 Lecture 5: Sampling Methods What is sampling? Is the process of selecting part of a larger group of participants with the intent of generalizing the results from the smaller group, called the sample, to
A Bayesian Approach to Phylogenetics
 A Bayesian Approach to Phylogenetics Niklas Wahlberg Based largely on slides by Paul Lewis (www.eeb.uconn.edu) An Introduction to Bayesian Phylogenetics Bayesian inference in general Markov chain Monte