CALCIUM CARBONATE DEPOSITION IN GEOTHERMAL WELLBORES MIRAVALLES GEOTHERMAL FIELD COSTA RICA. A Report
|
|
|
- Brianne Wade
- 5 years ago
- Views:
Transcription
1 CALCIUM CARBONATE DEPOSITION IN GEOTHERMAL WELLBORES MIRAVALLES GEOTHERMAL FIELD COSTA RICA A Report Submitted to the Deparment of Petroleum Engineering of Stanford University in partial fulfillment of the requirements for the degree of MASTER OF SClENCE by Eduardo Granados June 1983

2 Stanford Geothermal Program Interdisciplinary Research in Engineering and Earth Sciences STANFORD UNIVERSITY Stanford, California SGP-TR-67 CALCIUM CARBONATE DEPOSITION IN GEOTHERMAL WELLBORES MIRAVALLES GEOTHERMAL FIELD COSTA RICA BY Eduardo Granados June 1983 Financial support was provided through the Stanford Geothermal Program under Department of Energy Contract No. DE-AT-3-8SF11459 and by the Department of Petroleum Engineering, Stanford University.
3 ABSTRACT Calcium carbonate deposition takes place in the wells of the Miravalles geothermal field in Costa Rica. Data from three long term flow test periods performed in well PGM-1 are analyzed through different methods, especially for the third and longest period which took place after mechanical scale removal had been performed. For this test a collection of chemical and thermodynamic data is used to investigate the evolution of the well production with time. Hotter fluids are suspected to enter the well at the end of the test, counting for higher enthalpy values and decrease in scale deposition rate. Remedial actions are suggested to reduce the scale deposition rate, or to remove the deposits formed, taken from the experience gained in different geothermal fields in the world, dealing with the same problem.
4 AKNOWLEDGEMENT The author wishes to thank all the persons and institutions that in some form made possible to complete this work. Appreciation is specially expressed to Dr. Jon S. Gudmundsson and Dr. Roland N. Horne for their guidance and support in preparing this report.
5 ~ ~~ TABLE OF CONTENTS ABSTRACT 1. INTRODUCTION THE MIRAVALLES GEOTHERMAL FIELD DRILLING AND COMPLETION PRODUCTION HISTORY Flow Test Period Flow Test Period Cleaning Operations Flow Test Period ANALYSIS OF PRODUCTION MEASUREMENTS WORLD EXPERIENCE OF CALCIUM CARBONATE CALCIUM CARBONATE CHEMISTRY CHEMICAL SAMPLING AND ANALYSIS Sampling and Analysis Methods Chemical Analysis DEPOSITION ANALYSIS Electric Power Research Institute Program National Energy Authority (Iceland) Program Rice University Method FLASHING POINT REMEDIAL ACTIONS Mechanical Removal Running Liner to Wellhead Well Location and/or Deepening CONCLUSIONS REFERENCES APPEND1 X
6 1. INTRODUCTION In countries like Costa Rica that have no fossil fuel resources geothermal energy exploration and development are most important. Geothermal resources in Costa Rica have been under exploration since Extensive studies carried out in the Guanacaste province have resulted in the discovery of a geothermal field in the slopes of the Miravalles volcano. In 1979, the first geothermal well drilled in Miravalles was put on discharge, setting an important mark in the history of energy development in Costa Rica. The Miravalles geothermal field is being explored and developed by the Instituto Costarricense de Electricidad (ICE), the national utility for electric power generation. Two more wells were drilled in the Miravalles area for exploratory purposesqwith the same success of the first one, and the plans were laid for the continuation of the explotation of the field. While testing the existing wells, a very important problem started to develop: calcium carbonate deposits would form at the level of the flashing point in the two most promising wells, thus decreasing their production and jeopardizing the future of the project itself. scaling of calcium carbonate is a widely known problem in
7 -2- hot water reservoirs, specially those with temperatures in the range of 2 to 24 'C. In many instances, a water geothermal reservoir will change and evolve with time under continuous production conditions, and sometimes these changes can be significant in amount and importance and may be detected at the surface. The changes that occur could vary the conditions governing the scaling processes either by decreasing or worsening the problem. In this paper, a study of such evolution is made by the treatment of the output behavior of the first and best producing well in the Miravalles geothermal area. Both physical and chemical data available are presented here to show whatever possible trends may be occuring under continuous production of the well. It is not the scope of this work to present a "magical" solution to the calcite scaling problem, but rather to try to understand the mechanisms that control it. The aim is to elaborate a simple reservoir model of the field that may provide the solution of the problem in the near future,
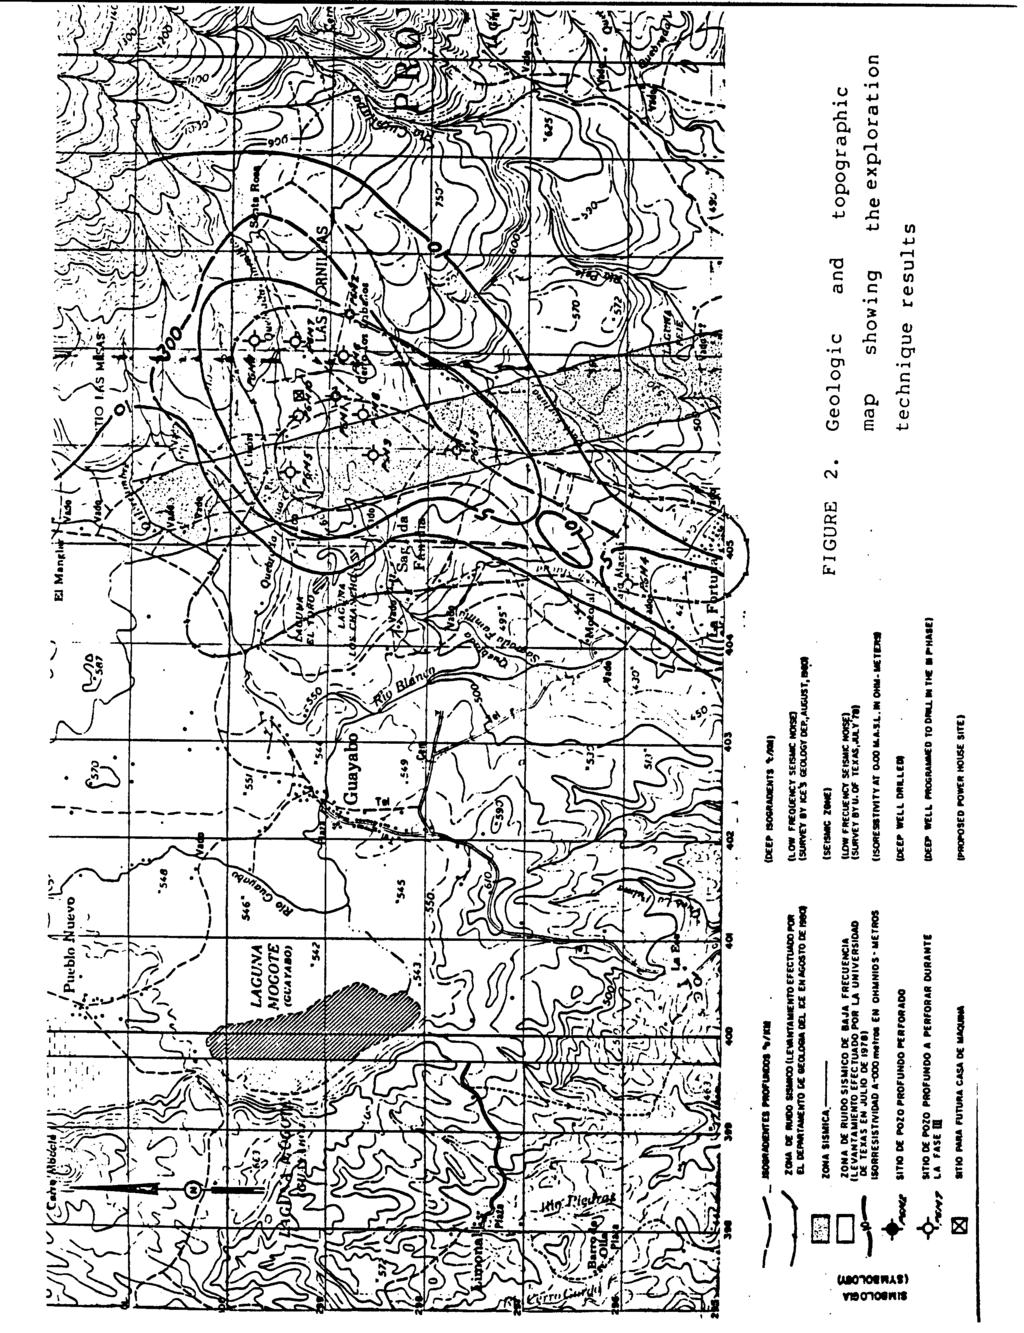
8 -3-2. THE MIRAVALLES GEOTHERMAL FIELD The Miravalles geothermal area is characterized by strong fumarolic activity, hot springs and rock hydrothermal alteration. The area is located in the south-western slope of the Miravalles volcano which is a part of a chain of quaternary volcanoes known as the Cordillera de Guanacaste. The Cordillera trends north-west to south-east and is flanked in the south-western part by a disected plateau composed of tertiary volcanic and sedimentary rocks overlaid by quaternary tuffs and sediments. The geographic location of the Miravalles field is shown in Figs. 1 and 2. On the edge of the Miravalles volcano, there is a geologic feature known as the Guayabo Caldera, which has apparently been the site of lakes in the past. Its fertile soil is dedicated to agricultural activity. In part, the caldera has been buried by volcanic materials. The first investigations on the potential of the Miravalles geothermal field for electric power uses were carried out almost 2 years ago. In 1974, the Instituto Costarricense de Electricidad (ICE) carried out an extensive investigation of the geothermal area, which included the following : -Surface geological reconnaissance
9 -4- -Chemistry of waters and gases from hot springs and fumaroles -Geothermal gradient measurements -Regional gravity surveys -Electrical resistivity surveys -Regional geohydrology -Microearthquake detection and ground noise measurements At the end of these studies, a report was published (ICE, 1976) with recommendations to extend the exploration and to drill three deep exploratory wells. The wells were located one to three km away from the area of fumarolic activity and in the center of an area characterized by high geothermal gradients at the surface (2 to 5 'C/km) and low resistivity values (5-1R-m) at depths of 5 to 8 m. Fig. 2 shows the area of investigation and some of the results. The results obtained from the different exploration techniques agreed on the existence of an anomalous zone of about 4 sq. km in area. In addition to the high geothermal gradients and low resistivity values, the geothermometry from hot springs and fumaroles showed values of the order of 24OoC. Gravity surveys showed the existence of a graben
10 -5- structure that may contain the geothermal reservoir; and the microearthquake studies, although still incomplete, showed active fault movement in the area.
11 -6-3. DRILLING AND COMPLETION The drilling of the first geothermal well in Costa Rica was carried out with an IDECO-H525-D rig, with a depth capacity of 1,5 m when using 3 1/2 inch drill pipe. The drilling started on April 1st. 1979, and was completed on July 28th The well design and the lithology encountered are shown in Fig.3. It shows the various casing and hole diameters and the depth at which the transition between the 7 5/8" slotted liner and the 9 5/8" production casing occurs, which corresponds to the point where the calcite problem was found to be most serious. The drilling program is shown as Fig.4. A good percentage of the 4 month period was used for either logging the well or running production tests. Since this was the first well to be drilled, it was thought desirable to obtain the greatest amount of information at all the stages. For this reason, whenever an important loss of circulation was found, the drilling was immediately stopped. A lighter drilling mud was circulated, and a recovery temperature survey run. When the temperature recovery was fast a further investigation was carried out by stimulating the well into production and measuring the output. This technique, even though slow and expensive, permitted the location of two important production zones at 34 and 925 m. The first zone
12 - 7- was cased off due to its limited potential and shallow depth, while the second zone is believed to be the major feed zone of the well (ICE, 198). On August 28th. 1979, the well was flow tested for the first time and its total production est imater d to be 79 kg/s using the lip pressure method. The well was kept on discharge for 3 days. The temperature recovery of the well from. surveys carried out before and after the first flow test is shown in Fig.5. In this figure the curve for September 7th. 1979, shows a temperature reversal at a depth of about 9 m even though the measurement was carried out after the first 3 three day flow test.
13 4. PRODUCT1 ON HI STORY After the first production test in August 1979, well PGM-1 was tested several times for short periods of 2-3 days for output measurements and sample collection. The output was measured by the lip pressure method (James, 1975). Three long term flow tests were carried out on PGK-1. Table 1 shows the dates, the production (output) and the wellhead pressure at the beginning and end of each of the periods. The ratio of (total production)/(wellhead pressure) is shown in Fi.6 for the three test periods. It can be seen that this ratio was almost constant regardless of the scaling problem in the wellbore. The wellhead and total flowrate are shown in detail for each of the test periods as a function of time on Figs.7, 8 and 9. The equipment used for flow measurements in tests periods 2 and 3 is shown in Fig.1. During test period 3 the well production output was monitored continuously by recording the wellhead and lip pressures, as well as the water flow rate that separated in the silencer. A diagram of the equipment used for continuous recording is shown in Fig.11.
14 Flow test period 1 The first two test periods were carried out without any flow restriction in the wellhead. During the first of these, the calcite deposition problem was discovered. ~ig.7 shows the rapid decline of both the pressure and the flowrate for this test. At the end of flow test period 1, some calcite deposits were discovered on the surface of a temperature instrument that had been lowered in the well. It had not been possible to lower the instrument deeper than 9 m due to a restriction in the wellbore. Also, particles found on the floor of the muffler structure were analized in the laboratory. Table 2, shows that the particles were 89% calcium carbonate (ICE, 1981). On May 1st. 1981, well PGM-1 was killed by gradually increasing the flow of cold water, on Kay 21st, a caliper log was run in the well (Gearhart-Oven continuous recording three arm caliper tool). The results of the caliper are shown in Fig.12. A reduction in diameter was located at a depth of about 87 m from the original diameter of 177 mm of the slotted liner, to 88.9 mm. The diameter had therefore been reduced a maximum 5% and the cross sectional area by almost 75%. The maximun reduction occur some 2 m below the liner hanger depth of 845 m and some 11 m above the point where the slotted liner starts. In well PGM-1 there are four joints of blind liner of 7 7/8" connecting the liner hanger to the slotted pipe. A similar situation was detected in well PGM-3 which however had been producing for a shorter
15 period of time. 4.2 Flow test period 2 After the caliper logging period, the well was allowed to warm up and a new period of flow testing began in June This test was carried out to follow the production and pressure decline for a longer period of time. As in test period 1 the well was discharged without a pressure restriction at the wellhead. The total flow rate and wellhead pessure of well PGM-1 in the flow test period 2 is shown in Figs. 8 and 8A. It can be observed that the production decreased from 67 kg/s in about a thousand hours and suddenly increased to a value of 48 kg/s after a maximum discharge pressure measurement had taken placerwhere it leveled until the end of the test. The production values were obtained by the lip pressure method. 4.3 Cleaning operation On November 6th. 1981, well PGM-lwas shut in and killed again with cold water from the top. It was not possible to run another caliper log because the calcite obstruction had increased to a point where it would be dangerous to loose the tool in the well.. The cleaning procesg, took a longer time (approximately
16 days) than expected because it had to be done with a cable tool rig (the only machinery that was available locally). The cleaning operation stopped at 898 m depth, well below where maximun calcite deposits had been detected. A caliper log revealed that the well had been thoughroughly cleaned. 4.4 Flow test period 3 The third test was started on March 3rd. 1982, and lasted 6 months, during this time the production was monitored continuously. And every two or three weeks a direct measurement of the well production was carried out with a 6" (diameter) WKM flash separator after which the separated brine and steam flowrates were measured through orifice plates. The advantage of this method is the possibility of comparing the results with the lip pressure method. Usually the output curves measured by the two methods agreed within a range of 1%. Flow test period 3 is the basis of the data interpreted in this report. The third test period is important because the well had been cleaned of the deposits that built up in the first and second tests. The well was therefore in a "like-new" condition at the beginning of the test. The measurements in flow test period 3 proved to be very useful in following the evolution of the well
17 -12- characteristics regarding production and chemical changes with time. After about 2 hours from the beginning of the test an orifice plate was inserted at the wellhead to restrict the flowrate. The plate was sized to maintain the pressure near the maximum discharge pressure of the well at the beginning of the third test period. During the direct flow measurements (every 2-3 weeks) and chemical sampling the procedure was to start the measurements at a pressure equal to or near the long term (restricted) wellhead pressure. Then to gradually lower the pressure and increase the flowrate. At every point the production performance and chemical samples of the brine, steam condensate and non-condensable gases were obtained. All the measurements performed during this test period, had been tabulated and plotted, and they are shown in Tables 3 through 11, and 15 through 23 and on Figs. 9, 14, and 15 through 43.
18 ANALYSIS OF PRODUCTION MEASUREMENTS The decline in wellhead pressure and flowrate in the three test periods art shown in Figs.7 to 9. The flowrate in test periods 2 and 3 is also plotted against cummulative production in Figs. 13 and 14. There is one aspect of these output curves that the three test periods have in common; the ratio of (total production/wellhead pressure) is constant in each flow test period as shown in Fig.6. The significance of this observation is not clear, but it may result from a constant flashing level in the wellbore. In flow test periods 1 and 2 the flowrate decreased rapidly initially, exhibiting a concave downward behavior as shown on Figs.7 and 8. This behavior may be characteristic for wells that suffer calcite deposition in the wellbore. In flow test 2, a sudden increase of the well flow rate occurred after about 2 hours and 3, tonnes of cummulative production as shown in Figs.8 and 13. This may have been caused by a maximum discharge pressure test that was carried out at that time. On the next day the records showed a higher wellhead pressure and flow rate. In flow test 3, since the flow was restricted at the wellhead, it was expected that the well would deposit less because of the high pressure and low flow rates. Fig.14 shows that this was true. However, a very slight decline was
19 visible either to a slow rate of deposition or that the cross sectional area had not been reduced to the critical point when rapid decline occurs. As it will be shown later, the precipitation of calcite tends to decrease when the well is operated at higher pressures. From the several deliverability tests (flowrate and enthalpy against wellhead pressure) performed during the six months of test period 3, it is clear that the productivity of the well kept decreasing all the time. In Tables 3 through 11 and Figs.15 through 24 the different deliverability tests carried out are shown. In Fig.24 four of these tests are plotted together and compared to a test of October 198 when the well was clean. The test of April 25th shows some scale buildup. At two months (57 days) after the cleaned well was restarted. Fig.25 shows the flowrate decrease with time at a separation pressure of 7.5 kg/cm2 (abs) probably caused by the scaling process. For each specific test the enthalpy was calculated for downhole conditions. These are shown in Table 12 and plotted with the deliverability curves in Figs.26 through 34. This is the enthalpy of the two phase mixture at the surface. The enthalpy has, shows a shift either to higher or lower values in some of the tests. This is especially true for high pressure points. This anomaly can perhaps be explained by looking at the test procedure that was followed. The first point of the test is usually the one nearest the
20 -15- pressure that the well was at that specific day. Then the flow was changed to get the next point and so on until the lowest point was reached. The time between points is nearly an hour while the well stabilizes its flow at a given pressure. It is true that any change made at the surface is also a change in the heat flow regime to or from the well and the formation. It is unlikely that one hour will stabilize the heat loss (or gain) to a point that stable values of enthalpy can be obtained. This holds particularly true for low flow rates and high wellhead pressures. Therefore, the values obtained for enthalpy can be approximated for qualitative purposes, rather than for quantitative ones. However, some points tend to deviate more from the mean values than others, usually the last point. For this reason it would be acceptable to think that if all the tests are performed in a similar way, using the same instrumentation and personnel, such deviation should be the same for every measurement. Fig.35 shows the mean enthalpy values versus time and the standard deviation for each point without dropping any offset value. Fig.36 shows the same points and the correspondent standard deviation adjusted by dropping the most offset value (when necessary). In this plot it can be observed that the deviation is almost constant to every point. It is also important to see from this plot that the least square fit through all the points shows a tendency of the enthalpy to increase with time. The same behavior was
21 -16- observed by James (19811, McNitt, (19811, and by McNitt et al. (1983). Another possibility could be a tendency to flash in the formation rater than in the wellbore, therefore a constantly increasing steam fraction would be produced with the correspondent increase in the enthalpy value. This theory would suggest the possibility of a two phase zone (water and steam) that develops with the long term tapping of the reservoir fluids. A possible explanation for this phenomena is the entrance of hotter fluids coming from a deeper and hotter source thus increasing the enthalpy value. This idea seems realistic since the enthalpy increment rate is small but constant.
22 WORLD EXPERIENCE OF CALCIUM CARBONATE DEPOSITION Calcium carbonate deposition in geothermal wells has been studied in countries where the problem has appeared, either in the early stages of the field's life or where it has been a persistent problem throughout the production history of the field. Different techniques have been developed in order to cope with the problem (New Zealand, Iceland, Turkey and Mexico) and perhaps the experience accumulated in those countries is the most valuable source of ideas and solutions one can look at when dealing with the problem. In looking to these experiences, it is worthwhile not only to consider for calcite deposition, but also silicate deposition, since both problems may be present at the same time and may have a similar approach for remedial actions. In Table 13 such problems have been divided into three categories: -Major calcium carbonate deposits -Minor calcium carbonate deposits -Complex deposits The following quote is from the same reference and it is reproduced here to give an idea about the magnitude of the problem:
23 -18- "Several physical and chemical processes occur as high temperature water is brought to the surface through wells and by pipeline into surface equipment. A steam phase forms in increasing proportion as pressures decrease along the pipeline and it contains a large proportion of the gases originally present in the deep water. The cooled water is depleted in acidic gases, while non-volatile constituents undergo concentration. Mineral deposition may be initiated by these changes. A small change in the concentration of a constituent can represent a sizable deposition rate in a geothermal well of high output. For example, a loss of 1 ppm of calcite or silica from solution in a 2 cm diameter well producing 1 tons of water per hour would give a deposit about 2 mm thick per day over a 1-m length of pipe. Deposition rates can be much greater than this. For example, a well in the Tongonan, Leite, Philippines, area developed aragonite scale at the rate of 1 mm/h (R..B. Glover, personnal communication). Complete blockages of wells have occured in a matter of days in severe scaling situations"
24 -19- The experience in New Zealand, in the field of Kawerau shows that the most satisfactory method for calcite removal is by mechanical reaming. A Failing rig is used to do this work and in some cases, full productivity of the well is regained after the operation has been carried out, as was the case of PGM-1. This infers that the largest bulk of calcite formed during production occurs in the well casing. The frequency of reaming is dependent on the nature of the system, but in the case of Kawerau, it has been found necessary to clean most wells anually. Acidification was also tried once in a well in Kawerau with severe damage caused to the casing by the action of the acid. This results from the lack of a sufficiently stable inhibitor, capable of maintaining its properties at high temperatures for a period of time long enough to allow the complete removal of calcite (Mahon, 1981). In Iceland, in the Svartsengi field, a more sophisticated rig has been tested to clean the wells from its calcium carbonate deposits while the well is flowing and discharging the drill-cuttings. In this case, a WABCO 2 rig was used with a Grant rotating head, blow out prevention equipment and a specially designed apparatus that cools the head's rubber stripper. The first test of the rig proved that the proposed work procedure and equipment worked (Arneberg, 1981). Other simpler methods have also been used with success in Svartsengi and other fields in Iceland.
25 -2- In Mexico, the removal of silicate deposits from the wells at the Cerro Prieto field, is often done by mechanical reaming. In the state of Nevada, in a well in the Desert Peak geothermal area, a very innovative method of injecting C2 in the brine before its flashing depth is reached, yielded positive results by reducing the amount of calcite deposits in the well during the one month period of the test (Kuwada,
26 CALCIUM CARBONATE CHEMISTRY Calcium carbonate deposition occurs due to a set of geological, physical and chemical conditions that are encountered at a given time in a geothermal reservoir. Geological factors such as groundwater circulation and mineral composition of the reservoir rocks are important in understanding the origin and mechanisms governing the scale forming processes. Physically, the pressure, temperature and amount of the non-condensable gases and the kinetics and shape of the calcite deposits are of great importance (Mahon, 1981). The geothermal fluids at Miravalles contain sufficient dissolved gases to increase the pressure at which flashing occurs by a considerable ammount. When the fluid pressure is near the flash level, particularly if C2 is present, the start of the flashing is accomplished by a shift in ph as the carbonate solution equilibrium is unbalanced by the release of the gaseous phase of C2. The fluid becomes then supersaturated with respect to carbonate as the ph continues to rise, and the calcium present will trigger a precipitation reaction depositing calcium carbonate on the walls of the wellbore. This mechanism may be still more favored if a sudden increase in the diameter of the well (i.e. a liner hanger) is present. Therefore, transitions in the casing diameter
27 -22- should either be avoided or located at a safe distance above or below the predicted flash horizon. There are other reactions that have some influence in the solution ph, such as the amount of H2S in solution, but for the purposes of the brine that is present in the Miravalles reservoir, their contribution is very small, The flashing point also depends on the partial pressure of the other gases, besides C2, present in the brine; but those gases are less soluble than C2 by a factor of nearly 2, and therefore, their effect on the bubble point of the solution is minimum and it will depend largely on the amount of C2 present in the solution (Michaels, 1981) Experimental evidence indicates that the reactions producing scale can be very rapid, occuring in fractions of a second, following the creation of oversaturated conditions. The carbonate scale usually forms as the mineral calcite, but under some conditions, the mineral aragonite, which has the same composition as calcite, but with a slightly different crystal structure, may precipitate. For all practical purposes, both minerals can be considered identical (Michaels, 198). Calcium carbonate deposition from individual waters vary from field to field, but the typical reaction can be represented by the following formulation: C2(aq) = C2(vap)..., (EQILIBRIUM)
28 -23- HC3- + H+ = CO2(aq) + H2...(FLASHING) Ca2+ + 2HC3- = CaC3 + C2(aq)...(DEPOSITION) It is interesting to notice that in the earlier stages previous to flash, Ca ions are more abundant than C3 ions; later, C3 ions are more abundant than Ca ions. Calcite will form in the first instance, but not in the second, despite the presence of both an adequate thermodynamic drive and a reasonable supply in Ca (Michaels, 198). In practice, the calcite deposits may occur in the first 2-25 m above the first boiling point. The deposition shape may tapper off from this point and become almost zero. By controlling the wellhead pressure, the deposition can be controlled in such a way that it occurs within the pipe at a choosen level. Following an extensive withdrawal of water from a high temperature aquifer, a general depletion of carbon dioxide in solution may occur through boiling. The reaction of the water with the rock minerals is not rapid enough to equilibrate the rise in ph, favoring the calcite to precipitate in the formation pores and fissures. This, however, may be of little importance if it takes place homogeneously, but if the deposition occurs in a major contributing fissure, an irreparable decay in flow may occur (Ellis and Mahon, 1977). The problem may become more severe if the reservoir fluids are rich in C2 and if the productivity of the rock is inadequate to fill the wellbore.
29 -24- Nancollas and Reddy (1974), conducted a series of experiments that measured crystal growth over a wide range of stirring rates. Their conclusion was that the rate of crystallization is independent on the fluid dynamics of the system. Therefore, it can be expected that the rate of scaling would be very little affected by factors such as flow velocity of the loaded aqueous phases over the scaling surfaces, unless some other factor like erosion over the soft deposits takes place. It is difficult to determine whether or not a fluid from a specific reservoir will scale during production. The difficulties are compounded by the fact that conditions frequently encountered downhole, such as high temperature and pressure, can not be easily simulated in the laboratory. Sampling of an aqueous solution brought to the surface for analysis can give entirely misleading results owed not only to changes in the original enthalpic conditions, but also to the fact that the solution may be actively depositing scale minerals within the well. For this reason, it is extremely important that the data obtained be consistent with standardized procedures used in other fields in the world, for comparative purposes.
30 CHEMICAL SAMPLING AND ANALYSIS 8.1 Sampling and analysis methods For flow test periods 2 and 3, the equipment for separation and sampling of steam and water shown in Figs.1 and 11 was used. Samples of brine, steam condensate and noncondensed gas were taken. The steam flow sampled was cooled in a bath of running water before passing through the condensing coil. The non-condensed gases were drained at the outlet of the coil from a flask that contained both condensed steam and gases. All equipment was flushed for a given time before the sample was taken. Since it is easy to control the separation pressures by using the control valves, four samples were taken at each of the five or six pressure points of the test, giving a total of 2-24 samples analyzed for each test. In every sampling point, distilled water was used for washing the bottles. In the case of the water samples, the bottles were also flushed with the brine flow before taking the sample. Care was especially taken with the gas flasks, to avoid air contamination. The samples were packed and sent to ICE S laboratories in San Jose. The chemical analysis were done by using atomic absorption or gas chromatography. 8.2 Chemical Analysis
31 -26- When sampling geothermal wells the components of the steam-water mixture are usually sampled after the it has passed through the flash separator. This method makes it difficult to define the state of the carbonate system in the deep water or in particular to calculate the carbonate equilibrium. Computer codes are available to simulate downhole conditions in geothermal wells (EPRI, 1978, Arnorsson, 1982). They iterate solubility data for selected geothermal minerals in order to facilitate the evaluation of solution/mineral equilibria and chemical speciation. (Arnorsson, 1982). The use of two computer codes working with the same data will be analyzed in a separate chapter. The data available for the tests made on June 2nd., June 24th. and August 8th.,1982 performed in PGM-1 are shown in Table 14. The separation pressure is known only for the samples of test periods 2 and 3. The brine composition is adjusted to wellbore conditions by knowing the steam and liquid fractions at each sampling point. The values of the brine for tests 2 and 3 are plotted against the time in hours since the well was first flow tested on August 27th These plots appear in Figs.37 thorugh 42. In each of these figures the gap between 18,4 and 23,6 hours corresponds to the period of well cleanup. Fig.43 shows the Na/K ratio versus time for the same samples. In Table 15 a more detailed analysis for four points of the third flow test period are shown. Special attention should be given to
32 -2 7- Figs.4 and 43 since the decreasing values with time of Na/K may indicate an increase in temperature of the reservoir fluids (Fournier, 1981). The chloride increase with time observed in Fig.4 may also be indicative of fluids of different (higher) temperatures entering the wellbore. Both tendencies are supported by the increase in enthalpy discussed earlier and shown in Fig.35.
33 DEPOSITION ANAL1 SI S 9.1 Electric Power Research Institute Program The Electric Power Research Institute computer code EQUILIB, reproduces the equilibrium chemicai composition of gas, liquid and solid phases of an aqueous solution consistent with the physical laws of balance (EPRI, 1978). The physical laws obeyed in the computations are elemental mass conservation, charge neutrality and Gibbs free energy minimization. The equilibrium data base used in the calculations contains 8 gases, 2 aqueous species and 187 solid mineral species from to 3 'C. The EQUILIB code consists of "n" equations in "n" unknowns where "n" can be a very large number. Depending on the complexity of the brine, solution of up to 3 simultaneous equations may be required. The algorithm used for the solution of the matrix uses an iterative procedure to improve an initial estimate of the solution in sequential calculations until all of the equations are satisfied, within selected limits (Roberts, 1983). When the input has been supplied to the codef the subprogram EQUILIB-A calculates the equilibrium constants for the data. A temporary data base addition provides equilibrium constants for C2, HC1, 2 and H2 as functions of respective concentrations in the liquid phases. Another subroutine called GEOTHRM-2 in turn retrieves the
34 initialized data from the disk and calls for EQUILIB-B to solve the problem. After the problem has been solved the subroutine GEOTHRM I11 provides the output (EPRI, 1978). The input data for the EQUILIB code are given in Table 24 and the output of mineral precipitation is shown in Table 25 for four different runs. The results of the fourth run with the EPRI code which contained the temperature values calculated for each test by geothermometry, are plotted in Figs.44 and 45. The most important feature of the results obtained is that in all four runs the calcite values tend to decrease with time, which was suspected earlier with the increase of reservoir enthalpy and geothermometry. Excess quartz, was also expected to increase in value if hotter fluids were being withdrawn from the reservoir at the end of the test. From the plots shown in Figs.46 and 47 this can be observed for wellhead pressures od 7.5, 1 and 12.5 kg/cm2. Another important characteristic is that the amount of excess quartz and calcite in the solution is greater at lower pressures and has the tendency to decrease as pressure increases. This fact should be taken into account when the operation of the field is to be started since this will influence the turbine and separation equipment design. It will also influence the flashing point of the brine in the well.
35 National Energy Authority (Iceland) Program The data that was used in the EQUILIB code was also fed into the WATCH code develop at the National Energy Authority in Iceland (Arnorsson et al and Svavarsson 1981). This data appears in tables 16 through 23 and corresponds to analysis from samples taken at two different wellhead pressures on June 2nd. and June 24th and four different wellhead pressures on August 12th This code works in a slightly different fashion than the EQUILIB code but basically the output is the same. The program is also written in Fortran IV language and the method of solution is very similar. The calculations are based on the mineral concentration of the water and steam phases and the discharge enthalpy, which determines the proportion of the phases in the flow. The program can also be used to calculate speciation in water and steam-water mixtures which have boiled adiabatically in one stage to specified sets of temperature, and then cooled down without steam loss to another set of temperatures. These calculations are useful in evaluating how boiling and cooling causes the water to depart from equilibria with specific minerals. All calculations can be carried out at any specified temperature within the range of to 37 C. All the chemical components that occur in major concentrations in geothermal waters and/or rocks commonly found in geothermal
36 -31- systems are included in the program as well as 65 reactions describing equilibria between 73 aqueous species and 7 gases. Solubility data of 26 commonly occurring geothermal minerals are also incorporated to facilitate the comparisson between water chemistry and mineral solubility (Arnorsson,
37 Rice University Method A field engineering method to predict calcium carbonate deposition was developed by Odd and Tomson (1982). This method uses commonly measured field parameters and has been tested for geopressured brines with very interesting results. The method calculates the saturation index (Is) and the ph by using conditional equilibrium constants dependent on temperature, pressure and ionic strenght, which eliminates the need for activity coefficients. The method calculates the Is following the Stiff and Davis (1952) method, but makes possible an approximation of ph values if they are unknown. The great advantage of it is that it is relatively easy to use if total calcium, bicarbonates, pressure, temperature, dissolved solids or conductivity values and the mole fraction of C2 in the gaseous phase are known. Since all these parameters are usually analyzed in geothermal wells, the method becomes a very useful tool in the field laboratory because it can also be used to calculate the brine equilibrium in the surface equipment by simply varying the conditions accordingly. Since our data contains all the necessary information required for this model, the method was handled in the same way that was presented by Tomson (1983). As with the computer models, the same values for reservoir temperature were used from geothermometry calculations. In Table 26,
38 -33- the input data for this model is shown as well as the results. The values for the three tests are plotted versus wellhead pressure in Fig.48. The similarity of this plot with the results obtained by the EQUILIB method reveals that for qualitative purposes the method can be used.
39 1. FLASHING POINT The data for test period 3 was also analyzed with a two phase flow simulator developed by Ortiz (1983). This method has the flexibility of working with either conditions at the wellhead (temperature, pressure, deliverability, flowing enthalpy) or with downhole conditions (reservoir pressure, temperature and enthalpy) for up to five different diameters of the pipe. The output of the program displays the pressure, temperature, and fluid velocity profiles for both the single phase and the two phase regions of the well and predicts the depth of the flashing point for the given set of well flowing conditions. For our purposes, the raw data that appears in Tables 15, 17, 2 and 23 was fed into the program and the results obtained from it as for the depth of the flashing point at each wellhead pressure (assuming no scaling in the well), are plotted in Fig.49. It is difficult to believe that the flashing point will migrate almost 13 feet in a 6 month periodas indicated in Fig.49. The approach followed then, was to take the reservoir conditions for the earliest flow test performed after the clean-up operations of the well, which corresponds to April 29th and assume the well completely free of
40 scale at this point. The reservoir conditions for a clean well were obtained from the program for three different wellhead pressures by feeding it with surface data. Then, for each of the three wellhead pressure points reservoir conditions were kept constant as well as the flow rate in the surface but the diameter of the well was changed. Since the wellhead pressure during the long term test oscillated around 1 kg/crn2 (with the orifice plate restriction at the outlet) it seems reasonable to assume that the flashing depth had to be between 2125 and 275 feet. Fig.5 shows for the deliverability test (clean well conditions) carried out on April 29th the conditions that were assumed to take place during the whole 6 month test. If the flashing point is assumed to remain unchanged (or at least within the ranges specified in Fig.51, it is expectable that the calcite deposits will develop at that depth too. Therefore, the conditions for the diameter of the well as shown in Fig.51 were used to simulate the wellhead pressure decrease that would occur by choking the well over a lenght of 5 feet at the flashing point depth with calcite deposits, while holding a constant flow at the surface for each wellhead pressure. The three wellhead pressure points that were chosen from the test of April 29th. 1982, correspond to low, intermediate and high pressure and flow rates.
41 The program was run many times for each flow rate condition, starting with the clean condition of the well and ending where the well was not capable to sustain the flow rate specified. Tables No.27 through 29 show the area decrease and the corresponding wellhead pressure obtained for the low, intermediate and high flow rate values. For the case of the intermediate flow rate, more points were obtained in order to observe the pressure decay point more accurately. In Fig.52, the simulated well performance curves obtained through this method are shown for four different choked diameters. Then, the next step was to plot on top of those simulated performance curves the real ones, and in Fig.53 this situation is reproduced, for the deliverability curves of Jun. 2nd. and June 26th As can be observed, the well was able to go in August 26th far below the last simulated curve (which stands for the lowest flowing conditions that was possible to maintain for the proposed mode 1. By repeating the same procedure to different wellbore deposits conditions one should be able to obtain a more accurate result. The results obtained here are shown only with the purpose of information, but it is beyond the scope of this work to obtain the optimum model which can be probably done by a trial and error procedure.
42 -37- Fig.54 reproduces the values of wellhead pressure versus the choked pipe area obtained from Table 28 for intermediate flow rates. As it is expected, the wellhead pressure decay is almost imperceptible at the beginning and very fast at the end, where the percent of area changes very quickly with small changes in diameter.
43 11. REMEDIAL ACTIONS The effect that well scaling will have On the future development of the Miravalles geothermal field, Will depend on the feasibility of solving the problem. Many methods have been suggested to minimize and/or control the Scaling problem (McNitt et al. 1983). The methods can be divided as follows: 1. Periodic cleaning by the mechanical method of drilling out the calcite 2. Periodic or continuous suppression of scale by chemical or CO2 gas injection 3. Minimizing deposition of scale by operating the wells at a relatively high wellhead pressure, thereby insuring flashing above the casing-liner joint 4. Minimizing scaling potential by running the same diameter liner from production depth to the wellhead 5. Avoiding scale by finding zones in the reservoir from which non scaling fluids can be produced Among those methods suggested, the mechanical cleaning, together with running a single diameter in the well and a
44 -39- further investigation searching for a deeper and hotter source of the reservoir, will probably minimize the problem during the exploitation of the field. The inconvenience of using some of the most recently developed methods, is that those methods have been tested for short terms and would be applied still under a testing basis in the Miravalles field. Instead, a combination of mechanical cleaning and well design improvement are techniques that have been used elsewhere and do not involve the use of any sophisticated methods. Increased well diameter has reduced frequency of calcite cleaning in the Svartsengi field in Iceland (Gudmundsson, 1983) If carried out with good organization, it may provide the less costly method that can be applied in the field, especially under a combined condition of lack of specialized equipment, manpower and spare parts. The last option contemplated, of extending the exploration elsewhere in the field, is strongly supported by some of the findings of this work and the possibility of having either an offset or deeper hotter aquifer is quite good Mechanical Removal The mechanical removal of calcite deposits seems to be widely used in areas where the problem has appeared. Mahon
45 -4- (1981) states that the use of a Failing rig to remove calcium carbonate in the field of Kaweraw, New Zealand, is a common practice. Similar reports from Iceland and Mexico are known. In the field of Svartsengi (Iceland) and Cerro Prieto, (Mexico), a more useful technique have been developed for scale removal by rotary drilling while the well is producing. The two techniques that are being used are similar and the main difference is in the place where the cooling of the packer that seals against the drill string takes place and the type of pipe joint used. In the Mexican method, upset joint, 3" drill pipe is used. Two blow-out preventors are used, and the cooled drill pipe packer and flow diverter spool make the height of the substructure almost 3 feet. The coolhead used in one of the methods employed in Svartsengi and shown in and shown in Fig.57 seems to offer a good solution for this inconvenience. Both systems have the advantage of being able to carry out the whole operation without exposing the well to thermal shock, either from warming up or cooling down periods that, when done repetitively may cause damage in the casing Running Liner to Wellhead It is likely that the scaling rate can be reduced by having a uniform diameter from the bottom to the wellhead. In Cerro Prieto, Mexico, the use of the Hydrill, Super-Flush
46 -4 1- joint in 9 5/8" diameter liner, that is cemented to the top of the reservoir through the use of cementing ports, has reduced greatly the silicate deposition in the wells. This type of pipe joint, oposite to the buttress joint, is internally continuous and leaves a smooth surface in the joint area. The use of the technique of cementing through portholes, provides thus, a smooth pipe of a single diameter from the reservoir to the wellhead. An increase in production has also been obtained with this method as compared with the conventional one, since the 9 5/8" diameter can carry a bigger production with less pressure losses (Guiza, 1983). This approach reduces the scaling rate but does not eliminate it Well Location and/or Deepening It is common that wells form scale in the wellbore when they are located peripherically with respect to hotter regions of a reservoir. In Miravalles, the possibility of deepening at least one of the existing wells is worth consideration, since the liner hanger may be still in operable condition to be retracted. Another possibility would be to explore with deep gradient surveys and resistivity soundings in the less explored zone uphill the Miravalles volcano as suggested by
47 -42- McNitt et al. (1983). The data that has been analized in this paper, strongly supports this possibility.
48 12. CONCLUSIONS 1. The results obtained through the study of the chemistry and deliverability in the second and third flow test periods, seem to indicate a possible evolution of the field, that suggests the possibility of withdrawing in future from hotter aquifers that may feed the wells after prolonged periods of time. 2. Such evolution is shown in this paper starting with indications from the chemical analysis and production measurements, and supported with calculations from geothermometry and computer models. 3. Using the two phase flow simulator to reproduce the scaling process in a cleaned well, appears promising. The simulator can perhaps be changed to suit deposition problems or by matching the solutions by trial and error methods. 4. From all the parameters analyzed in this study, careful measurements of the production and chemistry of the liquid and gas phases seem to be important when using the computer codes available. It is equally important to gather as much data as possible under pre-planned schedules in order to use, if possible, statistical analysis.
49 The use of a simple and qualitative method for the prediction of calcite precipitation is presented and seems to work well as the more advanced methods for the data studied. 6. Mechanical reaming of scale deposits and improved well design have proven to be effective over long periods of time in other parts of the world. It appears to be a workable solution to this important problem. 7. Deepening of the existing wells, for investigation purposes, or extension of the geophysical studies searching for a hotter source, and therefore, a less scaling environment is recommended.
50 -45- REFERENCES Arneberg, J. E.: "Testing of Equipment for Use in Connection With Workovers in Flowing Geothermal Wells". Paper in preparation. JEA-81-1, Iceland, sk. Arnorsson, S. : "Mineral Deposits from Iceland Geothermal Waters,Environmental and Utilization Problems". Society of Petroleum Engineers, 789, sk. Arnorsson, S., Svavarsson, H.: "The Chemistry of Geothermal Waters in Iceland. Calculation of Aqueous Speciation from to 37 C". Geochimica et Cosmochimica Acta, Vol. 46, No.9, Sep Ellis, A. J., Mahon, W. A. J.: "Chemistry and Geothermal Systems". Energy, Science and Engineering: Resources, Technology, Management - Academic Press. Belton, Texas, EPRI : "Brine Chemistry and Combined Heat/Mass Transfer". Interim Report ER-635, Vol. 1, Fournier, R..: In. Ribach L:, Muffler, L. P. J.: "Geothermal Systems: Prlnciples and Case Histories". John Wiley and Sons, Grant, M:, Donaldson, I, Bixley, P. "Geothermal Reservolr Engineering". Energy, Science and Engineering: Resources, Technology, Management. Academic Press, Belton, Texas, 1982.,sk Guiza, J.: Instituto de Investigaciones Electricas (IIEE), Cerro Prieto, Mexico. Personal comunication, Instituto Costarricence de Electricidad: "Prefeasibility Report of the Miravalles Geothermal Area". Internal Paper, Instituto Costarricense de Electricidad: "Drilling and Production Report for Wells PGM-1, PGM-2 and PGM-3". Internal report, Instituto Costarricense de Electricidad: "Summary of Investigations and Technical Findings as of November, 198". Internal report, Instituto Costarricense de Electricidad: "Results of the Tests Carried Out in Wells PGM-1, PGM-2 and PGM-3 of the Miravalles Geothermal Project". Doc Oct James, R.: "Measurement of Steam-Water Mixtures Discharging at the Speed of Sound to the AtmosDhere". New Zealand Eng. Jour., Vo1.2, Part 2, 1976
51 James, R.: "Report on Study of Miravalles Wells". Dep. of Sci. and Ind. Res., Wairakei, New Zealand, June, Mahon, W. A. J.: Dep. of Sci. and Ind. Res., Wairakei, New Zealand, personal comunication, McNitt, J, Klein, C, Sanyal, S.: "Interpretation of Well Testing Results with Specific Reference to the Calciting problem: Miravalles Geothermal Project, Costa Rica". GeothermEx, Inc, Berkeley, Ca., June, McNitt, J., Sanyal, S., Klein, C.: "Impact of Scale Deposition on the Feasibility of Developing the Miravalles Geothermal Field, Costa Rica". GeothermEx, Inc, Berkeley, Ca., unpublished report. 18. Michaels, D. E.: "Deposition of CaC3 in Porous Materials by Flashing Geothermal Fluid". Geoth. Res. Eng. Mangmt. Prgm., LBL 1673-GREMP 9, Michaels, D. E.: "C2 and Carbonate Chemistry Applied to Geothermal Engineering" LBL 1159-GREMP 15, Oddo, J., Tomson, M.: "Simplified Calculation of CaC3 Saturation at High Temperatures and Pressures in Brine Solutions". Journal of Petroleum Technology, p July, Ortiz, J.: "Two Phase Flow in Geothermal Wells: Development and Uses of a Computer Code". MS Report, Stanford University, Roberts, V.: "Analysis of Scale Formation in Geothermal Systems" EPRI, Stiff, H. A., Davis, L. E.: "Method for Predicting the Tendency of Oil Field Waters to Deposit Calcium Carbonate". Trans. AIME, Tomson, Mason : "Inhibitor Evaluation in Geopressured Brines" Rice U. and U. of Houston Project Review, Gas Res. Inst., HOUSton, Texas, Feb., 1983.
52 LIST OF FIGURES Geographical location of the Miravalles geothermal field Geologic and topographic map showing the exploration technique results PGM-1 - Well design and lithology PGM-1 - Drilling curve PGM-1 - Temperature recovery PGM-1 - Decline index versus time for the three long term tests PGM-1 - Flow rate and wellhead pressure versus time for test 1 8A. PGM-1 - Flow rate versus time for test 2 8B. PGM-1 - Wellhead pressure versus time for test 2 9A. PGM-1 - Flow rate versus time for test 3 9B. PGM-1 - Wellhead pressure versus time for test 3 1. Equipment utilized for flow measurements 11. Surface continuous recording equipment for flow measurements 12. Caliper logging results for wells PGM-1, PGM-2 and PGM PGM-1 - Mass flow versus cummulative production for test PGM-1 - Mass flow versus cummulative production for test PGM-1 - Deliverability curve for test on 4/29/82
53 PGM-1 - Deliverability curve for test on 5/13/82 PGM-1 - Deliverability curve for test on 5/27/82 PGM-1 - Deliverability c'urve for test on 6/2/82 PGM-1 - Deliverability curve for test on 6/24/82 PGM-1 - Deliverability curve for test on 7/8/82 PGM-1 - Deliverability curve for test on 7/3/82 PGM-1 - Deliverability curve for test on 8/12/82 PGM-1 - Deliverability curve for test on 8/26/82 PGM-1 - Deliverability curves for some typical tests during test 3 PGM-1 - Flowrate versus time for 7.5 kg/cm2 (a) from deliverability curves PGM-1 - Downhole enthalpy and deliverability for test on 4/29/82 PGM-1 - Downhole enthalpy and deliverability for test on 5/13/82 PGM-1 - Downhole enthalpy and deliverability for test on 5/27/82 PGM-1 - Downhole enthalpy and deliverability for test on 6/2/82 PGM-1 - Downhole enthalpy and deliverability for test on 6/24/82 PGM-1 - Downhole enthalpy and deliverability for test on 7/8/82 PGM-1 - Downhole enthalpy and deliverability for test on 7/3/82
54 33. PGM-1 - Downhole enthalpy and deliverability for test on 8/12/ PGM-1 - Downhole enthalpy and deliverability for test on 8/26/ PGM-1 - Mean enthalpy values (without adjustment) versus time 36. PGM-1 - Mean enthalpy values (adjusted) versus time 37. PGM-1 - Na concentration versus time 38. PGM-1 - K concentration versus time 39. PGM-1 - Ca concentration versus time 4. PGM-1 - C1 concentration versus time 41. PGM-1 - Si2 concentration versus time 42. PGM-1 - HC3 concentration versus time 43. PGM-1 - Na/K concentration ratio versus time 44. Calcite precipitation versus wellhead pressure for EPRI code 45. Silica precipitation versus wellhead pressure for EPRI code 46. Calcite precipitation versus time 47. Silica precipitation versus time 48. Saturation index versus wellhead pressure for simplified model 49. Flashing depth versus wellhead pressure for four deliverability tests during flow test 3 5. Range of wellhead pressures and flashing depth assumed for scale simulation 51. Wellbore conditions assumed for scale simulation
55 52. Flow rate versus wellhead pressure from scale simulation 53. Real and scale simulated well performance curves 54. Area versus wellhead pressure for scale simulation 55. Equipment utilized in Cerro Prieto, Mexico for mechanical reaming with the well flowing 56. Equipment utilized in Svartsengi, Iceland for mechanical reaming with the well flowing 57. Combined cooling chamber and flow restriction for a 12" Grant rotating head utilized in Svartsengi field, Iceland
56 c GEOGRAPHIC LDCATION MAP. h-
57
58 .1s m lahar.. IY-SlB SSS a1 tered tuff.. GEOIxxjy WELrxToCTuRE =Cemented zone Total loss zone! v Partial loss zone FIGURE 3. PGM-1 - Well design and lithology
59 FIGURE 4. PGK-1 - Drilling curve
60 .* E - CI 5 a a 8, NOTAS SIM BOLOGIA '2 TERMINADO EL DIA > - = - = : POZO CERRADO PARA MEDIDA IO : POZO OESPUES DE PRODUCCION : MEOIDA AL CERRAR EL POZO -1-s-r Figure 5 Temperature Recovery j OIBUJO VERlFlCO PLANIFICLICION UfCTRiCA PROICCTO OEOftRIlCO (IIIAVALLL9 POZO PGM I 1 INQ bnln lnstltuto COSTb.!?R!CENSE DE ELECTRICIDAD WOVIEMCfRE,I9/ 1-1- REGISTRO DE RECUPERAClON DE femperafuri DESPUES 'DE LA PERFORXION
61 * c Q, W >_ H I- o cr> CSL > a \ 3 a c + i E (3 Q m Tv 4 W D a C (d/m) X3CINI 3NIl33Cl
62 co d- a cr, L I m H - I

63 rl u m al U H R e
64 S/91 IWv tl M1d SSVW U
65 m a3 m u-)
66
67 I I * c3 c/) L I ox m U v1 aj U $4 tu d 1 I I I IL 4 m
68

69 3 4 w LC w C.d a LC u aj LC f UI 1 3 c R I

70 e r J m 4 u w m a 4 u U - I
71 L W E 3 5 S/91 '331Vtl M1d SSVM
72 i m 4 1
73 C
74 . c c LC a U a aj
75 c In I- 3


76 L e LC u m W a 33S/93>1 M1J lv11
77 . E - a I\ a Lo d- m m
78 I. c\( W L4
79 LJC. C a al I
80 u5 cn W CL E > LL
81 . c a aj I m (v 33S/9>1 M1A W11
82 i 3
83 1 1 co CY co Lo L v H err S/% M1i lv11
84 :::; 95 PGM-1: H VS. PRESS. 7k 5 6ol t- 3: tr 1 PGM-1: W VRS.PRESS. FIGURE 26. PGM-1 - Downhole enthalpy and deliverability for test on 4/29/82
85 PGM-1: H VS. PRESS. 7L 1 5F 4k 3F PGM-1:: W VRS,PRESS. FIGURE27. PGM-1 - Downhole enthalpy and deliverability test on 5/13/82 for
86 c, ld i Q PGM-1: H VS. PRESS, I- z w w cr) -.I a + m e ""E. PGM-1: W VRS.PRESS. FIGURE 28..PGM-1 - Downhole enthalpy and deliverability test on 5/27/82 for
87 . - PGM-1: H VS. PRESS I I I I I l l I l l c3 Y \ c, Y i LL t- Z W loool 95 i. 3k I WELLHEAD PRESSURE, KG/CM2 PGM-1: W VRS.PRESS. FIGURE29. PGM-1 - Downhole enthalpy and deliverability test on 6/2/82 for
88 PGM-1: H VS. PRESS. - E 15 t loool 95 i LL J a I- m I- t WELLHEAD PRESSURE, KG/CM2 PGM-1: W VRS.PRESS. FIGURE^^. PGM-1 - Downhole enthalpy and deliverability for test on 6/24/82
89 PGM-1: H VS. PRESS i t i i w m \ Y 3' m LL I- h, I- PGM-1: W. VRS.PRESS,
90 -. PGM-1: H VS, PRESS. 4 3 L I WELLHEAD PRESSURE, KG/CM2 PGM-1: W VRS.PRESS. FIGURE32. PGM-1 - Downhole enthalpy and deliverability test on 7/3/82 for
91 PGM-1: H VS. PRESS. 11 I l l I I I I I I I I I I I I z W 9 5 w s 6 2 LL J U t- m I k I- i WELLHEAD PRESSURE, KG/CM2 PGM-1: W VRS,PRESS. FIGURE 33. PGM-1 - Downhole enthalpy and deliverability for test on 8/12/82
92 PGM-1: H VSn PRESS. 11 I l l i rl J < I I- z w. i w c3 Y 71 5 t I- 3L WELLHEAD PRESSURE, KG/CM2 PGM-1: W VRSnPRESSn FLGURE 34. PGM-1 - Downhole enthalpy and deliverability for test on 8/26/82

93 (D.l n 4J C E" U In 3 *n CrJ a U 3 c 4J.A 3 W o Tr rn Ln rl> d 3 d C
![B.A U m a m L, 2 aj n I] PI U m 3](/docs-images/85/92434416/images/94-4.jpg "-n I] ro Y m I I Lo e * L-l n a Ln")
94 B.A U m a m L, 2 aj n I] PI U m 3 -n I] ro Y m I I Lo e * L-l n a Ln a
95 C u C u
96 (D nj LlJ E - I H * c\1 CUG -4 4.J VI 3 VI LC aj 3 C n + U u C cv (D v CY r\l r\l w (D vi
97 . F- I aj 6.r( U I m Ol-4 u C u 3 t m d-
98 . W E H I- o 3" i CUG CUL I C I m D O -7-4 I x (3 Q i Ol- m c u u rl u I rl I I: 2
99 . i i I X cud njl I w W O+ OI U F
")

100 u :- 1 ;. - t cn" > n U rn rn nl v) c I m W x )---I I-.rl c, C.rl U LC rg U C aj C u u m V X I 4 r I CJ a
101 . a c\1 1 D C.A L) a L c, e aj u e u X \ 3 d z I CJ a m c* n

102 . Q, LC 3 m aj a m c aj rl l-i Q, 3 c W i.a> e I" e 23 u H Fr( EO-3 X ZH "LIE> 1/1W 31131V3

103 a ( c aj rl rl aj 3 C i d- m G Q ZO-3 X ZH "d9 OOOT:/114 V3IlIS
104 . ' d- I O m.d U I O F QI LC1 c\1 x H I- LC Q, > C u-) 6 6 d- 4 (5
105 . W H -l c(> > CL u H W E n u-> d Lo d- 6 d- 6 Lo cy) 6 c3 (3 NIlVlIdI33tfd 1%

106 LC W a rp aj c 6-l r-i aj 3 C O OaJ I i" I I I I I I I I I I I l l 1 I I I I X3aNI NIlVNllVS
107 L 3 y1 d- 4 c6 > 1 I- n LLJ I W - 1- a3 t I I I I I I I I I I I I I I I - i I (D 13 HHld3CI 9NIHSVl.d

108 -7 a Q, t I. m H err

109 Reduced diamete r zone ( KMX3 ADEKE 125 m FOND #)ZO 13m. ACABADO ZONA CEMENTADA FIGURE 51. Wellbore conditions assumed for scale simulation
110 6
111 UJ a- 3 h 3 u al u C E m h ru h aj a LL w Q U, > m aj U ln (3 33S/9)>1 13 lv11
112 E
113 Equipment mechanical utilized in reaming.with Cerro Prieto, Mexico the well flowing for I I li / R ~ / P --, J I 1 / 1 ji il i I! I # I U I T k
114 N le
115 Set up of test equipment ot well no.6 Svortsengi
116 LIST OF TABLES 1. Long term flow tests run at Miravalles well PGM-1 2. Chemical analysis of the particles found in the silencer of PGM-1 3. Production data for deliverability test of 4/29/82 4. production data for deliverability test of 5/13/82 5. Production data for deliverability test of 5/27/82 6. Production data for deliverability test of 6/2/82 7. Production data for deliverability test of 6/24/82 8. Production data for deliverability test of 7/8/82 9. Production data for deliverability test of 7/3/82 1. Production data for deliverability test of 8/12/ Production data for deliverability test of 8/26/ Downhole enthalpy calculated for deliverability tests 14. Chemical analysis of the samples taken during test periods 1, 2 and Chemical analysis of the brine and condensate for samples taken during flow test period Selected chemical-physical data for computer analysis for 6/2/ Selected chemical-physical data for computer analysis or 6/2/ Selected chemical-physical data for computer analysis for 6/24/2 19. Selected chemical-physical data for computer analysis for 6/24/2 21. Selected chemical-physical data for computer analysis for 8/12/82
117 23. Selected chemical-physical data for computer analysis for 8/12/ Input data for EPRI code 25. Output data for EPRI code 26. Scaling simulation results for W=26,33 lb/h 27. Scaling simulation results for W=493,258 lb/h 28. Scaling simulation results for W=593,446 lb/h 29. Data for Rice University method
118 L d h C bl 1 rn c cl
119 TABLE^. Chemical analysis of the particles found in the silencer of PGM-1.4%.- % -1%.W.2% NbA. 1.2% 3.5
120 *i * e * a (* c m n. c m. * w R O * * * IN cr D a * r. c rc, c. W a e c m * e. * * * r( al a LC Y( cp U a E.#-I.L Y a e, 4 9 N
121 + J + e + a OD S h) t e * m m 9 L1 c (c z C *** ** +* *+ *** o c o o *
122 * a * ap (Y \ c -4 U 3 a *** ** * -hr i
123 n e t r t e c 3 a L ou tot tt t t t t w t t t m *
124 * a * : \ rd d Q, a & W c, Q ( a c.r( L) ij a 1 c (Y I-. c m I- ro 23 c W I- O C 9 c.
125 e* ** ** e * o m 9 7 wl- (Y? h. V. C c o c m c u * v e. lr, Q, y. e * e * * ***e**** * *e* ** * * aa ww * a e s * u r, m e ** **.*e* * e
126 (Y \ OD m t. m c n * P.. m c. w r) *. c, a a a LC. m. C m. 1 m = m QI w * aw ********* * a PI iis * c
127 tl * t *..* * 4J 3 ett,* * (1 tt * m m a
128 t 9 * G * u (Y QD w LC w a c, a c.r( +, * + o o o. o c o * * i e *
129 TABLE 12 DOWNHOLE ENTHALPY CALCULATED FOR DELIVERABILITY TESTS 4/29/ so /13/ /27/ $ /2/ /24/ BO /8/ $ /12/ /26/
130 I t4 GEOTHEEMAL I~ELLS


131 a 3.5. " U. m P. oblpmn4pc) 2VIzmsuIzul LC 3 'L1 C 4, rr: Q c, m d a 5 (II u. I LLL. I m p. 2..-I. il I. n. I. * A. a. :. j. I E - u.. d u. n P. OL L * u. -I L. '-q. + E OQ 33 3GOU '3.. -*. + i. 3 U. 'J u. u. t I. A. u. + E. z LL. 3.L.. '3 Y t' I. al. e.. P 2. E. 6. LO. LTI - UI UI us 1- Ln tc In r us t-.t c- u i- r, I-

132 - wm oc --?...
133 -ocu3 mooo**... m... A s \.... e 3... Y O N O O O ~ x-jvl* V)uxuxu ~rcvi-i 4 tl3c~h'~x. n c a A I L N < cu i e.. W b U n 4 E \ ul s Lnooooooooooooooo N m t N - m \... O m O ~ a o e N - ~ m -mama 3 m e *maw c (4- m... n... E... a... a... Y w.$.i 4...b au... EO...>.C(....w m a.b E...u em.....a wc.icu...ma b \ O.....a....ox UZ.d O P d -4 '1 3 avl x x F'" E Y r 3 v l a u ~. ~ m t * r u

...=,.")
134 1 a 8 u c a I rl a U.d 6 Q) c ez w X w W e VI W il il U U ez U E I c I E e a il il W 3 hl O N co * \ d ( u B O VI\ w a E O W x ** o w O B w * e n... Q,... moe(un eooo-ln o o o o o m... A n.... f..... \ Y..... xcuvl~.m o(ux(uw VIuzoxu U exxxsx n 4 E \ cn r E m o o o o o o o o o o o o m o o Nooo----a9oo-oooo \...'.. oomomoap--ooooo--o majc33m m - m 9.mmN (u PI- (3 rn B\ ux.... (' z x u m L: m 3 VI P p: Y......*..... B...>...C( CI...b...L)...=,....on n c3 w AB w u b;i -e 31 xx ;Io -QI 4 VI4 m o m u ao- 4u YY Y (uewww EXLnLnlA u\\\\ \9oe O Y X X X X 9PIO ao-.y* *....o--3a 19m OI w. * w e * -: *.*a4 w a 4 z

 -m....w.. w o - *.")
135 LC d) u a 1 R E a I c I: I L3 a U t: w I u w W cu co 3 \ N \ a.. * I- n ococornmcv -o(uoofi n e \ Y coooo~ a XNvlU 'n: ONENW v l I U I d U OsXMxs m o o NO \ * a o o m -mln **ob N CI-... oa--o t-coo iv3 m w.4 xea... m- 3 c rn... n... E... &... a... Y w... i)... a co ' v)&v... oaoo o m 3 m r n... n 4 E \ m c E Y cu m * I- U > U I- 3...m n.o I 4.alu t. u m ~ r n n w ob w u bd nn 33 ss av * f i OJ vlu m u m a 4Y YY Y (ul3www z x m m m u\\\\ \3wL3w wxxxx x -3 mop-m N... *OCzlnN 3cIc) -m....w.. w o - *. w e * **e4 * w a u z
136 m 4 m 3r d -ai c Q vl w il il U > 4 d U E 1 c I E P a il il E tr O N z ** o w n e Y W d a f: 4 v n e \ OO*N*Q, ~czoof? OQ,OOO~ Y..... h cucnt -: ONXNU vl~xuru 4 wssxss 4 E \ a) mooooooooooooooo NN---aQ, \... LnLnm*mm-Nm PfczSln mcr) m m o *mmn F? cz- a E W CI \ X a N *r( vl... * (D m.rc P xucil v1 p: c d ulsu.aj u mls r s E Y 3 Q, (Vmwww
~~--t3 mm-to m m m In *mmn (u 3 c? Q)..... b - u..... Q e m xxu r: tn 3 m...... PCC.4. IYOLUPO o X")
137 a 1 2 W Q c, a Q c si a W e I c I E 23 a n E a Tz Y w ;r a L U m p: w w U J o m o o o Q, a... n \ Y..... X cumrr *e OCUXNW mu2uxu 4 23XX~SX n 4 E \ m \... mooooooooooooooo N3~~N~~ c E Y (uq)~~--t3 mm-to m m m In *mmn (u 3 c? Q)..... b - u..... Q e m xxu r: tn 3 m PCC.4. IYOLUPO o X
138 4 U a 4 I- m u. 4 w d 4 a 4 c a w z I- O w m w cl a U > 4 d w c I c I i: W Q)mc?o--m em--o-- o ~ o o o m m e... J... \... 3.* Y..... XNV)* *d OCUINU auauxu 4 ws.vsss n 4 E \ m mo6oooooooomoooo (uo~o--ooqoo(uoooo \...'. mo~n(uo~-oooototo rdmol33 s * m m o *mnbcu c? \1) c? a... * 6 x x u E m.rl a 3 n 4 m cr Is 4...a mis c E Y.....u *I- *u.. CSP ** 'I- *u -3 2 uo xu
 a w... n... I E.")
139 LC L, 3 a 6 LC c 3i a I U u U e U t-c v1 U. 4 w e U a U f W I t-c w W 3 p m o a o Lnoo-ooLn... omooom Q)... e... z..... \ * y..... x Ntn3 *e O W I N H muzuzu U WXx Sx x m w n a 4 4 E * \ U In n: W c E r I c I \ moooooooooomoooo NOo(u-NN E o o o ~ L n o ~ m - o o o W o m o mmmmf t e Ln a a * W O N t a e N (3 Q) a w... n... I E a... Ir a... (u u... a * \ w.....* a (u a... t-c b c au... W m \ X.* c( 4....H mer....b E E...u 2.. e w.,...a w w b w m ~ t-c b \ O...f...ox w t3 Y u uzt.rcta ~tutn-tos~.r(.suo n aolv!rxo~amocueum~r~u
140 a c a 4 n p: U b v1 u 4 14 W p: U J U c er: W T c1 W v1 W a J U W U p: U I= I c I r 13 r w T u W 13 N a \ N c \ a.. w b 4 CI... m... - m t o t o tnmeoor omoooc?... A \ Y x(uv1t -: o(uz(un u2u~uxu 4 uxxxxx n r( E \ cn c E Y m o o o o o o o m o o o o ~ o o o * - - ~ o ~ o o c u o o m o \..*... mooaeo*n~ooo~o-o 3am3 s t m eo *mon a r * N c? a m * a m t %xu& v1...*......p n...a..... p...u...=.mp.. P4 *u C(....or o r ( *suo LU~LZCJ
141
142 Output data for EPRI code 6/2/82 6/2/82 6/24/82 6/24/82 8/12/82 8/ 12/ / / E E E-3.556E-3.367E-3.414lE E E E E E E-2.295E-2.295E-2.262E E-2 6/2/82 6/2/82 6/24/82 6/24/ /82 8/12/ / /82 6/2/82 6/2/82 6/24/82 6/24/ / / /82 OS/ 12/ s S-O E E E E OE E-O E E-3.43E E-O2.35E-2, E-O2.3688E E-2.345E-2 6/2/82 6/2/82 6/24/82 6/24/ /82 8/12/ / / E E E-3-486E E-3.339E-3.524E-3.473E-O3.335E-O2.4122E E-2,3547E E E-2.3\ 18E E-2
143 TABLE 27 SCALING SIMULATION RESULTS FOR 9~493,258 LB/H 61 e l l l ,
144 TABLE 26 SCALING SIMULATION RESULTS FOR Q=26,33 LB/H AREA INCH2 DIAMETER FEET % CHOKE WHP PSI FLASH DEPTH (A) FT TABLE 28 SCALING SIMULATION RESULTS FOR Q=593,446 LB/H AREA I NCH2 DIAMETER FEET % CHOKE WHP PSI FLASH DEPTH (A) FT
145 a 5 u A * * *I: * a * 2 z * a *(ucuecu-cn * cu * *oooooooo *oooooooo *OOCdJJQJU *-9.oI*Q)cDCDQ) * * UQONm9 *mcuufejncuhjw *oooooooo *oooooooo *oooooooo * * * nh UP * n * s * * w *I- * 4 o *
146 APPENDIX


147 SAMPLE111 IBDAlA OtT I.17E-OS*.U7IE-O2..BOOC-OIt.12OJE-2..41L-O *.1.SZE-W*...,.,....,.SI WSIE-2* E-O3..l91ft,.mWIE-OIv...1L-O6..]E ,.1 e437ie-2.1.,., WPTIAV I., ,...,..., , ,.s..... s ,....., ,...,.....,..., , a.. OPO OV OlM OJFO 11 OMIT OPH OPT1 ODELCV 1 OF OIOPEY OELECT OlCON OCVUN OCVMX., , ,.. OIO....,., ;o... ;;;., ,.,..., ,.,.....,....., s...,.,...,...,...,...,...,.,...,.,...,.,.,.1...,.,...,.,.1., ,...,...,.,., , ,., , ,.. I., 21,.. I 5..*EtOl...1 I.IE-O S26594S541Et2r I SS3SEt1. -., E1 I 1.4B1)lEt LE-7 2.S52SOlE-O E-OS E-3 >I tublbniii 61 LIME 63 FERROUS OXIDE 6S BOEHlllTE 67 1ULFUR 7s SODIUM OXIOE ii nimrirr
148 COMPUTER CODE OUTPUT LISTING PART I: EQUILIB - ELECTRIC PO K EX RESEARCH INSTITUTE (USA)
149 COMPUTER CODE OUTPUT LISTING PART 11: WATCH - NATIONAL ENER3' AUTHORITY (ICELAND)

I* 22 n2 2s sol--- 31 AL(on>** 12 ALlOH)2t 33 AL(on)4-34 AL(S4)t")
t I?")
3 7?E(OII)4-71 TECLtt 72 TECL2t 71 fecl3 SAMPLE#l (cont).. -.")
150 1lAL COYCEYTR~TIOY Ill LlEUtD CWASE (MOLESIK LIWID W2) 1 AL.14WS53E-5 2 r.17?211e-2.i. NO * 1 ALttt 2 Kt 3 YAi 4 CAtt I nett 4 FEtt 14 I s-- 17 S4-- I cos-- 19 CL- 2 on- 21 )I* 22 n2 2s sol AL(on>** 12 ALlOH)2t 33 AL(on)4-34 AL(S4)t 35 AL(SO KCL 43 KSO4-45 NACL 44 naco3-47 NA84-4* CAOWt IO CACOI I1 CAncolt 52 CAS4 I3 noont I4 meco3 IS IlEMCOlt I4 ME14 so FE<DH)t I? fc~omi2 LO feclt 41 fecl2 42 CECLI- 4s fl84 44 fettt 47 FEtOMlt4 4s FE1OH)Zt 49 fe(oh)3 7?E(OII)4-71 TECLtt 72 TECL2t 71 fecl3 SAMPLE#l (cont) W YCOI- 114 n2co1 115 MCL 141 MlS n2s nso1-- 17s nmo


151 NIWES C5TA RIM SI M 1WO. K 233. CA 48,w RG,1 co so OS, U 31* F O*OO DISShWIDS, AL.1 B 47,oooo FE, NH3 o.ooo IONIC MLm :.,o..,o.... o*o..,o..... o*o ,....., BEEP MATER ~PPIO SI an K cn 42e87 ffi,88 so U 2717,M f. DISSaS. O B K.877 B 41e25 FE O.oQ coz 168*78 HZS,OO HZ 4,94 2. ch4.22 I2 81 $ 7 5 m3.


152 m ORKUSTOFNUN ACTIVITY COEFFICIENTS IN DCEP MTER tlt,727 K W - MI-.638 F- H3SIM-,648 CL- HZSIM-,211 Mt HW3- e 615 Kt HC3-,648 w C3-,191 %ti HS-.658 m t S--,22 MHC3t HS4- * 658 cmt S4--,18 n6oht NAS MUt , , * v 674.-,658, ,674,658, Ht (ACT,). OH-,15 H4SIM 746,61 H3SI4- OeM HZSIM--, HhH3SIM 141 H3B H2BO3-,2 H2C HW C3-. H2S,OO Hs-, S--. WS4. HSM- 1.9 sob- HF F- OX4 CL- 244 e 71 Ndt 1576e95 Kt 197 * 45 c4tt IONIC STRElTH =.7597 IOWIC BAWWX :..OOo. OtOo. O B O o. O.Oo *.Ooo o n.ooq... OIOOO, o.oo..ooo O+OO -2,654, -13, , , o*oo.,ooo * o.oo,.. odc4 o m o.oo CHEMICAL GEOTHERHOMETERS LGREES C OUARTZ 246,4 CHALCEDfflY 999,9 MK 22e9 M w- 99,399 TEOR, WC. -11,526-11,242-2.m -2*11 2, , ,19-68, SA22-2, %
153 m orkustofnun LOG DISTRIBUTIW CmFICIENTS WZ =-2*49 w2s. 6AS SOLUBILITY RLTIKYIffi FKTOR 1. WP UATER (PPI) SI w2 I H2s II Hz ca M IG,94 CHI SM 3.25 NZ CL 2912,46 NH3 F * DISSnS,,OO AL.94 B 44,1563 FE.oOoQ DEEP STEM P m n m2 149)6*91. m.,4 Hz 73.35, 2,, CHI 3.21, )M3. ACTIVITY UlEFFICIWTS In DEEP WTER Ht * 741 KSM- OH-.655 F- HWIM-,665 U- H?SI Mt H33-,632 Kt HC3-,665 cat t C3--,212 Ntt M3t S ffihc3t HSO4- t 674 CAM SOk-,2 MGWt NASM-.69 IM4t.69,655, ,246,289, ,78 ova2 FEtt FEttt FEOHt FE(OH)3- FE(OHM- Fmtt FE(W2t FE(OHi4- FES4t FEUtt FECLZt FEU)- CHEnItAL CMIFONENTS W I DEEP WATER (PPII WD LO6 #OLE), o.oo *.,OOo O.OO *,Ooo,oo OIOO,oo OIOOO * o.oo. o.oo,,w. o.oo o m , ,m O.Oo, o.oo. O I O O..OOO. o*oo o m o.oo


154 IYwCIlE CJMcuIwY 6OETWITE IIIIGIIETITE m-iwwtm, M I T E W T Z ZOISITE
Geochemical Modelling of Low-Temperature Geothermal Fields from Bihor County, Romania
 Proceedings World Geothermal Congress 2015 Melbourne, Australia, 19-25 April 2015 Geochemical Modelling of Low-Temperature Geothermal Fields from Bihor County, Romania Oana Stǎnǎşel, Iulian Stǎnǎşel University
GeothermEx, Inc. GEOTHERMAL RESERVOIR ASSESSMENT METHODOLOGY FOR THE SCIENTIFIC OBSERVATION HOLE PROGRAM, KILAUEA EAST RIFT ZONE, HAWAII TASK 1 REPORT
 (415) 527 9876 CABLE ADDRESS- GEOTHERMEX TELEX 709152 STEAM UD FAX (415) 527-8164 Geotherm Ex, Inc. RICHMOND. CALIFORNIA 94804-5829 GEOTHERMAL RESERVOIR ASSESSMENT METHODOLOGY FOR THE SCIENTIFIC OBSERVATION
INTERPRETATION OF INTERFERENCE EFFECTS IN THREE PRODUCTION WELLS IN THE KAWERAU GEOTHERMAL FIELD, NEW ZEALAND. Lynell Stevens and Kevin J Koorey
 PROCEEDINGS, Twenty-First Workshop on Geothermal Reservoir Engineering Stanford University, Stanford, California, January 22-24, 1996 SGP-TR-151 INTERPRETATION OF INTERFERENCE EFFECTS IN THREE PRODUCTION
Prediction of Calcite Scaling at the Oguni Geothermal Field, Japan: Chemical Modeling Approach
 Todaka et Prediction of Calcite Scaling at the Oguni Geothermal Field, Japan: Chemical Modeling Approach Norifumi Yoshiyuki Hideo and Nobuyuki Electric Power Development Co., Ltd. 6-15-1, Ginza, Chuo-ku,
Geochemical monitoring of the response ofgeothermal reservoirs to production load examples from Krafla, Iceland
 International Geothermal Conference, Reykjavík, Sept. 23 Session #7 Geochemical monitoring of the response ofgeothermal reservoirs to production load examples from Krafla, Iceland Stefán Arnórsson 1 and
PERFORMANCE EVALUATION OF DEEPENED WELLS 420DA AND 517DA IN THE LEYTE GEOTHERMAL PRODUCTION FIELD, PHILIPPINES
 PROCEEDINGS, Thirty-Eighth Workshop on Geothermal Reservoir Engineering Stanford University, Stanford, California, February 11-13, 213 SGP-TR-198 PERFORMANCE EVALUATION OF DEEPENED WELLS 42DA AND 517DA
RESERVOIR CHANGES DURING EIGHTEEN YEARS OF EXPLOITATION IN THE MIRAVALLES GEOTHERMAL FIELD, COSTA RICA
 Presented at Short Course V on Conceptual Modelling of Geothermal Systems, organized by UNU-GTP and LaGeo, in Santa Tecla, El Salvador, February 24 - March 2, 2013. GEOTHERMAL TRAINING PROGRAMME LaGeo
Enhancement of Silica-Enthalpy Mixing Model to Predict Enthalpy of Geothermal Reservoir
 PROCEEDINGS, 42nd Workshop on Geothermal Reservoir Engineering Stanford University, Stanford, California, February 13-15, 2017 SGP-TR-212 Enhancement of Silica-Enthalpy Mixing Model to Predict Enthalpy
Chapter 13. Groundwater
 Chapter 13 Groundwater Introduction Groundwater is all subsurface water that completely fills the pores and other open spaces in rocks, sediments, and soil. Groundwater is responsible for forming beautiful
GEOTHERMAL BOREHOLE INVESTIGATIONS DURING AND AFTER DRILLING
 Presented at Workshop for Decision Makers on Geothermal Projects in Central America, organized by UNU-GTP and LaGeo in San Salvador, El Salvador, 26 November to 2 December 2006. GEOTHERMAL BOREHOLE INVESTIGATIONS
CALCITE INHIBITION IN THE AHUACHAPAN GEOTHERMAL FIELD, EL SALVADOR
 Presented at Short Course on Geothermal Development and Geothermal Wells, organized by UNU-GTP and LaGeo, in Santa Tecla, El Salvador, March 11-17, 2012. GEOTHERMAL TRAINING PROGRAMME LaGeo S.A. de C.V.
Determination of Calcite Scaling Potential in OW-903 and OW-914 of the Olkaria Domes field, Kenya
 PROCEEDINGS, Fortieth Workshop on Geothermal Reservoir Engineering Stanford University, Stanford, California, January 26-28, 2015 SGP-TR-204 Determination of Calcite Scaling Potential in OW-903 and OW-914
AN EXPERIMENTAL INVESTIGATION OF BOILING HEAT CONVECTION WITH RADIAL FLOW IN A FRACTURE
 PROCEEDINGS, Twenty-Fourth Workshop on Geothermal Reservoir Engineering Stanford University, Stanford, California, January 25-27, 1999 SGP-TR-162 AN EXPERIMENTAL INVESTIGATION OF BOILING HEAT CONVECTION
Iceland Water Chemistry Group presents the chemical speciation program WATCH
 Iceland Water Chemistry Group presents the chemical speciation program WATCH The computer program WATCH is mainly intended to serve as a tool for interpreting the chemical composition of geothermal fluids,
Geochemical Characteristics of Reservoir Fluid from NW-Sabalan Geothermal Field, Iran
 Proceedings World Geothermal Congress 2010 Bali, Indonesia, 25-29 April 2010 Geochemical Characteristics of Reservoir Fluid from NW-Sabalan Geothermal Field, Iran Svetlana Strelbitskaya and Behnam Radmehr
Rotary Drilling Rotary Drilling Bits
 GE 343 SUBSURFACE EXPLORATION CH 8 Rock Drilling, Testing, and Sampling Text Ch. 7. Dr. Norbert H. Maerz Missouri University of Science and Technology (573) 341-6714 norbert@mst.edu Instructional Objectives
FLUID-MINERAL EQUILIBRIA AND SUBSURFACE TEMPERATURE EVALUATION OF SELECTED HOT SPRINGS, JIANGXI PROVINCE, SE-CHINA
 PROCEEDINGS, Thirty-First Workshop on Geothermal Reservoir Engineering Stanford University, Stanford, California, January 30-February 1, 2006 SGP-TR-179 FLUID-MINERAL EQUILIBRIA AND SUBSURFACE TEMPERATURE
Instructional Objectives
 GE 343 SUBSURFACE EXPLORATION CH 8 Rock Drilling, Testing, and Sampling Text Ch. 7. Dr. Norbert H. Maerz Missouri University of Science and Technology (573) 341-6714 norbert@mst.edu Instructional Objectives
OVERVIEW OF THE WAIRAKEI-TAUHARA SUBSIDENCE INVESTIGATION PROGRAM
 PROCEEDINGS, Thirty-Sixth Workshop on Geothermal Reservoir Engineering Stanford University, Stanford, California, January 31 - February 2, 2011 SGP-TR-191 OVERVIEW OF THE WAIRAKEI-TAUHARA SUBSIDENCE INVESTIGATION
Early Identification and Management of Calcite Deposition in the Ngatamariki Geothermal Field, New Zealand
 PROCEEDINGS, 42nd Workshop on Geothermal Reservoir Engineering Stanford University, Stanford, California, February 13-15, 2017 SGP-TR-212 Early Identification and Management of Calcite Deposition in the
Fluid Geochemistry at the Nir Geothermal Field, Nw-Iran
 Proceedings World Geothermal Congress 2015 Melbourne, Australia, 19-25 April 2015 Fluid Geochemistry at the Nir Geothermal Field, Nw-Iran Mohammad Reza Rahmani Renewable Energy Organization of Iran (SUNA),
Sustainable Energy Science and Engineering Center GEOTHERMAL ENERGY. Sustainable Energy Sources. Source:
 Sustainable Energy Sources GEOTHERMAL ENERGY Earth s Temperature Profile GEOTHERMAL ENERGY Plate Tectonics Earth's crust is broken into huge plates that move apart or push together at about the rate our
FLUID STRATIGRAPHY OF THE COSO GEOTHERMAL RESERVOIR
 PROCEEDINGS, Thirty-First Workshop on Geothermal Reservoir Engineering Stanford University, Stanford, California, January 30-February 1, 2006 SGP-TR-179 FLUID STRATIGRAPHY OF THE COSO GEOTHERMAL RESERVOIR
WAMUNYU EDWARD MUREITHI I13/2358/2007
 WAMUNYU EDWARD MUREITHI I13/2358/2007 Olkaria geothermal area is situated south of Lake Naivasha on the floor of the southern segment of the Kenya rift. The geology of the Olkaria Geothermal area is subdivided
HEAT TRANSFER IN A LOW ENTHALPY GEOTHERMAL WELL
 HEAT TRANSFER IN A LOW ENTHALPY GEOTHERMAL WELL Marcel Rosca University of Oradea, Armata Romana 5, RO-37 Oradea, Romania Key Words: low enthalpy, numerical modeling, wellbore heat transfer, Oradea reservoir,
Heat (& Mass) Transfer. conceptual models of heat transfer. large scale controls on fluid movement. distribution of vapor-saturated conditions
 Transfer. conceptual models of heat transfer. large scale controls on fluid movement. distribution of vapor-saturated conditions") Heat (& Mass) Transfer conceptual models of heat transfer temperature-pressure gradients large scale controls on fluid movement distribution of vapor-saturated conditions fluid flow paths surface manifestations
Heat (& Mass) Transfer conceptual models of heat transfer temperature-pressure gradients large scale controls on fluid movement distribution of vapor-saturated conditions fluid flow paths surface manifestations
Country s location
 GEOTHERMAL EXPLORATION IN BURUNDI Short course III on Exploration for Geothermal Resources organized by UNU-GTP and KenGen Naivasha, Kenya, 24th October - 17 November, 2008 Presented by HUREGE Déogratias
SEISMICITY AT THE MIRAVALLES GEOTHERMAL FIELD, COSTA RICA ( ): A TOOL TO CONFIRM THE REAL EXTENSION OF THE RESERVOIR*
: A TOOL TO CONFIRM THE REAL EXTENSION OF THE RESERVOIR*") Presented at Short Course on Surface Exploration for Geothermal Resources, organized by UNU-GTP and LaGeo, in Ahuachapan and Santa Tecla, El Salvador, 17-30 October, 2009. GEOTHERMAL TRAINING PROGRAMME
Presented at Short Course on Surface Exploration for Geothermal Resources, organized by UNU-GTP and LaGeo, in Ahuachapan and Santa Tecla, El Salvador, 17-30 October, 2009. GEOTHERMAL TRAINING PROGRAMME
 12 10 8 6 4 2 0 40-50 50-60 60-70 70-80 80-90 90-100 Fresh Water What we will cover The Hydrologic Cycle River systems Floods Groundwater Caves and Karst Topography Hot springs Distribution of water in
Interpreting Phase Diagrams
 Interpreting Phase Diagrams Understanding chemical reactions requires that we know something about how materials behave as the temperature and pressure change. For a single component (like quartz or ice)
TWO DIFFERENT ROLES OF FRACTURES IN GEOTHERMAL DEVELOPMENT
 TWO DIFFERENT ROLES OF FRACTURES IN GEOTHERMAL DEVELOPMENT Mineyuki Hanano Japan Metals & Chemicals Co., Ltd., 1-3-6 Saien, Morioka-city, Iwate 020-0024, Japan, email: hananom@jmc.co.jp Key Words: geothermal
Essentials of Geology, 11e
 Essentials of Geology, 11e Groundwater Chapter 10 Instructor Jennifer Barson Spokane Falls Community College Geology 101 Stanley Hatfield Southwestern Illinois Co Jennifer Cole Northeastern University
-344- LIQUID-DOMINATED GEOTHERMAL RESERVOIRS. Lewis Semprini and Paul Kruger Civil Engineering Department Stanford University Stanford, CA 94305
 -344- RADON TRANSECT STUDIES IN VAPOR- AND LIQUID-DOMINATED GEOTHERMAL RESERVOIRS Lewis Semprini and Paul Kruger Civil Engineering Department Stanford University Stanford, CA 94305 INTRODUCTION Radon transect
CHEMICAL GEOTHERMOMETERS FOR GEOTHERMAL EXPLORATION
 Presented at Short Course III on Exploration for Geothermal Resources, organized by UNU-GTP and KenGen, at Lake Naivasha, Kenya, October 4 - November 17, 008. GEOTHERMAL TRAINING PROGRAMME Kenya Electricity
GEOTHERMAL POTENTIAL OF ST. KITTS AND NEVIS ISLANDS
 GEOTHERMAL POTENTIAL OF ST. KITTS AND NEVIS ISLANDS By Gerald W. Huttrer Geothermal Management Company, Inc. For the Eastern Caribbean Geothermal Energy Project ( Geo- Caraibes ; G-C ) Presented Using
Geochemical Monitoring of the Lakes District Area
 Proceedings World Geothermal Congress 25 Antalya, Turkey, 24-29 April 25 Geochemical Monitoring of the Lakes District Area Kibret Beyene and Meseret Teklemariam Geological Survey of Ethiopia, P.O.Box 469,
Systems Engineering Spring Group Project #1: Process Flowsheeting Calculations for Acetic Anhydride Plant. Date: 2/25/00 Due: 3/3/00
 10.551 Systems Engineering Spring 2000 Group Project #1: Process Flowsheeting Calculations for Acetic Anhydride Plant Date: 2/25/00 Due: 3/3/00 c Paul I. Barton, 14th February 2000 At our Nowhere City
David I. Norman and Joseph N. Moore
 PROCEEDINGS, TwentyThird Workshop on Geothermal Reservoir Engineering Stanford University, Stanford, California, January 2527, 1999 SGPTR162 METHANE AND EXCESS AND Ar IN GEOTHERMAL FLUID INCLUSIONS David
Hijiori HDR Reservoir Evaluation by Micro-Earthquake Observation
 GRC Transactions, Vol. 38, 2014 Hijiori HDR Reservoir Evaluation by Micro-Earthquake Observation Hideshi Kaieda Central Research Institute of Electric Power Industry, Abiko, Chiba, Japan Keywords HDR,
Introduction to Oil&Gas Well Drilling
 Introduction to Oil&Gas Well Drilling Drilling Introduction to Oil&Gas Well Drilling The term drilling indicates the whole complex of operations necessary to construct wells of circular section applying
THE FLUID CHARACTERISTICS OF THREE EXPLORATION WELLS DRILLED AT OLKARIA-DOMES FIELD, KENYA
 PROCEEDINGS, Thirty-Third Workshop on Geothermal Reservoir Engineering Stanford University, Stanford, California, January 28-3, 28 SGP-TR-185 THE FLUID CHARACTERISTICS OF THREE EXPLORATION WELLS DRILLED
1 Earth s Oceans. TAKE A LOOK 2. Identify What are the five main oceans?
 CHAPTER 13 1 Earth s Oceans SECTION Exploring the Oceans BEFORE YOU READ After you read this section, you should be able to answer these questions: What affects the salinity of ocean water? What affects
(Refer Slide Time: 00:00:43 min) Welcome back in the last few lectures we discussed compression refrigeration systems.
 Welcome back in the last few lectures we discussed compression refrigeration systems.") Refrigeration and Air Conditioning Prof. M. Ramgopal Department of Mechanical Engineering Indian Institute of Technology, Kharagpur Lecture No. # 14 Vapour Absorption Refrigeration Systems (Refer Slide
Refrigeration and Air Conditioning Prof. M. Ramgopal Department of Mechanical Engineering Indian Institute of Technology, Kharagpur Lecture No. # 14 Vapour Absorption Refrigeration Systems (Refer Slide
Pressure Grouting of Fractured Bedrock to Control Acid Mine Drainage
 WATER RESOURCES AT RISK May 14-18, 1995 Denver American Institute of Hydrology Pressure Grouting of Fractured Bedrock to Control Acid Mine Drainage S. A. Effner, G. D. Vandersluis, and V. Straskraba Hydro-Geo
A New Method of Evaluation of Chemical Geothermometers for Calculating Reservoir Temperatures from Thermal Springs in Nevada
 GRC Transactions, Vol. 35, 211 A New Method of Evaluation of Chemical Geothermometers for Calculating Reservoir Temperatures from Thermal Springs in Nevada Lisa Shevenell 1 and Mark Coolbaugh 2 1 Nevada
PART I Hot Dry Rock Geothermal Energy: History and Potential of the Newest and Largest Renewable Energy Resource
 Contents PART I Hot Dry Rock Geothermal Energy: History and Potential of the Newest and Largest Renewable Energy Resource Chapter 1 Serendipity A Brief History of Events Leading to the Hot Dry Rock Geothermal
RESPONSE OF WAIRAKEI GEOTHERMAL RESERVOIR TO 40 YEARS OF PRODUCTION
 RESPONSE OF WAIRAKEI GEOTHERMAL RESERVOIR TO 4 YEARS OF PRODUCTION Allan Clotworthy Contact Energy Ltd, Private Bag 21, Taupo, New Zealand Key Words: geothermal, production, reinjection, reservoir, Wairakei
ADVENTURES IN WATER DEVELOPED BY LOUISVILLE WATER COMPANY
 ADVENTURES IN WATER DEVELOPED BY LOUISVILLE WATER COMPANY Tunneling for Water explains the science behind a first-of-its-kind project in the world! Louisville Water Company is the first water utility
Rate the Volcanic effects above. Justify your answer.
 Tsunami Composite The displacement of water can generate huge waves travelling up to 600kph. On reaching shallow coastal areas these rapidly grow in height and power. Floods Shield Composite Volcanic eruptions
Exploration, Drilling & Production
 Nontechnical Guide to PETMOLEUM Geology, Exploration, Drilling & Production Third Edition Norman J. Hyne, Ph.D. Contents Preface *i Introduction 1 The Nature of Gas and Oil 1 Petroleum 1 The Chemistry
An Introduction To Thermodynamics and Kinetics. for. Introduction To Petrography : GEOL 2335 University of Houston Spring Semester, 1996
 Introduction An Introduction To Thermodynamics and Kinetics for Introduction To Petrography : GEOL 2335 University of Houston Spring Semester, 1996 A rock sample contains calcite, quartz and wollastonite.
PETE 310. Lectures # 33 & # 34 Chapter 17
 PETE 310 Lectures # 33 & # 34 Chapter 17 Gas Hydrates Prediction & Control Hydrates Definition Natural gas hydrates are ice-like structures composed of water and natural gas molecules. Under favorable
Carbonates and Silica Scaling Model Applied to Hot Water Pipes for Sanitary Use at Hotel Río Perlas, Costa Rica
 PROCEEDINGS, 43rd Workshop on Geothermal Reservoir Engineering Stanford University, Stanford, California, February 12-14, 2018 SGP-TR-213 Carbonates and Silica Scaling Model Applied to Hot Water Pipes
DEVIATIONS IN SILICA GEOTHERMOMETRY AT WAIRAKEI. Brian Lovelock
 DEVIATIONS IN SILICA GEOTHERMOMETRY AT WAIRAKEI Brian Lovelock Electricity Corporation of New Zealand Wairakei Power Station, Private Bag 2001, Taupo, New Zealand keywords: Wairakei, silica, quartz, geothermometer
Calcite Scale Inhibition: The Case of Mahanagdong Wells in Leyte Geothermal Production Field, Philippines
 0 300 KILM ET ER S Proceedings World Geothermal Congress 05 Antalya, Turkey, 24-29 April 05 Calcite Scale Inhibition: The Case of Mahanagdong Wells in Leyte Geothermal Production Field, Philippines Farrell
Numerical Simulation of Devolution and Evolution of Steam-Water Two-Phase Zone in a Fractured Geothermal Reservoir at Ogiri, Japan
 GRC Transactions, Vol. 37, 2013 Numerical Simulation of Devolution and Evolution of Steam-Water Two-Phase Zone in a Fractured Geothermal Reservoir at Ogiri, Japan Yohei Tateishi 1, Ryuichi Itoi 1, Toshiaki
EXPERIMENT: LIMITING REAGENT. NOTE: Students should have moles of reactants in DATASHEET converted into masses in grams prior to the lab period.
 Revised 12/2015 EXPERIMENT: LIMITING REAGENT Chem 1104 Lab NOTE: Students should have moles of reactants in DATASHEET converted into masses in grams prior to the lab period. INTRODUCTION Limiting reactant
Opportunities for Geothermal Development Created by New Technologies S2-1-2
 Opportunities for Geothermal Development Created by New Technologies S2-1-2 Geothermal Academy Masami Nakagawa Director of Geothermal Academy Fulbright Energy Specialist CSM/NREL Joint Appointee Department
Well Construction and Cementing Practices in Shale and Salt Water Disposal Wells
 Well Construction and Cementing Practices in Shale and Salt Water Disposal Wells 2017 Shale Network Workshop Roger Myers, President RRM Completions, LLC 1 Agenda Well Construction Importance and Examples
GEOTHERMAL EXPLORATION
 GEOTHERMAL EXPLORATION IN BURUNDI Country s location Burundi is a landlocked country in Central Africa, Its area is 27834 km², It is boarded with RDC in the West, Rwanda in the North and Tanzania in the
Presented at ASEAN Geothermal Workshop Bandung, Indonesia 1 May 1984
 Presented at ASEAN Geothermal Workshop Bandung, Indonesia 1 May 1984 DRILLING AND TESTING GEOTHERMAL WELLS IN AN ACTIVE VOLCANIC DOMAIN, PUNA GEOTHERMAL FIELD, HAW An, USA W.L. D'Olier, Vice President
TEMPERATURE GEOTHERMAL SYSTEM *.BY. Roger F. Harrison Salt Lake City, Utah. C; K. Blair
 - * f c * -6 9 -.I. lcal '. DEVELOPMENT AND TESTSNG OF A SMALL MODERATE TEMPERATURE GEOTHERMAL SYSTEM *.BY Roger F. Harrison Terra Tek, Inc. Salt Lake City, Utah C; K. Blair Terra Tek, Inc. - Salt Lake
Module 1 : Site Exploration and Geotechnical Investigation
 Objectives In this section you will learn the following Displacement borings Wash boring Auger boring Rotary drilling Percussion drilling Continuous sampling Boring methods of exploration The boring methods
Lecture 13 More Surface Reactions on Mineral Surfaces. & Intro to Soil Formation and Chemistry
 Lecture 13 More Surface Reactions on Mineral Surfaces & Intro to Soil Formation and Chemistry 3. charge transfer (e.g., ligand/donor sorption): Sorption involves a number of related processes that all
Lecture 6 - Igneous Rocks and Volcanoes
 Lecture 6 - Igneous Rocks and Volcanoes Learning objectives Understand and be able to predict where and why magma will be forming at different tectonic settings Understand the factors controlling magma
EVALUATING HEAT FLOW AS A TOOL FOR ASSESSING GEOTHERMAL RESOURCES
 PROCEEDINGS, Thirtieth Workshop on Geothermal Reservoir Engineering Stanford University, Stanford, California, January 31-February 2, 2005 SGP-TR-176 EVALUATING HEAT FLOW AS A TOOL FOR ASSESSING GEOTHERMAL
Exploration Results in the Tendaho Geothermal Field, Ethiopia
 Proceedings World Geothermal Congress 2005 Antalya, Turkey, 24-29 April 2005 Exploration Results in the Tendaho Geothermal Field, Ethiopia Yiheyis Amdeberhan Geological Survey of Ethiopia, P.O.Boxx 24370,
Groundwater. (x 1000 km 3 /y) Oceans Cover >70% of Surface. Groundwater and the. Hydrologic Cycle
 Oceans Cover >70% of Surface. Groundwater and the. Hydrologic Cycle") Chapter 17 Oceans Cover >70% of Surface Groundwater and the Hydrologic Cycle Vasey s Paradise, GCNP Oceans are only 0.025% of Mass Groundwater Groundwater is liquid water that lies in the subsurface in
Chapter 17 Oceans Cover >70% of Surface Groundwater and the Hydrologic Cycle Vasey s Paradise, GCNP Oceans are only 0.025% of Mass Groundwater Groundwater is liquid water that lies in the subsurface in
The Initial-State Geochemistry as a Baseline for Geochemical Monitoring at Ulubelu Geothermal Field, Indonesia
 Proceedings World Geothermal Congress 2015 Melbourne, Australia, 19-25 April 2015 The Initial-State Geochemistry as a Baseline for Geochemical Monitoring at Ulubelu Geothermal Field, Indonesia Mulyanto,
NUMERICAL MODELING STUDY OF SIBAYAK GEOTHERMAL RESERVOIR, NORTH SUMATRA, INDONESIA
 PROCEEDINGS, Twenty-Sixth Workshop on Geothermal Reservoir Engineering Stanford University, Stanford, California, January 29-31, 21 SGP-TR-168 NUMERICAL MODELING STUDY OF SIBAYAK GEOTHERMAL RESERVOIR,
Franco D'Amore,Claudio Calore and Romano Celati. Istituto Internazionale per le Ricerche Geotermiche (CNR) Via del Buongusto 1, Pisa, Italy
 Via del Buongusto 1, Pisa, Italy") Proceedings Seventh Workshop Geothermal Reservoir Engineering Stanford, December 1981. SGP-TR-55. T W W WOLUTON OF THE COMPOSTON OF THE FLUD FRO4 SERRAZZANO ZONE (LARDERELLO) Franco D'Amore,Claudio Calore
Proceedings Seventh Workshop Geothermal Reservoir Engineering Stanford, December 1981. SGP-TR-55. T W W WOLUTON OF THE COMPOSTON OF THE FLUD FRO4 SERRAZZANO ZONE (LARDERELLO) Franco D'Amore,Claudio Calore
Earth Science, 10e. Edward J. Tarbuck & Frederick K. Lutgens
 Earth Science, 10e Edward J. Tarbuck & Frederick K. Lutgens Weathering, Soil, and Mass Wasting Chapter 3 Earth Science, 10e Stan Hatfield and Ken Pinzke Southwestern Illinois College Earth's external processes
6.1 Water. The Water Cycle
 6.1 Water The Water Cycle Water constantly moves among the oceans, the atmosphere, the solid Earth, and the biosphere. This unending circulation of Earth s water supply is the water cycle. The Water Cycle
Name Class Date. In your textbook, read about the nature of igneous rocks. Use each of the terms below just once to complete the following statements.
 CHAPTER 5 Igneous Rocks SECTION 5.1 What are igneous rocks? In your textbook, read about the nature of igneous rocks. Use each of the terms below just once to complete the following statements. basaltic
Prentice Hall EARTH SCIENCE
 Prentice Hall EARTH SCIENCE Tarbuck Lutgens Running Water and Groundwater Running Water The Water Cycle Water constantly moves among the oceans, the atmosphere, the solid Earth, and the biosphere. This
A Brief Guide to Geothermal Wells
 A Brief Guide to Geothermal Wells Key Features, Fundamental Differences Ralph Winmill Senior Drilling Engineer, Contact Energy 21 June 2011 WHO ARE CONTACT ENERGY? Publically-Listed New Zealand Energy
The Cycling of Matter. Day 1
 The Cycling of Matter Day 1 Objective I will learn the rock cycle is the series of processes in which rock changes from one form to another. I will learn in the water cycle, water condenses, precipitates
The Role of Magnetotellurics in Geothermal Exploration
 The Role of Magnetotellurics in Geothermal Exploration Adele Manzella CNR - Via Moruzzi 1 56124 PISA, Italy manzella@igg.cnr.it Foreword MT is one of the most used geophysical methods for geothermal exploration.
Kizito Maloba Opondo. Kenya Electricity Generating Company
 MIXING TRENDS AND SOLUTE GEOTHERMOMETRY OF BOREHOLE WATERS FROM THE PAKA GEOTHERMAL PROSPECT, KENYA. Kizito Maloba Opondo Kenya Electricity Generating Company Geothermal Prospects and fields in Kenya -
Geophysical Surveys of The Geothermal System of The Lakes District Rift, Ethiopia
 Geophysical Surveys of The Geothermal System of The Lakes District Rift, Ethiopia By: Befekadu Oluma By: Geophysics Department Geological Survey of Ethiopia The formation of the rift was preceded by a
Structural Controls on the Chemistry and Output of the Wells in the Olkaria Geothermal Field, Kenya
 Proceedings 5 th African Rift geothermal Conference Arusha, Tanzania, 29-31 October 2014 Structural Controls on the Chemistry and Output of the Wells in the Olkaria Geothermal Field, Kenya (Wamalwa, R.N.)
Experimenting with Deflagration for Stimulating Geothermal Wells
 Proceedings World Geothermal Congress 2015 Melbourne, Australia, 19-25 April 2015 Experimenting with Deflagration for Stimulating Geothermal Wells Omar Sigurdsson HS Orka hf. Brekkustigur 36, IS-260 Reykjanesbaer,
IN THE EAST MESA FIELD, IMPERIAL VALLEY, CALIFORNIA
 UTILIZATION OF GRAVIMETRIC DATA FOR ESTIMATION OF HYDROTHERMAL RESERVOIR CHARACTERISTICS IN THE EAST MESA FIELD, IMPERIAL VALLEY, CALIFORNIA 1 Tsvi Meidav,' Russell James,' and Subir Sanyal This paper
Changes in properties and states of matter provide evidence of the atomic theory of matter
 Science 8: Matter and Energy (1) Changes in properties and states of matter provide evidence of the atomic theory of matter Properties of objects and states of matter can change chemically and/or physically
HIGH TEMPERATURE HYDROTHERMAL ALTERATION IN ACTIVE GEOTHERMAL SYSTEMS A CASE STUDY OF OLKARIA DOMES
 Proceedings, 6 th African Rift Geothermal Conference Addis Ababa, Ethiopia, 2 nd 4 th November 2016 HIGH TEMPERATURE HYDROTHERMAL ALTERATION IN ACTIVE GEOTHERMAL SYSTEMS A CASE STUDY OF OLKARIA DOMES James
Chemistry 20 Lesson 17 Solubility
 Chemistry 20 Lesson 17 Solubility The ability of one compound to dissolve in another compound is called solubility. The term solubility can be used in two senses, qualitatively and quantitatively. Qualitatively,
Seismic Guided Drilling: Near Real Time 3D Updating of Subsurface Images and Pore Pressure Model
 IPTC 16575 Seismic Guided Drilling: Near Real Time 3D Updating of Subsurface Images and Pore Pressure Model Chuck Peng, John Dai and Sherman Yang, Schlumberger WesternGeco Copyright 2013, International
Concepts and Challenges Physical Science. New York Intermediate Level Science Core Curriculum
 Concepts and Challenges Physical Science correlated to New York Intermediate Level Science Core Curriculum TE/PE: Teacher s Edition/Pupil s Edition TRB: Teacher s Resource Book LP: Laboratory Program RW:
Oil and Gas Production and Exploration, Part I
 Oil and Gas Production and Exploration, Part I Presented by: Steven Marzuola American Translators Association 52 nd Annual Conference Boston, October 26, 2011 1 Introduction Dope, Joints, Tripping Internal
MUDLOGGING, CORING, AND CASED HOLE LOGGING BASICS COPYRIGHT. Coring Operations Basics. By the end of this lesson, you will be able to:
 LEARNING OBJECTIVES MUDLOGGING, CORING, AND CASED HOLE LOGGING BASICS Coring Operations Basics By the end of this lesson, you will be able to: Understand why cores are justified and who needs core data
CH2356 Energy Engineering Geothermal Energy. Dr. M. Subramanian
 CH2356 Energy Engineering Geothermal Energy Dr. M. Subramanian Associate Professor Department of Chemical Engineering Sri Sivasubramaniya Nadar College of Engineering Kalavakkam 603 110, Kanchipuram(Dist)
KISS Resources for NSW Syllabuses & Australian Curriculum.
 Discusssion / Activity 1 Structure of the Earth Student Name... 1. Outline how we think the Sun & planets formed. The solar system formed from a cloud of gas & dust. Part of the cloud collapsed under gravity
ASSESSMENT OF WELL TESTS IN SALAVATLI-SULTANHISAR GEOTHERMAL FIELD OF TURKEY
 PROCEEDINGS, Thirty-First Workshop on Geothermal Reservoir Engineering Stanford University, Stanford, California, January 3-February 1, 26 SGP-TR-179 ASSESSMENT OF WELL TESTS IN SALAVATLI-SULTANHISAR GEOTHERMAL
Fukien Secondary School Monthly Vocabulary/Expression List for EMI Subjects Secondary Two. Subject: Geography
 Focus: General Specific : Section Two : Unit One 1 Landslide 2 Downslope movement 3 Rock 4 Soil 5 Gravity 6 Natural hazard 7 Rainwater 8 Friction 9 Hilly relief 10 Unstable 11 Season 12 Saturated 13 Construction
Weathering, Soil, and Mass Movements
 Tarbuck Lutgens Weathering, Soil, and Mass Movements 5.1 Weathering Mechanical Weathering Mechanical weathering occurs when physical forces break rock into smaller and smaller pieces without changing the
EARTH SCIENCE 11 CHAPTER 9 NOTES WATER MOVING UNDERGROUND
 EARTH SCIENCE 11 CHAPTER 9 NOTES WATER MOVING UNDERGROUND KEY A. ALL THE WORLD S WATER 1. The world has an estimated one and one third thousand million cubic kilometers of water. 2. The earth s water is
GEOTHERMAL SYSTEMS AND TECHNOLOGIES 3. GEOTHERMAL RESERVOIR ENGINEERING
 1 GEOTHERMAL SYSTEMS AND TECHNOLOGIES 3. GEOTHERMAL RESERVOIR ENGINEERING 2 3. GEOTHERMAL RESERVOIR ENGINEERING 3.1. EXPLORATION OF GEOTHERMAL RESOURCES Explorationis a significant step in the process
MIXTURES, COMPOUNDS, & SOLUTIONS
 MIXTURES, COMPOUNDS, & SOLUTIONS As with elements, few compounds are found pure in nature and usually found as mixtures with other compounds. A mixture is a combination of two or more substances that are
MULTICOMPONENT EQUILIBRIUM MODELS FOR TESTING GEOTHERMOMETRY APPROACHES
 PROCEEDINGS, Thirty-Eighth Workshop on Geothermal Reservoir Engineering Stanford University, Stanford, California, February -3, 203 SGP-TR-98 MULTICOMPONENT EQUILIBRIUM MODELS FOR TESTING GEOTHERMOMETRY
SCALING PROBLEMS RECORDED AT GEOTHERMAL WELLS FROM BORS AND SACUIENI, ROMANIA. Oana Ludovic Gilau**, Alina Vasilica Merca*
 PROCEEDINGS, Twenty-Fifth Workshop on Geothermal Reservoir Engineering Stanford University, Stanford, California, January 24-26, 2000 SGP-TR-165 SCALING PROBLEMS RECORDED AT GEOTHERMAL WELLS FROM BORS