Stat 231 Final Exam Fall 2013 Slightly Edited Version
|
|
|
- Ashley Montgomery
- 6 years ago
- Views:
Transcription
1 Stat 31 Final Exam Fall 013 Slightly Edited Version I have neither given nor received unauthorized assistance on this exam. Name Signed Date Name Printed 1
2 1. An IE 361 project group studied the operation of a cut-off machine for cutting 304 stainless steel tubing. The value of y the number of tubes cut before failure of a carbide cutting insert was recorded for several inserts at each of 4 feed rates. The counts and some summary statistics are: Feed Rate #1 Feed Rate # Feed Rate #3 Feed Rate #4 15, 19, , 130, , 183, , 187, 04 y y y y s1 11. s 5. s s Initially, consider ONLY the information about Feed Rate #1, and assume that number-ofcuts for this feed rate is approximately normally distributed. a) Give two-sided 95% confidence limits for the standard deviation of number of tubes cut by an insert at Feed Rate #1. (Plug in completely, but you need not simplify.) b) Give two-sided 95% confidence limits for the mean number of tubes cut by an insert at Feed Rate #1. (Plug in completely, but you need not simplify.) c) Give endpoints of a two-sided interval that you are 95% sure will contain the number of tubes cut by one of these inserts at Feed Rate #1 tomorrow. (Plug in completely, but you need not simplify.)

3 Now consider the results from ALL of Feed Rates #1 through #4. d) For y number of tubes cut by insert j at feed rate i, below is a normal plot of all 1 values ij yij yi / spooled 3. Say what it indicates to you about the appropriateness of analyzing these experimental results based on the one-way normal model. Regardless of how you answered d) proceed under the assumptions of the one way normal model. e) Give an estimate of the standard deviation of the number of tubes cut by an insert for any single Feed Rate. (A single number will suffice here. You need not make confidence limits.) f) Use your answer to e) and give a lower 95% confidence limit for the difference in mean cuts made by an insert under Feed Rates #4 and #1, 4 1. (Plug in completely, but you need not simplify.) 3
4 As it turns out, in this problem SSTr and the sample variance of all 1 values y ij is s g) Give the value of an F statistic for testing H: along with its associated degrees of freedom. F df, h) The following is a non-standard question (not an application of standard formulas for the r -sample problem) and will require thinking from basics: One might wish to make a prediction interval for the difference between a new value of y for Feed Rate #4 and one for Feed Rate #1, say y4new y1new. That can be done if one can find a "standard error" for y4new y1new y4 y1 What is the variance of this random variable? (Your answer should be some multiple of.) How would you estimate the corresponding standard deviation? (This answer should be a number.) Variance: Estimate of corresponding standard deviation (a standard error): f x 4x for. A continuous random variable, X, taking values between 0 and 1 has pdf 3 0 x 1. a) Evaluate EX and.5 P X. EX P X.5 4
5 b) The distribution in a) is one that might be used in project management analysis, and for X1 and X independent random variables with this distribution, the sum X1 X might represent the total time required to complete a "two-task" project. Set up completely (but do not evaluate) a P X X x, x double integral giving. (Hint: Begin by making a picture of the part of the plane involved here.) c) Suppose in the project management context mentioned in b) variables X1, X,, X36 are times required to complete 36 tasks and are modeled as independent variables with a common marginal distribution with mean.7 and standard deviation.1. Approximate the probability that the total time required to complete the 36 tasks exceeds (Hint: What is the event of interest in terms of X?) 3. Suppose that a Poisson distribution is a sensible model for the number of nuggets of a particular size found processing a given amount of gravel at a gold mining site. a) At one gold mine, nuggets are found at a rate of about 1 per 100 tons of processed gravel (so that, for example, the mean number found in 300 tons of material is 3.0). On a particular day 300 tons of gravel are processed. Evaluate the probability that at least nuggets are found. 5
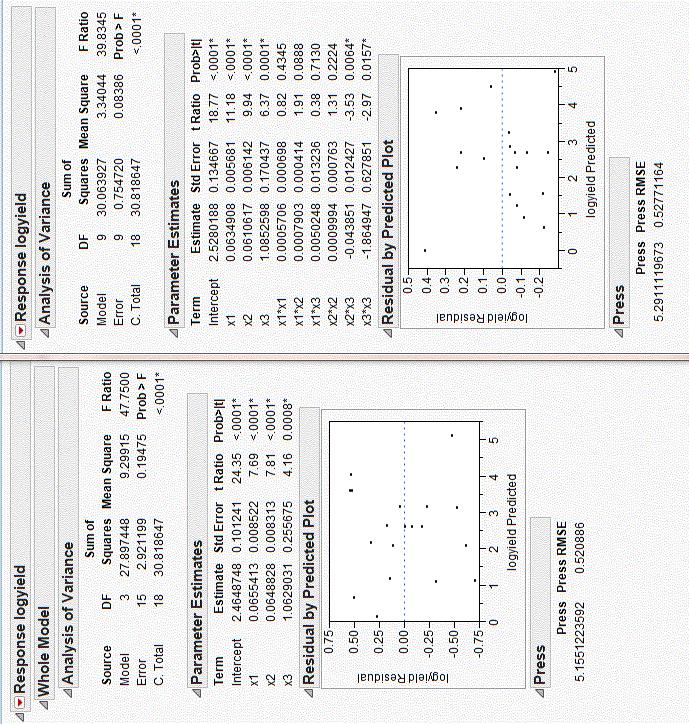
6 b) 300 tons are processed at the mine in a) every day beginning on January 1. Use your answer to a) and find the probability that among the first 5 days of the year no day produces at least nuggets. (If you could not do part a) you may use the incorrect answer.7 in place of a value from a).) c) At a mine different from the one referred to in parts a) and b) n 400 runs of (100 tons of) gravel produce 40 runs without nuggets of the size of interest. Give -sided 95% confidence limits for the fraction of all runs at this site that that would fail to have nuggets of the size of interest. Then translate those limits to limits for the mean number of nuggets in runs of this size at this mine. Limits for the long run fraction of runs with no nuggets: Limits for the mean number of nuggets per run: 4. At the end of this exam are some JMP reports for some regression analyses of data of Lee, Posarac, and Ellis (from "An Experimental Investigation of Biodiesel Synthesis from Waste Canola Oil Using Supercritical Methanol," 01, Fuel, Vol. 91, pp ) These data were collected in an experimental study of how x1 processing time (minutes 30) x processing temperature ( C ) x3 methanol/oil weight ratio ratio 1.5 affect y ln y ln % yield of methyl ester in the processing of waste canola oil. Use these JMP reports as you answer the remaining questions on this exam. 6
7 a) Give fractions of raw variability in y accounted for, using first x alone, and then the pair, 3 x x as predictors. Fraction explained using x alone: Fraction explained using both x and x 3 in a single model: There is a Fit Y by X output for inference based on the model y 0 1x1 included in the JMP reports. Use it as you answer the questions b) and c). b) Give 95% confidence limits for the increase in mean log percent yield that accompanies a 5 minute increase in processing time. c) Give 95% prediction limits for the next log percent yield for a 30 minute processing time. (MAKE SURE YOUR ANSWER MAKES SENSE in comparison to y values in the data.) There are two Fit Model reports included in the JMP reports. Use them as appropriate as you answer the questions d) through f). 7

8 d) The model y 0 1x1 x 3x3 is one fit to the data. For this model consider prediction of y for x1 0, x 0, and x3 0. As it turns out, for this set of conditions and this model, SE.101 y. Give 95% two-sided prediction limits for y new. (Pug in completely, but you need not simplify.) e) Give the value of an F statistic and degrees of freedom for testing whether a quadratic function of x1, x, and x 3 provides a detectable improvement over a linear function of these variables as a model for y. F df.., f) What on the attached pages and in the table below suggests that there is a model "between" the linear and the full quadratic ones (with more predictors than the first and fewer than the second) that should be considered? On JMP reports: In the table: 8


9 9

10 10
Stat 231 Final Exam Fall 2011
 Stat 3 Final Exam Fall 0 I have neither given nor received unauthorized assistance on this exam. Name Signed Date Name Printed . An experiment was run to compare the fracture toughness of high purity 8%
Stat 231 Exam 2 Fall 2013
 Stat 231 Exam 2 Fall 2013 I have neither given nor received unauthorized assistance on this exam. Name Signed Date Name Printed 1 1. Some IE 361 students worked with a manufacturer on quantifying the capability
Stat 401B Exam 2 Fall 2015
 Stat 401B Exam Fall 015 I have neither given nor received unauthorized assistance on this exam. Name Signed Date Name Printed ATTENTION! Incorrect numerical answers unaccompanied by supporting reasoning
Stat 401B Final Exam Fall 2015
 Stat 401B Final Exam Fall 015 I have neither given nor received unauthorized assistance on this exam. Name Signed Date Name Printed ATTENTION! Incorrect numerical answers unaccompanied by supporting reasoning
IE 361 Exam 3 Fall I have neither given nor received unauthorized assistance on this exam.
 IE 361 Exam 3 Fall 2012 I have neither given nor received unauthorized assistance on this exam. Name Date 1 1. I wish to measure the density of a small rock. My method is to read the volume of water in
 IE 361 EXAM #3 FALL 2013 Show your work: Partial credit can only be given for incorrect answers if there is enough information to clearly see what you were trying to do. There are two additional blank
Stat 401B Exam 2 Fall 2016
 Stat 40B Eam Fall 06 I have neither given nor received unauthorized assistance on this eam. Name Signed Date Name Printed ATTENTION! Incorrect numerical answers unaccompanied by supporting reasoning will
Stat 401B Exam 2 Fall 2017
 Stat 0B Exam Fall 07 I have neither given nor received unauthorized assistance on this exam. Name Signed Date Name Printed ATTENTION! Incorrect numerical answers unaccompanied by supporting reasoning will
This exam contains 5 questions. Each question is worth 10 points. Therefore, this exam is worth 50 points.
 GROUND RULES: This exam contains 5 questions. Each question is worth 10 points. Therefore, this exam is worth 50 points. Print your name at the top of this page in the upper right hand corner. This is
MAT 2377C FINAL EXAM PRACTICE
 Department of Mathematics and Statistics University of Ottawa MAT 2377C FINAL EXAM PRACTICE 10 December 2015 Professor: Rafal Kulik Time: 180 minutes Student Number: Family Name: First Name: This is a
IE 316 Exam 1 Fall 2012
 IE 316 Exam 1 Fall 2012 I have neither given nor received unauthorized assistance on this exam. Name Signed Date Name Printed 1 20 pts 1. Here are 10 True-False questions worth 2 points each. Write (very
IE 316 Exam 1 Fall 2011
 IE 316 Exam 1 Fall 2011 I have neither given nor received unauthorized assistance on this exam. Name Signed Date Name Printed 1 1. Suppose the actual diameters x in a batch of steel cylinders are normally
1 Introduction to Minitab
 1 Introduction to Minitab Minitab is a statistical analysis software package. The software is freely available to all students and is downloadable through the Technology Tab at my.calpoly.edu. When you
Table 1: Fish Biomass data set on 26 streams
 Math 221: Multiple Regression S. K. Hyde Chapter 27 (Moore, 5th Ed.) The following data set contains observations on the fish biomass of 26 streams. The potential regressors from which we wish to explain
Chapter 10. Regression. Understandable Statistics Ninth Edition By Brase and Brase Prepared by Yixun Shi Bloomsburg University of Pennsylvania
 Chapter 10 Regression Understandable Statistics Ninth Edition By Brase and Brase Prepared by Yixun Shi Bloomsburg University of Pennsylvania Scatter Diagrams A graph in which pairs of points, (x, y), are
Stat 231 Final Exam. Consider first only the measurements made on housing number 1.
 December 16, 1997 Stat 231 Final Exam Professor Vardeman 1. The first page of printout attached to this exam summarizes some data (collected by a student group) on the diameters of holes bored in certain
Regression Analysis IV... More MLR and Model Building
 Regression Analysis IV... More MLR and Model Building This session finishes up presenting the formal methods of inference based on the MLR model and then begins discussion of "model building" (use of regression
IE 361 Exam 1 October 2004 Prof. Vardeman
 October 5, 004 IE 6 Exam Prof. Vardeman. IE 6 students Demerath, Gottschalk, Rodgers and Watson worked with a manufacturer on improving the consistency of several critical dimensions of a part. One of
Stat 328 Final Exam (Regression) Summer 2002 Professor Vardeman
 Summer 2002 Professor Vardeman") Stat Final Exam (Regression) Summer Professor Vardeman This exam concerns the analysis of 99 salary data for n = offensive backs in the NFL (This is a part of the larger data set that serves as the basis
Stat Final Exam (Regression) Summer Professor Vardeman This exam concerns the analysis of 99 salary data for n = offensive backs in the NFL (This is a part of the larger data set that serves as the basis
IE 316 Exam 1 Fall 2011
 IE 316 Exam 1 Fall 2011 I have neither given nor received unauthorized assistance on this exam. Name Signed Date Name Printed 1 1. Suppose the actual diameters x in a batch of steel cylinders are normally
Practice Problems Section Problems
 Practice Problems Section 4-4-3 4-4 4-5 4-6 4-7 4-8 4-10 Supplemental Problems 4-1 to 4-9 4-13, 14, 15, 17, 19, 0 4-3, 34, 36, 38 4-47, 49, 5, 54, 55 4-59, 60, 63 4-66, 68, 69, 70, 74 4-79, 81, 84 4-85,
Chapter 9 Inferences from Two Samples
 Chapter 9 Inferences from Two Samples 9-1 Review and Preview 9-2 Two Proportions 9-3 Two Means: Independent Samples 9-4 Two Dependent Samples (Matched Pairs) 9-5 Two Variances or Standard Deviations Review
Stat 401XV Final Exam Spring 2017
 Stat 40XV Final Exam Spring 07 I have neither given nor received unauthorized assistance on this exam. Name Signed Date Name Printed ATTENTION! Incorrect numerical answers unaccompanied by supporting reasoning
STAT 8200 Design of Experiments for Research Workers Lab 11 Due: Friday, Nov. 22, 2013
 Example: STAT 8200 Design of Experiments for Research Workers Lab 11 Due: Friday, Nov. 22, 2013 An experiment is designed to study pigment dispersion in paint. Four different methods of mixing a particular
Stat 502X Exam 1 Spring 2014
 Stat 502X Exam 1 Spring 2014 I have neither given nor received unauthorized assistance on this exam. Name Signed Date Name Printed This is a long exam consisting of 11 parts. I'll score it at 10 points
Table of z values and probabilities for the standard normal distribution. z is the first column plus the top row. Each cell shows P(X z).
.") Table of z values and probabilities for the standard normal distribution. z is the first column plus the top row. Each cell shows P(X z). For example P(X.04) =.8508. For z < 0 subtract the value from,
Table of z values and probabilities for the standard normal distribution. z is the first column plus the top row. Each cell shows P(X z). For example P(X.04) =.8508. For z < 0 subtract the value from,
Stat 401B Exam 3 Fall 2016 (Corrected Version)
") Stat 401B Exam 3 Fall 2016 (Corrected Version) I have neither given nor received unauthorized assistance on this exam. Name Signed Date Name Printed ATTENTION! Incorrect numerical answers unaccompanied
Stat 401B Exam 3 Fall 2016 (Corrected Version) I have neither given nor received unauthorized assistance on this exam. Name Signed Date Name Printed ATTENTION! Incorrect numerical answers unaccompanied
Mathematical Notation Math Introduction to Applied Statistics
 Mathematical Notation Math 113 - Introduction to Applied Statistics Name : Use Word or WordPerfect to recreate the following documents. Each article is worth 10 points and should be emailed to the instructor
Stat 401B Final Exam Fall 2016
 Stat 40B Final Exam Fall 0 I have neither given nor received unauthorized assistance on this exam. Name Signed Date Name Printed ATTENTION! Incorrect numerical answers unaccompanied by supporting reasoning
Stat 544 Final Exam. May 2, I have neither given nor received unauthorized assistance on this examination.
 Stat 544 Final Exam May, 006 I have neither given nor received unauthorized assistance on this examination. signature date 1 1. Below is a directed acyclic graph that represents a joint distribution for
9 Correlation and Regression
 9 Correlation and Regression SW, Chapter 12. Suppose we select n = 10 persons from the population of college seniors who plan to take the MCAT exam. Each takes the test, is coached, and then retakes the
Stat 602 Exam 1 Spring 2017 (corrected version)
") Stat 602 Exam Spring 207 (corrected version) I have neither given nor received unauthorized assistance on this exam. Name Signed Date Name Printed This is a very long Exam. You surely won't be able to
Stat 602 Exam Spring 207 (corrected version) I have neither given nor received unauthorized assistance on this exam. Name Signed Date Name Printed This is a very long Exam. You surely won't be able to
T.I.H.E. IT 233 Statistics and Probability: Sem. 1: 2013 ESTIMATION AND HYPOTHESIS TESTING OF TWO POPULATIONS
 ESTIMATION AND HYPOTHESIS TESTING OF TWO POPULATIONS In our work on hypothesis testing, we used the value of a sample statistic to challenge an accepted value of a population parameter. We focused only
SMA 6304 / MIT / MIT Manufacturing Systems. Lecture 10: Data and Regression Analysis. Lecturer: Prof. Duane S. Boning
 SMA 6304 / MIT 2.853 / MIT 2.854 Manufacturing Systems Lecture 10: Data and Regression Analysis Lecturer: Prof. Duane S. Boning 1 Agenda 1. Comparison of Treatments (One Variable) Analysis of Variance
STAT FINAL EXAM
 STAT101 2013 FINAL EXAM This exam is 2 hours long. It is closed book but you can use an A-4 size cheat sheet. There are 10 questions. Questions are not of equal weight. You may need a calculator for some
Stat 502X Exam 2 Spring 2014
 Stat 502X Exam 2 Spring 2014 I have neither given nor received unauthorized assistance on this exam. Name Signed Date Name Printed This exam consists of 12 parts. I'll score it at 10 points per problem/part
 IE 361 Exam 2 Spring 2011 I have neither given nor received unauthorized assistance on this exam. Name Date 1 Below are 25 True-False Questions, worth 2 points each. Write one of "T" or "F" in front of
STAT 511. Lecture : Simple linear regression Devore: Section Prof. Michael Levine. December 3, Levine STAT 511
 STAT 511 Lecture : Simple linear regression Devore: Section 12.1-12.4 Prof. Michael Levine December 3, 2018 A simple linear regression investigates the relationship between the two variables that is not
0, otherwise. U = Y 1 Y 2 Hint: Use either the method of distribution functions or a bivariate transformation. (b) Find E(U).
 Find E(U).") 1. Suppose Y U(0, 2) so that the probability density function (pdf) of Y is 1 2, 0 < y < 2 (a) Find the pdf of U = Y 4 + 1. Make sure to note the support. (c) Suppose Y 1, Y 2,..., Y n is an iid sample
1. Suppose Y U(0, 2) so that the probability density function (pdf) of Y is 1 2, 0 < y < 2 (a) Find the pdf of U = Y 4 + 1. Make sure to note the support. (c) Suppose Y 1, Y 2,..., Y n is an iid sample
Mathematical Notation Math Introduction to Applied Statistics
 Mathematical Notation Math 113 - Introduction to Applied Statistics Name : Use Word or WordPerfect to recreate the following documents. Each article is worth 10 points and can be printed and given to the
Table of z values and probabilities for the standard normal distribution. z is the first column plus the top row. Each cell shows P(X z).
.") Table of z values and probabilities for the standard normal distribution. z is the first column plus the top row. Each cell shows P(X z). For example P(X 1.04) =.8508. For z < 0 subtract the value from
Table of z values and probabilities for the standard normal distribution. z is the first column plus the top row. Each cell shows P(X z). For example P(X 1.04) =.8508. For z < 0 subtract the value from
Midterm 2 - Solutions
 Ecn 102 - Analysis of Economic Data University of California - Davis February 24, 2010 Instructor: John Parman Midterm 2 - Solutions You have until 10:20am to complete this exam. Please remember to put
Unit 10: Simple Linear Regression and Correlation
 Unit 10: Simple Linear Regression and Correlation Statistics 571: Statistical Methods Ramón V. León 6/28/2004 Unit 10 - Stat 571 - Ramón V. León 1 Introductory Remarks Regression analysis is a method for
Practice Final Examination
 Practice Final Examination Mth 136 = Sta 114 Wednesday, 2000 April 26, 2:20 3:00 pm This is a closed-book examination so please do not refer to your notes, the text, or to any other books You may use a
y ˆ i = ˆ " T u i ( i th fitted value or i th fit)
") 1 2 INFERENCE FOR MULTIPLE LINEAR REGRESSION Recall Terminology: p predictors x 1, x 2,, x p Some might be indicator variables for categorical variables) k-1 non-constant terms u 1, u 2,, u k-1 Each u
1 2 INFERENCE FOR MULTIPLE LINEAR REGRESSION Recall Terminology: p predictors x 1, x 2,, x p Some might be indicator variables for categorical variables) k-1 non-constant terms u 1, u 2,, u k-1 Each u
Outline. Remedial Measures) Extra Sums of Squares Standardized Version of the Multiple Regression Model
 Extra Sums of Squares Standardized Version of the Multiple Regression Model") Outline 1 Multiple Linear Regression (Estimation, Inference, Diagnostics and Remedial Measures) 2 Special Topics for Multiple Regression Extra Sums of Squares Standardized Version of the Multiple Regression
Outline 1 Multiple Linear Regression (Estimation, Inference, Diagnostics and Remedial Measures) 2 Special Topics for Multiple Regression Extra Sums of Squares Standardized Version of the Multiple Regression
Statistics for Business and Economics: Confidence Intervals for Proportions
 Statistics for Business and Economics: Confidence Intervals for Proportions STT 315: Section 107 Acknowledgement: I d like to thank Dr. Ashoke Sinha for allowing me to use and edit the slides. Statistical
Simple Linear Regression. Material from Devore s book (Ed 8), and Cengagebrain.com
, and Cengagebrain.com") 12 Simple Linear Regression Material from Devore s book (Ed 8), and Cengagebrain.com The Simple Linear Regression Model The simplest deterministic mathematical relationship between two variables x and
12 Simple Linear Regression Material from Devore s book (Ed 8), and Cengagebrain.com The Simple Linear Regression Model The simplest deterministic mathematical relationship between two variables x and
STAT 525 Fall Final exam. Tuesday December 14, 2010
 STAT 525 Fall 2010 Final exam Tuesday December 14, 2010 Time: 2 hours Name (please print): Show all your work and calculations. Partial credit will be given for work that is partially correct. Points will
YORK UNIVERSITY. Faculty of Science Department of Mathematics and Statistics MATH A Test #2 June 11, Solutions
 YORK UNIVERSITY Faculty of Science Department of Mathematics and Statistics MATH 2. A Test #2 June, 2 Solutions. (5 + 5 + 5 pts) The probability of a student in MATH 4 passing a test is.82. Suppose students
You may use a calculator. Translation: Show all of your work; use a calculator only to do final calculations and/or to check your work.
 GROUND RULES: Print your name at the top of this page. This is a closed-book and closed-notes exam. You may use a calculator. Translation: Show all of your work; use a calculator only to do final calculations
Page Points Score Total: 100
 Math 1130 Spring 2019 Sample Midterm 2a 2/28/19 Name (Print): Username.#: Lecturer: Rec. Instructor: Rec. Time: This exam contains 10 pages (including this cover page) and 9 problems. Check to see if any
Ph.D. Preliminary Examination Statistics June 2, 2014
 Ph.D. Preliminary Examination Statistics June, 04 NOTES:. The exam is worth 00 points.. Partial credit may be given for partial answers if possible.. There are 5 pages in this exam paper. I have neither
Practice Final Exam. December 14, 2009
 Practice Final Exam December 14, 29 1 New Material 1.1 ANOVA 1. A purication process for a chemical involves passing it, in solution, through a resin on which impurities are adsorbed. A chemical engineer
FINAL EXAM: Monday 8-10am
 ECE 30: Probabilistic Methods in Electrical and Computer Engineering Fall 016 Instructor: Prof. A. R. Reibman FINAL EXAM: Monday 8-10am Fall 016, TTh 3-4:15pm (December 1, 016) This is a closed book exam.
3 Continuous Random Variables
 Jinguo Lian Math437 Notes January 15, 016 3 Continuous Random Variables Remember that discrete random variables can take only a countable number of possible values. On the other hand, a continuous random
Stat 5102 Final Exam May 14, 2015
 Stat 5102 Final Exam May 14, 2015 Name Student ID The exam is closed book and closed notes. You may use three 8 1 11 2 sheets of paper with formulas, etc. You may also use the handouts on brand name distributions
1. If X has density. cx 3 e x ), 0 x < 0, otherwise. Find the value of c that makes f a probability density. f(x) =
, 0 x < 0, otherwise. Find the value of c that makes f a probability density. f(x) =") 1. If X has density f(x) = { cx 3 e x ), 0 x < 0, otherwise. Find the value of c that makes f a probability density. 2. Let X have density f(x) = { xe x, 0 < x < 0, otherwise. (a) Find P (X > 2). (b) Find
1. If X has density f(x) = { cx 3 e x ), 0 x < 0, otherwise. Find the value of c that makes f a probability density. 2. Let X have density f(x) = { xe x, 0 < x < 0, otherwise. (a) Find P (X > 2). (b) Find
ECO227: Term Test 2 (Solutions and Marking Procedure)
") ECO7: Term Test (Solutions and Marking Procedure) January 6, 9 Question 1 Random variables X and have the joint pdf f X, (x, y) e x y, x > and y > Determine whether or not X and are independent. [1 marks]
ECO7: Term Test (Solutions and Marking Procedure) January 6, 9 Question 1 Random variables X and have the joint pdf f X, (x, y) e x y, x > and y > Determine whether or not X and are independent. [1 marks]
Closed book and notes. 60 minutes. Cover page and four pages of exam. No calculators.
 IE 230 Seat # Closed book and notes. 60 minutes. Cover page and four pages of exam. No calculators. Score Exam #3a, Spring 2002 Schmeiser Closed book and notes. 60 minutes. 1. True or false. (for each,
Multiple Testing. Gary W. Oehlert. January 28, School of Statistics University of Minnesota
 Multiple Testing Gary W. Oehlert School of Statistics University of Minnesota January 28, 2016 Background Suppose that you had a 20-sided die. Nineteen of the sides are labeled 0 and one of the sides is
STA 4210 Practise set 2b
 STA 410 Practise set b For all significance tests, use = 0.05 significance level. S.1. A linear regression model is fit, relating fish catch (Y, in tons) to the number of vessels (X 1 ) and fishing pressure
Data Analysis: Agonistic Display in Betta splendens I. Betta splendens Research: Parametric or Non-parametric Data?
 Data Analysis: Agonistic Display in Betta splendens By Joanna Weremjiwicz, Simeon Yurek, and Dana Krempels Once you have collected data with your ethogram, you are ready to analyze that data to see whether
Inference with Simple Regression
 1 Introduction Inference with Simple Regression Alan B. Gelder 06E:071, The University of Iowa 1 Moving to infinite means: In this course we have seen one-mean problems, twomean problems, and problems
Model Estimation Example
 Ronald H. Heck 1 EDEP 606: Multivariate Methods (S2013) April 7, 2013 Model Estimation Example As we have moved through the course this semester, we have encountered the concept of model estimation. Discussions
MEEM Design of Experiments Final Take-home Exam
 MEEM 5990 - Design of Experiments Final Take-home Exam Assigned: April 19, 2005 Due: April 29, 2005 Problem #1 The results of a replicated 2 4 factorial experiment are shown in the table below: Test X
Unit 6 - Introduction to linear regression
 Unit 6 - Introduction to linear regression Suggested reading: OpenIntro Statistics, Chapter 7 Suggested exercises: Part 1 - Relationship between two numerical variables: 7.7, 7.9, 7.11, 7.13, 7.15, 7.25,
TABLES AND FORMULAS FOR MOORE Basic Practice of Statistics
 TABLES AND FORMULAS FOR MOORE Basic Practice of Statistics Exploring Data: Distributions Look for overall pattern (shape, center, spread) and deviations (outliers). Mean (use a calculator): x = x 1 + x
Confidence Intervals. Confidence interval for sample mean. Confidence interval for sample mean. Confidence interval for sample mean
 Confidence Intervals Confidence interval for sample mean The CLT tells us: as the sample size n increases, the sample mean is approximately Normal with mean and standard deviation Thus, we have a standard
Basic Business Statistics 6 th Edition
 Basic Business Statistics 6 th Edition Chapter 12 Simple Linear Regression Learning Objectives In this chapter, you learn: How to use regression analysis to predict the value of a dependent variable based
STAT 526 Spring Final Exam. Thursday May 5, 2011
 STAT 526 Spring 2011 Final Exam Thursday May 5, 2011 Time: 2 hours Name (please print): Show all your work and calculations. Partial credit will be given for work that is partially correct. Points will
Agonistic Display in Betta splendens: Data Analysis I. Betta splendens Research: Parametric or Non-parametric Data?
 Agonistic Display in Betta splendens: Data Analysis By Joanna Weremjiwicz, Simeon Yurek, and Dana Krempels Once you have collected data with your ethogram, you are ready to analyze that data to see whether
Continuous Improvement Toolkit. Probability Distributions. Continuous Improvement Toolkit.
 Continuous Improvement Toolkit Probability Distributions The Continuous Improvement Map Managing Risk FMEA Understanding Performance** Check Sheets Data Collection PDPC RAID Log* Risk Analysis* Benchmarking***
CHAPTER 4 Analysis of Variance. One-way ANOVA Two-way ANOVA i) Two way ANOVA without replication ii) Two way ANOVA with replication
 Two way ANOVA without replication ii) Two way ANOVA with replication") CHAPTER 4 Analysis of Variance One-way ANOVA Two-way ANOVA i) Two way ANOVA without replication ii) Two way ANOVA with replication 1 Introduction In this chapter, expand the idea of hypothesis tests. We
CHAPTER 4 Analysis of Variance One-way ANOVA Two-way ANOVA i) Two way ANOVA without replication ii) Two way ANOVA with replication 1 Introduction In this chapter, expand the idea of hypothesis tests. We
Chapter 3. Discrete Random Variables and Their Probability Distributions
 Chapter 3. Discrete Random Variables and Their Probability Distributions 1 3.4-3 The Binomial random variable The Binomial random variable is related to binomial experiments (Def 3.6) 1. The experiment
STA2601. Tutorial Letter 104/1/2014. Applied Statistics II. Semester 1. Department of Statistics STA2601/104/1/2014 TRIAL EXAMINATION PAPER
 STA2601/104/1/2014 Tutorial Letter 104/1/2014 Applied Statistics II STA2601 Semester 1 Department of Statistics TRIAL EXAMINATION PAPER BAR CODE Learn without limits. university of south africa Dear Student
The following formulas related to this topic are provided on the formula sheet:
 Student Notes Prep Session Topic: Exploring Content The AP Statistics topic outline contains a long list of items in the category titled Exploring Data. Section D topics will be reviewed in this session.
Correlation and Regression
 Correlation and Regression October 25, 2017 STAT 151 Class 9 Slide 1 Outline of Topics 1 Associations 2 Scatter plot 3 Correlation 4 Regression 5 Testing and estimation 6 Goodness-of-fit STAT 151 Class
Lecture Slides. Elementary Statistics Tenth Edition. by Mario F. Triola. and the Triola Statistics Series. Slide 1
 Lecture Slides Elementary Statistics Tenth Edition and the Triola Statistics Series by Mario F. Triola Slide 1 Chapter 10 Correlation and Regression 10-1 Overview 10-2 Correlation 10-3 Regression 10-4
This exam contains 6 questions. The questions are of equal weight. Print your name at the top of this page in the upper right hand corner.
 GROUND RULES: This exam contains 6 questions. The questions are of equal weight. Print your name at the top of this page in the upper right hand corner. This exam is closed book and closed notes. Show
First Year Examination Department of Statistics, University of Florida
 First Year Examination Department of Statistics, University of Florida May 6, 2011, 8:00 am - 12:00 noon Instructions: 1. You have four hours to answer questions in this examination. 2. You must show your
Section 4.6 Simple Linear Regression
 Section 4.6 Simple Linear Regression Objectives ˆ Basic philosophy of SLR and the regression assumptions ˆ Point & interval estimation of the model parameters, and how to make predictions ˆ Point and interval
Categorical Predictor Variables
 Categorical Predictor Variables We often wish to use categorical (or qualitative) variables as covariates in a regression model. For binary variables (taking on only 2 values, e.g. sex), it is relatively
Exam 3, Math Fall 2016 October 19, 2016
 Exam 3, Math 500- Fall 06 October 9, 06 This is a 50-minute exam. You may use your textbook, as well as a calculator, but your work must be completely yours. The exam is made of 5 questions in 5 pages,
Confidence intervals CE 311S
 CE 311S PREVIEW OF STATISTICS The first part of the class was about probability. P(H) = 0.5 P(T) = 0.5 HTTHHTTTTHHTHTHH If we know how a random process works, what will we see in the field? Preview of
STAB57: Quiz-1 Tutorial 1 (Show your work clearly) 1. random variable X has a continuous distribution for which the p.d.f.
 1. random variable X has a continuous distribution for which the p.d.f.") STAB57: Quiz-1 Tutorial 1 1. random variable X has a continuous distribution for which the p.d.f. is as follows: { kx 2.5 0 < x < 1 f(x) = 0 otherwise where k > 0 is a constant. (a) (4 points) Determine
STAB57: Quiz-1 Tutorial 1 1. random variable X has a continuous distribution for which the p.d.f. is as follows: { kx 2.5 0 < x < 1 f(x) = 0 otherwise where k > 0 is a constant. (a) (4 points) Determine
401 Review. 6. Power analysis for one/two-sample hypothesis tests and for correlation analysis.
 401 Review Major topics of the course 1. Univariate analysis 2. Bivariate analysis 3. Simple linear regression 4. Linear algebra 5. Multiple regression analysis Major analysis methods 1. Graphical analysis
Statistics for Managers using Microsoft Excel 6 th Edition
 Statistics for Managers using Microsoft Excel 6 th Edition Chapter 13 Simple Linear Regression 13-1 Learning Objectives In this chapter, you learn: How to use regression analysis to predict the value of
FINAL EXAM: 3:30-5:30pm
 ECE 30: Probabilistic Methods in Electrical and Computer Engineering Spring 016 Instructor: Prof. A. R. Reibman FINAL EXAM: 3:30-5:30pm Spring 016, MWF 1:30-1:0pm (May 6, 016) This is a closed book exam.
STAT 328 (Statistical Packages)
") Department of Statistics and Operations Research College of Science King Saud University Exercises STAT 328 (Statistical Packages) nashmiah r.alshammari ^-^ Excel and Minitab - 1 - Write the commands of
Department of Statistics and Operations Research College of Science King Saud University Exercises STAT 328 (Statistical Packages) nashmiah r.alshammari ^-^ Excel and Minitab - 1 - Write the commands of
Inference Tutorial 2
 Inference Tutorial 2 This sheet covers the basics of linear modelling in R, as well as bootstrapping, and the frequentist notion of a confidence interval. When working in R, always create a file containing
MAT 2377 Practice Exam
 MAT 2377 Practice Exam 1. Suppose that for a very large delivery of integrated circuits, each circuit has a probability of failure of 0.09. Find the probability that no more than 2 pieces fail in a random
This midterm covers Chapters 6 and 7 in WMS (and the notes). The following problems are stratified by chapter.
. The following problems are stratified by chapter.") This midterm covers Chapters 6 and 7 in WMS (and the notes). The following problems are stratified by chapter. Chapter 6 Problems 1. Suppose that Y U(0, 2) so that the probability density function (pdf)
This midterm covers Chapters 6 and 7 in WMS (and the notes). The following problems are stratified by chapter. Chapter 6 Problems 1. Suppose that Y U(0, 2) so that the probability density function (pdf)
UNIVERSITY OF MASSACHUSETTS Department of Mathematics and Statistics Basic Exam - Applied Statistics Thursday, August 30, 2018
 UNIVERSITY OF MASSACHUSETTS Department of Mathematics and Statistics Basic Exam - Applied Statistics Thursday, August 30, 2018 Work all problems. 60 points are needed to pass at the Masters Level and 75
This gives us an upper and lower bound that capture our population mean.
 Confidence Intervals Critical Values Practice Problems 1 Estimation 1.1 Confidence Intervals Definition 1.1 Margin of error. The margin of error of a distribution is the amount of error we predict when
Chapter 8 Handout: Interval Estimates and Hypothesis Testing
 Chapter 8 Handout: Interval Estimates and Hypothesis esting Preview Clint s Assignment: aking Stock General Properties of the Ordinary Least Squares (OLS) Estimation Procedure Estimate Reliability: Interval
First Year Examination Department of Statistics, University of Florida
 First Year Examination Department of Statistics, University of Florida August 19, 010, 8:00 am - 1:00 noon Instructions: 1. You have four hours to answer questions in this examination.. You must show your
STAT 512 MidTerm I (2/21/2013) Spring 2013 INSTRUCTIONS
 Spring 2013 INSTRUCTIONS") STAT 512 MidTerm I (2/21/2013) Spring 2013 Name: Key INSTRUCTIONS 1. This exam is open book/open notes. All papers (but no electronic devices except for calculators) are allowed. 2. There are 5 pages in
STAT 512 MidTerm I (2/21/2013) Spring 2013 Name: Key INSTRUCTIONS 1. This exam is open book/open notes. All papers (but no electronic devices except for calculators) are allowed. 2. There are 5 pages in
S n = x + X 1 + X X n.
 0 Lecture 0 0. Gambler Ruin Problem Let X be a payoff if a coin toss game such that P(X = ) = P(X = ) = /2. Suppose you start with x dollars and play the game n times. Let X,X 2,...,X n be payoffs in each
Binary response data
 Binary response data A Bernoulli trial is a random variable that has two points in its sample space. The two points may be denoted success/failure, heads/tails, yes/no, 0/1, etc. The probability distribution