Experimental and theoretical investigations of active center generation and mobility in cationic and free-radical photopolymerizations
|
|
|
- Alberta Caldwell
- 6 years ago
- Views:
Transcription


1 University of Iowa Iowa Research Online Theses and Dissertations Spring 2010 Experimental and theoretical investigations of active center generation and mobility in cationic and free-radical photopolymerizations Cynthia Caroline Hoppe University of Iowa Copyright 2010 Cynthia Caroline Hoppe This dissertation is available at Iowa Research Online: Recommended Citation Hoppe, Cynthia Caroline. "Experimental and theoretical investigations of active center generation and mobility in cationic and freeradical photopolymerizations." PhD (Doctor of Philosophy) thesis, University of Iowa, Follow this and additional works at: Part of the Chemical Engineering Commons
2 EXPERIMENTAL AND THEORETICAL INVESTIGATIONS OF ACTIVE CENTER GENERATION AND MOBILITY IN CATIONIC AND FREE-RADICAL PHOTOPOLYMERIZATIONS by Cynthia Caroline Hoppe An Abstract Of a thesis submitted in partial fulfillment of the requirements for the Doctor of Philosophy degree in Chemical and Biochemical Engineering in the Graduate College of The University of Iowa May 2010 Thesis Supervisor: Professor Alec B. Scranton
3 1 ABSTRACT Photopolymerization is considered an attractive alternative in many industries to traditional polymerization processes. The advantages of photopolymerization over other types of polymerization include elimination of heat sources, faster cure times, and reduction in the use of volatile organic solvents. Despite these environmental and cost-saving advantages, photopolymerizations have several limitations. Light attenuation can be a problem for systems containing pigments or fillers. The radiation source penetrates only to a shallow depth beneath the surface, limiting the thickness of strongly pigmented or filled coatings and films. Photopolymerization is also generally limited to systems with simple geometries that can be uniformly illuminated. Coatings on threedimensional substrates, or other systems with complex geometries, are difficult to uniformly cure. These problems can be solved by shadow cure, which is defined as the reactive diffusion of photoinitiated active centers into regions of a polymer that are unilluminated. In this contribution, the generation and subsequent spatial and temporal evolution of the active center concentrations during illumination are described using the differential equations that govern the light intensity and photoinitiator concentration for polychromatic illumination. Reactive diffusion of the active centers during the post-illumination period is characterized, and shown to result in cure of unilluminated regions. A kinetic analysis is performed by coupling the active center concentration profiles with the propagation rate equation, yielding predicted cure times that are compared with experimental results. This analysis is used for the evaluation of cationic shadow cure in pigmented photopolymerization systems, and systems with complex geometries. The
4 2 extensive characterization of cationic systems is then applied to free-radical photopolymerization to examine the potential of shadow cure for active centers with much shorter lifetimes. An example of a free-radical photopolymerization system is presented in which the dimensional scales are small enough to utilize the short lifetimes of free-radical active centers for shadow cure. The results for both free-radical and cationic shadow cure indicate that the reactive diffusion of photoinitiated active centers may be used for effective cure in unilluminated regions of a photopolymer. This research will potentially allow photopolymerization to be used for applications in industries where it has never before been utilized. Abstract Approved: Thesis Supervisor Title and Department Date
5 EXPERIMENTAL AND THEORETICAL INVESTIGATIONS OF ACTIVE CENTER GENERATION AND MOBILITY IN CATIONIC AND FREE-RADICAL PHOTOPOLYMERIZATIONS by Cynthia Caroline Hoppe A thesis submitted in partial fulfillment of the requirements for the Doctor of Philosophy degree in Chemical and Biochemical Engineering in the Graduate College of The University of Iowa May 2010 Thesis Supervisor: Professor Alec B. Scranton
6 Graduate College The University of Iowa Iowa City, Iowa CERTIFICATE OF APPROVAL PH.D. THESIS This is to certify that the Ph.D. thesis of Cynthia Caroline Hoppe has been approved by the Examining Committee for the thesis requirement for the Doctor of Philosophy degree in Chemical and Biochemical Engineering at the May 2010 graduation. Thesis Committee: Alec B. Scranton, Thesis Supervisor Julie L. P. Jessop Tonya Peeples C. Allan Guymon Ned Bowden
7 For my dearest family and friends, for providing mirrors into my soul. ii
8 ACKNOWLEDGMENTS I would like to take this opportunity to thank the people without whom I would not have survived my graduate experience. First, I would like to thank Professor Alec Scranton, my academic advisor, for accepting me with open arms into his research group at my darkest hour. Photopolymerization was the best thing that ever happened to my graduate career, and I will be forever grateful for having had the opportunity to explore and contribute to such an exciting and cutting-edge field of research. Professor Scranton has become an invaluable mentor and friend, and could not have been more supportive and encouraging of me. I would not have learned a new research area in such a short time if it were not for his direction and creativity. I would also like to thank all of the past and present graduate students in our research group, as well as Chris Coretsopoulos, for helping me along the way. Because of Professor Scranton s leadership, I have had the unique opportunity to work on several different research collaborations with industrial partners. I would like to thank all the collaborators I have worked with for their funding and support, as well as for the ideas and inspiration they have provided for this research. I would like to thank the National Science Foundation and the University of Iowa Graduate College both for providing me with generous fellowship funding. There are countless people to thank within the Chemical and Biochemical Engineering Department. I would like to say a special thanks to Associate Professors Julie Jessop and Tonya Peeples for being mentors and friends to me over the years. Thanks to Linda Wheatley for keeping me organized and on-track. All of my fellow graduate students who I have come iii
9 to know have touched my life in some way. I think I could name a student in every single one of our department research laboratories who has helped me learn an experimental or computational technique. I feel very fortunate to have found a home in such an open and collaborative department. I have had the opportunity to work with several talented undergraduate engineering students, including Amber Thiesen, Brandon Robson, Mike Baker, and Tim Hullermann. Thank you for your hard work and dedication. I could not complete this list without saying a special thanks to my previous academic advisor, Professor John Wiencek, my first mentor at the University of Iowa who welcomed me the day I walked in the door. I appreciate his guidance and friendship during the first few years of my graduate experience. I will always be proud to have been a member of his group, and grateful for my experience working with protein expression, purification, and characterization. Of course this would not be complete without thanking my family, starting with my parents who instilled in me a belief that I could achieve anything I set my heart and mind to. I would not be where I am today without their belief in me. I have cherished every day throughout my graduate experience because of my children, who provide me with the motivation to persevere. And finally, I must thank my soul mate and loving husband more than anyone, for believing in me, for having infinite patience with me, and for providing the biggest mirror of all. iv
10 TABLE OF CONTENTS LIST OF TABLES...vii LIST OF FIGURES...viii CHAPTER 1 BACKGROUND AND SIGNIFICANCE Introduction Photopolymerization Background Cationic Photopolymerization and Shadow Cure A Case for Shadow Cure in Free-Radical Photopolymerizations... 6 CHAPTER 2 OBJECTIVES... 9 CHAPTER 3 CATIONIC PHOTOPOLYMERIZATION OF SYSTEMS PIGMENTED WITH CARBON BLACK NANOPARTICLES Introduction Experimental Materials Pigment Dispersion and Size Characterization UV/Visible Spectroscopy Determination of Diffusion Coefficient Raman Spectroscopy for Characterization of the Propagation Rate Constant Photopolymerization of Coatings Results and Discussion Photoinitiator, Photolysis Product, and Pigment Absorptivities Determination of the Active Center Concentration Profiles Produced During Illumination Post-illumination Diffusion of Active Centers in Pigmented Coatings Kinetic Analysis for Prediction of Cure Times Conclusions CHAPTER 4 CATIONIC ACTIVE CENTER MOBILITY IN PHOTOPOLYMERIZATION SYSTEMS WITH COMPLEX GEOMETRIES Introduction Shadow Cure in Two Spatial Dimensions Governing Equations Results and Discussion Shadow Cure Perpendicular to the Direction of Illumination Materials and Experimental Methods v
11 4.3.2 Results and Discussion Shadow Cure Through Multiple Coating Layers Experimental Methods Results and Discussion Conclusions CHAPTER 5 THE POTENTIAL OF FREE-RADICAL SHADOW CURE Introduction Selection of Photoinitiator and Light Source for a Photopolymerizable ACF Materials and Experimental Methods Results and Discussion Characterization of Shadow Cure Materials and Experimental Methods Results and Discussion Conclusions CHAPTER 6 CONCLUSIONS AND RECOMMENDATIONS Cationic Photopolymerization of Systems Pigmented with Carbon Black Nanoparticles Cationic Active Center Mobility in Photopolymerization Systems with Complex Geometries The Potential of Free Radical Shadow Cure REFERENCES vi
12 LIST OF TABLES Table 3-1. Napierian molar absorptivities (L/mol-cm) for photoinitiator (ε i ) and photolysis products (ε p ) for incident wavelengths Table 4-1. Results of shadow cure through multiple layers: bottom layer illuminated only Table 4-2. Results of shadow cure through multiple layers: top layer illuminated only Table 5-1. Overall conversions by FTIR for various visible light photoinitiators illuminated with green LED for one minute 8 cm from light source vii
13 LIST OF FIGURES Figure 3.1. DLS histogram with mean hydrodynamic radius = 29.2 nm Figure 3.2. Transmittance vs. concentration of CB-35 in propylene carbonate at 300nm. Effective absorptivity = 22.9 L/g-cm Figure 3.3. Profiles of the initial total light intensity summed over initiating wavelengths ( nm) a) no pigment, b) 3 wt% CB-35. Monomer: EEC, Initiator: 1 wt% IPB Figure 3.4. Profiles of photoinitiator concentration after 2 minutes illumination. a) no pigment, b) 3 wt% CB-35. Monomer: EEC, Initiator: 1 wt% IPB Figure 3.5. Profiles of active center concentration for infinite thickness during 5 minutes of illumination. a) 2 wt% CB-35, b) 3 wt% CB-35. Monomer: EEC, Initiator: 1 wt% IPB Figure 3.6. Profiles of active center concentration for 80 µm thick coatings during 5 minutes of illumination. a) 2 wt% CB-35, b) 3 wt% CB-35. Monomer: EEC, Initiator: 1 wt% IPB Figure 3.7. Profiles of active center concentration for 2 wt% CB-35 pigmented coatings ranging from 40 µm to infinitely thick. a) 2 minutes of illumination, b) 5 minutes of illumination. Monomer: EEC, Initiator: 1 wt% IPB Figure 3.8. Shadow cure distance versus square root of time for a 1 wt% carbon black pigmented system. Monomer: EEC, Initiator: 1 wt% IPB, Exposure Time: 5 min Figure 3.9. Active center concentration profiles diffusing postillumination in an 80 µm thick pigmented coating. a) 2 wt% CB-35, b) 3 wt% CB-35. Monomer: EEC, Initiator: 1 wt% IPB, Exposure time: 5 min Figure Active center concentration profiles diffusing postillumination in pigmented coating (40 µm thick). a) 2 wt% CB-35, b) 3 wt% CB-35. Monomer: EEC, Initiator: 1 wt% IPB, Exposure time: 3 min Figure Active center profiles for various CB loadings at bottom interface of 80 µm thick coating. Monomer: EEC, Initiator: 1 wt% IPB, Pigment: 1-3 wt% CB-35, Exposure Time: 5 min Figure Comparison of predicted with experimental cure times (tmpd) at bottom interface of 40 µm and 80 µm thick coatings for varying illumination times. Monomer: EEC, Initiator: 1 wt% IPB, Pigment: 2 wt% CB viii
14 Figure Predicted cure times (tmpd) at bottom interface of coatings pigmented with 1-3 wt% CB-35. a) 40 µm thickness, b) 80 µm thickness. Monomer: EEC, Initiator: 1 wt% IPB Figure 4.1. Active center concentration profile at the end of the illumination period. Monomer: EEC, Initiator: 1 wt% IPB, Exposure time: 5 minutes Figure 4.2. Active center concentration profiles diffusing with increasing shadow cure time. Monomer: EEC, Initiator: 1 wt% IPB, Exposure time: 5 min Figure 4.3. Geometrical configuration for shadow cure in two spatial dimensions. Rectangular cross-section of sample with depth z and width x Figure 4.4. Active center concentration profiles in two spatial dimensions (x and z). a) end of illumination period, b) 2.5 minutes shadow cure, c) 5 minutes, d) 10 minutes, e) 25 minutes, and f) 50 minutes. Monomer: EEC, Initiator: 1 wt% IPB, Exposure time: 5 minutes Figure 4.5. Schematic representation of shadow cure experiments used to measure cationic active center migration perpendicular to the direction of illumination Figure 4.6. Photo showing illuminated region and shadow cure region of cured epoxide coating on aluminum panel. Monomer: EEC, Initiator: 3 wt% IPB, Exposure time: 3 sec Figure 4.7. Experimental measurements of shadow cure distance into shaded region over 30 minutes post-illumination time. Monomer: EEC, Initiator: 3 wt% IPB, Exposure time: 3 sec Figure 4.8. Active center concentration profiles throughout the 80 µm coating depth throughout the 3 second illumination time Figure 4.9. Active center concentration profiles diffusing into the shadow region (x-direction) with increasing shadow cure time. Monomer: EEC, Initiator: 3 wt% IPB, Exposure time: 3 seconds Figure Cationic active center concentration as a function of time at various positions in the shadow cure region (x-direction). Monomer: EEC, Initiator: 3 wt% IPB, Exposure time: 3 seconds Figure Experimental measurements of shadow cure distance into shaded region over 30 minutes post-illumination time. Monomer: EEC, Initiator: 3 wt% IPB, Exposure time: 3 seconds Figure Active center concentration profiles diffusing into the shadow region (x-direction) with increasing shadow cure ix
15 time for a) 1 cm illuminated width, and b) 4 cm illuminated width. Monomer: EEC, Initiator: 3 wt% IPB, Exposure time: 3 sec Figure Pictorial representation of the experimental setup for bottom layer only illumination. a) the bottom layer, containing monomer and photoinitiator, is illuminated. b) the second layer of monomer is added, which cures with no further illumination. Arrows indicate diffusion of active centers into unilluminated layer Figure Pictorial representation of the experimental setup for top layer only illumination. a) a layer of monomer only is applied to a substrate. b) a second layer of monomer containing photoinitiator is added and illuminated, resulting in cure of the entire film. Arrows indicate diffusion of active centers into unilluminated layer Figure 5.1. Flexible printed circuit assembly using heat-curable ACF Figure 5.2. Flexible printed circuit assembly using proposed photopolymerizable ACF Figure 5.3. Absolute irradiance of 150 W xenon lamp and high intensity green LED compared with absorbance of polyimide film Figure 5.4. Eosin Y (spirit soluble) absorbance spectrum and molecular structure (0.001 wt% Eosin Y in methanol) Figure 5.5. Direct reaction between Eosin Y spirit soluble and MDEA [56] Figure 5.6. Summary of FTIR conversion results for HEA films using Eosin Y/MDEA photoinitiator system with cumene hydroperoxide Figure 5.7. Real-time FTIR conversion during 2 minute illumination with 150 W xenon lamp Figure 5.8. FTIR conversion for HEA films using 3-component Eosin Y photoinitiator system Figure 5.9. Optimization of 2-component Eosin Y system. Conversions calculated by FTIR. 1 minute illumination with 150 W Xe lamp Figure Real-time FTIR conversion during 1 minute illumination with 150 W xenon lamp. HEA monomer, Eosin Y photoinitiator system with and without cumene hydroperoxide Figure Example of an electrode imbedded polyimide film with 100 x 100 µm electrode spacing x
16 Figure Polarized light micrographs of HEA films containing optimized 2-component Eosin Y photoinitiator system. Illuminated for 1 minute with 150 W xenon lamp through a PET film with 50 x100 µm electrode spacing Figure Polarized light micrograph showing cross-section of HEA film containing optimized 2-component Eosin Y photoinitiator system. Illuminated for 1 mintue with 150 W xenon lamp through PET film containing 50x100 µm gold electrode spacing Figure Light intensity profile of a 3-component Eosin Y system initiatied with a 150 W xenon lamp(i o = 60 mw/cm 2 in the nm spectral region) Figure Photoinitiator concentration profile for a 3-component Eosin Y system initiated with a 150 W xenon lamp (I o = 60 mw/cm 2 in the nm spectral region) Figure Geometrical configuration for analysis of free-radical active center diffusion Figure Post-illumination concentration profiles for active centers diffusing from illumination region (left side: 0-50 µm) to unilluminated region (right side: µm) for initial concentration of 10-8 mol/l. a) diffusion only (Equation 5.5), b) diffusion and termination (Equation 5.7) Figure Post-illumination concentration profiles for active centers diffusing from illumination region (left side: 0-50 µm) to unilluminated region (right side: µm) for initial concentration of 10-6 mol/l. a) diffusion only (Equation 5.5), b) diffusion and termination (Equation 5.7) xi
17 1 CHAPTER 1 BACKGROUND AND SIGNIFICANCE 1.1 Introduction Radiation initiated polymerization of multifunctional monomers in the presence of a photoinitiator is one of the most efficient methods for producing highly crosslinked polymer materials. Photopolymerizable coatings and films have gained acceptance in many multi-million dollar industries. Some examples of applications for radiation curable coatings and films include protective coatings for plastics, metals, and woods such as flooring and cabinetry [1,2]; in-situ photopolymerizable bioadhesives such as dental sealants [3-5]; UV-curable ink-jet printing inks [6,7]; adhesives for flat panel displays and other microelectronics [8-10]; printed circuit boards and other optical lithography applications [11-13]; optical fibers and optical data storage such as CDs and DVDs [14,15]; and many others. In this chapter, the current state of technology for photopolymerizable coatings and films is described within the context of some applications of photopolymers, and the limitations to the use of photopolymerization for these applications are explored. The need to overcome these limitations forms the basis for the research that is presented in this contribution. 1.2 Photopolymerization Background Photopolymerization can be defined as the effectively instantaneous conversion of a liquid resin into a solid, insoluble polymer by exposure to ultraviolet or visible radiation [16]. Radiation curing is considered an attractive alternative to traditional polymerization processes due to many advantages. Polymer coatings are typically produced using thermal polymerization, which uses heat to generate active centers that polymerize
18 2 the coating after a liquid monomer has been applied to a substrate. Industrial heat curing requires large amounts of energy to operate high temperature ovens for extended periods of time. Photopolymerization eliminates the need for heat curing, resulting in significant energy and cost savings. As an additional consequence of eliminating the thermal sources, heat sensitive substrates such as printed circuit boards and other electronic assemblies that can be produced by photopolymerization are not damaged by heat curing. Any heat buildup that may be caused by the radiation source in the photopolymer or substrate is minimal, and is quickly dissipated for thin film applications. Improved manufacturing efficiency also results from photopolymerization processes due to the comparatively short time scales required for radiation curing. Higher line speeds can be achieved and multiple curing steps can be performed in a single manufacturing line. Finally, the use of volatile organic compounds (VOCs) is reduced or eliminated because solvent-free resins are generally used in photopolymerizable formulations. Before environmental regulation began in the 1970s, many industrial coatings contained as much as 80% solvent, and large quantities of solvent were released into the atmosphere [14]. Again, manufacturing efficiency can be improved by eliminating the need for solvent vapor handling systems. These advantages make photopolymerization better for the environment than other types of polymerization processes. Despite all of these advantages, photopolymerizations have some disadvantages that cause their use to be limited in some industries. Light attenuation can be a problem for coatings or films containing pigments or fillers. Pigments are often added to coatings to provide color or to hide the surface of the substrate, but can compete with the photoinitiator by absorbing the initiating light. For this reason, free-radical photopolymerizations of
19 3 pigmented coatings are typically limited to extremely thin applications, such as printing inks. The same light attenuation problem exists for other types of filled systems, such as nanocomposites [17]. Another barrier to the use of photopolymerization in many applications is the inability to cure systems with complex geometries. Photopolymerization is commonly used for curing coatings on twodimensional substrates. However, when the need arises for coating substrates with complex geometries, traditional photopolymerization suffers several disadvantages. Photopolymerizations are typically dependent upon the generation of short-lived free-radicals that are sensitive to termination by oxygen. Oxygen reacts with free-radical active centers, prevents the polymerization from proceeding until all of the oxygen is consumed, and results in the formation of harmful peroxides and hydroperoxides. Oxygen inhibition can lead to incomplete polymerization, slow reaction rates, and tacky surfaces. Expensive methods are used to overcome this problem, such as blanketing a photopolymer system with an inert gas such as nitrogen. Furthermore, free-radical photopolymerization reactions proceed only in the presence of UV irradiation, so the reactions terminate when the UV irradiation ceases. For these reasons, free-radical photopolymerizations fail to provide a practical and economical method for coating surfaces with irregular or intricate shapes. Some of the methods being developed to overcome these problems for curing coatings on three-dimensional objects include plasma curing [18], dual-cure systems [19-21], and robotic UV curing [22]. In this contribution, cationic photopolymerization is presented as a solution to some of these limitations to photopolymerization.
20 4 1.3 Cationic Photopolymerization and Shadow Cure Cationic photopolymerization has been shown to overcome some of the limitations of the more common free-radical photopolymerization. Cationic photopolymerization is an alternative to free-radical photopolymerization offering several unique advantages. Photo-generated cationic active centers exhibit extremely long lifetimes. They are not sensitive to free-radical scavengers, such as oxygen, and do not terminate by a radical-radical termination mechanisms. For these reasons, the long-lived cationic active center lifetimes can result in photopolymerization reactions that proceed long after irradiation has ceased, until the monomer is consumed or the active centers become entrapped in the polymer matrix. Despite these advantages over free-radical systems, the development of efficient cationic photopolymerization systems has been challenging. Cationic photoinitiators originally developed to generate cationic active centers, such as aryldiazonium salts, were very costly, had poor stability, and would produce inferior physical properties in the resulting polymer. Diarlyiodonium salt photoinitiators and triarylsulfonium salt photoinitiators were developed in the 1980s in a joint patent between 3M and General Electric [23]. These cationic photoinitiators, commonly used today, are thermally stable over a wide range of temperatures, absorb light very efficiently with an optical yield of approximately 0.7, are inexpensive to manufacture, and result in improved polymer physical properties. The commercial availability of these newer cationic photoinitiators has spurred research into the kinetics, mechanisms, and physical properties of cationic photopolymerization over the past two decades. Cationically polymerizable monomers were subsequently developed to provide reaction rates and physical properties that could rival those of free-radically polymerized
21 5 monomers. Vinyl ethers typically have high polymerization rates, but can result in runaway reactions. Epoxide reactions are easily controlled, but the polymerization rate is slow in comparison to vinyl ethers and acrylates. Finally, high ring-strain epoxides, such as 3,4-epoxy-cyclohexylmethanyl 3,4- epoxy-cyclohexanecarboxylate (EEC) have become an industrial standard for for their high reactivity and excellent physical properties. Cationic photopolymerization can also be used for other important classes of monomers, such as oxetanes and siloxanes. Many cationically polymerizable monomers exhibit exceptional physical properties, such as clarity, adhesion, abrasion resistance, and chemical resistance. Some cationic photopolymers exhibit less shrinkage than their free-radical counterparts, such as acrylates. Several investigators have shown cationic active centers to lead to dark cure, or post-polymerization [24-26]. Due to their long lifetimes, cationic active centers can also be responsible for a process known as shadow cure, or cure in regions that have never been illuminated [27]. The cationic active center lifetimes are long enough for diffusion to take place, either during the illumination period or after the illumination has ceased. This mobility of the cationic active centers facilitates cationic cure in recessed or shadow areas of a substrate that have not been directly exposed to irradiation. This contribution provides a theoretical and experimental investigation of cationic shadow cure in pigmented systems and in systems requiring cure in multiple spatial dimensions. In the period of time during which the photopolymer is illuminated, the cationic active centers are preferentially generated at the surface to produce a sharp concentration gradient that provides a driving force for diffusion into regions of unexposed monomer. An analysis of the active center diffusion that takes place postillumination is used to characterize shadow cure in these systems. Cationic
22 6 active center mobility is shown to have the potential to make photopolymerization possible in some applications where it has not been commonly utilized. 1.4 A Case for Shadow Cure in Free-Radical Photopolymerizations Free-radical active centers have significantly shorter lifetimes than cationic active centers, and tend to terminate immediately upon cessation of the illuminating light source. However, some cutting edge applications for photopolymers may require the development of shadow cure in free-radical systems. Advances in microelectronics have led to an increase in demand for circuits with increasingly small pitch, or spacing between interconnects. Despite the extremely short lifetimes of the free-radical active centers, mobility of free-radicals within the increasingly small dimensional scales required by microelectronics is becoming a possibility. One application in which free-radical shadow cure in photopolymerizations may become feasible is polymer-based conductive adhesives, which are substitute for lead-based solders [9]. Electrically conductive adhesives provide an environmentally friendly solution for interconnections in many current electronics applications. Isotropic conductive adhesives (ICAs) are heat-curable materials containing an isotropic concentration of conductive particles, typically silver-filled epoxides that allow current to flow in all directions through the cured polymer. These adhesives can be used to electrically interconnect non-solderable substrates such as ceramics or plastics, or to replace solder for thermally-sensitive components. A second type of electrically conductive adhesive is anisotropic conductive adhesive, which allow current to flow along a unidirectional axis [8]. This type of adhesive is a composite containing fine electrically
23 7 conductive particles uniformly dispersed in a polymer matrix designed to provide electrical interconnection only at planned sites where the particles come into contact with a conductive substrate. The most common form these adhesives is a heat-curable, thermoplastic, anisotropic conductive film (ACF) used in flexible printed circuits. Ninety percent of all ACFs are currently sold for use in flat panel displays such as LCDs [10]. They are also used in flexible printed circuits, in which electronic circuits are mounted on flexible plastic substrates. Flexible printed circuits are being used in many applications, such as electronic books and other forms of electronic paper, displays for cameras and cell phones, and computer keyboards. In this contribution, one possible formulation that could be used in a photopolymerizable ACF assembly is presented in which free-radical shadow cure is proposed as a method for attaining full polymerization in unilluminated regions, behind electrodes and around conductive particles. Considerations for the selection of a specific formulation for this application are explored, and light sources required for this application are evaluated. The motivation behind this research is to eliminate the heating step traditionally required for curing a conductive adhesive film. The advantages of replacing the heat-curing process with photopolymerization in this type of microelectronics application include protecting the heat-sensitive circuits from elevated temperatures, minimizing cure times, reducing energy usage, and eliminating the use of VOCs. Aside from the specific scenario for free-radical shadow cure outlined above, applications have generally not yet been developed in which diffusion of free-radical active centers could be used to cure unilluminated regions of a photopolymer. In typical applications currently employing photopolymerization for microelectronics, such as printed circuit boards and other
24 8 types of microlithography, the goal is usually to attain high resolution. Deep UV wavelengths are utilized in these industries to enhance resolution, and diffusion of active centers presents a limitation rather than an asset. Therefore, the concept of free-radical shadow cure is extremely novel, has likely never before been utilized, and represents a great potential for the use of photopolymerization in the cutting-edge field of microelectronics.
25 9 CHAPTER 2 OBJECTIVES The previous chapter illustrates that there is a compelling motivation for the development of shadow cure in photopolymerizations. The mobility of active centers can overcome many of the current limitations to the use of photopolymerization in some industries. This research addresses this need, and provides an increased fundamental understanding of the diffusional and kinetic mechanisms of shadow cure. The hypothesis of this research is that the mobility of active centers can lead to polymerization in regions of a photopolymer that that have not been illuminated. The broad objective of this research is to utilize a fundamental set of differential equations that govern the light intensity gradient and photoinitiator concentration gradient for polychromatic illumination to describe the spatial and temporal evolution of active center concentration profiles generated during illumination. These profiles of the active center concentrations are then used to characterize the reactive diffusion process which takes place during the post-illumination period. Consequently, a fundamental understanding of the active center migration into unilluminated regions is attained. This broad objective is achieved by accomplishing the following three specific goals: 1) to demonstrate the generation and mobility of cationic active centers in systems pigmented with carbon black, specifically to understand the post-illumination diffusion of the active centers to depths greater than the light penetrates, and to support with
26 10 experimental results the idea that polymerization can occur in regions that have not been illuminated. 2) to illustrate the effects of shadow cure, or post-illumination diffusion, of cationic active centers in multiple spatial dimensions for the purpose of utilizing shadow cure for systems with complex geometries, again supporting with experimental results the hypothesis that shadow cure can result in polymerization of unilluminated regions. 3) to investigate the potential of free-radical shadow cure, specifically the ability of free-radical active centers to migrate post-illumination over the short dimensional scales required for some microelectronics applications, resulting in free-radical polymerization of unilluminated regions.
27 11 CHAPTER 3 CATIONIC PHOTOPOLYMERIZATION OF SYSTEMS PIGMENTED WITH CARBON BLACK NANOPARTICLES 3.1 Introduction Photopolymerization is well established as an effective method for curing transparent films. However, the need for pigmented coatings has limited the use of photopolymerization in many applications. Pigments are often added to coatings to provide color or to hide the surface of the substrate. Photopolymerization reactions are hindered by pigments and fillers, which directly compete with the photoinitiator for incident photons [28]. This results in increased light attenuation in pigmented coatings, especially with increasing film thickness. For this reason, free-radical photopolymerizations of pigmented coatings are typically limited to very thin applications, such as inks (~10 µm), with the thickest systems approaching 100 µm [29,30]. Unlike free-radicals, cationic active centers are not inhibited by oxygen and are essentially non-terminating, and therefore have been shown to remain active long after irradiation has ceased and may lead to further polymerization in the illuminated region (dark cure). Dark cure in cationic photopolymerizations of epoxide monomers has been characterized by a number of investigators [24-26]. Due to their long lifetimes and tendency to diffuse, cationic active centers can also be responsible for shadow cure in regions that have never been illuminated such as unexposed depths and regions shaded by opaque constituents or fillers. In a recent contribution, Ficek et al. [27] characterized the diffusion of the cationic active centers in photopolymerizations of cycloaliphatic epoxides, and demonstrated that the cure can continue for several hours to extend deep below the illuminated
28 12 surface in unpigmented systems. Sangermano and collaborators [17,21] recently reported hybrid cationic photopolymerization/sol-gel reaction processes to produce coatings containing nano-scale inorganic domains. In this clever approach, the inorganic domains are produced in situ, after the UV curing step, and the investigators demonstrated that coatings with desirable scratch resistance, toughness, clarity, and refractive index could be obtained. This contribution provides a theoretical and experimental investigation of cationic photopolymerizations of epoxide coatings pigmented with carbon black nanoparticles. The fundamental differential equations describing the polychromatic photoinitiation process [31,32] are solved to obtain profiles of the concentration of active centers as a function of time and depth. Here the differential reaction/diffusion equations which describe the consumption of photoinitiator and production of active centers are coupled to the differential absorption equation which accounts for the polychromatic absorption by all system components, including the pigment. During the illumination period the active centers are preferentially generated at the surface to produce a concentration gradient that leads to diffusion into the regions of unexposed monomer. Using the active center concentration gradient at the end of the illumination period as the initial condition for the differential diffusion equation allows the active center concentration profile to be determined long after the illumination has ceased. Coupling these concentration profiles with the propagation rate equation allows the cure time, or time for macroscopic property development, to be predicted for a required conversion. In this manner, experimental cure times for carbon black pigmented coatings are compared with theoretical predictions of cure time.
29 Experimental Materials The cationically polymerizable monomer 3,4-epoxy-cyclohexylmethanyl 3,4-epoxy-cyclohexanecarboxylate (EEC, Sigma Aldrich) was used in these experiments. The photoinitiator used in these experiments was (tolycumyl)iodonium tetrakis (pentafluorophenyl) borate (IPB, Secant Chemicals). The carbon black pigment studied was CB-35 (NIPex 35, Degussa Engineered Carbons, LP). Methanol and propylene carbonate solvents were used for UV/Visible spectroscopy Pigment Dispersion and Size Characterization The carbon black used in this study is a commercial furnace black designed for chemically prepared toner applications because of its ease of dispersion. Furnace blacks generally exhibit a hydrophobic, non-polar, basic character. Propylene carbonate was selected as a solvent for carbon black spectral measurements because it is a polar aprotic solvent in which the pigment exhibits good dispersion. The size and monodispersity of CB-35 carbon black in propylene carbonate was characterized using dynamic light scattering (DLS). Experiments were carried out with a DynaPro 99P instrument (Protein Solutions) equipped with a 1 cm pathlength cell. Samples were analyzed using the Dynamics software provided with the instrument UV/Visible Spectroscopy The absorbance spectra for the monomer, photoinitiator, photolysis products, and pigments were determined in one nanometer increments using an 8453 UV-Visible spectrophotometer (Agilent Technologies). For the
30 14 monomer and photoinitiator, the spectra were obtained for dilute solutions (10-2 M and 10-3 M respectively) in methanol placed in an air-tight, quartz cell to prevent any changes in concentration due to evaporation of the solvent. To obtain the absorbance spectra after photolysis, the photoinitiator samples were illuminated with a 200 Watt Hg-Xe arc lamp (Oriel Light Sources) until there was no change in the absorbance spectrum. For carbon black spectra, the pigment was dispersed in propylene carbonate (~1 g/l) by mixing on a stir plate for at least 24 hours prior to analysis Determination of Diffusion Coefficient A method previously documented for determining the diffusion coeffiecient for cationic active centers in cycloaliphatic diepoxide systems [27] was used to measure distance over which shadow cure occurred for a carbon black pigmented system, and to calculate the effective diffusion coefficient. Solutions containing 98 wt% EEC, 1 wt% IPB, and 1 wt% pigment were mixed together for 24 hours in dark conditions. The monomer mixture was placed in disposable 4.5 ml polystyrene cuvettes, which were chosen because they are transparent to the wavelengths of interest and readily dissolve in a number of solvents. Each cuvette, filled to a level of 3 cm with monomer solution, was illuminated from underneath with the light from the 200 W Hg- Xe arc lamp for 5 minutes. Since the density of the polymer is higher than that of monomer, illumination from below avoids polymerization-induced convection or mixing. After exposure, the system was maintained at 50 C for the prescribed shadow cure time. At the prescribed shadow cure time, the sample was placed in THF to dissolve the cuvette and monomer from the uncured region of the sample. The insoluble polymer matrix was washed with acetone to remove any remaining THF and excess monomer. The polymer
31 15 sample was dried thoroughly and its weight was recorded. The polymerized thickness was determined by dividing the weight of the polymer sample by the product of the polymer density and the area of illuminated surface (the cross-sectional area of the cuvette, 1 cm 2 ). At each shadow cure time, an unilluminated control sample was prepared to verify that thermally-induced polymerization did not occur Raman Spectroscopy for Characterization of the Propagation Rate Constant The propagation rate constant for cationic polymerization of the cycloaliphatic diepoxide used in this study was determined independently for the neat monomer using Raman Spectroscopy. Raman spectra were collected using a holographic fiber-coupled stretch probehead (Mark II, Kaiser Optical Systems, Inc.) attached to a modular research Raman spectrograph (HoloLab 5000R, Kaiser Optical Systems, Inc). A sample containing EEC monomer with photoinitiator was placed inside a sealed 1 mm ID quartz capillary tube. A 200 mw 785 nm near-infrared laser through a 10x non-contact sampling objective with 0.8 cm working distance was directed into the sample to induce the Raman scattering effect. Photopolymerization was initiated by simultaneously illuminating the sample with a 100 W high pressure mercury lamp (Acticure Ultraviolet/Visible Spot Cure System, EXFO Photonic Solutions, Inc. ) filtered for nm wavelengths. The Raman peak at 790 cm -1 was used to determine the epoxide conversion [33]. The effective propagation rate constant, kp, was determined using a previously published procedure [34]. The value of kp for EEC was determined to be 0.1 L/mol-sec, which is consistent with literature reported kp values for ring-opening polymerizations [35].
32 Photopolymerization of Coatings The time required for the CB-35 pigmented coatings to reach macroscopic property development was investigated over a range of pigment loadings and illumination times. For these experiments, solutions containing wt% EEC, 1 wt% IPB, and 0-3 wt% pigment were mixed together for 24 hours in dark conditions. The solutions were then spread onto aluminum substrates using a draw bar to achieve the desired uniform coating thickness (40 or 80 µm). The coated panels were then illuminated for various times, using a 200 W Hg-Xe arc lamp. The output of the lamp was passed through a water filter to eliminate infrared light, resulting in an overall irradiance of 50 mw/cm 2. The wavelength range of interest was determined to be nm, corresponding to the overlap between the photoinitiator absorbance spectrum and the lamp emission spectrum. The irradiance in this range was determined to be 5 mw/cm 2, measured using a calibrated miniature fiber optic spectrometer (USB4000, Ocean Optics, Inc.) The photopolymerization was carried out under atmospheric conditions and at room temperature. After exposure, the panels were stored at room temperature. The cure time required for macroscopic property development was determined by characterizing the surface tack and the adhesion to the substrate at regular intervals. Once full property development was achieved, the thickness of the coating was obtained by a micrometer (micro-tri-gloss µ, BYK Gardner). 3.3 Results and Discussion Photoinitiator, Photolysis Product, and Pigment Absorptivities A number of investigators have shown that free-radical photoinitiators typically exhibit significant photo-bleaching [36-38] since the absorption of
33 17 the photolysis products is lower than that of the original photoinitiator. Photobleaching is important for photo-curing of thick systems since it allows light to penetrate deeper beneath the illuminated surface upon production of active centers [39-43]. Photobleaching during cationic photopolymerizations has received considerably less attention in the literature, and the degree of photobleaching of most cationic photoinitiators has not been characterized. Table 3-1 shows the molar absorptivity as a function of the incident wavelength (for the wavelengths of interest in this study) for the both the original cationic photoinitiator (IPB) and the photolysis products. This table illustrates that, although the IPB photoinitiator exhibits some photobleaching upon photolysis, the molar absorptivity of the photolysis products is significant (average 34% of the photoinitiator absorptivity). Table 3-1. Napierian molar absorptivities (L/mol-cm) for photoinitiator (ε i ) and photolysis products (ε p ) for incident wavelengths λ (nm) εi εp εp/ε i 295 2,736 1, , , , , , , , , , , ,
34 18 The optical properties of the pigments play an important role for the potential photopolymerization of pigmented coatings. In general, pigments may reduce light penetration by absorption, scattering or reflection of the incoming light, therefore the radiative flux in a pigmented sample can be characterized by accounting for these effects. This has been accomplished for highly reflective pigments, such as titanium dioxide, by describing the specular and diffuse reflectance using a four-flux model [44]. In one study of Pigment Red 254, Jahn and Jung [45] found the reflectance contribution to be negligible for pigment particles smaller than 100 nm. Similarly, for a matrix containing carbon black pigments, Tesfamichael et al. [46] found that the contribution of the reflectance was insignificant for incident wavelengths below 500 nm. The system under investigation meets both of these criteria since the mean particle size is less than 30 nm and the initiating light falls in a narrow wavelength region where the UV photoinitiator absorption overlaps with the 200 W Hg-Xe arc lamp emission ( nm). To confirm the particle size distribution of the carbon black nanoparticles used in this study, dilute solutions of CB-35 in propylene carbonate solvent were evaluated using DLS. These results showed the samples to exhibit a monodisperse and unimodal distribution of particle sizes. The DLS histogram shown in Figure 3.1 gives a mean hydrodynamic radius of 29.2 nm. These observations suggest that the reflectance and scattering effects can be neglected for the small, monodisperse carbon black particles used in this study. To confirm that the absorption is linearly dependent upon the CB-35 pigment loading, the direct transmittance in the wavelength range of interest ( nm) was measured as a function of the pigment mass concentration. A plot of the transmittance at 300 nm as a function of CB-35
35 19 concentration in propylene carbonate is shown in Figure 3.2. The effective absorptivity was found to be 22.9 L/g-cm. This value for the pigment absorptivity remains constant over the incident wavelength range, and was used throughout the remainder of this chapter. Figure 3.1. DLS histogram with mean hydrodynamic radius = 29.2 nm Transmittance at 300 nm R² = Concentration (g/l) Figure 3.2. Transmittance vs. concentration of CB-35 in propylene carbonate at 300nm. Effective absorptivity = 22.9 L/g-cm.
36 Determination of the Active Center Concentration Profiles Produced During Illumination An accurate description of the spatial photoinitiation profiles produced during the illumination step is necessary to predict the depth of cure in a pigmented system. The evolution of the light intensity gradient and the corresponding active center concentration profiles were found using the following set of differential equations for polychromatic illumination, including diffusion of the initiator and photolysis products: C i (z, t) t = C i (z, t) N h A j ε φ I (z, t) ij j j + D i ν j 2 C i (z, t) 2 z (3.1) C p (z, t) t = C i (z, t) N h A j ε φ I (z, t) ij j j + D p ν j 2 C z (z, t) p 2 (3.2) I j (z, t) = [ε ijc i (z, t) + ε pjc z p (z, t) + a CBj C CB Here, z is the direction perpendicular to the illuminated surface, with z=0 at the illuminated edge. The subscript j is an index with a different value for each wavelength of light under consideration; Ci(z,t) is the initiator molar concentration at depth z and time t; Cp(z,t) is the photolysis product molar concentration at depth z and time t; I(z,t) is the incident light intensity of a specific wavelength at depth z and time t with units of mw/cm 2 ; εi is the initiator Napierian molar absorptivity at a specific wavelength with units of L/mole-cm; εp is the photolysis product Napierian molar absorptivity at a specific wavelength with units of L/mole-cm; acb is the carbon black pigment Napierian absorptivity at a specific wavelength with units of L/g-cm; CCB is the carbon black pigment mass concentration in units of g/l; φi is the quantum yield of the initiator at a specific wavelength, defined as the fraction of absorbed photons that lead to fragmentation of the initiator; NA is + A m ]I j (3.3)
37 21 Avogadro s number; h is Plank s constant; v is the frequency of light in units of inverse seconds; Di is the diffusion coefficient of the initiator in units of cm 2 /sec; Dp is the diffusion coefficient of the photolysis products; and Am is the absorption coefficient of the monomer and the polymer repeat unit with units of 1/cm. Note that the Napierian absorptivities are used because they are most natural for the differential version of the absorption equation (Equation 3). The quantum yield for IPB is 0.7 and the diffusion coefficients are 1 x 10⁻⁷ cm 2 /sec [47]. For a polymerization system of thickness zmax which is illuminated at the planar surface in which z = 0, the following initial and boundary conditions apply [31,32]: C z i, p = C C i p (z,0) (z,0) 0 at z = 0 and I(0, t) = = C = 0 I o o z = z max (3.4) (3.5) (3.6) (3.7) Equation 3.4 states that the initial initiator concentration, Co, is uniform throughout the depth of the sample. Similarly, Equation 3.5 indicates that the initial photolysis product concentration is zero throughout the sample. Equation 3.6, the no-flux boundary condition, indicates that there is no transport of initiator or photolysis product across the illuminated surface or the opposite boundary (typically an interface with a substrate). Finally, Equation 3.7 states that the light intensity on the illuminated surface is constant and equal to the initial intensity, I o.
38 Active Center Concentration Profiles for Infinitely Thick Systems To demonstrate the effect of the carbon black pigment on the photoinitiation process, it is useful to examine simulation results for an infinitely thick system where zmax =. Simultaneous solution of Equations yields profiles of light intensity and initiator concentration as functions of depth at various instants in time for an infinitely thick system. Figure 3.3 contains plots of the light intensity as a function of depth for two different EEC systems: unpigmented (Figure 3.3a) and pigmented with 3 wt% CB-35 (Figure 3.3b). The figure illustrates that the presence of the carbon black has a marked effect on the initial light intensity gradient in the sample. In the pigmented case, the light intensity drops to a value of essentially zero in less than 60 µm. In contrast, for the unpigmented case the initial light intensity is still 75% of the incident value at a depth of 60 µm, and retains more than 10% at a depth of 500 µm. The photobleaching described in Table 1 leads to the change in the gradient with increasing illumination time for the unpigmented system (Figure 3.3a), but is found to be negligible for the pigmented system (Figure 3.3b) due to the strong absorption by the pigment. Since the rate of consumption of the photoinitiator at a given depth increases with increasing total light intensity (as described in Equation 3.1), the initial rate is highest at the illuminated surface, and is zero anywhere in which the total light intensity is zero. Therefore, a photoinitiator concentration gradient will be established immediately upon illumination, and will evolve with time in a manner described by the simultaneous solution of Equations
39 23 Figure 3.3. Profiles of the initial total light intensity summed over initiating wavelengths ( nm) a) no pigment, b) 3 wt% CB-35. Monomer: EEC, Initiator: 1 wt% IPB. For example, Figure 3.4 shows profiles of the photoinitiator concentration as a function of depth with increasing illumination time for the cationic photopolymer system with and without 3 wt% CB-35 pigment. These results illustrate that in the case of the pigmented system (Figure 3.4b), the photoinitiator is depleted rapidly at the surface of the sample where the light intensity is highest, but the photoinitiation reaction does not extend much beneath the surface due to the light attenuation caused by the strongly absorbing pigment. As a result, the pigmented system exhibits sharp gradients in both the light intensity (Fig. 3.3b) and the initiator concentration (Figure 3.4b). Compared to the unpigmented system (Figure 3.4a), the steep concentration gradient results in a stronger driving force for diffusion of the initiator and photolysis products, therefore the diffusive contributions during illumination are much more important for the pigmented systems. Diffusion of the photoinitiator during the illumination
40 24 period is responsible for the concentration change that takes place at depths where the light intensity is zero (depths greater than 60 µm). Figure 3.4. Profiles of photoinitiator concentration after 2 minutes illumination. a) no pigment, b) 3 wt% CB-35. Monomer: EEC, Initiator: 1 wt% IPB. The local rate of active center generation is equal to the product of the local initiator concentration and the local light intensity summed over the initiating wavelengths [31,32]. Since the cationic active centers are essentially non-terminating, and each photoinitiator molecule leads to the formation of a single active center molecule, the cationic active center concentration, CAC, at a given depth, z, and time, t, can be determined from the integrated form of the rate equation: C AC t ( z, t) = C ( z, t) [ I( z, t)] φ ε dt (3.8) 0 i j j j ij Figure 3.5 shows the evolution of the active center concentration profiles during the 5 minute illumination time for two different pigment loadings. The 3 wt% pigmented system in Figure 3.5b shows the active center concentration profiles within the first 300 µm of an infinitely thick
41 25 system, resulting from the light intensity shown in Figure 3.3b and the photoinitiator concentration shown in Figure 3.4b. These results are compared with the active center concentration profiles for a 2 wt% pigmented system shown in Fig. 3.5a. The concentration of active centers generated at the illuminated surface of the sample is slightly higher for the 2 wt% system. The concentration drops off quickly to a value of zero within the first ~200 µm of sample depth for the 3 wt% pigmented system. Figure 3.5. Profiles of active center concentration for infinite thickness during 5 minutes of illumination. a) 2 wt% CB-35, b) 3 wt% CB-35. Monomer: EEC, Initiator: 1 wt% IPB Active Center Concentration Profiles for Pigmented Coatings For coatings of a finite thickness, the active center concentration profiles predicted during the illumination period differ from those for an infinitely thick system due to the no-flux boundary condition at the interface between the coating and the substrate. Figure 3.6 shows the active center concentration profiles throughout the depth of an 80 µm thick coating during 5 minutes of illumination for 2 wt% CB-35 (Figure 3.6a) and 3 wt% CB-35 (Figure 3.6b).
42 26 Figure 3.6. Profiles of active center concentration for 80 µm thick coatings during 5 minutes of illumination. a) 2 wt% CB-35, b) 3 wt% CB- 35. Monomer: EEC, Initiator: 1 wt% IPB. In contrast to the infinitely thick case (Figure 3.5), the concentration gradients for the 80 µm coatings are not as steep at a given illumination time. This arises from the fact that the diffusion of the active centers is confined to the finite thickness of the coating, therefore the concentration at the interface increases more rapidly with time. For example, the active center concentration at the bottom of the 80 µm thick 2 wt% pigmented coating after 5 minutes of illumination is mol/l (from Figure 3.6a), whereas the value at the position of 80 µm depth in the infinitely thick system (Figure 3.5a) is mol/l. The comparison between Figures 3.6a and 3.6b reveals the effect of the pigment loading on the active center concentration profiles. An increased pigment loading decreases the active center concentration at a given location and time, due to the effect of the pigment on the light intensity gradient.
43 27 The effect of the interface no-flux boundary condition on resulting active center profile becomes more pronounced as the coating thickness is reduced, as illustrated in Figure 3.7. Figure 3.7. Profiles of active center concentration for 2 wt% CB-35 pigmented coatings ranging from 40 µm to infinitely thick. a) 2 minutes of illumination, b) 5 minutes of illumination. Monomer: EEC, Initiator: 1 wt% IPB. Figures 3.7a and 3.7b show the active center concentration profiles at specific illumination times (2 minutes and 5 minutes respectively) for coating thicknesses ranging from 40 µm to infinitely thick, for 2 wt% CB-35. The figure illustrates that the active center concentration profiles for the infinitely thick systems decrease relatively sharply and reach a value of zero concentration at a depth of 140 µm for a two minute illumination time and 220 µm for an illumination time of five minutes. The profiles for the infinitely thick case provide an asymptotic limit for the coatings of finite thickness. Specifically, the active center concentration profiles approach those of the infinitely thick case as the coating thickness is increased or the illumination time is decreased. The figure also illustrates that the active center concentration profile becomes more uniform throughout the thickness
44 28 of the coating as the thickness is decreased or the illumination time is increased. These trends arise from the fact that the diffusion of the active centers is confined to the finite thickness of the coating. In the case of the 40 µm thick coating, the concentration is nearly uniform throughout the thickness of the coating after 5 minutes of illumination Post-illumination Diffusion of Active Centers in Pigmented Coatings During the illumination period, active center profiles decrease sharply with depth, resulting in a concentration gradient and therefore a driving force for diffusion. Diffusion of the active centers during the postillumination period is described by Fick s Second Law 2 C AC (z, t) C AC (z, t) = D AC 2 (3.9) t z where CAC corresponds to the concentration of active centers, and DAC is the diffusion coefficient of active centers in cm 2 /sec. The initial condition for the active center concentration as a function of depth is the profile obtained by applying Equation 8 at the end of the illumination period for each desired depth increment. In addition, the no-flux boundary condition indicates that there is no transport of initiator or photolysis product across the illuminated surface (z = 0) or the substrate boundary (z = zmax). C AC ( z, t ) = 0 at z = 0 and z = z max (3.10) z The diffusion coefficient for active centers generated by the IPB photoinitiator in the cycloaliphatic diepoxide containing 1 wt% carbon black was determined using the method described in the experimental section. Experimental cure depths for a 1 wt% carbon black pigmented system are shown in Figure 3.8. The effective diffusion coefficient was determined by
45 29 fitting this data to the diffusion equation, and was found to be 1 x 10⁻⁷ cm 2 /sec, which is a reasonable value for reactive diffusion in which the active centers migrate by propagating with unreacted monomers [27]. Reactive diffusion has been identified as the primary mode for active center mobility in free-radical polymerizations of multifunctional acrylates [48] and cationic polymerizations of divinyl ethers [34,49]. 1 Shadow Cure Distance (mm) Square Root Time (hours 1/2 ) Figure 3.8. Shadow cure distance versus square root of time for a 1 wt% carbon black pigmented system. Monomer: EEC, Initiator: 1 wt% IPB, Exposure Time: 5 min. Numerical solution of Equations 3.9 and 3.10 yields profiles of the active center concentration diffusing with increasing post-illumination time into a pigmented coating of finite thickness. Figures 3.9a and 3.9b show the active center profiles for an 80 µm coating pigmented with 2 wt% and 3 wt% CB-35, respectively, with increasing post-illumination time. As shown previously in Figure 3.6, the active center concentration profile exhibits a gradient at the end of the illumination period. Figure 3.9 indicates that the active center
46 30 concentration becomes uniform throughout the thickness of the 80 µm coating within 10 minutes post-illumination due to diffusion of the active centers. The comparison between Figures 3.9a and 3.9b illustrates that the final uniform active center concentration increases as the pigment loading is decreased since a higher fraction of the photoinitiator undergoes photolysis as the competitive absorption by the pigment is decreased. Figure 3.9. Active center concentration profiles diffusing post-illumination in an 80 µm thick pigmented coating. a) 2 wt% CB-35, b) 3 wt% CB- 35. Monomer: EEC, Initiator: 1 wt% IPB, Exposure time: 5 min. Shorter illumination times were used to demonstrate the postillumination diffusion of active centers in a 40 µm pigmented coating. According to the results shown previously in Figure 3.7, the active center concentration profile was nearly uniform throughout the thickness of the coating after 5 minutes of illumination. But after only 3 minutes of illumination, the active centers produced near the surface of the coating were able to diffuse post-illumination, as shown in Figures 3.10a and 3.10b, for 2 wt% and 3 wt% pigment loadings, respectively.
47 31 Figure Active center concentration profiles diffusing post-illumination in pigmented coating (40 µm thick). a) 2 wt% CB-35, b) 3 wt% CB-35. Monomer: EEC, Initiator: 1 wt% IPB, Exposure time: 3 min. For the thinner 40 µm coatings, the active centers can only diffuse over half the distance. The concentration profile therefore becomes uniform within half the time (5 minutes post-illumination) compared with the 80 µm coatings in Figure 3.6 (10 minutes post-illumination) Kinetic Analysis for Prediction of Cure Times In pigmented coating applications, the cure time required to reach macroscopic property development (tmpd) is especially important since it determines when a coated substrate may undergo additional process steps that involve contact with the surface. At this time, the exposed surface of the coating must be tack-free, and the cure on the bottom of the coating, where it interfaces with the substrate, must be sufficient to ensure effective adhesion. For pigmented systems polymerized cationically, the time required to achieve
48 32 cure at the bottom determines the t mpd, since there is no oxygen inhibition at the exposed surface and the light intensity is the lowest at the bottom of the sample. For this reason, a conservative criterion of a 35% epoxide conversion at the bottom interface was established to predict the tmpd. The tmpd was estimated by obtaining the active center concentration profiles at the bottom interface using Equations 3.8 (for the illumination period) and 3.9 (for the shadow cure period) and entering these profiles into the integrated form of the polymerization rate equation for cationic polymerization, shown below. (3.11) where tmpd is the cure time required to reach macroscopic property development, kp is the propagation rate constant, and mf/mi is the ratio of final monomer concentration to initial monomer concentration. Figure 3.11 contains plots of the active center concentration at the bottom interface as a function of time for 80 µm EEC coatings containing three different pigment loadings. In this figure, the system is illuminated for the first five minutes (active center concentration given by Equation 3.8), while the final ten minutes correspond to shadow cure (the active center concentration is determined by solving Equations 3.9 and 3.10). The figure illustrates that the active center concentration reaches a plateau when the active center concentration becomes uniform throughout the thickness of the coating. Increasing the pigment concentration leads to a reduced active center concentration at the bottom interface at any given time, including the plateau value when the active center concentration is uniform throughout the depth. As explained previously, this trend arises from the competitive absorption by the carbon black pigment which reduces the total number of active centers created during illumination.
49 Active Center Concentration (mol/l) Time (min) wt% CB 35 2 wt% CB 35 3 wt% CB 35 Figure Active center profiles for various CB loadings at bottom interface of 80 µm thick coating. Monomer: EEC, Initiator: 1 wt% IPB, Pigment: 1-3 wt% CB-35, Exposure Time: 5 min. The data shown in Figure 3.11 were integrated numerically to estimate the post-illumination cure time (tmpd) by applying Equation 3.11, using the independently measured propagation rate constant described in the experimental section. However, Equation 3.11 is only valid if the carbon black neither catalyzes nor inhibits the reaction. Depending upon the method of preparation and surface treatment, the surface electronegativity of the pigment can vary from strongly acidic to strongly basic. Based upon a standard test for characterizing the acidity or basicity of pigments, the CB-35 pigment used in this study was reported to be basic (a ph of 9 from the ISO test method was reported by the manufacturer [50]). For cationic photopolymerizations of pigmented coatings, a basic carbon black is preferable to ensure that the system has a desirable shelf-life. Formulations
50 34 used in these experiments were stable over several months. However, due to this basicity, the CB-35 carbon black acts as an inhibitor to the cationic photoinitiator in addition to absorbing the initiating light. Therefore, the active center concentration used in Equation 11 was taken to be the generated concentration shown in Figure 3.11 minus an inhibited active center concentration which is proportional to the carbon black loading. The value of the inhibited concentration was found to be mol/l for each 1 wt% loading of carbon black. Figure 3.12 shows a comparison between the experimentally determined tmpd values and the theoretical values calculated using the procedure described above. In this figure, each data point corresponds to at least three independent experiments with the standard deviation indicated by the error bars. Recall that the tmpd corresponds to the time after the illumination has ceased during which the long-lived active centers continue to react and diffuse into the thickness of the coating. Figure 3.12 indicates good agreement between the experimental and theoretical values of the postillumination time required for macroscopic property development, indicating that the criterion of 35% cure at the bottom of the sample is reasonable. In addition, the data illustrate some interesting effects of illumination time and coating thickness. The illumination time is an important process variable since it determines the number of active centers produced, and therefore available for diffusion and cure. For this reason, the tmpd decreases with increasing illumination time, especially at short illumination times. As the coating thickness is increased, the required cure time increases significantly at a given illumination time.
51 Experimental (80 micrometers) Experimental (40 micrometers) Predicted (80 micrometers) Predicted (40 micrometers) t mpd (min) Illumination Time (min) Figure Comparison of predicted with experimental cure times (tmpd) at bottom interface of 40 µm and 80 µm thick coatings for varying illumination times. Monomer: EEC, Initiator: 1 wt% IPB, Pigment: 2 wt% CB-35. The time for macroscopic property development is of significant practical importance since it corresponds to the earliest time in which the polymerized ink or coating can be subjected to further processing steps without risk of damaging the surface or losing adhesion to the substrate. Using the analytical approach described above, the effects of the illumination time and the pigment loading on the post-illumination tmpd were investigated more thoroughly. Figure 3.13 contains plots of the tmpd as a function of the illumination time for three different pigment loadings (1, 2, and 3 wt.%) and two different thicknesses (40 and 80 µm in Figure 3.13a and b respectively). Recall that active centers are produced (and polymerization occurs) during the illumination time, and that the long-lived active centers continue to
52 36 propagate after the illumination has ceased. The post-illumination tmpd will have a value of zero if the system cures during the illumination time (for example, the 1 wt% pigment, 40 µm, five minute illumination time case). For this reason, all of the plots will approach a value of zero as the illumination time is increased. If the illumination time is too short to produce enough active centers, the post-illumination tmpd will go to infinity. The threshold illumination time required to cure the coating increases with increasing pigment loading due to the inhibitory effect of the basic carbon black pigment. Comparison between Fig. 13a and b shows that the thicker coatings require longer illumination times for a given post-illumination tmpd. Figure Predicted cure times (tmpd) at bottom interface of coatings pigmented with 1-3 wt% CB-35. a) 40 µm thickness, b) 80 µm thickness. Monomer: EEC, Initiator: 1 wt% IPB. 3.4 Conclusions In this contribution, the ability of long-lived cationic active centers to effectively cure coatings pigmented with carbon black has been investigated. The slightly basic, monodisperse carbon black pigment with a mean hydrodynamic radius of 29.2 nm used in these studies was found to act as a
53 37 mild inhibitor of the cationic photopolymerization. The light intensity gradient and photoinitiator concentration gradient for polychromatic illumination were determined for the pigmented system. The strong absorption by the carbon black resulted in sharp gradients in the pigmented systems. Consequently, the photoinitiator diffusion during the illumination period was found to have a marked effect on the resulting active center concentration profiles. Analysis of the active center reactive diffusion during the post-illumination period revealed that migration of the active centers leads to cure beyond the illuminated depth. The propagation rate equation coupled with the active center concentration profiles yielded theoretical cure times for the pigmented coatings. The coating thickness and pigment loading were found to be important variables in the time required for macroscopic property development. The long lifetimes and mobility of cationic active centers result in effective photopolymerization of carbon black pigmented coatings, and this comprehensive approach could be applied to other types of pigmented systems.
54 38 CHAPTER 4 CATIONIC ACTIVE CENTER MOBILITY IN PHOTOPOLYMERIZATION SYSTEMS WITH COMPLEX GEOMETRIES 4.1 Introduction Photopolymerization is becoming a state-of-the-art technology for curing coatings on two-dimensional substrates. However, when the need arises for coating complex, three-dimensional objects, traditional photopolymerization suffers several disadvantages. Photopolymerizations are typically dependent upon the generation of extremely short-lived freeradicals that are sensitive to termination by oxygen. And since the freeradical photopolymerization reaction proceeds only in the presence of UV irradiation, the reaction terminates when the UV irradiation ceases. In order to successfully use free-radical photopolymerization for coating a threedimensional substrate, such as an automobile body, first, the environment would need to be made inert to prevent oxygen inhibition. Secondly, complete irradiation of the entire substrate surface would be required, including recessed or shaded regions of the three-dimensional object. For these reasons, free-radical photopolymerizations fail to provide a practical and economical method for coating surfaces with irregular or intricate shapes. Some of the methods being developed to overcome these problems for curing coatings on three-dimensional objects include plasma curing [18], which involves placing the coated substrate effectively within the light source; dual-cure systems [19-21], which require simultaneous thermal and photochemical curing mechanisms; and robotic UV curing [22], which uses
55 39 mechanical means of directing irradiation into recessed or shaded regions of the substrate. In this chapter, the use of cationic photopolymerization for multi-dimensional cure will be investigated. Cationic photopolymerization is an alternative to free-radical photopolymerization offering several unique advantages, especially for use in curing coatings on substrates with complex geometries. The cationic active centers generated in this type of photopolymerization exhibit extremely long lifetimes. They are not sensitive to free-radical scavengers, such as oxygen, and do not terminate by a radicalradical termination mechanisms. The long-lived cationic active center lifetimes can result in photopolymerization reactions that proceed long after irradiation has ceased, until the monomer is consumed or the active centers are entrapped in the polymer matrix. Several investigators have shown cationic active centers to lead to dark cure, or post-polymerization, especially in the types of epoxide monomers used for cationic photopolymerization [24-26]. Due to their long lifetimes and tendency to diffuse, cationic active centers can also be responsible for a process known as shadow cure, or cure in regions that have never been illuminated [27]. The mobility of the cationic active centers facilitates cationic cure in recessed or shadow areas of a substrate that have not been directly exposed to irradiation. This chapter provides a theoretical and experimental investigation of shadow cure in multiple spatial dimensions in cationically photopolymerized systems. The fundamental differential equations describing the polychromatic photoinitiation process are solved to obtain profiles of the active center concentration as a function of time and depth in the illuminated regions of the coating. During the illumination period, the active centers are preferentially generated at the surface to produce a sharp concentration
56 40 gradient that provides a driving force for diffusion into regions of unexposed monomer. Using the active center concentration profile at the end of the illumination period as the initial condition for the differential diffusion equation allows the spatial evolution of the active centers to be determined after the illumination has ceased. First, this analysis is used to describe the cationic active center concentration profiles in two spatial dimensions: the direction of the illuminating light, as well as a direction perpendicular to the light source. Second, photopolymerizations of cationically polymerizable monomer coatings are performed, with a portion of a two-dimensional substrate shaded from the initiating light. The coatings are shown to shadow cure in the shaded region, and experimental measurements are compared with theoretical predictions of cure distance by coupling the post-illumination diffusion analysis with the propagation rate equation. Finally, a novel method is presented in which cationic shadow cure is utilized to cure coatings with multiple layers using a single illumination step. The results of this research show that photopolymerization of systems with complex geometries can be made possible by the mobility of cationic active centers. 4.2 Shadow Cure in Two Spatial Dimensions Governing Equations For a photopolymerization system of rectangular cross-section subject to uniform polychromatic illumination normal to the top surface, the set of differential equations which govern the evolution of the light intensity gradient and initiator concentration gradient for polychromatic illumination [31,32] are shown below:
57 41 C i (z, t) t = C i (z, t) N h A j ε φ I (z, t) ij j j + D i ν j 2 C i (z, t) 2 z (4.1) C p (z, t) t = C i (z, t) N h A j ε φ I (z, t) ij j j + D p ν j 2 C z (z, t) p 2 (4.2) I j (z, t) = [ε ijc i (z, t) + ε pjc z p (z, t) + A m ]I j Here, the subscript j is an index with a different value for each wavelength of light under consideration; Ci(z,t) is the initiator molar concentration at depth z and time t; Cp(z,t) is the photolysis product molar concentration at depth z and time t; I(z,t) is the incident light intensity of a specific wavelength at depth z and time t with units of energy/(area * time); εi is the initiator Napierian molar absorptivity of a specific wavelength with units of volume/(length * mole); εp is the photolysis product Napierian molar absorptivity of a specific wavelength with units of volume/(length * mole); φi is the quantum yield of the initiator at a specific wavelength, defined as the fraction of absorbed photons that lead to fragmentation of the initiator; NA is Avogadro s number; h is Plank s constant; v is the frequency of light in units of inverse seconds; Di is the diffusion coefficient of the initiator in units of length 2 /time; Dp is the diffusion coefficient of the photolysis products; and Am is the absorption coefficient of the monomer and the polymer repeat unit with units of inverse length. Note that this is the Napierian molar absorptivity because it is most natural for the differential version of the absorption equation (Equation 4.3). For a photopolymerization system of thickness zmax which is illuminated at the planar surface where z = 0, the following initial and boundary conditions apply: (4.3)
58 42 C z i, p = C C i p (z,0) (z,0) 0 at z = 0 and I(0, t) = = C = 0 I o o z = z max (4.4) (4.5) (4.6) (4.7) Equation 4.4 states that the initial initiator concentration, C0, is uniform throughout the depth of the sample. Similarly, equation 4.5 indicates that the initial photolysis product concentration is zero. Equation 4.6, the no-flux boundary condition, indicates that there is no transport of initiator or photolysis product across the illuminated surface or the opposite boundary (typically an interface with a substrate). Finally, Equation 4.7 states that the light intensity on the illuminated surface is constant and equal to the initial intensity, I o. The solution to this set of equations provides detailed information regarding the time-evolution of the light intensity gradient and the initiator concentration gradient. For an accurate description of initiation with polychromatic illumination, the light intensity gradient at each incident wavelength must be individually described. As shown in equation 4.3, the intensity of an individual wavelength is attenuated by absorption of the initiator, monomer and polymer repeat units, and the photolysis product. Since the local initiator concentration depends upon all of the incident wavelengths, and the local light intensity of each wavelength depends upon the initiator concentration, the time-evolution of all of the light intensities are coupled to one another, and therefore the complete set of differential equations must be solved simultaneously. Unlike the previous chapter where the photoinitiator diffusion was found to be important for highly pigmented systems, in transparent systems the diffusion effects have been shown to be
59 43 negligible for relatively low initiator concentrations of photobleaching initiators. Therefore the diffusion terms in Equations 4.1 and 4.2 were neglected for the purposes of this chapter. The local rate of active center generation is equal to the product of the local initiator concentration and the local light intensity summed over the initiating wavelengths. Since the cationic active centers are essentially nonterminating, and each photoinitiator molecule leads to the formation of a single active center molecule, the cationic active center concentration, CAC, at a given depth, z, and time, t, can be determined from the integrated form of the rate equation: C AC t ( z, t) = C ( z, t) [ I( z, t)] φ ε dt (4.8) 0 i j j j ij In this manner, active center concentration profiles as a function of time and depth are determined during the illumination period. These resulting active center concentration profiles can then be used as an initial condition for determining the mobility of active centers during the postillumination period. Post-illumination diffusion of the active centers in one spatial dimension (the direction of the illuminating light) during the postillumination period is described by Fick s Second Law: C AC (z,t) = t D AC 2 C AC (z,t) (4.9) 2 z where CAC corresponds to the concentration of active centers, and DAC is the diffusion coefficient of active centers in cm 2 /sec. The initial condition for the active center concentration as a function of depth is the profile obtained by applying Equation 4.8 at the end of the illumination period for each desired depth increment. In addition, the no-flux boundary condition indicates that
60 44 there is no transport of initiator or photolysis product across the illuminated surface (z = 0) or the substrate boundary (z = zmax). C (z,t) AC = 0 at z = 0 and z = z max (4.10) z Post-illumination diffusion of cationic active centers into a second spatial dimension (both in the direction of the illuminating light and in a perpendicular direction) can be described using the following form of Fick s law in two spatial dimensions: C 2 2 AC (x,z,t) C AC (x,z,t) C AC (x,z,t) = D AC (4.11) t x z In this equation, x represents the direction perpendicular to the illuminating light, or the width of the sample. CAC(x,z,t) is the active center molar concentration at depth z, width x, and time t; and DAC is the diffusion coefficient of the active center in units of cm 2 /sec. Again, the initial condition for this equation is the active center concentration profile obtained at the end of the illumination period. Again, no flux boundary conditions were used for the illuminated surface (z = 0) and the edge of the sample width (x = 0): C (x,z = 0,t) C AC = 0 AC (x = 0,z,t) = 0 (4.12) z x Results and Discussion Active Center Concentration Profile Produced During Illumination Equations were solved numerically using the method of finite differences to obtain a profile of the active center concentration as a function of depth during a five minute illumination period for a system containing the monomer EEC and 1 wt% of the photoinitiator IPB. Molar absorptivity
61 45 values for the monomer, photoinitiator, and photolysis products were determined using methods described in Chapter 3. Detailed spectral information for the light source used in this simulation study (200 W Hg/Xe arc lamp) was also obtained using methods described Chapter 3. Figure 4.1 shows the active center concentration profile obtained for the EEC/IPB system as a function of sample depth after 5 minutes of illumination with the Hg/Xe lamp. This profile falls off rapidly with depth, and therefore exhibits a sharp gradient and a considerable driving force for diffusion. Due to light attenuation by the photoinitiator, the active centers are only produced up to a depth of approximately 0.3 cm Concentration of Active Centers (mol/l) Depth (cm) Figure 4.1. Active center concentration profile at the end of the illumination period. Monomer: EEC, Initiator: 1 wt% IPB, Exposure time: 5 minutes Post-illumination diffusion of cationic active centers It is convenient to consider the active center generation step and the active center diffusion step separately since each step is driven by different fundamental processes and occurs on different timescales. In the one-
62 46 dimensional case in which the concentration depends only upon depth, the diffusion and shadow cure occur in the same direction as the initial illumination, and the shadow region begins at the depth at which the light does not reach due to optical density of the system. Therefore, the one dimensional shadow cure case is relevant for situations in which the light does not penetrate through the entire depth of the sample, for example thick systems and pigmented systems. Note that for the EEC/IPB system described in Figure 4.1, the lower boundary condition (z = zmax) does not come into play for the sample thickness of 0.4 cm or greater, as shown in the figure. The effective shadow cure diffusion coefficient for active centers generated by the IPB photoinitiator in the cycloaliphatic diepoxide EEC was measured for thick systems in one spatial dimension using a previously described experimental protocol [27], and was determined to be 3 x 10⁻⁶ cm 2 /sec, which is a reasonable value for reactive diffusion in which the active centers migrate by propagating with unreacted monomers. Reactive diffusion has been identified as the primary mode for active center mobility [34, 48, 49]. Numerical solution of the second-order partial differential diffusion equations (Equations 4.9 and 4.10) yields profiles of the active center concentration diffusing with increasing post-illumination time, or shadow cure time, in the z-direction. The resulting active center concentration profiles shown in Figure 4.2 demonstrate that there is a steep gradient at the end of the illumination period (the initial condition shown in Figure 4.1) which becomes more uniform throughout the thickness of the sample with increasing shadow cure time. This theoretical description of shadow cure can be extended to the multidimensional case in which diffusion can occur in directions perpendicular to the initial illumination. Figure 4.3 shows a schematic of the

 0.025 0.")

 0.25 0.3 0.35 0.4 Figure 4.2.")


63 47 representative geometrical configurationn that was chosen to investigate shadow cure in two spatial dimensions. Concentration of Active Centers (mol/l) minutes shadow cure 10 minutes 30 minutes 1 hour 2 hours Depth (cm) Figure 4.2. Active center concentration profiles diffusing with ncreasing shadow cure time. Monomer: EEC, Initiator: 1 wt% IPB, Exposure time: 5 min. Figure 4.3. Geometrical configuration for shadow cure in two spatial dimensions. Rectangular cross-section of sample with depth z and width x.
64 48 The configuration shown in Figure 4.3 is a simple geometry for a system with depth z and width x. In this configuration, the illumination area of width xi is exposed to the light source, and the shadow area of width xs is masked. Profiles of the cationic active centers diffusing into the shadow region were determined by applying Equations 4.11 and 4.12, again to the initial condition shown in Figure 4.1. Figures 4.4a through 4.4f illustrate the cationic active center concentration profiles obtained for the configuration illustrated in Figure 4.3. The simulation results for this representative case of two-dimensional shadow cure illustrate that as the shadow cure time increases from zero to 50 minutes, the active center profile broadens and extends deeper into the sample in the z-direction, as it did in the onedimensional shadow cure case described in Figure 4.1. In addition, Figure 4.4 illustrates that active centers diffuse into the unilluminated region behind the mask in the x-direction with increasing post-illumination time. Figure 4.4a shows the vertical concentration gradient at the end of the illumination period between the illuminated region and the shaded region (where x = 0.4). Since this concentration gradient is steeper at the interface between the illuminated and masked regions, the driving force for diffusion is higher in the x-direction than it is in the z-direction. This method for describing shadow cure in multiple spatial dimensions can be applied to other configurations in which a region of the photopolymer is shaded from the illuminating light.

 5 minutes, d) 10 minutes, e) 25 minutes,")
65 Figure 4.4. Active center concentration profiles in two spatial dimensions (x and z). a) end of illumination period, b) 2.5 minutes shadow cure, c) 5 minutes, d) 10 minutes, e) 25 minutes, and f) 50 minutes. Monomer: EEC, Initiator: 1 wt% IPB, Exposure time: 5 minutes. 49


66 Shadow Cure Perpendicular to th he Direction of Illumination Experiments were conducted to demonstratee the ability of cationic active centers to migrate into unilluminated regions, resulting in shadow cure. In order to measure the distance over which the cationicc active centers migrate, or diffuse, post-illumination in a second spatial dimension (perpendicular to the direction of illumination), thin epoxide coatings were photopolymerized on aluminumm panels with a portion of the coating shaded from the illuminating light source, as shown in the schematicc in Figure 4.5. The governing equations for active center generation and diffusion into a second spatial dimension (Equations ) were then solved to obtain the concentration profiles representative of this experimental setup, and theoretical results were compared with experimental findings. Figure 4.5. Schematic representation of shadow cure experiments used to measure cationic active center migration perpendicular to the direction of illumination.
67 Materials and Experimental Methods The cationically polymerizable monomer 3,4-epoxy-cyclohexylmethanyl 3,4-epoxy-cyclohexanecarboxylate (EEC, Sigma Aldrich) was used in these experiments. The photoinitiator used was (tolycumyl) iodonium tetrakis (pentafluorophenyl) borate (IPB, Secant Chemicals). Methanol solvent was used for UV/Visible spectroscopy. The absorbance spectra for the monomer, photoinitiator, and photolysis products were determined in one nanometer increments using an 8453 UV-Visible spectrophotometer (Agilent Technologies). For the monomer and photoinitiator, the spectra were obtained for dilute solutions (10-2 M and 10-3 M respectively) in methanol placed in an air-tight, quartz cell to prevent any changes in concentration due to evaporation of the solvent. To obtain the absorbance spectra after photolysis, the photoinitiator samples were illuminated with a 200 Watt Hg- Xe arc lamp (Oriel Light Sources) until there was no change in the absorbance spectrum. Molar absorptivities before and after photolysis for IPB are reported in Chapter 3. Solutions containing 97 wt% EEC and 3 wt% IPB were mixed together for 24 hours in dark conditions. The solutions were then spread evenly onto 3 in. by 6 in. aluminum substrates (Q-Lab) using a draw bar to achieve the desired uniform coating thickness. The coated panels were then covered with a coverplate to shade part of the panel, and irradiated using a LC6B bench top conveyer equipped with a F300S lamp system (Fusion UV Systems, Inc.). This lamp was equipped with a 13 mm H type bulb, and the irradiance was measured at the surface of the conveyer using UV integrating radiometer (EIT, Inc.) which gave an irradiance measurement in the UVB range of 1.9 W/cm 2. The irradiation time was controlled by the speed of the conveyer. The photopolymerization was carried out under atmospheric conditions and

68 52 at room temperature. The distance to which the coating cured within the shaded region was determined by characterizing the surface tack and the adhesion to the substrate at regular intervals using a dental probe. The cure distance was then measured with calipers. Once full property development was achieved, the thickness of the coating was obtained using a micrometer (micro-tri-gloss µ, BYK Gardner) Results and Discussion Experimental Results Aluminum panels coated with 80 µm of the EEC/IPB mixture were irradiated using the experimental configuration described above. The conveyor belt speed was set at 4 ft/min, giving an approximate illumination time of 3 sec. The photo in Figure 4.6 shows an example of the resulting shadow cure in the unilluminated region of a panel that progressively cured illuminated region 2 cm cured shadow region Figure 4.6. Photo showing illuminated region and shadow cure region of cured epoxide coating on aluminum panel. Monomer: EEC, Initiator: 3 wt% IPB, Exposure time: 3 sec.
69 53 over 30 minutes post-illumination. The edge of the illuminated region can be seen as a faint line corresponding to the black mark on the side of the panel which marked the position of the cover plate. As shown in the photo, the photopolymer cured almost 2 cm into the shaded region of the coating after 30 minutes. The shadow cure distance was measured as a function of postillumination time using the method described. The numerical values recorded for shadow cure distance are shown in Figure 4.7. The shadow cure progressed in a linear fashion for approximately 30 minutes (18 mm) after which time the shadow cure front stopped. The unreacted monomer beyond the shadow cure front remained unpolymerized for days/weeks postillumination Shadow cure distance (mm) Time (min) Figure 4.7. Experimental measurements of shadow cure distance into shaded region over 30 minutes post-illumination time. Monomer: EEC, Initiator: 3 wt% IPB, Exposure time: 3 sec. Control experiments were performed to verify that no polymerization took place on a panel coated with the EEC/IPB mixture which was completely shaded from the light source, yet processed through the fusion lamp
70 54 conveyor. No noticeable heat was generated in the panels, and a temperature indicator on the UV radiometer used to measure the light source intensity showed an increase in temperature through the conveyer/lamp system of only 3-5 C, indicating that very little thermal polymerization, if any, could have taken place Post-illumination Diffusion and Kinetics Equations were solved numerically to determine the active center concentrations produced in the illuminated region of the coating. Figure 4.8 shows the active center concentration as a function of the depth during the 3 second illumination period. Due to the high intensity of the light source, the photoinitiator is completely consumed, resulting in the active center concentration reaching a maximum value (equal to the initial photoinitiator concentration) within the 3 seconds of illumination. Therefore the active center concentration is considered to be uniform throughout the 80 µm thick coating after the 3 seconds of illumination with the Fusion lamp Active Center Concentration (mol/l) second 1 second 2 seconds 3 seconds Depth (micrometers) Figure 4.8. Active center concentration profiles throughout the 80 µm coating depth throughout the 3 second illumination time.
71 55 Since the active center concentration profile in the illuminated region is uniform throughout the thickness of the coating, diffusion of the active centers in the direction of the illuminating light (z-direction) does not occur. Therefore, this coating configuration can now be modeled as a one-spatial dimension problem. Using Equations 4.11 and 4.12 (with the z-terms in the equations removed), the active centers diffusing into the shaded regions in the direction perpendicular to the illuminating light (the x-direction) were described. The effective shadow cure diffusion coefficient used for this analysis was 1 x 10⁻⁴ cm 2 /sec, which was determined by fitting the experimental data shown in Figure 4.7 to the diffusion equation. Figure 4.9 shows the resulting active center concentration profiles diffusing during 30 minutes post-illumination for a 2 cm illuminated region (left side of Figure 4.9) and the first 2 cm of the shaded region (right side of Figure 4.9). Active Center Concentration (mol/l) end of illumination time 5 minutes shadow cure 10 minutes shadow cure 20 minutes shadow cure 30 minutes shadow cure Width (cm) Figure 4.9. Active center concentration profiles diffusing into the shadow region (x-direction) with increasing shadow cure time. Monomer: EEC, Initiator: 3 wt% IPB, Exposure time: 3 seconds.
72 56 The active center concentration profile begins as a vertical gradient at the end of the illumination time, and progressively becomes more uniform as the active centers from the illuminated region diffuse into the shaded region with increasing post-illumination time. In coating applications, the cure time required to reach macroscopic property development (tmpd) is especially important since it determines when a coated substrate may undergo additional process steps that involve contact with the surface. At this time, the exposed surface of the coating must be tack-free, and the cure on the bottom of the coating, where it interfaces with the substrate, must be sufficient to ensure effective adhesion. The tmpd was estimated by obtaining the active center concentration profiles at given positions within the shadow cure region, and entering these profiles into the integrated form of the polymerization rate equation for cationic polymerization, shown below. (4.13) The tmpd is the cure time required to reach macroscopic property development, kp is the propagation rate constant, and mf/mi is the ratio of final monomer concentration to initial monomer concentration. A conservative criterion of a 35% epoxide conversion was established to predict the tmpd, and the kp for EEC was determined previously to be 0.1 L/mol-sec (see Chapter 3 for details). Figure 4.10 contains plots of the active center concentration as a function of post-illumination time at various positions in the shadow cure region (x-direction). The figure illustrates that the active center concentrations increase rapidly at positions close to the illuminated edge (2-4
73 57 mm into the shadow cure region) and increase very slowly at positions much farther from the illuminated region (16-20 mm into the shadow cure region). Active Center Concentration (mol/l) Time (min) 2 mm 4 mm 8 mm 12 mm 16 mm 20 mm Figure Cationic active center concentration as a function of time at various positions in the shadow cure region (x-direction). Monomer: EEC, Initiator: 3 wt% IPB, Exposure time: 3 seconds. The data shown in Figure 4.10 were integrated numerically to estimate the post-illumination cure time by applying Equation Figure 4.11 shows a comparison between the experimentally determined cure times (from Figure 4.7) and the theoretical values predicted using this method. This figure indicates very good agreement between the experimental findings and theoretical predictions. The shape of the plot shown in Figure 4.11 is very interesting because both the experimental data and model predictions demonstrate a linear dependence of shadow cure distance on time. The shadow cure front progresses linearly with time until diffusing active centers are depleted or until they become trapped in the polymer matrix.
74 Shadow cure distance (mm) Time (min) Experimental Results Predicted cure time Figure Experimental measurements of shadow cure distance into shaded region over 30 minutes post-illumination time. Monomer: EEC, Initiator: 3 wt% IPB, Exposure time: 3 seconds. The data in Figure 4.9 indicate that the active centers are diffusing from the entire 2 cm width of the illuminated region of the 80 µm thick coatings. The diffusion analysis was again employed to determine whether the shadow cure distance is dependent upon the width of the illuminated region, which can be considered a reservoir of active centers. Figures 4.12a and b illustrate the effect of the illuminated width. Figure 4.12a shows active center concentration profiles as a function of the x-direction for a 1 cm wide illumination width. The active centers diffuse approximately 3 cm into the shaded region (4 cm on the x-axis), dropping off to a value of zero at this position after approximately 30 minutes post-illumination. Figure 4.12b shows the active center concentrations migrating over the same shadow cure distance, 3 cm into the shaded region after 30 minutes post-illumination, for a much wider illumination width of 4 cm. These results suggest that unless
75 59 the width of the active center reservoir is so narrow that the active centers are completely depleted (less than a few millimeters) the shadow cure distance remains independent of the illuminated width. a) Active Center Concentration (mol/l) end of illumination time 5 minutes shadow cure 10 minutes shadow cure 20 minutes shadow cure 30 minutes shadow cure Width (cm) b) Active Center Concentration (mol/l) end of illumination time 5 minutes shadow cure 10 minutes shadow cure 20 minutes shadow cure 30 minutes shadow cure Width (cm) Figure Active center concentration profiles diffusing into the shadow region (x-direction) with increasing shadow cure time for a) 1 cm illuminated width, and b) 4 cm illuminated width. Monomer: EEC, Initiator: 3 wt% IPB, Exposure time: 3 sec.
76 Shadow Cure Through Multiple Coating Layers Many commercial coatings contain multiple layers with the composition of each layer selected to promote the properties required for that layer. For example, some layers may primarily promote adhesion, impart color, or change optical properties, while other layers may primarily impart scratch resistance or other desirable mechanical properties. Curing multiple layers using thermal polymerization generally requires a complete cure cycle, which can include application of a monomer followed by heating for an extended period of time for each individual layer. This process is cumbersome, time intensive, and increases the cost of the coating. Examples of industries which use multi-layered coatings include automotive bodies, furniture and cabinetry, and resilient flooring. The remainder of this chapter presents a method for photopolymerizing multi-layered coatings. In this method, long-lived cationic centers that are photo-generated in only one layer of a multi-layered coating lead to cure in multiple layers, even if the layers are added after illumination. Rather than illuminate each layer individually after application of the monomer, this method requires only one illumination step to cure a coating containing multiple layers. For example, when a second layer of monomer is applied to a previously photopolymerized sub-layer, cationic active centers created in the sub-layer can migrate into the monomer coating applied on top. Therefore a fully cured coating comprised of two or more layers can be completely cured using only one illumination step. An additional advantage of this method is that cationic active centers can be used to cure pigmented coatings. In the method described, one or more of the layers in a multi-layered coating may contain pigments. Longlived cationic active centers have been shown to fully polymerize single-
77 61 layered pigmented coatings (see Chapter 3). However, pigmented coatings often require multiple layers to be polymerized. For example, automotive body coatings can require application of a pigmented layer followed by a protective clear coat. This method could be used to photo-cure a pigmented layer containing cationic photoinitiator, followed by a clear coat application that can be fully cured without further illumination. Because this method reduces the number of illumination steps required and has the potential for use in pigmented coatings, it will be of potential commercial value in many industries where multiple layer protective coatings are utilized Experimental Methods The experimental setups for two examples of the method introduced above are illustrated in Figures 4.13 and In the first set of experiments, Figure 4.13, the bottom layer only of a two-layer coating was illuminated. A mixture of typical epoxide monomers commonly used for cationic photopolymerization was mixed with 1 wt% of either one of two cationic photoinitiators: (tolycumyl) iodonium tetrakis (pentafluorophenyl) borate (IPB, Secant Chemicals) or diaryliodonium hexafluoroantimonate (IHA, Sartomer). The monomer mixture contained 70 wt% 3,4-epoxycyclohexylmethanyl 3,4-epoxycyclohexane-carboxylate (EEC, Sigma Aldrich) and 29 wt% 2-butoxymethyl-oxirane (BMO, Hexion Specialty Co.). BMO was added to reduce viscosity so that monomer solutions could be sprayed onto the aluminum substrate using an airbrush. These experiments were conducted both with and without an additional 1 wt% of the pigment Titanium Dioxide (TiO 2, Dupont) added to the monomer/ photoinitiator mixture in the bottom layer. This layer was then irradiated for 10 minutes using a 200 Watt Hg-Xe arc lamp (Oriel Light Sources) with a measured irradiance of 50 mw/cm 2. A

.")
 the bottom layer, containing monomer and photoinitiator, is illuminated.")


78 62 layer of the same monomer mixture containing no photoinitiator was then sprayed on top of the cured layer. The coated panels were stored at atmospheric conditions and room temperature, and monitored to determine the time required to obtain a tack-free surface. Once polymerized, the thickness of the coating was measured using a micrometer (micro-tri-gloss µ, BYK Gardner). a) b) Figure Pictorial representation of the experimental setup for bottom layer only illumination. a) the bottom layer, containing monomer and photoinitiator, is illuminated. b) the second layer of monomer is added, which cures with no further illumination. Arrows indicate diffusion of active centers into unilluminated layer. In a second set of experiments, Figure 4.14, the top layer only of a twolayer coating was illuminated. A mixture containing 70% by weight CDE and 30% by weight BMO was sprayed onto an aluminum substrate using an airbrush. A second layer containing the same monomer mixture with 1% by weight IPB photoinitiator was sprayed over the top of the unpolymerized bottom layer. This experiment was conducted both with and without an additional 1 wt% of the pigment TiO 2 added to the monomer/photoinitiator mixture in the top layer. The two-layer coating was then irradiated for 10 minutes using the Hg-Xe arc lamp. The photopolymerization was carried out


79 63 under atmospheric conditions and at room temperature. The coated panels were monitored to determine the time required to obtain a tack-free surface. Once polymerized, the thickness of the coating was measured using a micrometer. Figure Pictorial representation of the experimental setup for top layer only illumination. a) a layer of monomer only is applied to a substrate. b) a second layer of monomer containing photoinitiator is added and illuminated, resulting in cure of the entire film. Arrows indicate diffusion of active centers into unilluminated layer Results and Discussion In the first set of experiments illustrated in Figure 4. 13, the bottom layer was illuminated for 10 minutes with the Hg-Xe lamp. The active centers then diffused into the top layer, which was applied post-illumination. This resulted in overall cure and full property development for both layers. Table 4.1 summarize the experimental results for various combinations of monomer, photoinitiat tor, and pigment, and gives the overall thickness of the final cured coatings. These results illustrates that the overall shadow cure of the unilluminated layer is complete within 1-2 hours regardless of the constituentss of the layers.
80 64 Table 4-1. Results of shadow cure through multiple layers: bottom layer illuminated only Bottom Layer Top layer Exposure time (min) Time to tack-free (hrs) Average thickness (µm) EEC/BMO/1 wt% IHA EEC/BMO only ± EEC/BMO/1 wt% IPB EEC/BMO only EEC/BMO/1wt% IPB EEC/BMO/1wt% IPB/ 1wt% TiO2 EEC/BMO/1wt% IPB EEC/BMO/ 1wt% IPB EEC/BMO only EEC/BMO/ 1wt% TiO In the second set of experiments, illustrated in Figure 4.14, two successive layers were sprayed onto the panels, one on top of the other using an airbrush. The two layered coating was then illuminated for 10 minutes with the Hg-Xe lamp. In these experiments, the bottom layer contained only monomer, with no photoinitiator. Both layers cured within the illumination time regardless of the constituents of the layers. Table 4.2 lists the combinations of monomer, photoinitiator, and pigment that were used in the two layers, as well as the overall thickness of the final coatings. Table 4-2. Results of shadow cure through multiple layers: top layer illuminated only Bottom Layer Top layer Exposure time (min) Time to tack-free (hrs) Average thickness (µm) EEC/BMO EEC/BMO/ 1wt% IPB EEC/BMO EEC/BMO/ 1wt% IPB/ 1 wt% TiO
81 65 In both sets of experiments, the cationic active centers were able to diffuse into an unilluminated layer containing no photoinitiator. The driving force for this phenomenon is considered to be the concentration gradient between the two layers. The films cured completely within 1-2 hours regardless of the constituents of the layers, and the cure time was not affected by the presence of pigment in the illuminated layer. The results of these experiments have shown this method to be a novel use of cationic photopolymerization for curing multi-layer coatings. 4.5 Conclusions The long lifetimes and mobility of cationic active centers have been shown in this chapter to provide a solution to some of the limitations to photopolymerizion of systems with complex shapes. First, the theoretical description for post-illumination diffusion of cationic active centers was applied in two spatial dimensions. This information provides a fundamental understanding of shadow cure in multiple dimensions. Secondly, this approach was used to predict shadow cure distance in a direction perpendicular to the illumination for cationically polymerized epoxide coatings by coupling the diffusion analysis with the kinetic rate equation. These results showed very good agreement between theoretical predictions and experimental findings which showed that the coatings were able to shadow cure over substantial distances. Finally, a novel method was introduced in which multiple layers of epoxide coatings can be cured using only a single illumination step. This method is made possible by the mobility of the cationic active centers, which diffuse into the unilluminated layers. All of these aspects of shadow cure show that cationic photopolymerization may
82 66 have tremendous potential in many applications where curing systems with complex geometries are required.
83 67 CHAPTER 5 THE POTENTIAL OF FREE-RADICAL SHADOW CURE 5.1 Introduction The long-lived cationic active centers discussed previously in this contribution have shown great potential for mobility, resulting in cure of unilluminated regions of a photopolymer. Free-radical active centers have significantly shorter lifetimes, and tend to terminate immediately upon cessation of the illuminating light source. However, some cutting edge applications for photopolymers may necessitate the use of shadow cure in free-radical systems, specifically in some electronics applications. Advances in microelectronics have led to an increase in demand for fine pitch technology, which is defined as electronic surface mount components that contain interconnections whose pitch, or spacing, is on the order of 100 to 600 µm. Despite the extremely short lifetimes of the free-radical active centers, mobility of free-radicals within these increasingly small dimensional scales is becoming a possibility. An example of an application in which free-radical shadow cure in photopolymerizations may become feasible is polymer-based conductive adhesives. These types of adhesive materials are becoming more widely used in the electronics industry as a substitute for lead-based solders [9]. Electrically conductive adhesives provide an environmentally friendly solution for interconnections in many electronics applications requiring fine pitch. Isotropic conductive adhesives (ICAs) are heat-curable materials containing an isotropic concentration of conductive particles, typically silverfilled epoxides, that allow current to flow in all directions through the cured polymer. These adhesives can be used to electrically interconnect non-
84 68 solderable substrates such as ceramics or plastics, or to replace solder for thermally-sensitive components. ICAs can be used to replace tin/lead solder for surface mounting on printed circuit boards, where the increasing density of discrete components soldered onto the surface is reaching a limit. A second type of electrically conductive adhesive is anisotropic conductive adhesive, which allow current to flow along a unidirectional axis [8]. This type of adhesive is a composite containing fine electrically conductive particles uniformly dispersed in a polymer matrix. The design of these anisotropic conductive adhesive materials results in no direct contact between the conductive particles, but allows for electrical interconnection only at planned sites where the particles come into direct contact with a conductive substrate. The most common form these adhesives is a heatcurable, thermoplastic, anisotropic conductive film (ACF) used for flexible printed circuits. Ninety percent of all ACFs are currently sold for use in flat panel displays such as LCDs [10]. They are also used in flexible printed circuits, in which electronic circuits are mounted on flexible plastic substrates. Flexible printed circuits are being used in many applications, such as electronic books and other forms of electronic paper, displays for cameras and cell phones, and computer keyboards. Figure 5.1 shows a schematic of the interconnection process for a typical flexible printed circuit assembly containing an ACF. A polymer resin containing conductive particles is laminated between two printed circuits. A specified temperature and pressure are applied until contact is made between the electrodes on the printed circuits and the conductive particles between them. As a result, current is allowed to travel in the z-direction only, and not in the x/y plane. Mechanical integrity of the assembly is maintained by the cured adhesive film.


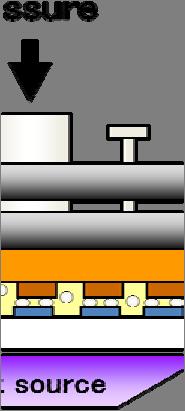

85 69 Figure 5.2 shows a schematic for a proposed photopolymerization process thatt could be used to cure an ACF. In this case, the heating step can be eliminated by photocuring through a transparent substrate using an appropriate light source. Advantages of replacing the heat-curing process with photopolymerization include: protecting the heat-sensitive circuits from elevated temperatures; minimizing cure times; eliminating the heat source, resulting in energy savings; and eliminating the use of solvents, thereby minimizing emissionss of volatile organic compounds and reducing the need for solvent vapor handling systems. Figure 5.1. Flexible printed circuit assembly using heat-curablee ACF. Figure 5.2. Flexible printed circuit assembly using proposed photopolymerizable ACF.
86 70 The remainder of this chapter discusses an investigation of one possible formulation that could be used in a photopolymerizable ACF assembly, such as the one proposed in Figure 5.2. One primary consideration in selecting a photopolymer system for this application is to attain full polymerization in unilluminated regions, behind electrodes and around conductive particles. These regions are shaded from the initiating light source, and it is important that these shadow regions cure to an acceptable conversion. A second consideration is that the substrate through which the ACF is illuminated may be only partially transparent, and may limit the initiating wavelengths. This chapter first discusses the selection process for both the photoinitiator and illuminating light source chosen for this application, and then characterizes shadow cure behind the electrodes for the chosen system. 5.2 Selection of Photoinitiator and Light Source for a Photopolymerizable ACF The majority of flexible circuits are printed on polyimide films, which are chosen for their superior thermal stability [51,52]. Using polyimide film as a substrate through which an ACF can be cured by photopolymerization presents a particular challenge since this material absorbs wavelengths below 500 nm. This problem prohibits the use of UV light for this application, and requires selection of a visible light photoinitiator system for this application. Appropriate light sources and photoinitiation systems were selected for effective photopolymerization through polyimide film Materials and Experimental Methods The monomer used in these experiments was 2-hydroxyethyl acrylate (HEA, Sigma Aldrich). The photosensitizers evaluated in this study included
87 71 Eosin Y (spirit-soluable), 3-hydroxy-2,4,5,7-tetraiodo-6-fluorone (H-Nu 535, Spectra Group, Inc.), Erythrocin B, Rose Bengal, and Camphorquinone. Except for the H-Nu 535, all photoinitiators were acquired from Sigma Aldrich. These photosensitizers were used in combination with the electron donor N-methyl-diethanolamine (MDEA, Sigma Aldrich). The absorption spectra for the monomer and photoinitiators were determined in one nanometer increments using an 8453 UV-Visible spectrophotometer (Agilent Technologies). The emission spectra of the illuminating light sources were collected using measured using a calibrated miniature fiber optic spectrometer (USB4000, Ocean Optics, Inc.) Monomer conversion was measured using Fourier transform infrared spectroscopy (FTIR), which has become a standard method for analyzing photopolymerization systems [53,54]. For each of these studies, a droplet of monomer was placed between two rectangular IR grade sodium chloride salt crystal slides, with 15 μm Teflon beads placed between both ends of the slides to serve as spacers. Infrared spectra were collected using a modified Bruker 88 FTIR spectrometer designed to accommodate a horizontal sample. The infrared absorption spectra were obtained before, during, and after illumination. The =C H infrared absorbance peak at 812 cm -1, which is associated with an out-of-plane vibration, has traditionally been used to monitor acrylate conversion [53]. Conversion was calculated using Equation 5.1: % Conversion (5.1) where A0 is the absorbance at 812 cm -1 before irradiation, and At is the absorbance at time t. The absorbance is found by measuring the baseline corrected peak height for the =C H out-of-plane band at 812 cm -1.
88 Results and Discussion Selection of Initiating Light Source for Photo-curing Through Polyimide Films In order to effectively cure acrylate resins through polyimide film, the emitted wavelengths of the illuminating light source must be matched with the absorptivity spectrum of visible light photoinitiator (which was in turn selected based upon the wavelengths transmitted through the film). Mercury arc lamps are by far the most common light source used in industrial photocure processes. However, an alternative light source was necessary for use in this investigation since the mercury arc lamps emit very little light above 500 nm. Significant advances have been made in developing light emitting diodes (LEDs) to provide high intensity in the visible region of the spectrum. LEDs offer many advantages over traditional broad-spectrum lamps, the most important of which is high efficiency resulting in relatively low energy consumption. In addition, LEDs can instantly be switched on and off, are ideal for heat sensitive materials (no stray IR emission), have long lifetimes (on the order of tens of thousands of hours of lamp life), do not contain hazardous vapors, and are light-weight/compact for customizable design and scaling. Since these advantages make LEDs ideal for photo-curing applications, a high-intensity green LED (PhlatLight, Luminus Devices, Inc.) was selected for illuminating the visible-light photopolymerization systems evaluated in this study. A 150 W xenon light source (MAX-150, Asahi Spectra) was also selected which provides higher intensity that the LED lamp. Both light sources provide illumination in the nm range required for this application, and do not interfere with the absorptivity of the polyimide film. The emission spectra for both lamps, along with the polyimide film absorptivity, are shown in Figure 5.3. The emission spectra
89 73 were collected using the miniature fiber optic spectrometer positioned 8 cm from the light source. The total irradiance in this wavelength region (the integrated peak area from nm) was 130 mw/cm 2 for the xenon lamp and 10 mw/cm 2 for the green LED. The 150 W xenon lamp is therefore a much more efficient and highly intense light source across the entire visible region than the LED. Absolute irradiance (µw/cm 2 /nm) Absorbance (AU) Wavelength (nm) Xe lamp irradiance Green LED irradiance Polyimide film absorbance Figure 5.3. Absolute irradiance of 150 W xenon lamp and high intensity green LED compared with absorbance of polyimide film Visible Light Photoinitiator Systems Selected for Photo-curing Through Polyimide Films Illumination through a polyimide film necessitates the use of visible light photoinitiators. Unlike typical ultraviolet photoinitiators, the energy of a photon in the visible region of the spectrum is generally less than the bond dissociation energy for most organic compounds, including photoinitiators. Therefore, visible-light-induced initiator systems are generally bimolecular initiator systems in which the active centers are produced via electron
90 74 transfer followed by proton transfer from the electron donor to the excited photosensitizer [55]. Five photosensitizers compatible with the wavelength range of the illuminating light required were screened for use in this study, in combination with the electron donor MDEA. FTIR conversion was measured for HEA monomer containing concentrations of 0.07 wt% of photosensitizer and 2.5 wt% MDEA. The 15 µm films were laminated between NaCl slides as described in section 5.2.1, and illuminated for 1 minute with the green LED held 4 inches from the sample. Table 5-1. Overall conversions by FTIR for various visible light photoinitiators illuminated with green LED for one minute 8 cm from light source. Photoinitiator Monomer Photoinitiator wt% MDEA wt% Conversion Eosin Y HEA % H-Nu 535 HEA % Erythrocin B HEA % Rose Bengal HEA < 30 % Camphorquinone HEA < 30 % A comparison between the five photosensitizers shown in Table 5-1 reveals that Eosin Y was found to provide the highest HEA conversion as measured by FTIR. The absorption spectrum and molecular structure of the neutral form (spirit soluble) of Eosin Y is shown in Figure 5.4. The electron-transfer/proton-transfer reaction between Eosin Y and MDEA shown in Figure 5.5 has been previously investigated [56]. The triplet state of Eosin Y, [EYss]*, and the amine, A-H, form an exciplex similar to that described for other dyes and amines.
91 O Absorbance Units Br HO Br O C Br OH Br O Wavelength (nm) Figure 5.4. Eosin Y (spirit soluble) absorbance spectrum and molecular structure (0.001 wt% Eosin Y in methanol) Eosin Y, spirit soluble hν [EYss] [EYss] + MDEA [Exciplex] O O C OH C OH Br Br Br Br HO O OH HO Br O Br O H 3 C CH 2 CH 2 OH N CH 2 CH 2 OH Br Br CH 2 CH 2 OH + H 2 C N CH 2 CH 2 OH Figure 5.5. Direct reaction between Eosin Y spirit soluble and MDEA [56].
92 76 As shown in Figure 5.5, the exciplexx decomposes in the last step of the mechanism by an electron-proton transferr step to form an amine radical, A, and a dye based radical. The amine radical, A, becomes the active initiator species. The amine radicals themselves suppress oxygen inhibition by the consumption of oxygen in a radical chain process: (5.2) (5.3) Many investigators have illustrated that the effectiveness of a component electron transfer initiator system, such as the two- one shown in Figure 5.5, can be enhanced by the addition of a third component, such as an iodonium salt. However, ionic species may be undesirable for the photocurable ACF application proposed in this contribution due to the possible corrosive effects of the salt on the conductive elements of the flexible printed circuit. In order to enhance the conversion of the two-component Eosin Y/MDEA system, a nonionic hydroperoxide was investigated for use as a chemical scavenger of dissolved oxygen. Cumenee hydroperoxide has been used to enhance the conversion of typical 3-component visible-light photoinitiation systems, and has been shown to increase conversion over the dye/amine system alone [57]. An examplee of a reaction mechanism by which cumene hydroperoxide may consume dissolved oxygen is shown in Equation 4, which shows the hydroperoxide reacting with the amine to form additional amine radicals, whichh in turn consume more dissolved oxygen according to Equation (5.4)
93 77 The addition of 0.15 wt% cumene hydroperoxide (Sigma Aldrich) to the two-component Eosin Y/MDEA visible light photoinitiator system resulted in a 10% increase in conversion measured by FTIR. The overall conversion for the 3-component system was further increased by replacing the LED light source with the 150 W xenon lamp. Figure 6 summarizes the average conversion for 3 or more experiments for 2 minute and 1 minute xenon lamp illumination times (95% and 92% for bars (a) and (b) respectively) compared with experiments illuminated using the green LED, both with and without the addition for the cumene hydroperoxide additive (87% and 77% for bars (c) and (d) respectively). a) Illuminated for 2 min. with Xe lamp (Eosin Y/MDEA/Cumene Hydroperoxide) b) Illuminated for 1 min. with Xe lamp (Eosin Y/MDEA/Cumene Hydroperoxide) c) Illuminated for 1 min. with green LED (Eosin Y/MDEA/Cumene Hydroperoxide) d) Illuminated for 1 min. with green LED (Eosin Y/MDEA only) 60% 70% 80% 90% 100% FTIR Conversion Figure 5.6. Summary of FTIR conversion results for HEA films using Eosin Y/MDEA photoinitiator system with cumene hydroperoxide. The optimal 95% conversion shown in Figure 5.6a, for the 3-component system illuminated for two minutes with the xenon lamp, may be representative of a desirable conversion for an application such as ACF. Kinetic profiles of this optimized 3-component visible-light induced polymerization were investigated using real-time FTIR. FTIR spectra were
94 78 collected at 1 second increments throughout the two minute irradiation period, and Eqn. 1 was used to calculate the change in conversion as a function of time. The results are shown in Figure 5.7. The contribution from dark cure to the overall conversion after the light was shuttered off is about 1%. Conversion 100% 90% 80% 70% 60% 50% 40% 30% 20% 10% 0% Time (min) Figure 5.7. Real-time FTIR conversion during 2 minute illumination with 150 W xenon lamp. Because the proposed ACF application may require illumination through a polyimide film, the effect of the polyimide absorbance on the overall conversion was investigated. FTIR was again used to measure the HEA conversion. In these experiments, a polyimide film of desired thickness was placed over the NaCl slides during the illumination. The IR spectra were measured before and after illumination, and overall conversion was calculated using Equation 5.1. Since the polyimide film absorbs strongly in the IR region of the spectrum, real-time FTIR measurements were not possible for these experiments. These results are summarized in Figure 5.8 below. When illuminated through polyimide films, the conversion for the
95 79 optimized 3-component photoinitiator HEA system containing cumene hydroperoxide was reduced to 90% and 80% for the 25 µm and 75 µm polyimide film thicknesses respectively. a) Illuminated for 2 min. with Xe lamp (No polyimide film) b) Illuminated for 1 min. with Xe lamp (No polyimide film) c) Illuminated for 1 minute with Xe lamp (25 µm polyimide film) d) Illuminated for 1 minute with Xe lamp (75 µm polyimide film) 60% 70% 80% 90% 100% FTIR Conversion Figure 5.8. FTIR conversion for HEA films using 3-component Eosin Y photoinitiator system. Although the addition cumene hydroperoxide was shown to enhance the overall conversion in HEA films over the two-component visible light photoinitiator system alone, the cumene hydroperoxide may possibly be an undesirable additive from a manufacturing perspective. Therefore, experiments were conducted to optimize the 2-component system containing only Eosin Y and MDEA, in an attempt to obtain the same level of conversion as the 3-component system (>90% conversion). To meet this objective, several molar concentration ratios of MDEA/Eosin were screened, ranging from 180 to 250 mol MDEA per mol Eosin Y. These studies revealed an optimal molar ratio of approximately 250 mol/mol, and this ratio was maintained for the next set of studies in which the overall concentration was varied to identify the global optimum. Figure 5.9 shows the results of the concentration study,
96 80 and indicates the optimum composition of the 2-component system: wt% Eosin Y and 3.69 wt% MDEA. Conversion (%) Optimum Composition: wt% Eosin Y 3.69 wt% MDEA Eosin Y Concentration (wt%) Figure 5.9. Optimization of 2-component Eosin Y system. Conversions calculated by FTIR. 1 minute illumination with 150 W Xe lamp. Kinetic profiles of the optimized 2-component visible-light induced polymerizations were investigated using real-time FTIR. Real-time kinetic data were collected during illumination, and the corresponding profiles of the conversion as a function of time are shown in Figure The data in the figure illustrate that the real time conversion profile for the optimized 2- component system at least as high as that of the original 3-component initiator system at all times. The overall conversion for both samples at one minute, when the light was shuttered off, was approximately 92%. The contribution from dark cure to the overall conversion after the light was shuttered off is about 0.5%. These FTIR data reveal that the optimized 2-componet initiator system results in an overall conversion of 92% (for one minute illumination) with no additional additives. Therefore, the same approximate level of conversion
97 81 that was achieved with the 3-component system including cumene hydroperoxide has been accomplished with the optimized 2-component system containing only Eosin Y and MDEA alone. Conversion 100% 90% 80% 70% 60% 50% 40% 30% 20% 10% 0% Time (min) With Cumene Hydroperoxide Without Cumene Hydroperoxide Figure Real-time FTIR conversion during 1 minute illumination with 150 W xenon lamp. HEA monomer, Eosin Y photoinitiator system with and without cumene hydroperoxide. Based upon the mechanistic considerations shown in Equations , it is possible to speculate on the reason that the 2-component system containing excess amine performs as well as the 3-component initiator system containing cumene hydroperoxide. Equation 5.4 indicates that the hydroperoxide reduces the oxygen inhibition by interacting with the amine to produce amine radicals. These amine radicals in turn consume oxygen as shown in Equations 5.2 and 5.3. However, Figure 5.5 illustrates that the Eosin dye also interacts with the amine to produce the same amine radicals. This is the reason that the increased concentrations of the Eosin Y and the amine can have the same effect on the reaction kinetics as the addition of the hydroperoxide.
98 Characterization of Shadow Cure Materials and Experimental Methods The optimized visible light photoinitiator systems described above were used to photopolymerize 100 µm thick HEA films representative of the proposed ACF system. Transparent electrode-imbedded polyimide films were used as a substrate through which an acrylate resin was photo-cured, similar to the ACF system depicted in Figure 5.2. Acrylate films were produced by placing a droplet of monomer sample into a 1 cm 2 PET spacer with a thickness of 100 µm. The spacer and monomer were laminated between an electrode imbedded polyimide film on the top surface, and a coated separation film on the bottom surface. The laminated film was then placed on a black surface, and illuminated from the top down for 1 minute using the 150 W xenon lamp 8 cm from the sample. To visually observe the degree of cure, the films were removed from the substrates, placed onto glass slides, and observed with a polarized optical microscope (Nikon Corporation) Results and Discussion Visualization of the Spatial Cure Profile for Illumination Through an Electrode- Containing PET Film Since the electrodes imbedded in the substrate are opaque, they serve to shade, or mask, alternating regions of the resulting photopolymer from the initiating light. Figure 5.11 shows an example of the electrode imbedded polyimide film that was used as a substrate in these experiments, through which the HEA resin was photopolymerized using visible light. The electrodes imbedded in the film shown in Figure 5.11 are 100 µm wide and spaced 100 µm apart. This example is referred to 100 x 100 µm spacing.
99 83 Polyimide films with 50 µm wide electrodes were used for the results presented below (50 x 100 µm spacing). Figure Example of an electrode imbedded polyimide film with 100 x 100 µm electrode spacing. HEA monomer containing the optimized 2-component Eosin Y visible light photoinitiator system was laminated between the electrode imbedded polyimide film and the separation film substrates, and the acrylate was cured using the method described above. The resulting HEA films were easily removed intact from both the separation film and the polyimide film containing the electrodes, and appeared to be fully polymerized by macroscopicc observation. Using the polarized light microscope, the appearances of the illuminated and unilluminated regions were compared. Figure 5.12 shows an optical micrograph of an HEA film containing the 2- component photoinitiator system photopolymerized by illumination with the 150 W xenon lamp for one minute through an electrode imbedded polyimide film. In the illuminated regions of the sample, the pale yellow color is indicative of a transparent region becausee the settings on the polarized light microscope resulted in a pale yellow background when there was nothing in


100 84 the field of view. Within these regions, the Eosin Y was photoreduced, thereby losing its color (photobleached). In contrast, the areas shaded by the gold electrodes appear as a dark pink or light brown color in the polarized light micrograph. The films appeared a pale pink when observed by the naked eye. This color likely arises from the presence of unreacted Eosin Y photoinitiator. Both the yellow and pink regions appear to be fully cured, indicating the possibility of shadow cure. Figure Polarized light micrographs of HEA films containing optimized 2-component Eosin Y photoinitiator system. Illuminated for 1 minute with 150 W xenon lamp throughh a PET film with 50 x100 µm electrode spacing. Due to shadow cure, polymerization may occur even in the unilluminated regions. In order to further understand the effect of shadow cure, the films weree visualized using cross-sectional micrographs. Small cross-sections of the acrylate films described above were cut using a razor blade and placed on microscope slides. Figure 5.13 shows the cross-sectional polarized light micrograph of a film produced by illuminating through a polyimide film with 50 x 100 µm gold electrode spacing.

101 85 Figure Polarized light micrograph showing cross-section of HEA film containing optimized 2-component Eosin Y photoinitiator system. Illuminated for 1 mintue with 150 W xenon lamp through PET film containing 50x100 µm gold electrode spacing. The shape of the top surface of the film arises from the imprint created by the gold electrodes, therefore the regions under the indentations were not illuminated by the xenon lamp. The textured appearance provided by the polarized light microscope indicates that this film may be fully cured polymer through the ~100 µm depth in both the illuminated and unilluminated regions Predicting free-radical active center diffusion into unilluminated regions The generation of free-radical active centers produced during illumination is well understood, and may be described by a previously reported multi-wavelength simulation [31]. For an accurate description of the spatial photoinitiation profiles produced during the illumination step, it
102 86 is important to account for changes in the photoinitiator concentration as the initiator is consumed in the illuminated region. Therefore, the active center generation as a function of position in a sample immediately after the illumination has ceased depends on a number of factors including the light intensity, initial photoinitiator concentration and absorbance, and exposure time. This model is based upon the following set of fundamental differential equations which govern the evolution of the light intensity gradient and initiator concentration gradient for multi-wavelength illumination. The governing equations for light intensity, photoinitiator concentration, and photolysis product concentration were given in Chapter 4 for polychromatic light (Equations ). The solution to this set of equations provides detailed information regarding the time-evolution of the light intensity gradient and the initiator concentration gradient. Simulation results for the 2-component Eosin Y photoinitiator system illuminated with the 150 W xenon lamp are shown in Figure 5.14 and Figure Figure 5.14 shows the light intensity gradient as a function sample depth over a 1 minute illumination period. Initially, the light intensity drops off rapidly at the surface of the sample (where depth = 0). As the photoinitiator absorbs the initiating light and photobleaches, the light then penetrates farther into the depth of the system. At one minute of illumination, the light has fully penetrated up to a few millimeters in depth. The wavelength range used for this analysis was nm, which is the range over which the photoinitiator Eosin Y absorbs.
103 87 60 Light Intensity in nm range (mw/cm 2 ) sec 10 sec 20 sec 40 sec 60 sec Depth (cm) Figure Light intensity profile of a 3-component Eosin Y system initiatied with a 150 W xenon lamp(i o = 60 mw/cm 2 in the nm spectral region). Figure 5.15 shows the depleting concentration of photoinitiator with illumination time. As the initiating light is absorbed at the surface (depth = 0), free-radical active centers are created, and the photoinitiator concentration diminishes. These results illustrate that for a one minute illumination time, the photoinitiator is completely consumed for the first 2 millimeters (2000 µm), indicating films with a thickness less than a few hundred micron will have the same conversion throughout their depth. Therefore, the FTIR studies of 15 µm films are equally valid for films over 100 µm thick.
104 x 10-3 Photoinitator Concentration (mol/l) sec 10 sec sec 40 sec 60 sec Depth (cm) Figure Photoinitiator concentration profile for a 3-component Eosin Y system initiated with a 150 W xenon lamp (I o = 60 mw/cm 2 in the nm spectral region). Previously in this contribution, cationic active centers were shown to migrate after the illumination ceased, resulting in shadow cure in unilluminated regions. A similar analysis was used to predict the diffusion of free-radical active centers into the unilluminated regions of the masked polymer films. Figure 5.16 shows the geometrical configuration used to develop the free-radical diffusion analysis. The shadow regions indicated in the schematic are designed to represent the regions behind the electrodes for the conductive adhesive film application. Within the illumination region, the one-dimensional active center generation model was used to calculate the light intensity and photoinitiator concentration in the z-direction, as shown in Figure 5.14 and Figure 5.15 above.


105 89 Figure Geometrical configuration for analysis of free-radical active center diffusion. Since the results in Figure 5.14 and Figure 5.15 have shown thatt the light intensity and photoinitiator concentration are uniform throughoutt the 100 µm thick films, the post-illumination diffusion analysis can be simplified to a one-dimensional case where free-radical active centers diffuse into the shadow regions in one direction only: the x-directionx n. In addition, due to the periodic nature of the sample geometry resulting from the evenly spaced electrodes, there is a plane of symmetry at the center of each illuminated region and each shaded region. Therefore, the system may be analyzed by considering a single repeat cell that extends from the middle of the illuminated region to the middle of the shaded region. Note that if the cell width of the illuminated region is xi, and the cell shadow width xs, a 100 x 100 µm electrode spacing would give xi = 50 µm, and xs = 50 µm. the Post-illumination diffusion of free-radical active centers from illuminated region into the shadow region is governed by Fick s second law: C AC (x,t) = t D AC 2 C AC (x,t) 2 x (5.5)
Spatial and temporal evolution of the photoinitiation rate in thick polymer systems
 University of Iowa Iowa Research Online Theses and Dissertations 2006 Spatial and temporal evolution of the photoinitiation rate in thick polymer systems Nicole Lynn Kenning University of Iowa Copyright
Synergistic Effect of Hydroxyl-containing Acrylates in Epoxide-Acrylate Hybrid Photopolymerizations Abstract Introduction Experimental Materials
 Synergistic Effect of Hydroxyl-containing Acrylates in Epoxide-Acrylate Hybrid Photopolymerizations Gbenga I. Ajiboye, Julie L. P. Jessop* Department of Chemical & Biochemical Engineering, University of
Modeling of Photoinitiation of Thick Polymers Illuminated with Polychromatic Light
 Modeling of Photoinitiation of Thick Polymers Illuminated with Polychromatic Light Alec Scranton, Nicole Stephenson, and Dane Kriks University of Iowa Department of Chemical and Biochemical Engineering
The potential of cationic photopolymerization's long lived active centers
 University of Iowa Iowa Research Online Theses and Dissertations 2008 The potential of cationic photopolymerization's long lived active centers Beth Ann Ficek University of Iowa Copyright 2008 Beth Ann
Technology offer: Environmentally friendly holographic recording material
 Technology offer: Environmentally friendly holographic recording material Technology offer: Environmentally friendly holographic recording material SUMMARY Our research group has developed a new photopolymer
Spectroscopic Quantification of Kinetic Rate Constants for Epoxy-Acrylate Hybrid Photopolymerization
 Spectroscopic Quantification of Kinetic Rate Constants for Epoxy-Acrylate Hybrid Photopolymerization Brian Dillman University of Iowa, Chemical and Biochemical Eng. Dept., Iowa City, USA Julie L. P. Jessop
A New Dielectrophoretic Coating Process for Depositing Thin Uniform Coatings on Films and Fibrous Surfaces
 A New Dielectrophoretic Coating Process for Depositing Thin Uniform Coatings on Films and Fibrous Surfaces by Angelo Yializis Ph.D., Xin Dai Ph.D. Sigma Technologies International Tucson, AZ USA SIGMA
5. Photochemistry of polymers
 5. Photochemistry of polymers 5.1 Photopolymerization and cross-linking Photopolymerization The fundamental principle of photopolymerization is based on the photoinduced production of a reactive species,
White Paper Adhesives Sealants Tapes
 Fundamental principles of UV reactive manufacturing processes Introduction While the UV systems technology and the appropriate chemistry have been developing continuously, the principle of irradiation
Direct Evaluation Method of UV Curing Process on the Basis of Conductivity Change of Photopolymerization Materials
 IS&T's IS&T s th Annual Conference Direct Evaluation Method of UV Curing Process on the Basis of Conductivity Change of Photopolymerization Materials Yasusuke Takahashi, Sunao Tada, Shoutaro Yamada Department
Photoinitiation, Photopolymerization, and Photocuring
 Jean-Pierre Fouassier Photoinitiation, Photopolymerization, and Photocuring Fundamentals and Applications Hanser Publishers, Munich Vienna New York Hanser/Gardner Publications, Inc., Cincinnati Contents
Connecting the Dots: A New Method to Determine Radiation Yield during Electron Beam (EB) Polymerization Reactions via Raman Spectroscopy
 Polymerization Reactions via Raman Spectroscopy") Honors Theses at the University of Iowa Spring 218 Connecting the Dots: A New Method to Determine Radiation Yield during Electron Beam (EB) Polymerization Reactions via Raman Spectroscopy Renae Kurpius
Honors Theses at the University of Iowa Spring 218 Connecting the Dots: A New Method to Determine Radiation Yield during Electron Beam (EB) Polymerization Reactions via Raman Spectroscopy Renae Kurpius
Application Note: Ocean Optics in the Teaching and Research Laboratories Susquehanna University Department of Chemistry July 2014
 Application Note: Ocean Optics in the Teaching and Research Laboratories Susquehanna University Department of Chemistry July 2014 Authors: Dr. Swarna Basu (Associate Professor of Chemistry), Dr. Wade Johnson
Basic Principles. Fundamental principles of UV reactive manufacturing processes
 Basic Principles Fundamental principles of UV reactive manufacturing processes The Basics Fundamental principles of UV reactive manufacturing processes Chemical curing While the UV systems technology and
The Sensitization of Aliphatic Epoxy Photopolymerization in Epoxy-Acrylate Interpenetrating Polymer Networks
 The Sensitization of Aliphatic Epoxy Photopolymerization in Epoxy-Acrylate Interpenetrating Polymer Networks Tetiana Samoilenko, Nataliia Iarova, Halyna Menzheres, Oleksandr Brovko Institute of Macromolecular
UV-POLYMERIZATION IN THE PRESENCE OF NANOFILLERS CHAP Introduction
 UV-POLYMERIZATION IN THE PRESENCE OF NANOFILLERS 3.1 Introduction The first problem in preparing UV-cured composites is the filler transparency towards UV-light. Otherwise it will be a competition of the
A faster, more accurate way of characterizing cube beamsplitters using the Agilent Cary 7000 Universal Measurement Spectrophotometer (UMS)
") A faster, more accurate way of characterizing cube beamsplitters using the Agilent Cary 7000 Universal Measurement Spectrophotometer (UMS) Application note Materials Authors Travis Burt, Chris Colley,
A faster, more accurate way of characterizing cube beamsplitters using the Agilent Cary 7000 Universal Measurement Spectrophotometer (UMS) Application note Materials Authors Travis Burt, Chris Colley,
Photoinitiators. For cationic UV curing processes.
 Photoinitiators For cationic UV curing processes. / Cationic Photoinitiators from Deuteron: Benzene-free, low odour, rapid curing speed. The cationic photo-initiated polymerisation of epoxides and oxetanes
Extensive Dark Cure from Controlled Polymerization Based on a Method Using Visible-Light Activated Initiator System
 Extensive Dark Cure from Controlled Polymerization Based on a Method Using Visible-Light Activated Initiator System Dongkwan Kim, and Jeffrey W. Stansbury University of Colorado-Denver, School of Dental
Lightly cured. Seite/Page: 22
 Lightly cured UV powder coatings based on unsaturated allylic polyesters. Dominique Burget, Mircea Manea, Stavros Apostolatos, Carole Mallein, Francoise Mauguiere-Guyonnet. Allylic-terminated unsaturated
RoHS. Specification CUD8DF1A. Drawn Approval Approval. 서식 Rev: 00
 Specification RoHS CUD8DF1A SVC Customer Drawn Approval Approval 1 [ Contents ] 1. Description 2. Outline dimensions 3. Characteristics of CUD8DF1A 4. Characteristic diagrams 5. Binning & Labeling 6. Reel
applied as UV protective films
 Nanocomposite gels via in-situ photoinitiation and disassembly of TiO 2 -Clay composites with polymers applied as UV protective films Chuanan Liao, Qing Wu, Teng Su, Da Zhang, Qingsheng Wu and Qigang Wang*
Preview from Notesale.co.uk Page 1 of 38
 F UNDAMENTALS OF PHOTONICS Module 1.1 Nature and Properties of Light Linda J. Vandergriff Director of Photonics System Engineering Science Applications International Corporation McLean, Virginia Light
Mechanistic Kinetic Modeling of Thiol Michael Addition Photopolymerizations via Photocaged Superbase Generators: An Analytical Approach
 Supporting Information Mechanistic Kinetic Modeling of Thiol Michael Addition Photopolymerizations via Photocaged Superbase Generators: An Analytical Approach Mauro Claudino a, Xinpeng Zhang a, Marvin
Curing Properties of Cycloaliphatic Epoxy Derivatives
 Curing Properties of Cycloaliphatic Epoxy Derivatives Hiroshi Sasaki Toagosei Co. Ltd. Nagoya, Japan Introduction UV-cationic-curing, based on the photo-generation of acid and consecutive cationic polymerization,
SURFACE MODIFICATION OF POLYPROPYLENE BY PHOTOGRAFTING OF VINYL ACETATE MONOMERS
 Bulletin of the Transilvania University of Braşov Series I: Engineering Sciences Vol. 4 (53) No. 1-2011 SURFACE MODIFICATION OF POLYPROPYLENE BY PHOTOGRAFTING OF VINYL ACETATE MONOMERS J. BALART 1 J.M.
Standard Glossary of Packaging Inks and Coatings Terms
 Standard Glossary of Packaging Inks and Coatings Terms 1 Acrylic binder Additive Basecoat Binder/ Vehicle Non-reactive Styrene-acrylate-copolymers or pure acrylate polymers as a resin solution in water
Thermal and UV-curing Behavior of Inks, Adhesives, and Coatings by Photo-, In-situ DEA and DMA.
 Thermal and UV-curing Behavior of Inks, Adhesives, and Coatings by Photo-, In-situ DEA and DMA. Dr. Gilles Widawski, Netzsch Instruments North America, Burlington, MA, USA Dr. Stephan Knappe, NETZSCH-Gerätebau
Analyzing & Testing. Photocalorimetry Photo-DSC. Method, Technique, Applications. Photo-DSC 204 F1. Leading Thermal Analysis
 Analyzing & Testing Photocalorimetry Photo-DSC Method, Technique, Applications Photo-DSC 204 F1 Leading Thermal Analysis Photo-DSC 204 F1 Phoenix Method and Technique Advantages of Photocalorimetry Besides
Compact Knowledge: Absorbance Spectrophotometry. Flexible. Reliable. Personal.
 L A B O R A T O R Y C O M P E T E N C E Compact Knowledge: Absorbance Spectrophotometry Flexible. Reliable. Personal. The interaction of light with molecules is an essential and well accepted technique
Introduction to the Basics of UV/EB Chemistry and Formulations
 Introduction to the Basics of UV/EB Chemistry and Formulations SUNY ESF Radiation Curing Program RadTech NA Dr. Mike J. Idacavage Colorado Photopolymer Solutions September 9, 2015 Agenda Introduction to
Electrical connection network within an electrically conductive adhesive
 Electrical connection network within an electrically conductive adhesive D.Busek, P. Mach Department of Electrotechnology, Faculty of Electrical Engineering Technická 2, 166 27 Prague, Czech Republic,
Chapter 13 An Introduction to Ultraviolet/Visible Molecular Absorption Spectrometry
 Chapter 13 An Introduction to Ultraviolet/Visible Molecular Absorption Spectrometry 13A Measurement Of Transmittance and Absorbance Absorption measurements based upon ultraviolet and visible radiation
Supporting Information:
 Supporting Information: Visible Light Initiated Thiol-Michael Addition Polymerizations with Coumarin-based Photo-base Generators, Another Photoclick Reaction Strategy Xinpeng Zhang, Weixian Xi, Chen Wang,
International Journal of Modern Trends in Engineering and Research e-issn No.: , Date: April, 2016
 International Journal of Modern Trends in Engineering and Research www.ijmter.com e-issn No.:2349-9745, Date: 28-30 April, 2016 Improving Stereolithography resolution Yogesh D. Patil 1, Richa A. Patil
Photopolymerization and Physical Properties of Thiol-Vinyl Ether Hybrid
 Photopolymerization and Physical Properties of Thiol-Vinyl Ether Hybrid Huanyu Wei Qin Li Moriam jelade Samy Madbouly Joshua U. taigbe Charles E. Hoyle * School of Polymers and High Performance Materials
RoHS. Specification CUD8AF1C. 서식 Rev: 00
 Specification RoHS CUD8AF1C 1 [ Contents ] 1. Description 2. Outline dimensions 3. Characteristics of CUD8AF1C 4. Characteristic diagrams 5. Binning & Labeling 6. Reel packing 7. Recommended solder pad
Determining cure profile and post-cure shrinkage of photopolymers using UV accessory on a rotational rheometer
 Determining cure profile and post-cure shrinkage of photopolymers using UV accessory on a rotational rheometer RHEOLOGY AND VISCOSITY Introduction A photopolymer usually consists of monomers, oligomers
Supplementary Figure 1 Detailed illustration on the fabrication process of templatestripped
 Supplementary Figure 1 Detailed illustration on the fabrication process of templatestripped gold substrate. (a) Spin coating of hydrogen silsesquioxane (HSQ) resist onto the silicon substrate with a thickness
Introduction. Photoresist : Type: Structure:
 Photoresist SEM images of the morphologies of meso structures and nanopatterns on (a) a positively nanopatterned silicon mold, and (b) a negatively nanopatterned silicon mold. Introduction Photoresist
DEVELOPMENT OF NON-SOLVENT-TYPE ACRYLIC PSA WITH UV
 DEVELOPMENT OF NON-SOLVENT-TYPE ACRYLIC PSA WITH UV IRRADIATION POLYMERIZATION Mitsuhiko Nakazawa, Researcher, Soken Chemical & Engineering Co.,Ltd., Japan Takayuki Shimada, Researcher, Soken Chemical
Monitoring the Aggregation of Particles through Raman Spectroscopy
 Monitoring the Aggregation of Particles through Raman Spectroscopy Name: Yanxiao Ma Advisor: Dr. Andrew Callender Submission Date: 19 Oct. 2012 Introduction Raman spectroscopy is a spectroscopic technique
Structured illumination as a processing method for controlling photopolymerized coating characteristics
 University of Iowa Iowa Research Online Theses and Dissertations 2007 Structured illumination as a processing method for controlling photopolymerized coating characteristics Peter Daniel Ganahl University
Reference literature. (See: CHEM 2470 notes, Module 8 Textbook 6th ed., Chapters )
") September 17, 2018 Reference literature (See: CHEM 2470 notes, Module 8 Textbook 6th ed., Chapters 13-14 ) Reference.: https://slideplayer.com/slide/8354408/ Spectroscopy Usual Wavelength Type of Quantum
September 17, 2018 Reference literature (See: CHEM 2470 notes, Module 8 Textbook 6th ed., Chapters 13-14 ) Reference.: https://slideplayer.com/slide/8354408/ Spectroscopy Usual Wavelength Type of Quantum
Spectroscopy. Page 1 of 8 L.Pillay (2012)
") Spectroscopy Electromagnetic radiation is widely used in analytical chemistry. The identification and quantification of samples using electromagnetic radiation (light) is called spectroscopy. Light has
Spectroscopy Electromagnetic radiation is widely used in analytical chemistry. The identification and quantification of samples using electromagnetic radiation (light) is called spectroscopy. Light has
Marine bio-inspired underwater contact adhesion
 Marine bio-inspired underwater contact adhesion Sean K. Clancy, Antonio Sodano, Dylan J. Cunningham, Sharon S. Huang, Piotr J. Zalicki, Seunghan Shin, * and B. Kollbe Ahn * Marine Science Institute, University
Introduction to Photolithography
 http://www.ichaus.de/news/72 Introduction to Photolithography Photolithography The following slides present an outline of the process by which integrated circuits are made, of which photolithography is
Lab 11: Must what goes in be the same as what comes out? Spectroscopy & Fluorescence in Chlorophyll.
 Lab 11: Must what goes in be the same as what comes out? Spectroscopy & Fluorescence in Chlorophyll. Introduction to Fluorescence: Fluorescence is one of the possible mechanisms for emission of light by
PHOTOPOLYMERIZATION REACTION RATES BY REFLECTANCE REAL TIME INFRARED SPECTROSCOPY: APPLICATION TO STEREOLITHOGRAPHY RESINS
 PHOTOPOLYMERIZATION REACTION RATES BY REFLECTANCE REAL TIME INFRARED SPECTROSCOPY: APPLICATION TO STEREOLITHOGRAPHY RESINS By: Richard P. Chartoff and JinDu University of Dayton Rapid Prototype Development
Particle Size Determination with Dynamic Light Scattering DLS
 Particle Size Determination with Dynamic Light Scattering DLS Applications with the Nano Particle Sizer ANALYSETTE 12 DynaSizer The new ANALYSETTE 12 DynaSizer uses the dynamic light scattering as a measuring
Chemistry Instrumental Analysis Lecture 15. Chem 4631
 Chemistry 4631 Instrumental Analysis Lecture 15 IR Instruments Types of Instrumentation Dispersive Spectrophotometers (gratings) Fourier transform spectrometers (interferometer) Single beam Double beam
Characterization of High-Performance Adhesives and Coatings by Photorheometry
 Characterization of High-Performance Adhesives and Coatings by Photorheometry Joel D. Schall and John G. Woods Henkel Corporation Rocky Hill, CT USA Introduction Photorheometry allows one to monitor typical
Novel Polymeric Photoinitiator and Sensitizer
 ovel Polymeric Photoinitiator and Sensitizer Dr. Qingjin YA a, Wenchao ZHA a, Shidian HA a, John HUIBERTS b (a: Insight High Technology Co., Ltd. Beijing P.R.China; b: IGM Resins B.V., the etherlands)
Supporting Information s for
 Supporting Information s for # Self-assembling of DNA-templated Au Nanoparticles into Nanowires and their enhanced SERS and Catalytic Applications Subrata Kundu* and M. Jayachandran Electrochemical Materials
2001 Spectrometers. Instrument Machinery. Movies from this presentation can be access at
 2001 Spectrometers Instrument Machinery Movies from this presentation can be access at http://www.shsu.edu/~chm_tgc/sounds/sound.html Chp20: 1 Optical Instruments Instrument Components Components of various
Widely tunable photonic bandgap and lasing emission in enantiomorphic cholesteric liquid crystal templates
 Electronic Supplementary Material (ESI) for Journal of Materials Chemistry C. This journal is The Royal Society of Chemistry 2017 Widely tunable photonic bandgap and lasing emission in enantiomorphic cholesteric
The investigation of the photokinetics of a platinum organoamine complex using the Cary 50/60
 The investigation of the photokinetics of a platinum organoamine complex using the Cary 50/60 Application Note Chemical Author Jeffrey J. Comerford, PhD. Agilent Technologies, Inc. Mulgrave, Victoria 3170,
VALLIAMMAI ENGINEERING COLLEGE SRM Nagar, Kattankulathur
 VALLIAMMAI ENGINEERING COLLEGE SRM Nagar, Kattankulathur 603 203 DEPARTMENT OF ELECTRONICS AND INSTRUMENTATION ENGINEERING QUESTION BANK V SEMESTER EI6501 Analytical Instruments Regulation 2013 Academic
Monitoring Emulsion Polymerization by Raman Spectroscopy
 An Executive Summary Monitoring Emulsion Polymerization by Raman Spectroscopy Why process analytical matters to process development R&D. Serena Stephenson, PhD Senior R&D Analytical Manager Kishori Deshpande,
The solution for all of your
 The solution for all of your nanoparticle sizing and zeta potential needs. DelsaNano Series Blood Banking Capillary Electrophoresis Cell Analysis Centrifugation Genomics Lab Automation Lab Tools Particle
The metallisation onto non conductive surfaces using chlorophyll: where nature meets electronics
 The metallisation onto non conductive surfaces using chlorophyll: where nature meets electronics Prof. Marc Desmulliez Heriot-Watt University, Edinburgh Scotland, United Kingdom m.desmulliez@hw.ac.uk Outline
Supporting Information for
 Electronic Supplementary Material (ESI) for ChemComm. This journal is The Royal Society of Chemistry 2015 Supporting Information for In-situ Production of Visible Light Absorbing Ti-based Nanoparticles
3 - Atomic Absorption Spectroscopy
 3 - Atomic Absorption Spectroscopy Introduction Atomic-absorption (AA) spectroscopy uses the absorption of light to measure the concentration of gas-phase atoms. Since samples are usually liquids or solids,
Novel Photochemical/Thermal Dual-Cure initiating system for cationic polymerization of thick materials
 Novel Photochemical/Thermal Dual-Cure initiating system for cationic polymerization of thick materials M. LECMPEE (1,2), X. ALLNAS* (1), D. MAECHAL (2), A. CIQUI (2) (1) Laboratory of Macromolecular Photochemistry
THE MEASUREMENT OF SOLAR ULTRAVIOLET SPECTRAL IRRADIANCE PROBLEMS & SOLUTIONS
 THE MEASUREMENT OF SOLAR ULTRAVIOLET SPECTRAL IRRADIANCE PROBLEMS & SOLUTIONS INTRODUCTION In recent years, researchers involved in many unrelated scientific disciplines have acquired an interest in accurately
Lecture 8. Photoresists and Non-optical Lithography
 Lecture 8 Photoresists and Non-optical Lithography Reading: Chapters 8 and 9 and notes derived from a HIGHLY recommended book by Chris Mack, Fundamental Principles of Optical Lithography. Any serious student
CHAPTER 7 SUMMARY OF THE PRESENT WORK AND SUGGESTIONS FOR FUTURE WORK
 161 CHAPTER 7 SUMMARY OF THE PRESENT WORK AND SUGGESTIONS FOR FUTURE WORK 7.1 SUMMARY OF THE PRESENT WORK Nonlinear optical materials are required in a wide range of important applications, such as optical
Handheld FTIR spectroscopy applications using the Agilent ExoScan 4100 FTIR with diffuse sample interface
 Handheld FTIR spectroscopy applications using the Agilent ExoScan 4100 FTIR with diffuse sample interface Onsite, non-destructive analysis for geological, fabric, paint and plastic applications Application
Monitoring the Kinetics of UV Curing Using In Situ Rheology and Real-Time Fourier Transform Infrared Spectroscopy
 IS&T s 50th Annual Conference Monitoring the Kinetics of UV Curing Using In Situ Rheology and Real-Time Fourier Transform Infrared Spectroscopy Bor-Sen Chiou and Saad A. Khan Dept. of Chemical Engineering,
Cationic UV Curing Speeding up reactivity 15x with Curalite
 Cationic UV Curing Speeding up reactivity 15x with Curalite European Coatings Show, April 5 th 2017 Presented by David Engberg Introduction Background MSc. In Chemical Engineering at the Faculty of Engineering
Instrumental Technique: Cuvette. Md Rabiul Islam
 Instrumental Technique: Cuvette Md Rabiul Islam 16-7-2016 What is cuvette? A cuvette is a small tube of circular or square cross section, sealed at one end, made of plastic, glass, or fused quartz (for
A Humidity Blocker Approach to Overcoming the Humidity Interference with Cationic Photopolymerization
 A Humidity Blocker Approach to vercoming the Humidity Interference with Cationic Photopolymerization Zhigang Chen, Ying Zhang, Bret. J. Chisholm, Dean C. Webster Department of Coatings and Polymeric Materials
Supplementary Figures
 Supplementary Figures I n t e g r a l 2. 0 1 3 9 2. 0 4 1 5 0. 0 4 4 2 1. 0 0 0 0 1. 0 0 3 2 4. 1 0 0 6 2. 9 8 6 5 1 0. 1 9 4 8. 5 8. 0 7. 5 7. 0 6. 5 6. 0 5. 5 5. 0 4. 5 4. 0 ( p p m ) 3. 5 3. 0 2. 5
Design and Development of a Smartphone Based Visible Spectrophotometer for Analytical Applications
 Design and Development of a Smartphone Based Visible Spectrophotometer for Analytical Applications Bedanta Kr. Deka, D. Thakuria, H. Bora and S. Banerjee # Department of Physicis, B. Borooah College, Ulubari,
Supplementary Information
 Supplementary Information Experimental Section Hybrid Nanoparticle Synthesis The hafnium nanoparticles surface-modified with methacrylic acid (MAA, Sigma Aldrich, 99%), trans 2, 3-dimethylacrylic acid
Supporting Information
 Supporting Information Controlled Radical Polymerization and Quantification of Solid State Electrical Conductivities of Macromolecules Bearing Pendant Stable Radical Groups Lizbeth Rostro, Aditya G. Baradwaj,
Sylanto Cationic Photoinitiators
 Sylanto Cationic Photoinitiators for UV Curing Sylanto Cationic Photoinitiators for UV Curing Photoinitiators are chemical compounds which disintegrate upon exposure to UV light, acting as so-called active
Figure 4.10 HPLC Chromatogram of the Carbazole-Phenoxy Based Methacrylate
 The percent yield of the methacrylation was 85.2 %, with a purity of 98.2 % determined by HPLC (Figure 4.10). Elemental analysis gave excellent agreement to expected elemental ratios (Table 4.2). Disregarding
Efficient charge storage in photoexcited TiO 2 nanorod-noble metal nanoparticle composite systems
 Electronic Supplementary Information Efficient charge storage in photoexcited TiO 2 nanorod-noble metal nanoparticle composite systems P. D. Cozzoli, M. L. Curri, and A. Agostiano 1. Synthesis of TiO 2
SUPPORTING INFORMATION
 SUPPORTING INFORMATION Rapid, puncture-initiated healing via oxygen-mediated polymerization Scott R. Zavada, Nicholas R. McHardy, Keith L. Gordon, and Timothy F. Scott* Experimental Section Materials:
LAB #1: ABSORPTION SPECTRA OF CONJUGATED DYES
 Chemistry 7 Gustavus Adolphus College LAB #1: ABSORPTIO SPECTRA OF COJUGATED DYES Abstract Ultraviolet-visible spectroscopy is used to explore the electronic structure of several conjugated polyene dyes,
EMISSION SPECTROSCOPY
 IFM The Department of Physics, Chemistry and Biology LAB 57 EMISSION SPECTROSCOPY NAME PERSONAL NUMBER DATE APPROVED I. OBJECTIVES - Understand the principle of atomic emission spectra. - Know how to acquire
Effect of ultraviolet and x-ray radiation on optical properties of epoxy polymers dyed with organic phosphors
 Effect of ultraviolet and x-ray radiation on optical properties of epoxy polymers dyed with organic phosphors V CH Laurinas 1, S S Kasymov 1, V M Yurov 1, E N Eremin 2 and M V Vedyashkin 3 1 E.A. Buketov
Infrared Spectroscopy as a Tool to Monitor Radiation Curing
 16 Infrared Spectroscopy as a Tool to Monitor Radiation Curing Marco Sangermano 1, Patrick Meier 2 and Spiros Tzavalas 2,* 1 Politecnico di Torino 2 ABB Corporate Research 1 Italy 2 Switzerland 1. Introduction
Polymer Systems and Film Formation Mechanisms in High Solids, Powder, and UV Cure Systems
 Polymer Systems and Film Formation Mechanisms in High Solids, Powder, and UV Cure Systems J. Baghdachi, Ph.D. Coatings Research Institute Eastern Michigan University (734) 487-3192 Freshpaint@aol.com jamil.baghdachi@emich.edu
Water Hardness and Softening (Bring a water sample from home) Minneapolis Community and Technical College Principles of Chemistry II, C1152 v.2.
 Minneapolis Community and Technical College Principles of Chemistry II, C1152 v.2.") Water Hardness and Softening (Bring a water sample from home) Minneapolis Community and Technical College Principles of Chemistry II, C1152 v.2.16 I. Introduction Hard Water and Water Softening Water that
Water Hardness and Softening (Bring a water sample from home) Minneapolis Community and Technical College Principles of Chemistry II, C1152 v.2.16 I. Introduction Hard Water and Water Softening Water that
The DialPath Solution an Easier Way to Analyze Liquids By FTIR. Yanqia Wang, Ph.D. Application Engineer - FTIR Agilent Technologies May 7, 2015
 The DialPath Solution an Easier Way to Analyze Liquids By FTIR Yanqia Wang, Ph.D. Application Engineer - FTIR Agilent Technologies May 7, 2015 Outline Background of FTIR Transmission Technology Traditional
CHARACTERIZATION OF SHRINKAGE AND STRESSES IN LARGE AREA MASKLESS PHOTOPOLYMERIZATION
 CHARACTERIZATION OF SHRINKAGE AND STRESSES IN LARGE AREA MASKLESS PHOTOPOLYMERIZATION Kiran Kambly, Dajun Yuan, Peng Shao, Suman Das* Woodruff School of Mechanical Engineering, Georgia Institute of Technology,
Cork Institute of Technology. Summer 2005 Instrumental Analysis (Time: 3 Hours) Section A
 Section A") Cork Institute of Technology Higher Certificate in Science in Applied Biology Award (National Certificate in Science in Applied Biology Award) Answer FIVE questions; answer Section A, TWO questions from
Cork Institute of Technology Higher Certificate in Science in Applied Biology Award (National Certificate in Science in Applied Biology Award) Answer FIVE questions; answer Section A, TWO questions from
OXYGEN INHIBITION AND COATING THICKNESS EFFECTS ON UV RADIATION CURING OF WEATHERFAST CLEARCOATS STUDIED BY PHOTO-DSC
 Journal of Thermal Analysis and Calorimetry, Vol. 75 (2004) 507 512 OXYGEN INHIBITION AND COATING THICKNESS EFFECTS ON UV RADIATION CURING OF WEATHERFAST CLEARCOATS STUDIED BY PHOTO-DSC Carmen Silvia Bentivoglio
GENERAL PHARMACOPOEIA MONOGRAPH
 MINISTRY OF HEALTH OF THE RUSSIAN FEDERATION GENERAL PHARMACOPOEIA MONOGRAPH Spectrophotometry in the ultraviolet GPM.1.2.1.1.0003.15 and visible spectral regions Replaces the SPRF X GPM, SPRF XI GPM,
Measuring Lysozyme Monomer at 0.1 mg/ml Concentration. Equipment used : Sample Preparation and Measurement :
 Application Report #001 Measuring Lysozyme Monomer at 0.1 mg/ml Concentration Equipment used : ALV-NIBS / HPPS High Sensitivity Version, Lysozyme (MERCK), 0.1 molar Sodium-Acetate buffer (ph 4.25), syringe
Australian Journal of Basic and Applied Sciences. Characteristic of Photocurable Organic/Inorganic Hybrids Utilizing Acid Proliferation Reactions
 AENSI Journals Australian Journal of asic and Applied Sciences ISSN:1991-8178 Journal home page: www.ajbasweb.com Characteristic of Photocurable Organic/Inorganic Hybrids Utilizing Acid Proliferation Reactions
Chemistry 524--Final Exam--Keiderling May 4, :30 -?? pm SES
 Chemistry 524--Final Exam--Keiderling May 4, 2011 3:30 -?? pm -- 4286 SES Please answer all questions in the answer book provided. Calculators, rulers, pens and pencils are permitted. No open books or
Innovative. Technologies. Chemie des Klebens Chemistry of Adhesives. Dr. Jochen Stock, Laboratory Manager CRL Germany: Neuss, November 27 th, 2013
 Chemie des Klebens Chemistry of Adhesives Dr. Jochen Stock, Laboratory Manager CRL Germany: Neuss, November 27 th, 2013 Innovative Technologies 1 Overview Chemie des Klebens Chemistry of Adhesives Introduction
Compositional gradients in photopolymer films utilizing kinetic driving forces
 University of Iowa Iowa Research Online Theses and Dissertations Summer 2014 Compositional gradients in photopolymer films utilizing kinetic driving forces Clinton John Cook University of Iowa Copyright
PROCESS CONTROL BASIS FOR A COST-EFFECTIVE SELECTIVE SOLDERING PROCESS
 PROCESS CONTROL BASIS FOR A COST-EFFECTIVE SELECTIVE SOLDERING PROCESS Christian Ott Kreuzwertheim, Germany christian.ott@seho.de Heike Schlessmann heike.schlessmann@seho.de Reiner Zoch reiner.zoch@seho.de
Analysis of Polymers and Plastics. Innovation with Integrity. Quality Control & Failure Analysis FTIR
 Analysis of Polymers and Plastics Quality Control & Failure Analysis Innovation with Integrity FTIR Quality Control for Cost-Efficiency Plastics are used in countless products such as automotive parts,
The Spectroscopy of Stars
 The Spectroscopy of Stars In this activity you will use a hand held spectroscope to investigate a number of known and unknown light sources. A spectroscope is an instrument that helps to observe the spectrum
Ultrasonic Anisotropic Conductive Films (ACFs) Bonding of Flexible Substrates on Organic Rigid Boards at Room Temperature
 Bonding of Flexible Substrates on Organic Rigid Boards at Room Temperature") Ultrasonic Anisotropic Conductive Films (ACFs) Bonding of Flexible Substrates on Organic Rigid Boards at Room Temperature Kiwon Lee, Hyoung Joon Kim, Il Kim, and Kyung Wook Paik Nano Packaging and Interconnect
Ultrasonic Anisotropic Conductive Films (ACFs) Bonding of Flexible Substrates on Organic Rigid Boards at Room Temperature Kiwon Lee, Hyoung Joon Kim, Il Kim, and Kyung Wook Paik Nano Packaging and Interconnect